Abstract
Even though they initially appeared as a method of using waste from other production processes, tailored welded blanks (TWB) presented several advantages by combining materials with different characteristics. On the one hand, this study focuses on minimizing the adverse effects caused by the springback of TWB parts. The proposed method is based on the Taguchi technique using orthogonal type 23 networks. On the other hand, genetic algorithms were applied to obtain maximum performance parameters within the dynamic loadings of tubular structures made of TWB by advantageous positioning of the weld line. The obtained data were compared and evaluated through software platforms such as MATLAB, Design Expert, and Dynaform, and experimental validation. By generating an objective function, the construction of thin-walled tubular structures can be controlled for a predetermined deformation and maximum energy absorption. The data obtained has an error rate of less than 3%, thus considering that this method can be used successfully in the qualitative and quantitative estimation of dynamically loaded TWB tubular structures.
1. Introduction
In the global context in which it is mandatory to reduce the use of resources in all areas of activity, the auto industry is strongly influenced by the decisions taken at the design level of the various resistance structures. For weight and cost reduction of parts, the use of assemblies made of tailor-welded blanks—from now on referred to as TWB—is a technology implemented in both car manufacturing and aerospace industries. Research shows that weight reduction of the vehicle by just 1% leads to a fuel consumption decrease by 0.6–1% [1]. In the case of weight and cost reduction aluminium, magnesium, or composite materials are used, but they do not show the flexibility and elasticity offered by steel [2]. An opportunity promising to satisfy these requirements is represented by using TWB parts.
TWBs initially appeared as a method of using waste resulting from other production processes. This way, the evident benefits of combining different material thicknesses, different grades, or protective coating were available. Joining different metal sheets is often used in the car industry because it reduces manufacturing costs, improves the resistance of new structures, and decreases total weight [3].
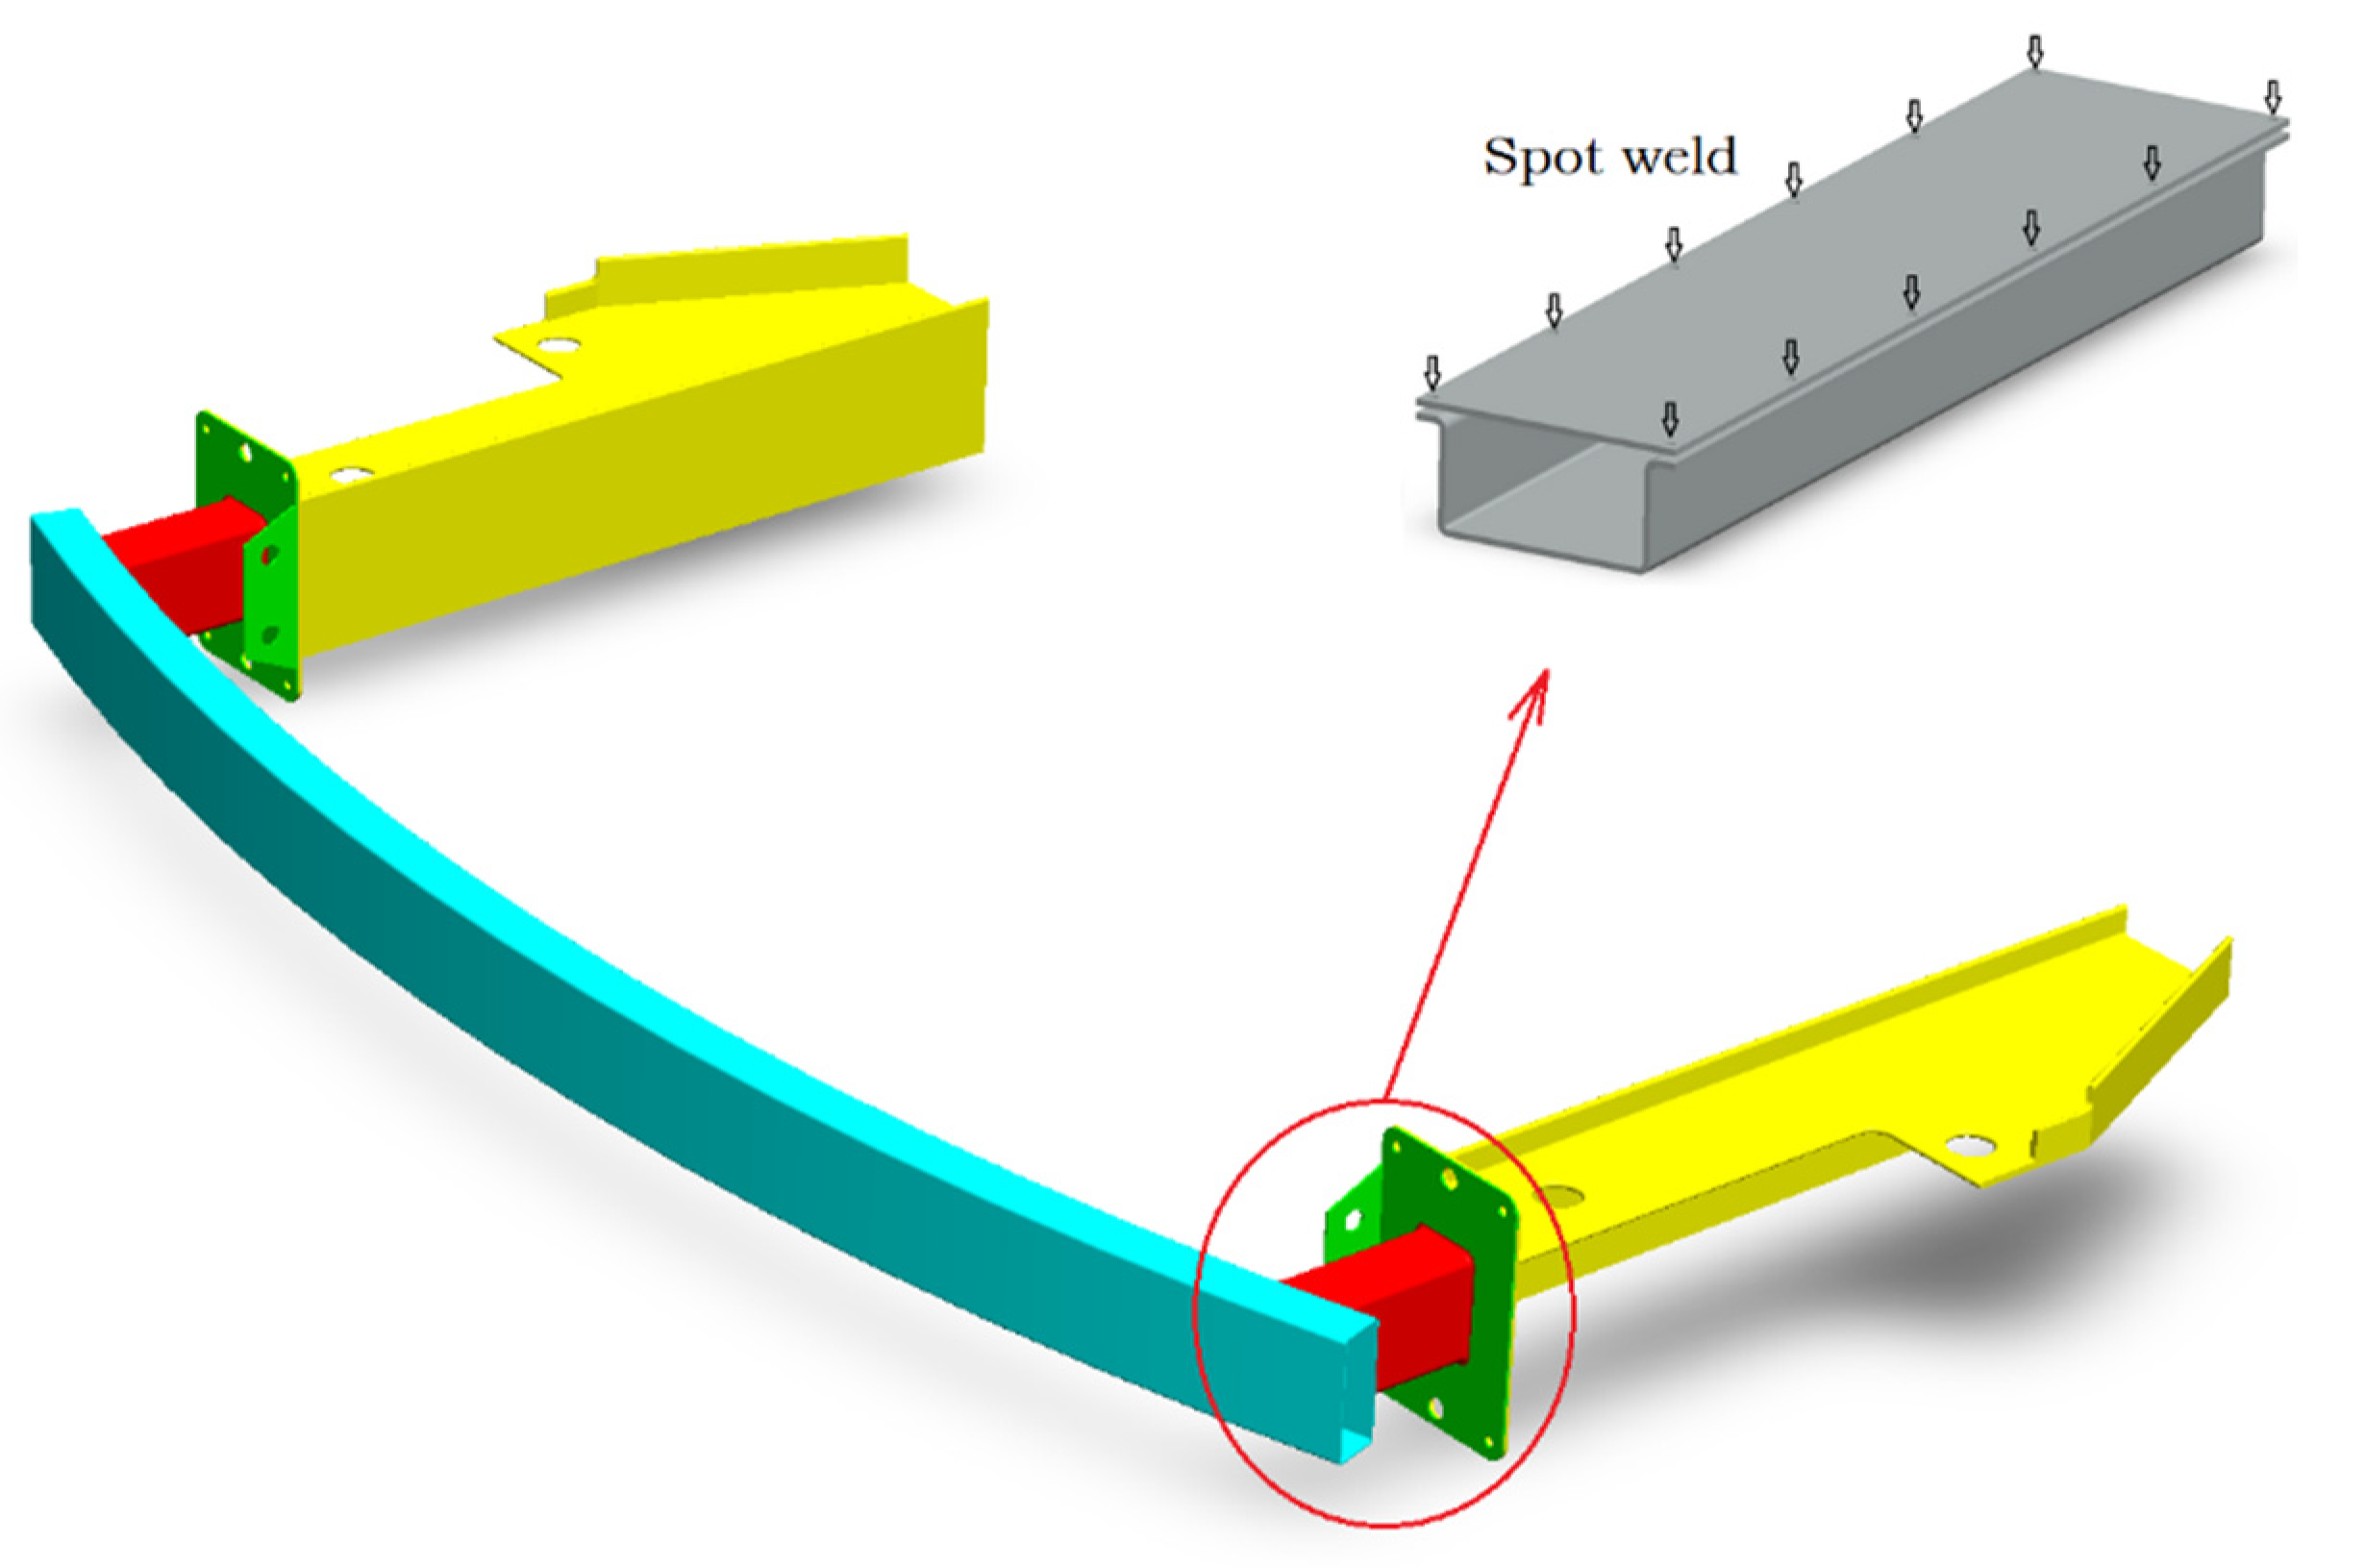
TWB semi-finished parts are used to make the following components: front and rear door interior, longitudinal brackets, engine support brackets, stiffening structures, bottom panels, and crash boxes as shown in Figure 1. TWBs are also used for applications such as uprights (A, B, and C) and side members [4].

Figure 1.
Usual crash box construction in the auto manufacturing industry.
TWBs are widely used in the production of household goods, packaging, or construction. Generally, any product that requires different properties of the material in different areas can be made of TWB.
Metal assemblies made of TWBs are also used in the production of tubular elements (rectangular, elliptical, or conical) within the resistance structure of motor vehicles. Figure 1 shows such an element integrated into a car’s structural subassembly, designed to absorb the energy developed in case of impact.
In real applications, such a system for absorbing impact energy can be made of thin-walled tubular structures, such as rectangular crash boxes. They are widespread in the automotive industry, meeting the objectives of impact behaviour quite well, protecting both the occupants of the vehicle and the structure itself [5].
Generally, the study of the vehicle involved in a collision is made considering some of the following aspects: the ability of the vehicle to avoid the accident (primary safety), its dynamics during and after the impact, the movement of occupants, and most importantly, the behaviour of deformed structures [6]. The impact force response and the energy absorption capacity are two parameters directly influenced by the deformation mode, the relative deformation, and the inertia effects.
A very difficult problem to solve is the accurate estimation of springback in the case of TWB. In this case, the weld line and the two materials with different properties or thicknesses are involved. Moreover, there is a thermally affected area for each material, which often has different properties from the base material [7], and therefore five materials are involved in springback estimation.
The mechanical behaviour of the thermally influenced area is quite difficult to characterize mathematically by a springback estimation analytical model. Implementing the thermally affected area in the finite element analysis negatively influences the springback corresponding to TWB composed of different steel grades [8,9]. This effect is caused by the fact that the thermally affected area has a higher modulus of elasticity. A high value of the modulus of elasticity and the yield strength has opposite effects on the springback [10,11,12].
In the case of TWB made of different steels, simulations showed that thickness reduction of the metal sheets and increase of the forming punch radius led to a rise in the springback intensity [13]. In this case, the presence of the weld line does not significantly affect the springback of TWB made of different steels.
Concerning the orientation of the weld line, data showed that the springback of longitudinally welded samples is similar to that of specimens made of homogeneous materials [14,15], unlike cross-welded samples where springback decreased by about 44% in the thinner material area. The springback for thicker material is similar to one of the samples made of homogeneous material. In the case of simulation studies for cross-welded samples, there was no reduction in springback for thinner material, which is explained by the probability that the analytical models used in the simulations neglected the change of the material’s properties in the thermally affected area [16].
On the one hand, this study focuses on minimizing the adverse effects caused by the springback of TWB parts. The proposed method is based on the Taguchi technique using 23 orthogonal type networks. To do this, the forming of limit curves is needed. On the other hand, genetic algorithms are applied to obtain maximum performance parameters within the dynamic loadings of TWB thin-walled tubular structures by advantageous positioning of the weld line.
2. Materials and Methods
To determine the mechanical and formability properties corresponding to TWB, samples made by laser welding of two grades of steel sheets were used, as follows: FEPO steel, from now on referred to as steel 1, and E220 steel, from now on referred to as steel 2. Table 1 presents the chemical composition of these steel sheets.

Table 1.
Chemical composition of the two types of steel sheets.
Steel 1 is 0.75 mm thick and has a zinc/nickel protective coating on both sides of 4.2 μm thickness, and steel 2 is 0.7 mm thick and has no protective coating.
These cold-rolled steel sheets were joined by laser welding. Table 2 presents the dimensional characteristics of the weld line, measured by using a METKON-IMM-901 metallographic microscope (Metkon Instruments Inc., Bursa, Turkey).
Table 2.
Dimensional characteristics of welded sheet.
After the tensile tests were performed and actual stress/strain curves were analysed, the average general mechanical properties were determined. These data are presented in Figure 2 and Table 3.
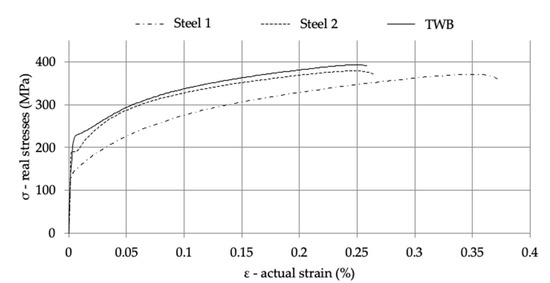
Figure 2.
Average stress/strain curves for both steel sheets and TWB.
Table 3.
Mechanical properties of materials used in the study.
3. Results
3.1. Forming Limit Curves
The forming limit curves determined in the experimental tests were based on the modified Marciniak test. The displacement was determined by image analysis (stochastic network) [17,18].
The capture speed for the camera type used in the analysis (PROSILICA CV 1280, Allied Vision Technologies Canada Inc., Burnaby, Canada) was 30 images/s. Based on the comparison between the first captured image and each of the following images, the position of one or more points (in a user-specified area) was determined.
This data was processed by applying the Ludwik law of plasticity, which is, in fact, the amended Hollomon law. This model is often used to analyse plastic deformations of metallic materials and TWB. The model also characterizes the elastic-plastic behaviour by considering the hardening phenomenon (Equation (1)).
where: and are the equivalent stress and strain, K and n are the strength and hardening coefficients, respectively. The constitutive relation, which additionally includes the strain hardening rate, the Cowper-Symonds parameters [19], is of the well-known form (Equation (2)):
where: is the strain rate, C and P are the Cowper-Symonds parameters of strain rate, K is the coefficient of resistance, εe elastic strain, εpef is the real plastic strain, and n is the hardening coefficient.
In this model, the stress/strain ratio is expressed only in the conditions of a single temperature. Other data needed to calculate and obtain the forming limit curves are material density—ρ, modulus of elasticity—E, and Poisson’s ratio—ν, respectively.
After the measurement of the displacements, the following results were obtained:

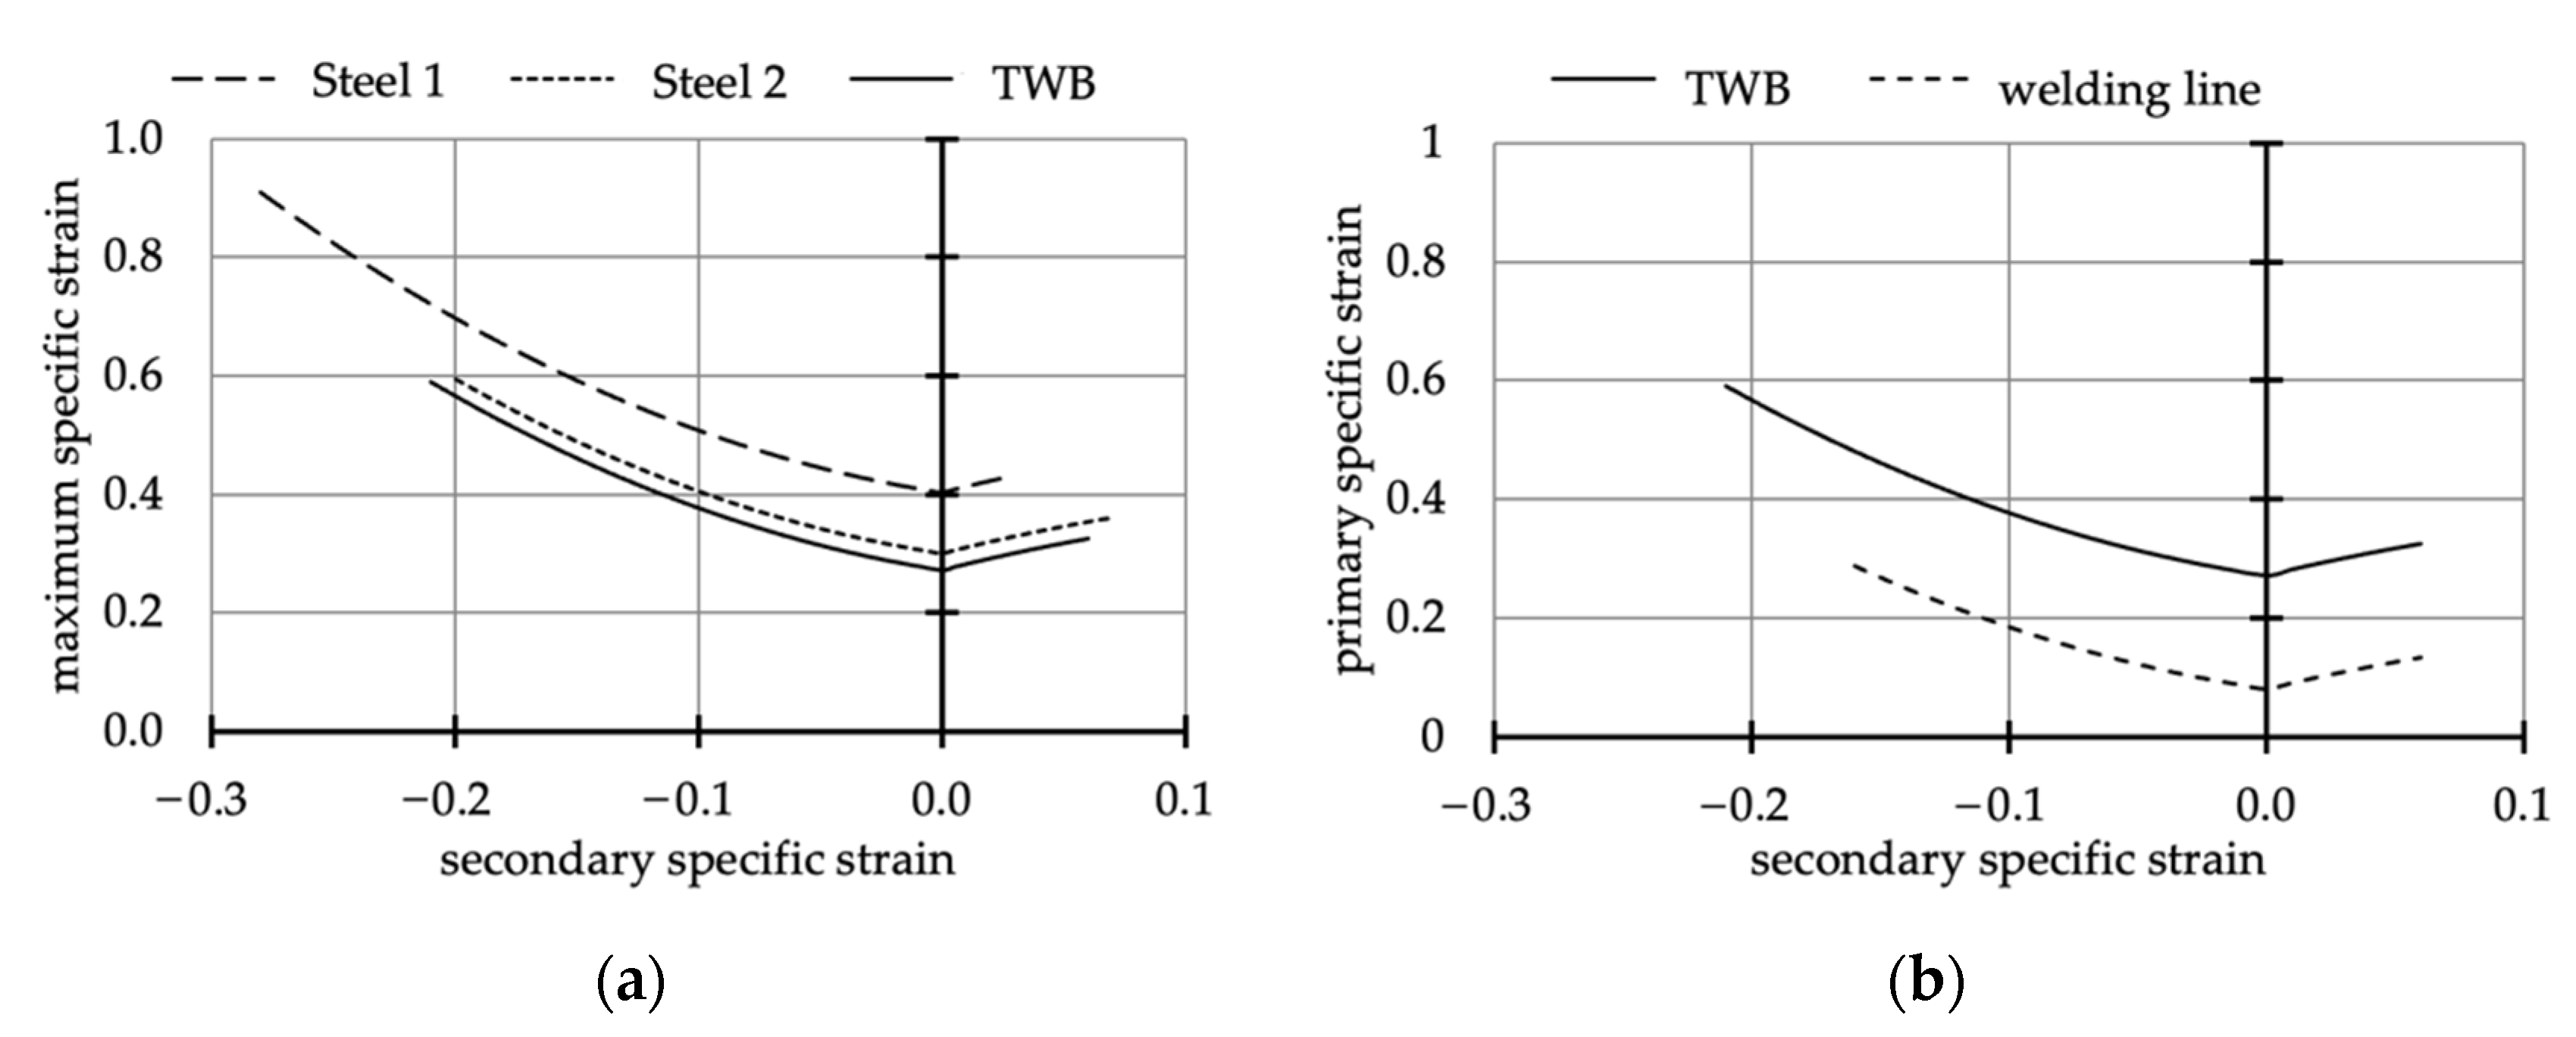
As presented in Figure 3, the formability of the TWB structure is reduced compared to homogeneous materials. This is largely due to the presence of the weld line, which does not have the same forming capabilities due to the thermally affected structure. This is, in fact, the biggest disadvantage of TWB, which is counteracted by the fact that materials with different characteristics can be placed in critical areas of the structure where they are needed most. These areas either need stronger or perhaps lighter materials.
3.2. Steps and Conditions in Taguchi Method Application
Following the analysis of the experimental results regarding the influence of the weld line on the dimensional accuracy of the formed TWB parts, the springback of the parts thus obtained considerably influences the fabrication accuracy. Also, the process parameter that essentially affects the intensity of the springback phenomenon is the holding force.
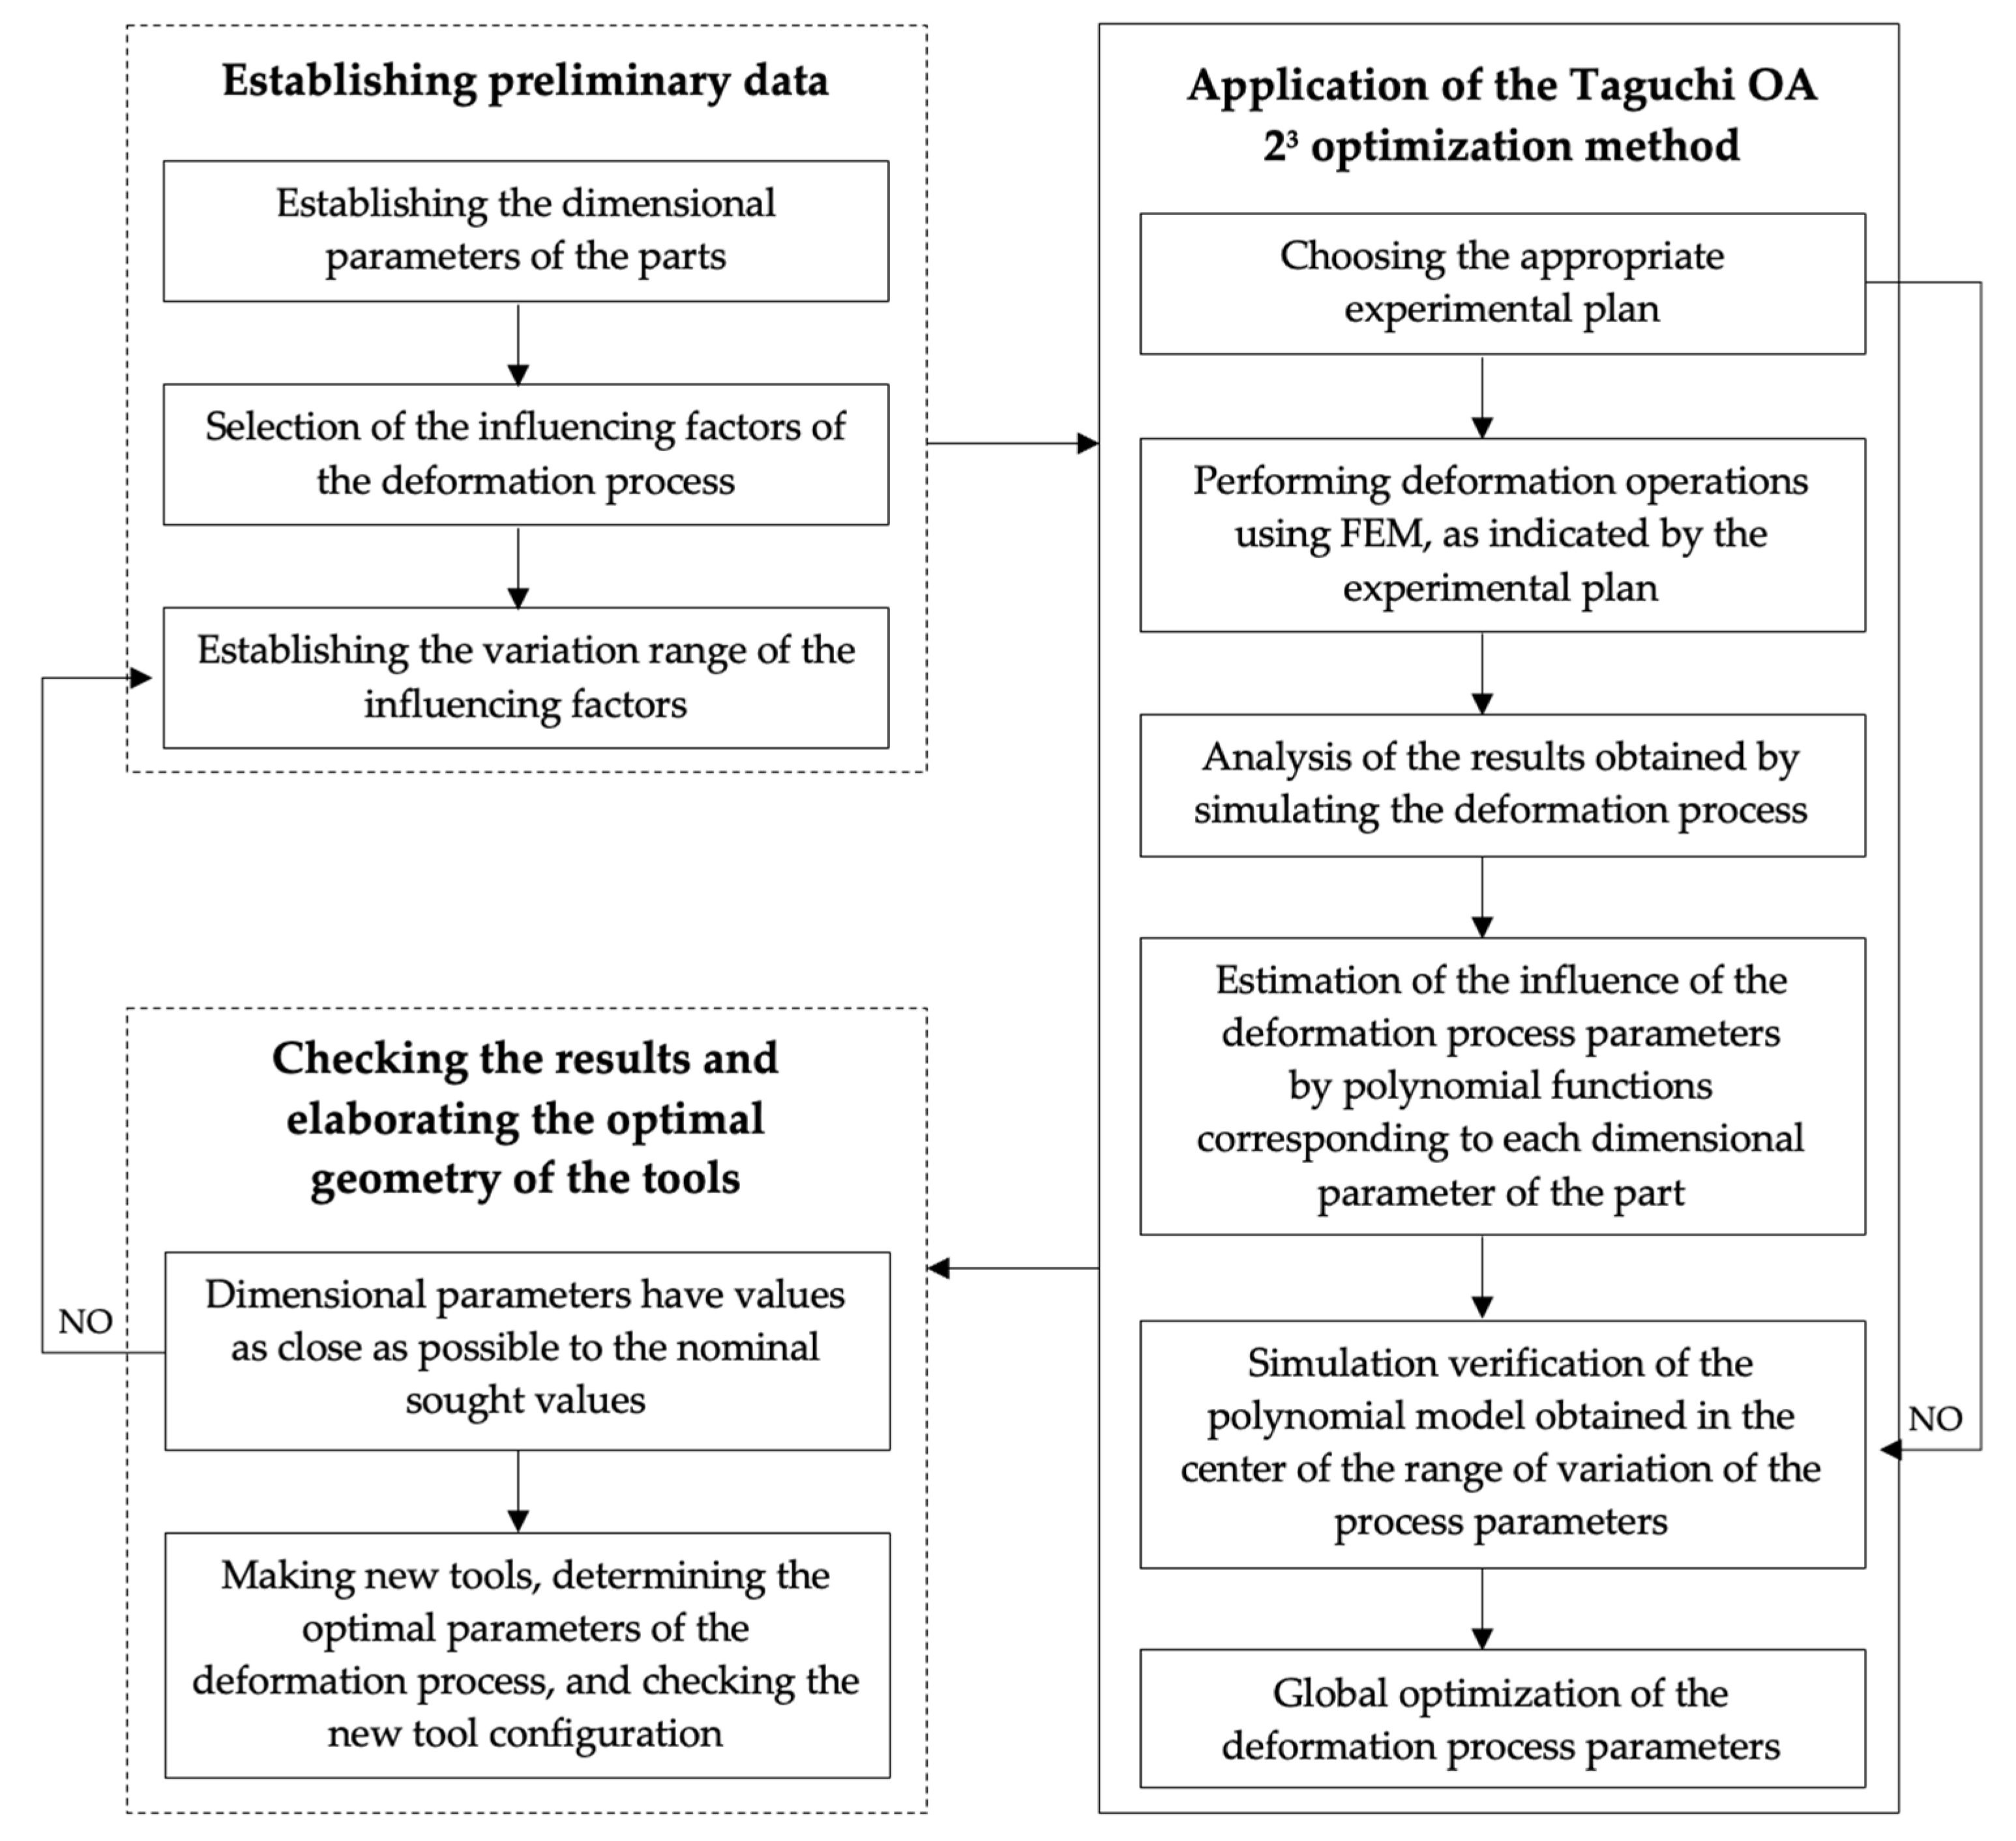
To improve the influence of different parameters of the forming process on the geometric characteristics of TWB parts an optimization model using Taguchi principles was applied. In this regard, the experimental design technique that uses the method of orthogonal matrices offers the possibility of using statistical models. The optimization model seeks a combination of controllable and uncontrollable factors so that the requirements imposed on the influencing factors and the geometric parameters of the part are met simultaneously. This method makes it possible to optimize both the technological parameters of the considered forming process and the tool geometry. The principle used in optimizing the forming process by the Taguchi optimization method with 23 orthogonal matrices is presented in the logic diagram in Figure 4.

Figure 4.
Logic diagram for the application of the Taguchi method with 23 orthogonal matrices.
The main steps of the method are as follows:
- establishing the dimensional parameters to be monitored;
- selection of parameters that influence the studied process;
- establishing a range of variation assigning a lower and an upper limit for each of the process parameters;
- establishing the experimental plan;
- performing the simulation of the different forming alternatives established by the experimental plan;
- obtaining a polynomial function that models and estimates the influence of the process parameters, each established function being specific to each desired geometric characteristic;
- global optimization of the forming process parameters so that the geometric characteristics of the part are as close as possible to the desired nominal value;
- proofing the values obtained through the optimization process by finite element analysis and comparing the new values with the part parameters.
The general conditions of the method to be applied are the following: correct choice of the geometric parameters of the part; proper determination of the influencing factors and their number; adequate solving of the polynomial functions that describe the dependence of the geometric characteristics of the part on the parameters of the forming process; these functions will then be verified by simulation using the finite element analysis; the correctness of the results obtained based on the established functions can offer the possibility of global optimization of the process [20,21,22,23].
3.3. Application of the Taguchi Method with 23 Orthogonal Matrices
3.3.1. Selection of the Forming Process Influencing Factors
The springback phenomenon is one factor that negatively influences the precision characteristics of the parts obtained by plastic forming. In the case of TWB parts, this phenomenon affects each of the two areas of the part differently, depending on the mechanical properties of the materials. The selection of the process parameters was made so that the modification of a parameter can be done without affecting the others. Otherwise, the experimental plan could lead to erroneous results.
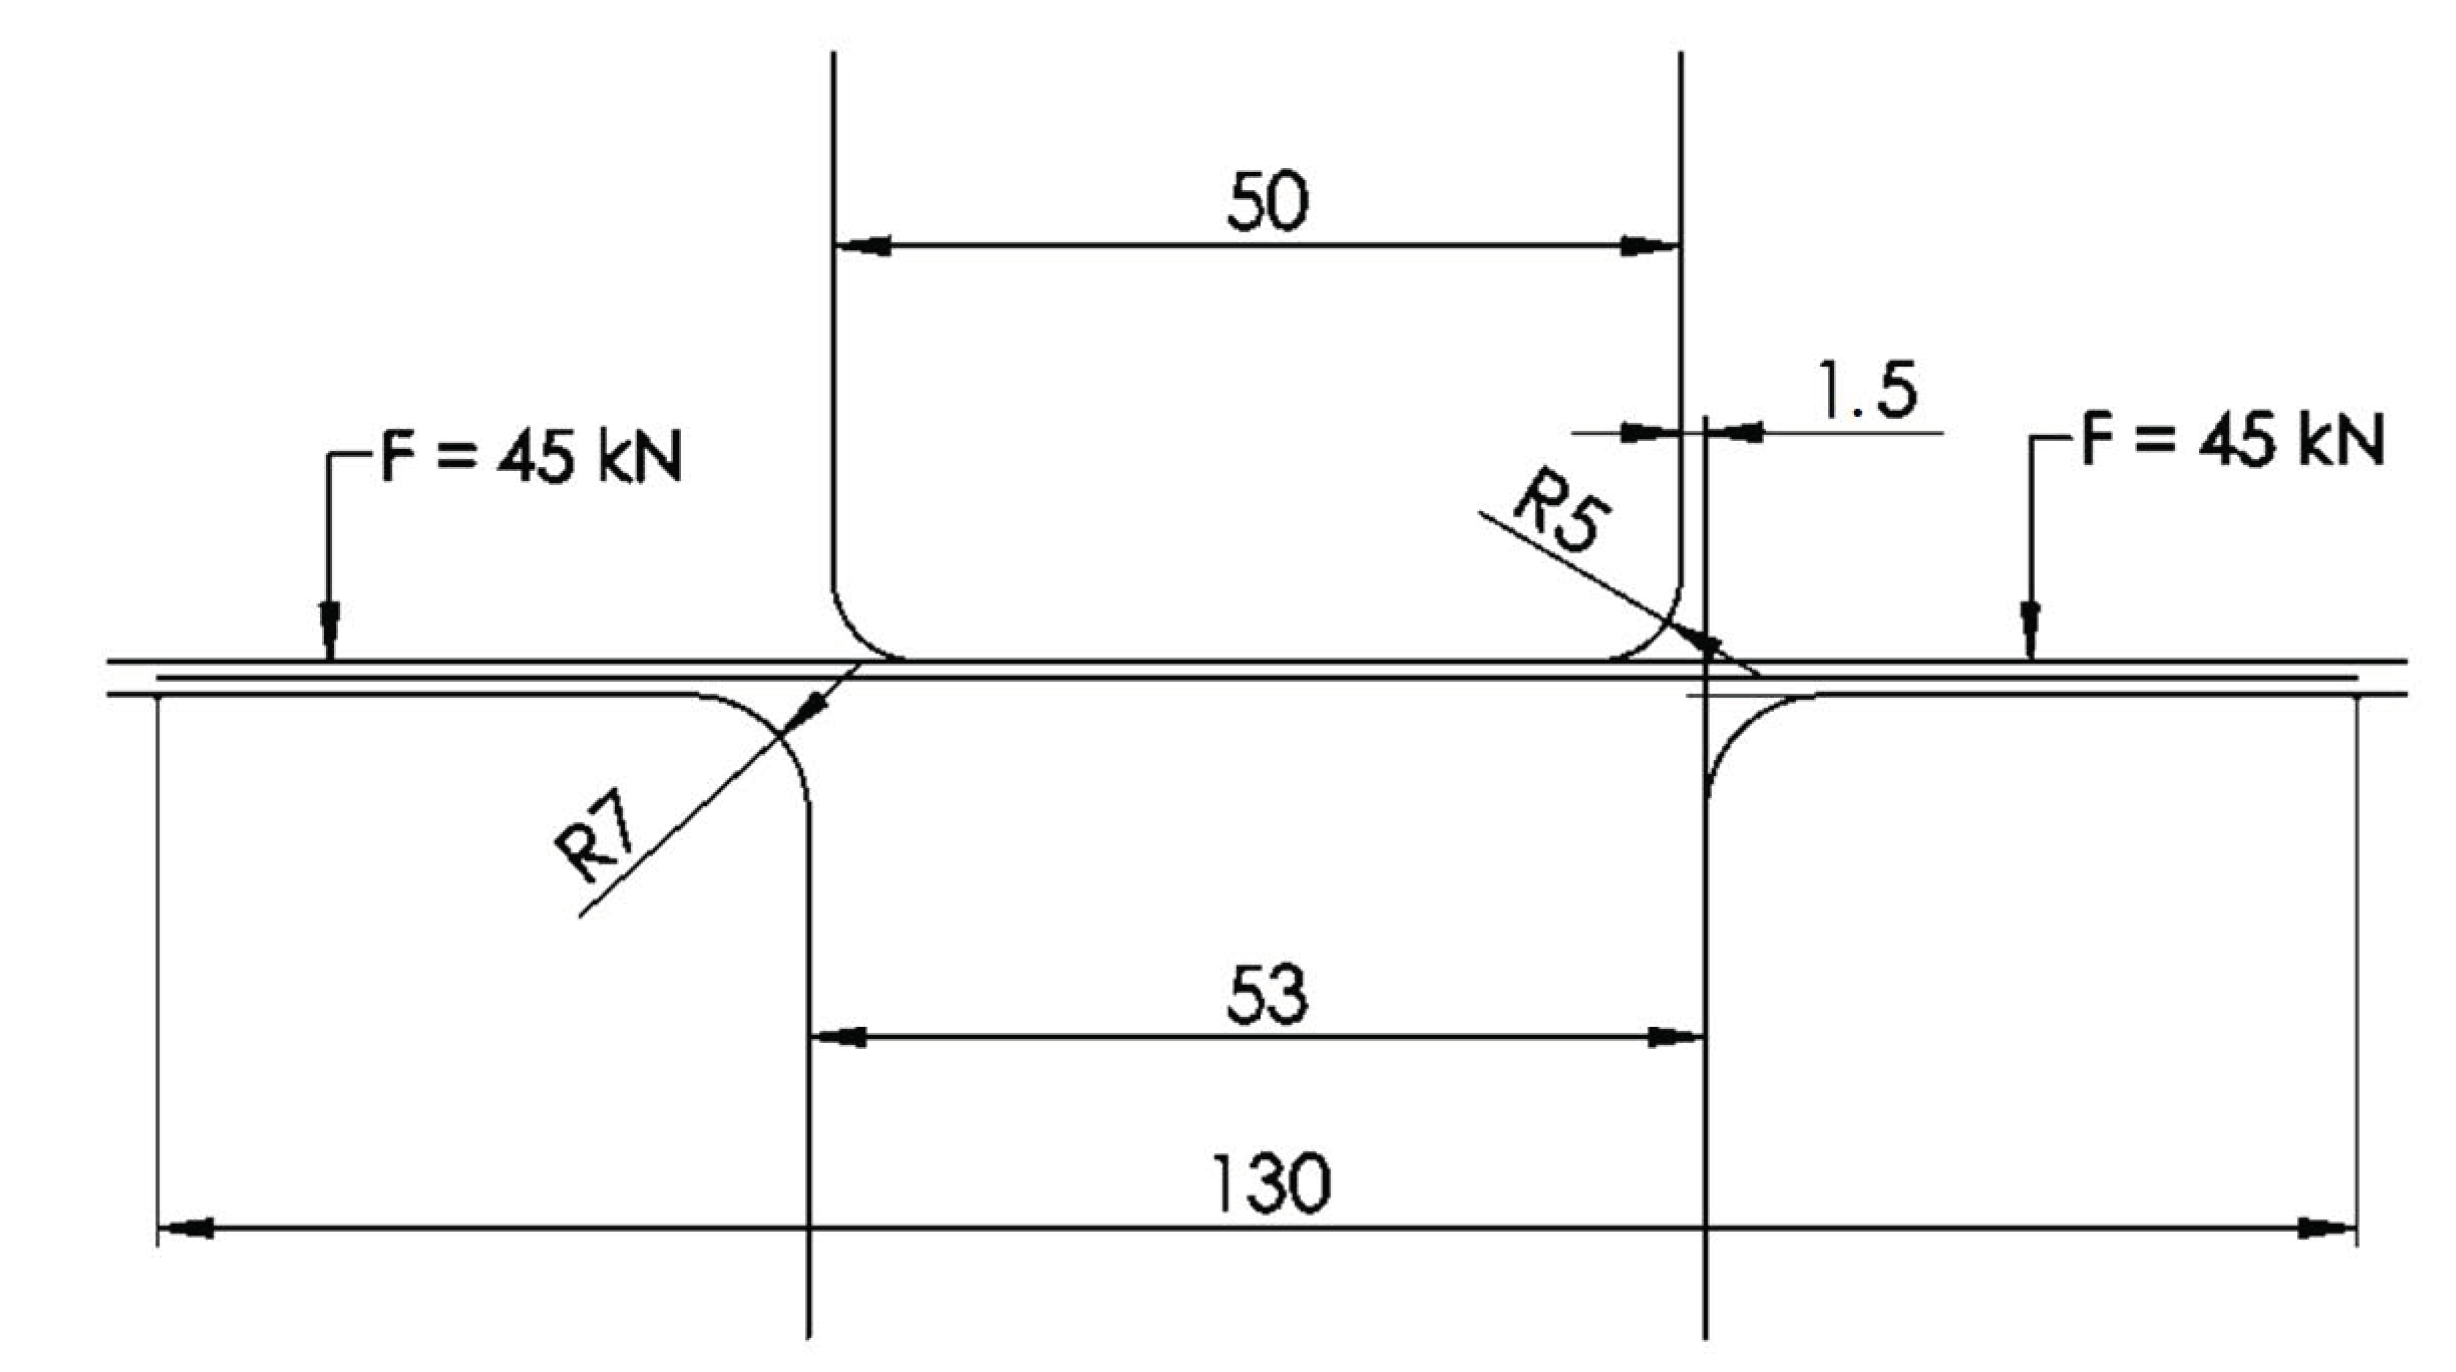
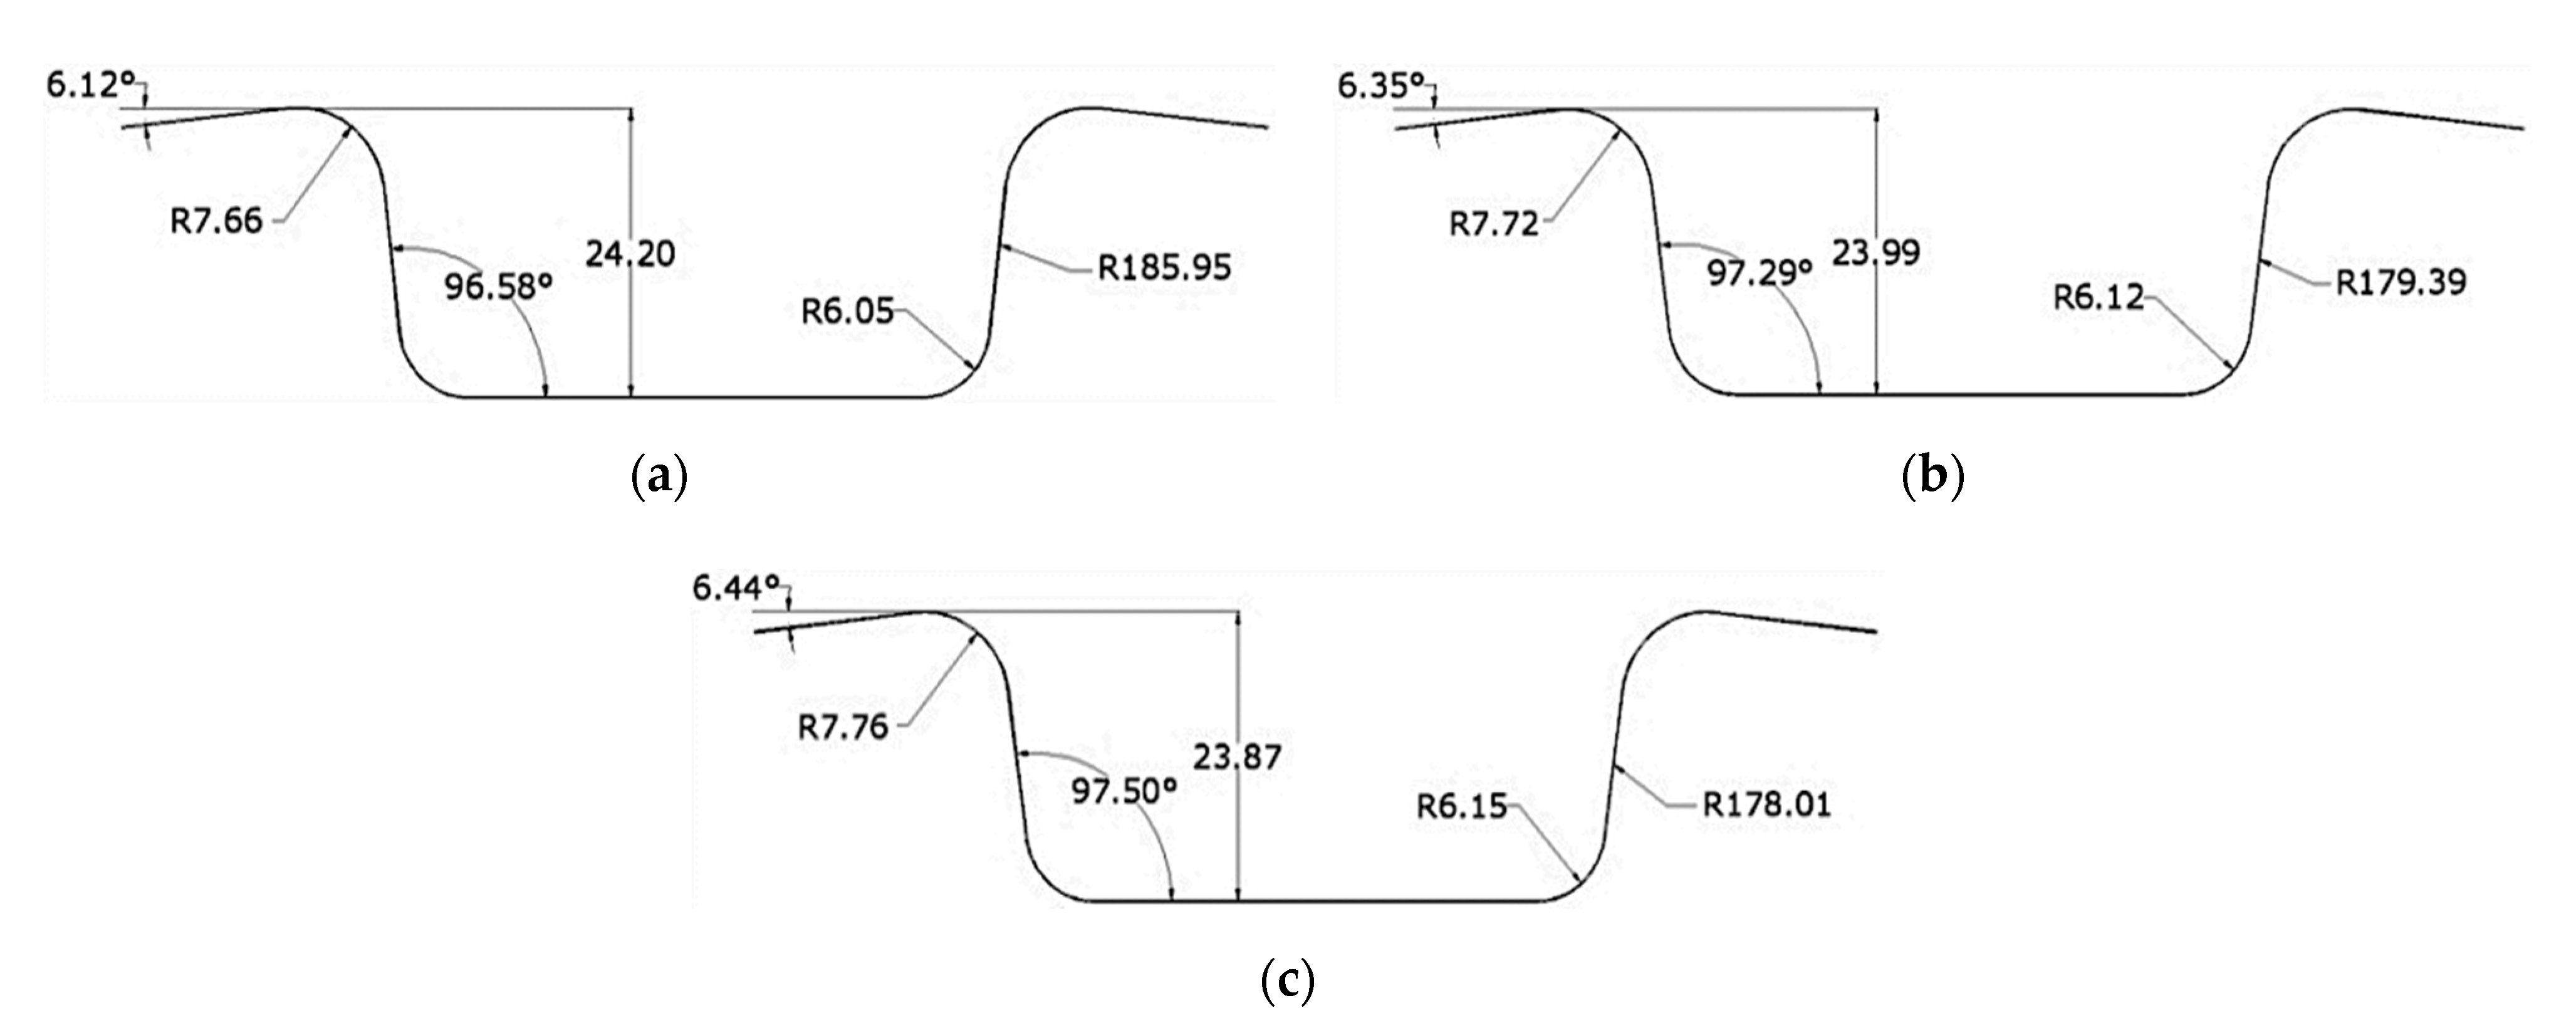
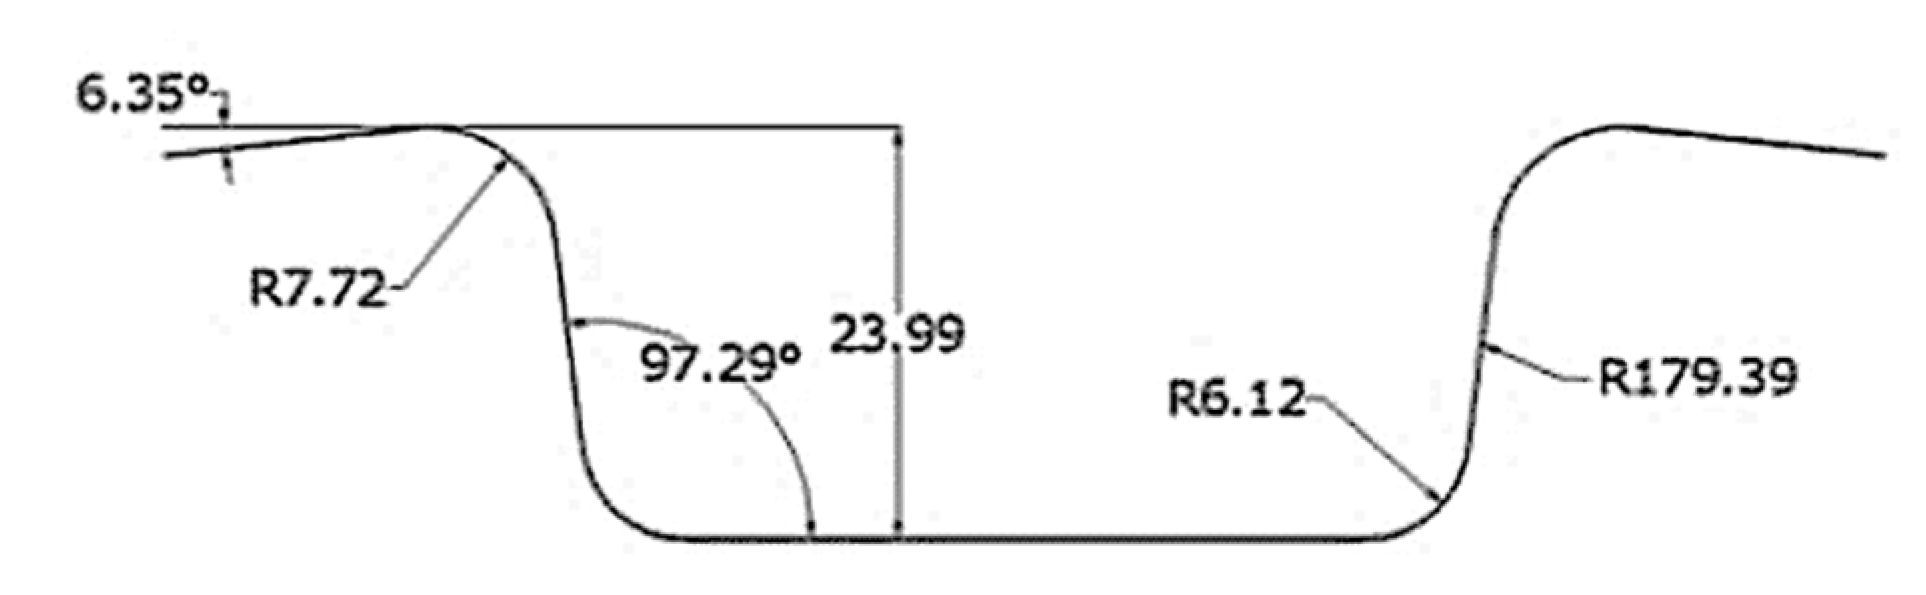
The initial configuration of the tool geometry used in the forming process in the case of rectangular U-shaped parts—from now on referred to as U parts—is shown in Figure 5. The measurements of the parts resulting from this configuration are shown in Figure 6a–c). The initial holding force was 45 kN.
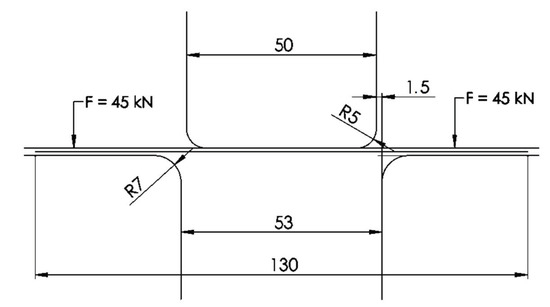
Figure 5.
Initial configuration of tools used to obtain U parts.

Figure 6.
Measurement values on the U parts resulting from the use of the initial parameters: (a) steel area 1; (b) weld line; (c) steel area 2.
For U parts made of TWB, the main deviations from the nominal shape are: the connecting radii between the flanges of the parts and the side walls Rm s1, Rm w, Rm s2; connecting radii between the sidewalls and the bottom of the part Rp s1, Rp w, Rp s2; the side walls radii of curvature Rc s1, Rc w, Rc s2; the angles between the sidewalls and the bottom of the parts θ1 s1, θ1 w, θ1 s2; the angles between the horizontal plane and the flanges of the parts θ2 s1, θ2 w, θ2 s2.
The analysis of the springback parameters highlighted their deviations from the nominal shape. Forming these parts in conditions of maximum precision requires the modification of both the geometric characteristics of the tools and the technological parameters of the forming process. Both in the experimental tests and the finite element analysis, it was noted that the holding force has a significant role in controlling the flow of the material in the die and the final shape of the parts. For this reason, the holding force Fh will be one of the various parameters of the forming process.
For the Taguchi method to be applied, three parameters of the forming process were chosen (Fholding, Rdie, Rpunch) for each of the three materials (steel 1, weld line, and steel 2). For these process parameters, two variation values are chosen (Table 4): the minimum value of each parameter, denoted by −1, and the maximum value, denoted by +1.
Table 4.
The range of values variation in the process parameters.
3.3.2. Experimental Plan and Establishment of the Dependency Functions
Mathematical model of the parameter dependence; to determine how the process parameters (Fholding, Rdie, Rpunch) influence the value of the part deviations (Rm, Rp, Rc, θ1, θ2), it is necessary to decide on some linear polynomial functions Y(X) of the form:
where by the Y parameters are assumed to vary linearly concerning the X parameters. In Equation (3), aiXj represents the interactions between the factors. In this function, Y represents the geometric characteristic of the part to be optimized, and X1… Xn represents the reduced values of the process parameters. The reduced values (F′holding, R′die, R′punch) are calculated according to the process parameters (Fholding, Rdie, Rpunch) based on Equation (4):
For example, for Fholding = 75 kN (maximum), will result F′holding = +1, and for Fholding = 45 kN (minimum) will result F′holding = −1. The linear functions were determined using a factorial plan. The following (−1) and (+1) values will be used for each influencing factor.
Determination of linear polynomial dependence functions; four simulations must be performed to determine the coefficients of the linear dependence functions corresponding to the U part parameters (Rm, Rp, Rc, θ1, θ2). This number is according to the factorial plan generated through the Design-Expert 7 software solution and presented in Table 5. Values corresponding to each reduced parameter (F′holding, R′die, R′punch) were assigned in each simulation.
Table 5.
The corresponding factorial plan for 23 orthogonal matrices.
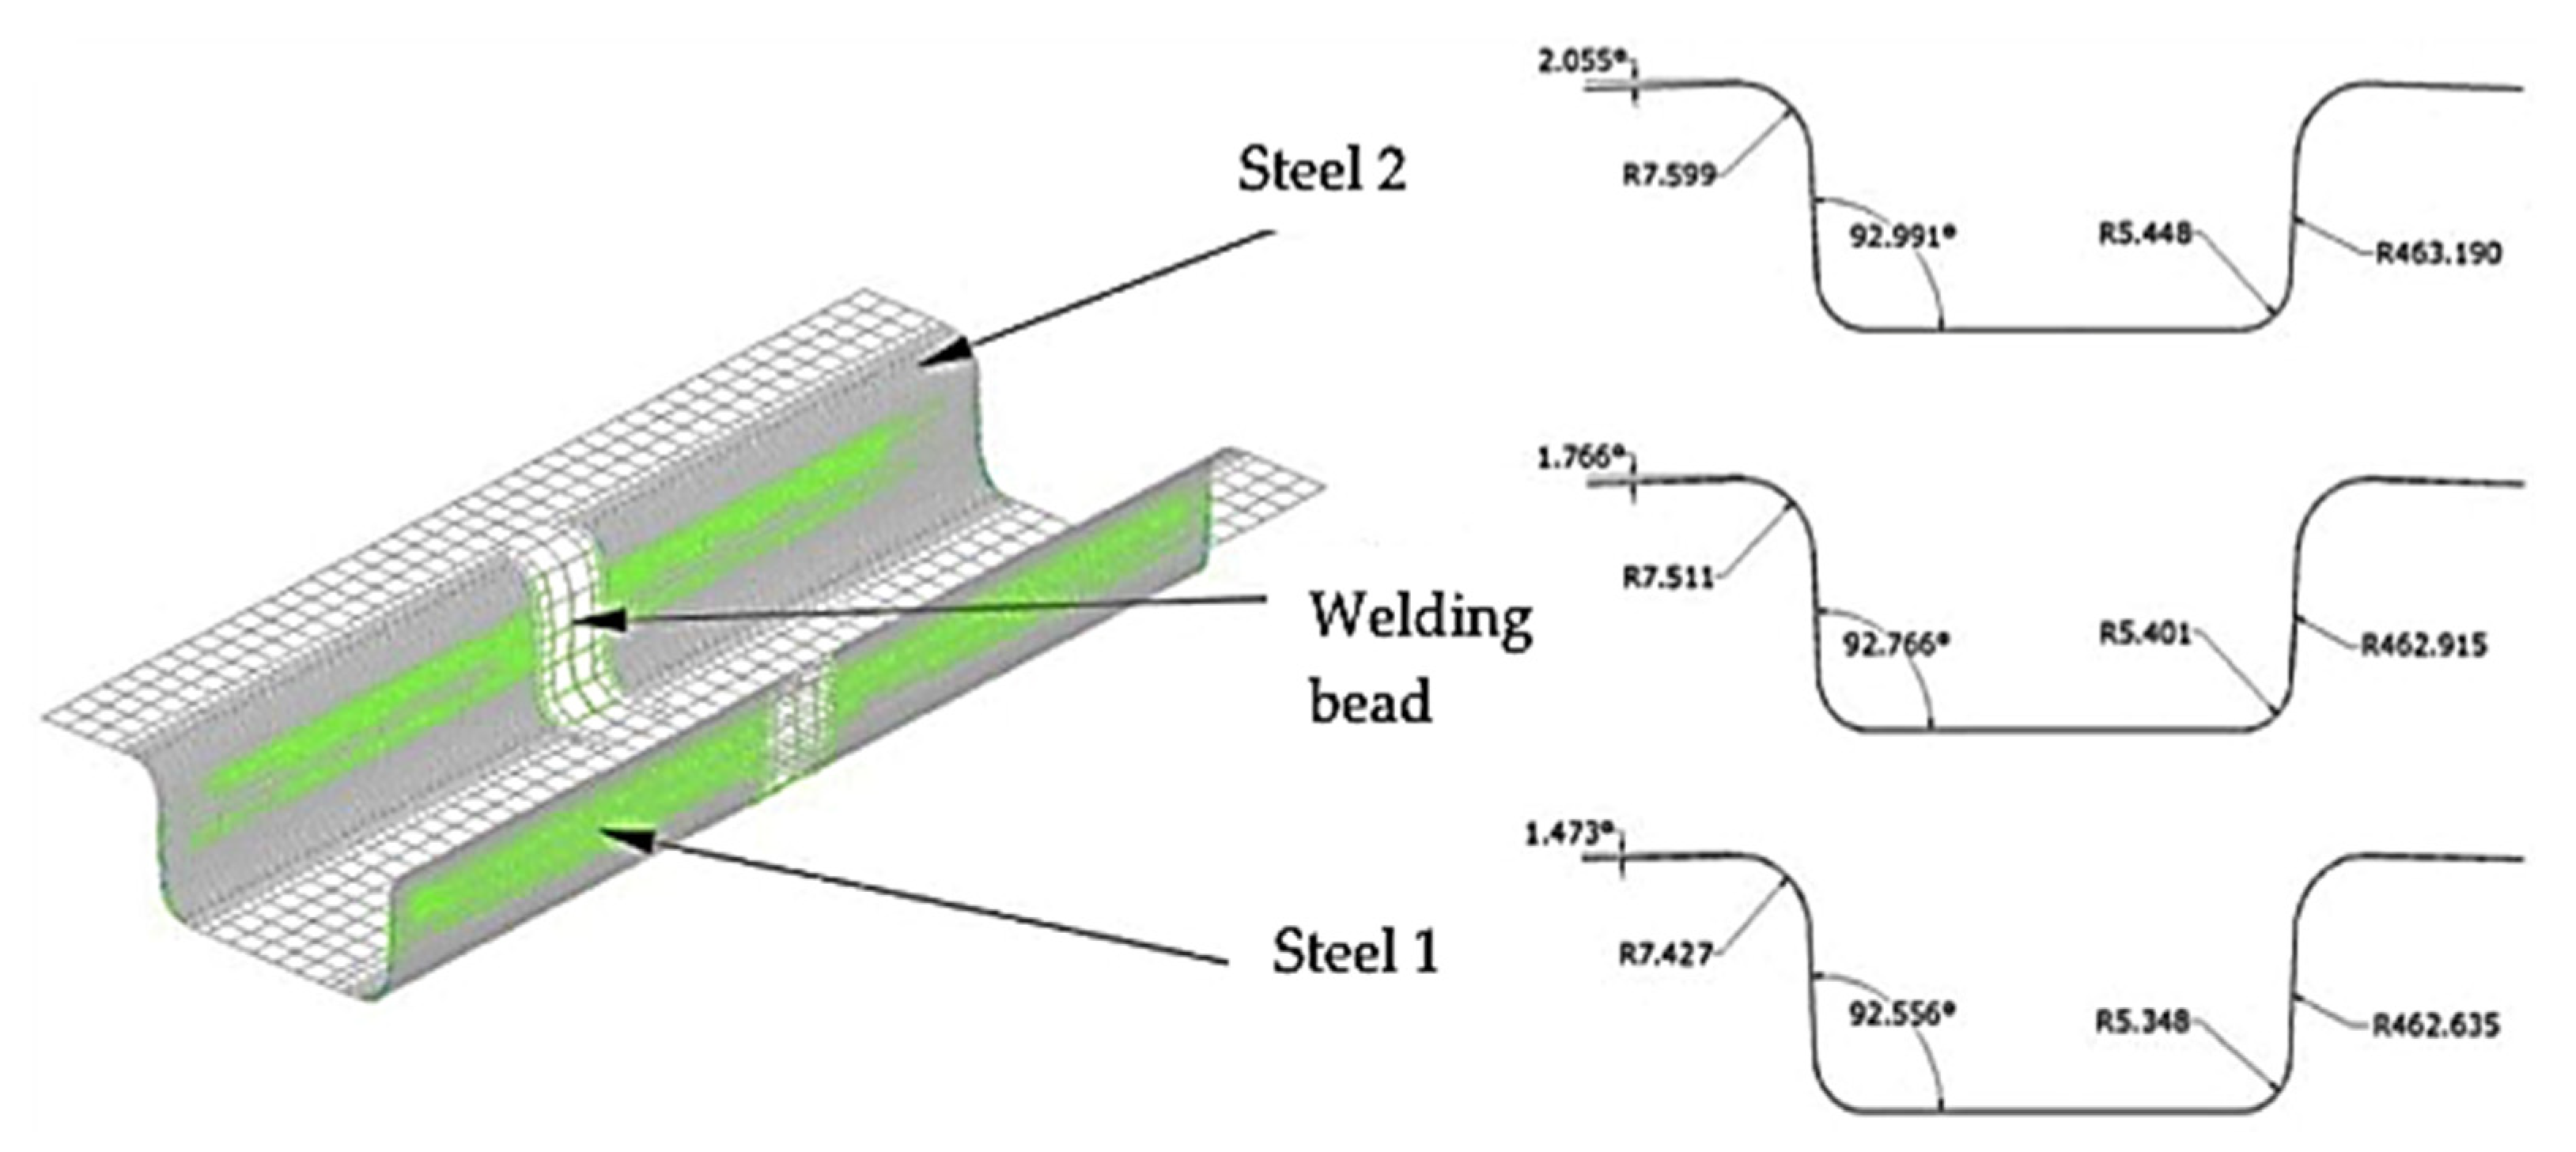
After each simulation, the profile of the part can be easily measured by entering the coordinates of the nodes of the analytical model in the AutoCAD 2021 software solution. The geometric characteristics thus measured are shown in Figure 7, and their values are shown in Table 6, Table 7 and Table 8.
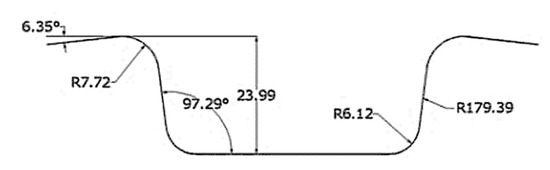
Figure 7.
Measurement of springback parameters on the part profile obtained by simulation.
Table 6.
Values corresponding to geometric parameters for steel 1, from the U part made of TWB.
Table 7.
Values corresponding to geometric parameters for weld line, from U part made of TWB.
Table 8.
Values corresponding to geometric parameters for steel 2, from the U part made of TWB.
The function coefficients corresponding to each of the five springback parameters (Rm, Rp, Rc, θ1, θ2) were determined based on calculus. These were according to each component material of the welded assembly used to obtain the U parts. The expressions for the springback parameter functions are presented in Equations (5)–(19) as follows:
- Polynomial dependence functions corresponding to steel 1:Rm.o1 = 7.82 − 0.023F′holding − 0.11R′punch + 1.18R′dieRp.o1 = 5.22 − 0.045F′holding + 1.02R′punch − 0.03R′dirRc.o1 = 278.47 − 42.20F′holding + 38.19R′punch + 34.25R′dieθ1.o1 = 94.08 − 0.85F′holding − 0.22R′punch − 0.39R′dieθ2.o1 = 5.97 − 0.04F′holding −1.30R′punch + 0.91R′die
- Polynomial dependence functions corresponding to the weld line:Rm.cs = 7.91 − 0.022F′holding − 0.11R′punch + 1.19R′dieRp.cs = 5.28 − 0.045F′holding + 1.02R′punch − 0.03R′dieRc.cs = 268.64 − 40.72F′holding + 36.84R′punch + 33.04R′dieθ1.cs = 94.77 − 0.86F′holding − 0.23R′punch − 0.39R′dieθ2.cs = 6.18 − 0.043F′holding − 1.34R′punch + 0.94R′die
- Polynomial dependence functions corresponding to steel 2:Rm.o2 = 7.24 − 0.77F′holding + 0.63R′punch + 0.45R′dieRp.02 = 5.30 − 0.045F′holding + 1.03R′punch − 0.03R′dieRc.o2 = 266.55 − 40.4F′holding + 36.56R′punch + 32.79R′dieθ1.o2 = 94.97 − 0.86F′holding − 0.23R′punch − 0.39R′dieθ2.o2 = 6.28 − 0.045F′holding − 1.37R′punch + 0.95R′die
A new simulation was mandatory to verify the above relations and validate them. In this simulation the input data was the reduced centred values, respectively Fr′ = 0, Rp′ = 0, Rd′ = 0, which correspond to the values of the process parameters: Fr = 60 kN, Rp = 5 mm, Rd = 7 mm. The results obtained by applying the above relations were compared with those in the simulation and are shown in Table 9, Table 10 and Table 11.
Table 9.
Comparative results in the center of the variation range corresponding to steel 1.
Table 10.
Comparative results in the center of the variation range corresponding to the weld line.
Table 11.
Comparative results in the center of the variation range corresponding to steel 2.
The analysis of the results presented in Table 9, Table 10 and Table 11 leads to the following remark: the errors resulting from the comparison between the values calculated based on the polynomial dependence functions and the results obtained from the simulation fall within a confidence factor of 0.95.
Determining the optimal influence parameters of the forming process of U parts; the main objective is to determine those values of the forming process parameters, which should lead to getting geometric characteristics as close as possible to the nominal values. An objective function is used to optimize this process and allow the simultaneous satisfaction of the conditions imposed. The dimensional parameters of the part are: ωS1 for steel 1, ωwl for the welding line, and ωS2 for steel 2.
The function is null when all the geometric parameters of the part have a nominal value. In the variation range of the forming process parameters between −1 and +1, the function ω has several minima, but none of them is null. Therefore, since it is impossible to obtain all the nominal values of the geometric parameters of the part simultaneously, the lowest value of the function ω will be chosen as the optimal value.
The geometric parameters of the part are as close as possible to the theoretical ones. The values of this function, the optimal reduced values, and the estimated values of the springback parameters corresponding to the U parts are presented in Table 12.
Table 12.
Values corresponding to the function ω.
Determining the optimal dimensional parameters of the tools; The process’s optimal reduced (average) values, presented in Table 12, correspond to the forming process parameters used as input data in a new FEA simulation. Thus, the latest simulation can verify the optimization procedure used. The results obtained after measurements on the U parts are presented in Table 13.
Table 13.
The values of the dimensional parameters of the tools used and the parts obtained.
The optimized parameters for each material were used to carry out the FEA simulation process. In the area of the part made of steel 1, the optimized parameters for steel 1 were used. In the region corresponding to the weld line, the optimized parameters for the weld line were applied, and around the part made of steel 2, the optimized parameters corresponding to steel 2 were used. The value of the holding force was considered as an average of the values obtained for each material. The optimized tool geometry for obtaining U parts is shown in Table 13, and the geometry of the resulting part using the optimized tools is shown in Figure 8.
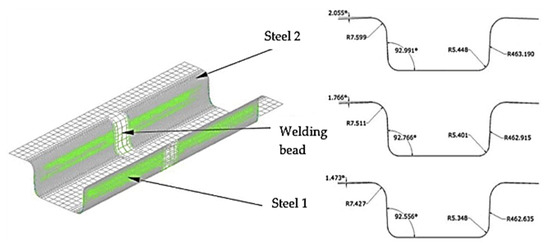
Figure 8.
U part geometry resulting from the use of optimized tools.
3.4. Testing Methodology of Tubular Structures and Equipment
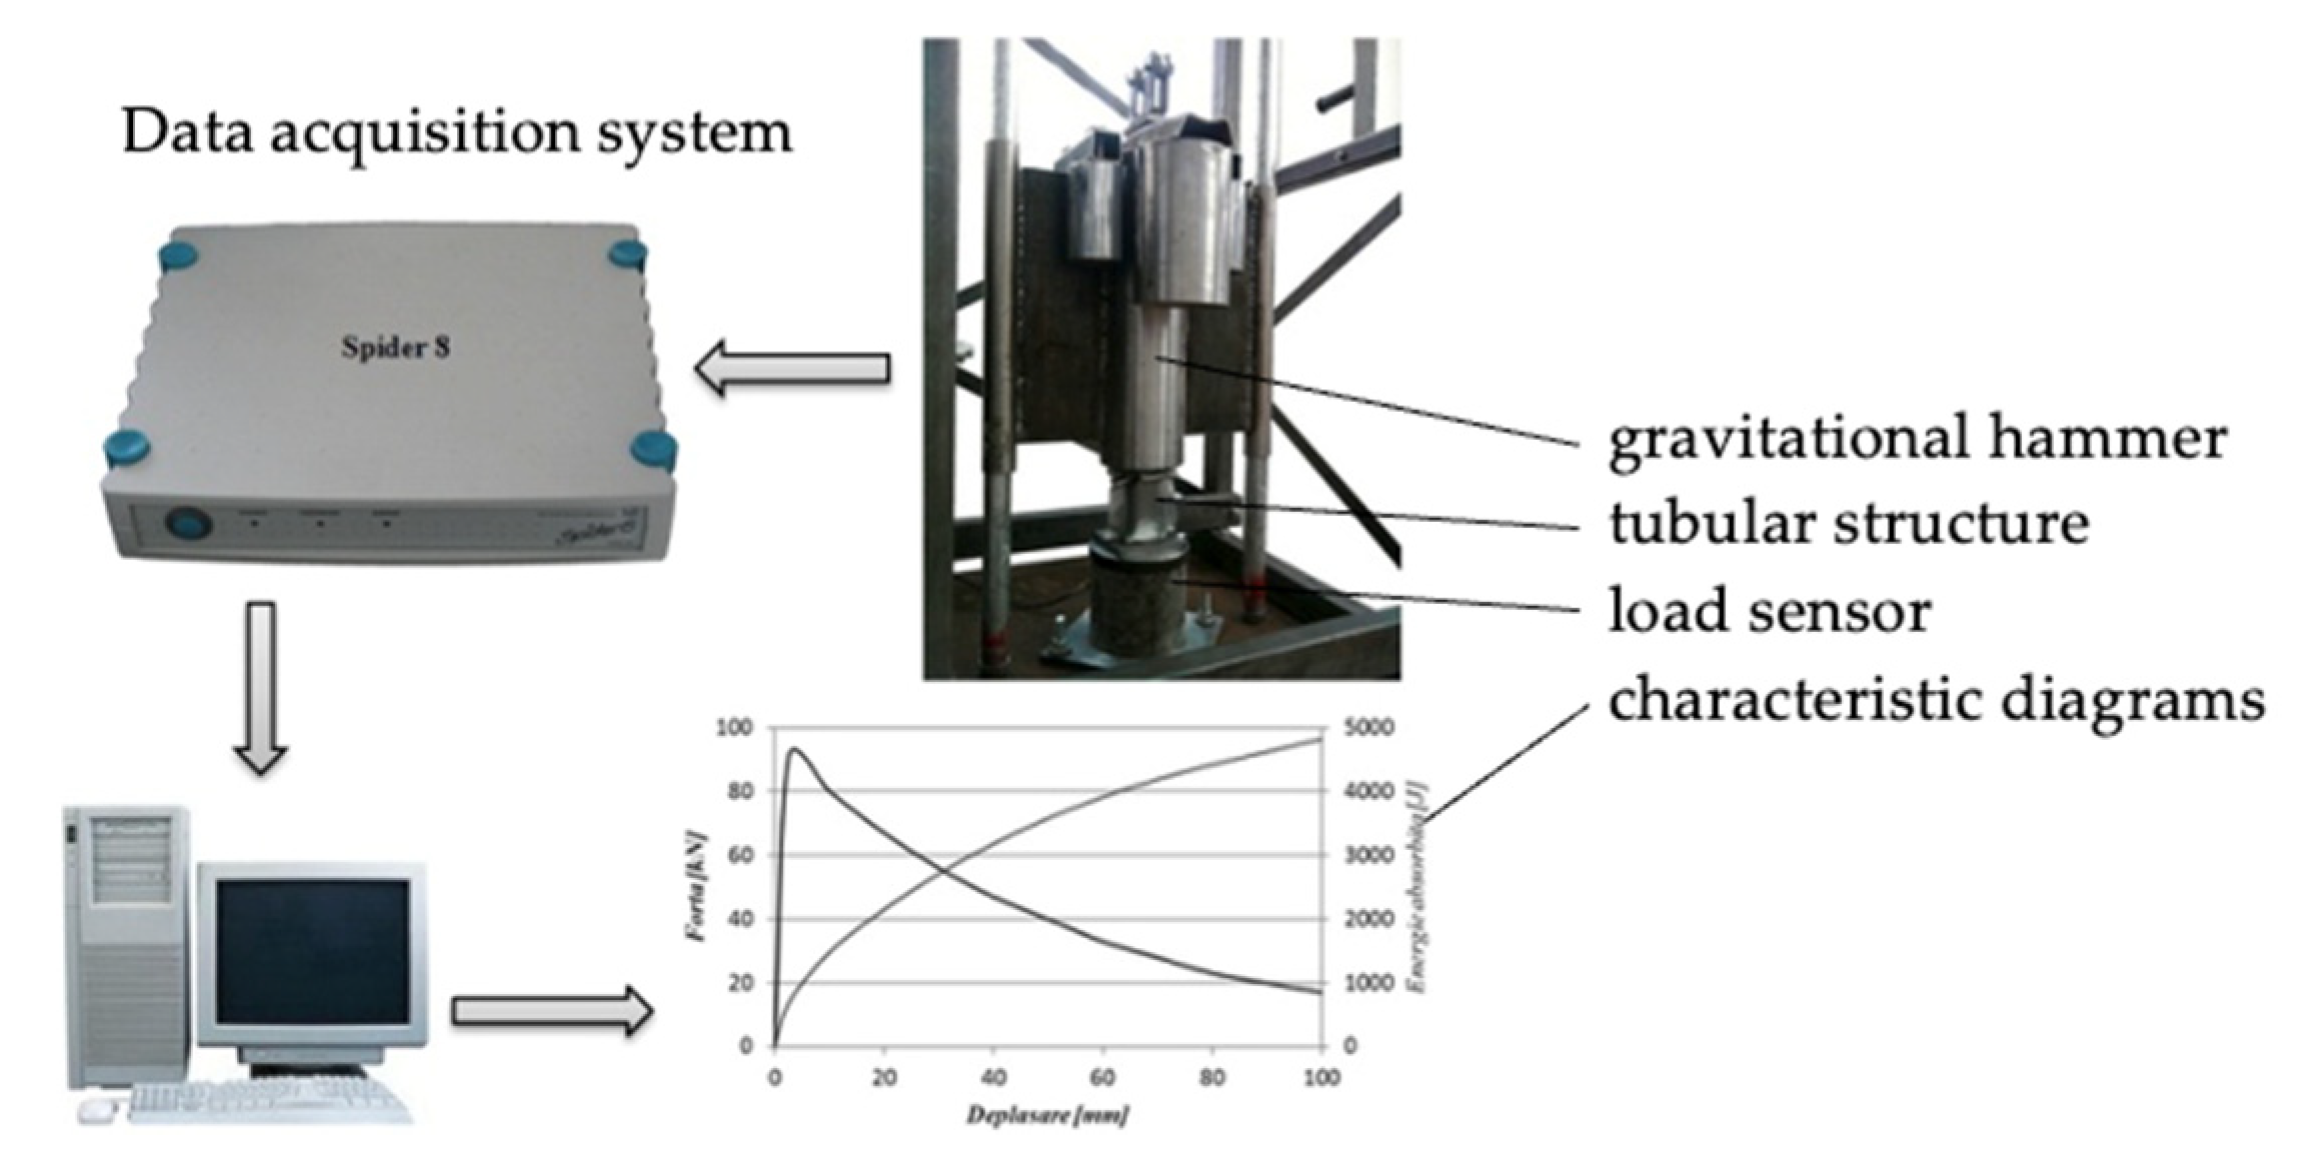
The experimental study aimed to analyse the aspects concerning the behaviour of crashed structures in dynamic conditions with impact. A Kaliber class 5 (HBM Technology, Darmstadt, Germany) compression force cell with a measuring range of 0 to 250 kN was used to perform the measurements. A 600 Hz Spider 8 acquisition system and Catman EXPRESS software (HBM Technology, Darmstadt, Germany) were used to retrieve and process the data.
Experimental tests by dynamic impact loads were performed using a tower-type device specially designed and built for this purpose. A sufficiently high weight (110 kg) falls freely from a height of a maximum of 2100 mm and crashes into the structures. Thin-walled tubular structures, made from homogenous materials and TWB U parts, are placed at the device’s base. The equipment necessary to record the data on the force and displacement with which the weight acts on the tested structures is shown in Figure 9.

Figure 9.
Equipment used for experimental testing on dynamic impact load applications.
Data on the weight displacement after the moment of impact were received through a PROSILICA CV 1280 type high-resolution digital camera (Allied Vision Technologies Canada Inc., Burnaby, BC, Canada).
3.5. Analysis of Thin-Walled Tubular Structures
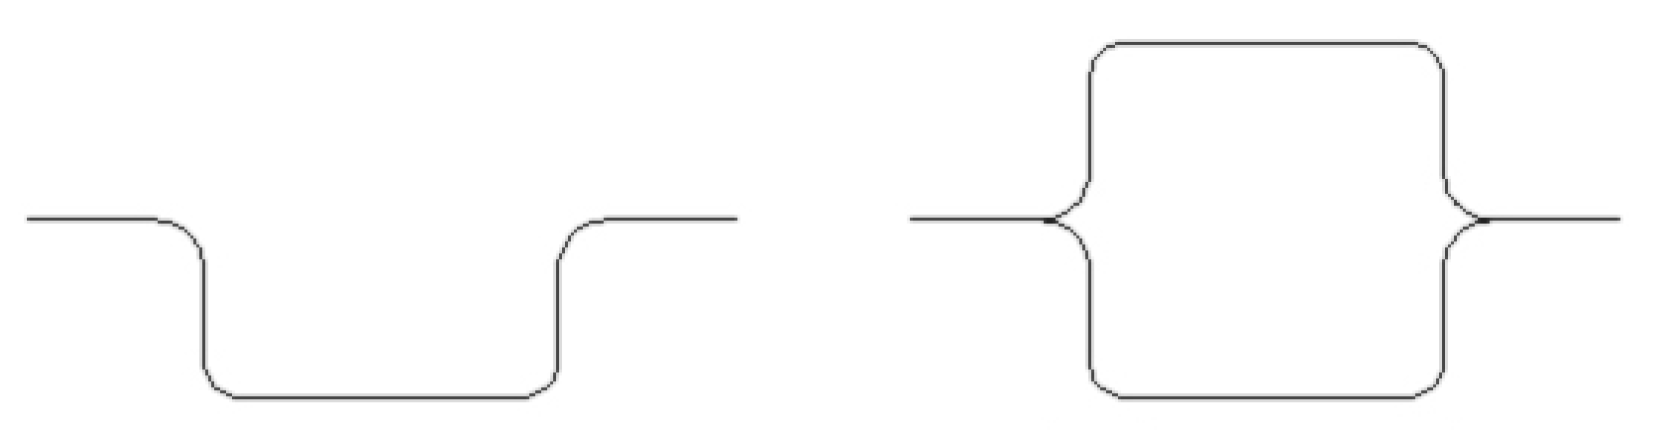
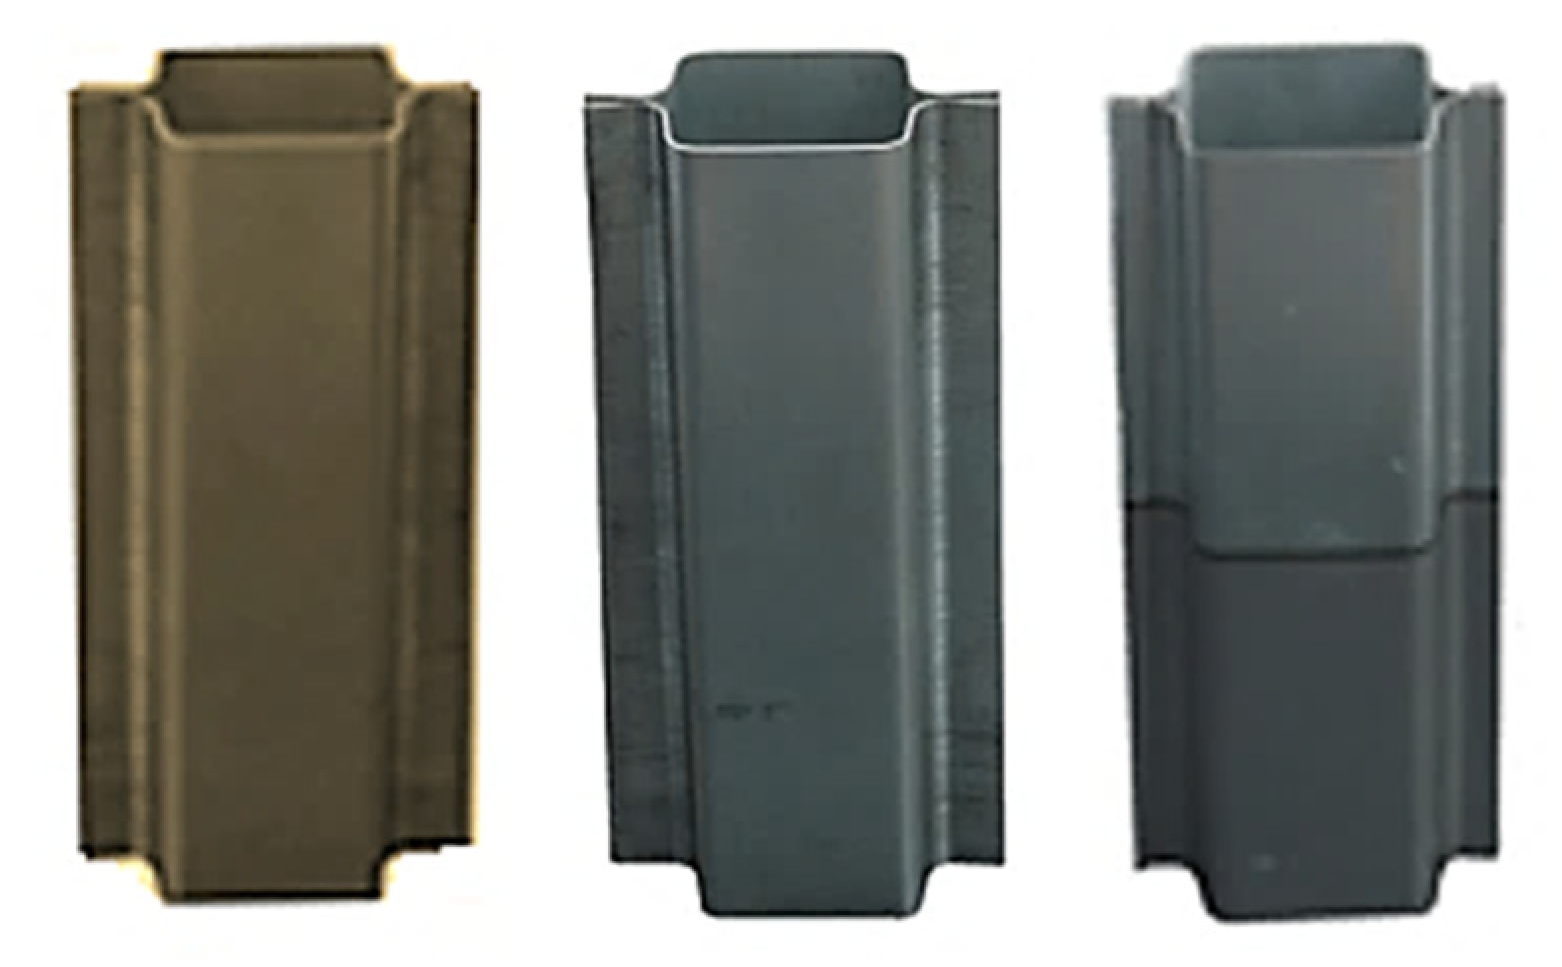
For a more accurate and complete characterization of the TWB thin-walled structure’s behaviour, the effect of these geometries on designs made of homogeneous steel sheets was analysed. The thin-walled tubular structures used for the analyses had optimized U parts. Figure 10 presents the cross-section of the U parts and the geometry of the resulted tubular structure. The thin-walled tubular structures made of homogeneous steel sheets had a specific height of 200 mm and are shown in Figure 11. To construct these tubular structures, gluing with an adhesive solution with modified polymers was used. To analyse the crashing behaviour and the parameters regarding the energy absorption developed at impact, axial crushing tests were performed.
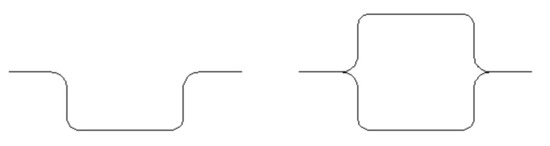
Figure 10.
Cross-section of individual U parts and geometry of the tubular structures.
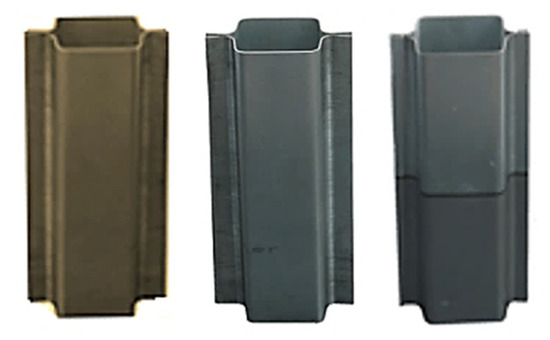
Figure 11.
Thin-walled tubular structures made of homogeneous steel sheets and TWB.
3.6. Use of Genetic Algorithms to Improve the Behavior of TWB Tubular Structures at Dynamic Impact Loading
A Genetic Algorithm is an iterative global searching procedure to optimize the evaluation function. The algorithm works parallel on a population of potential solutions (chromosomes) distributed throughout the search space. Typically, the performance value of a chromosome is independent of the performance of other individuals in the population. Another possibility is to consider a function of implicit adequacy, whose values also depend on the rest of the population through specific interactions between individuals. It refers to an intrinsic adaptation that ensures the co-evolution of individuals [24,25,26]. A new population is created at each iteration of the algorithm, called a generation, with all generations the same number of individuals. It is accepted that, in general, the new generation is made up of better performing individuals, better adapted to the environment represented by the adequacy function. With the succession of generations, individuals will tend to evolve towards the global optimum of the adequacy function. Achieving a new generation, starting from the previous one, takes place in the following stages [27,28]:
- Evaluation is when the Genetic Algorithm calculates the value of the adequacy function for each individual of the old population.
- Selection is when the Genetic Algorithm selects individuals from a population-based on their performance. The chosen individuals will represent an intermediate population. Thus, the chromosomes of the intermediate population become the parents of the new generation.
- Recombination and modification: the Genetic Algorithm recombines and modifies selected individuals. For this purpose, the operators’ genetics of crossbreeding (recombination), mutation, and inversion are used. From an algorithmic point of view, genetic operators are methods of locally changing the solutions represented by the parents (conversion or inversion) or combining these solutions (crossover) by a gene transfer between two chromosomes.
The technique used to estimate the optimal amount of material needed to construct TWB tubular structures is based on the principles of Genetic Algorithms. Also, the OPTIMIZATION TOOL software module within the MATLAB 9.12.0 R2022a software (The MathWorks, Inc., Natick, MA, USA) platform was used to run the steps necessary for the optimization with Genetic Algorithms in the best possible conditions. The analysis of the experimental results established the factors that decisively influence the behaviour of TWB tubular structures subjected to dynamic impact loadings. These factors are the energy absorbed Ea and the absorption of specific energy Aes (which must have the highest values) and stroke efficiency Ecd (which must have average values characteristic of the strain level accepted for the structure in question). For the studied tubular structures, the established value of the parameter corresponding to the stroke efficiency is Ecd = 0.5. These parameters show that the structure subjected to dynamic shock loading is intended to absorb as much energy as possible and be as light as possible. The final height of the crashed tubular structure must be half of the initial size.
After initializing the MATLAB 9.12.0 program, the OPTIMIZATION TOOL app is used to access the specialized module for running Genetic Algorithms for any problem. First, two M-files must be created to characterize the search space for potential solutions. These files consist of the objective function and the constraint functions [29,30]. In the case of optimizing the crashworthiness and energy absorption characteristics of TWB tubular structures, the value of the objective function must be minimized. To characterize the behavior of these types of tubular structures as accurately as possible, an objective function (Equation (23)) is proposed in this paper. Therefore, the aim is to minimize this simple function with four variables x1, x2, x3, and x4, of the type:
where by x1 represents the specific energy absorption (Ase) corresponding to the tubular structure subjected to crashing, x2 corresponds to the total mass (m) particular to the structure, x3 corresponds to the optimal value of the strain rate coefficient (Es), and x4 corresponds to the value of the maximum initial force (Fmax). The value of the parameter x2 is particularly important in dimensioning the areas of the tested structures.
The creation of each M-file uses lines of code specific to the domain of representation as follows:
- to express the objective function: 1. function y = simple_fitness (x); 2. y = f(x)
- to express the constraint function: 1. function [c, ceq] = simple_constraint (x); 2. c = [constraint 1]; 3. ceq = [].
Equation (24) is subject to the following conditions and imposed limits:
The principle of the Genetic Algorithm considered admits that the characterization function of the search field of potential solutions will take as input the value x, where x has as many elements as the number of variables of the problem. The objective function calculates the numerical value of the argument y. The minimum values in the LB section (lower bounds) and the maximum values in the UB section (upper bounds) were defined to minimize the objective function that is linked to the limits of the variables x1, x2, x3, and x4.
After running the Algorithm, the Status and Results box displays the information announcing the end of the calculation sequence and the presentation of the tolerance to the resulting function. Also, the numerical values of the four variables are presented along with the number of generations created. From the analysis of the resulted data, it was noticed that the final solution is obtained after 51 generations of values. After completing the calculation sequence, the results are saved in the work window in which all the entered data are briefly displayed and the results (Figure 12).
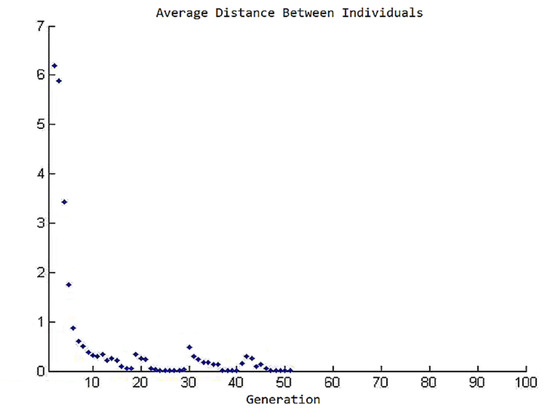
Figure 12.
Graphical representation of potential solutions according to each generation created by the Genetic Algorithm.
The values of the four variables were determined after running the Genetic Algorithm. Therefore, the TWB tubular structure formed by the U parts to be tested has the values indicated in Table 14:
Table 14.
Values resulting from running the Genetic Algorithm.
The tubular structure’s general characterization and evaluation parameters are calculated based on these data. This assesses the satisfaction of the desideratum to obtain a predetermined crashing heigh and the absorption of as much energy as possible. The ratio of the weld line (Rtwb) position to the thinner material is also determined. Table 15 shows the estimated values of the general evaluation parameters and the welding line positioning ratio.
Table 15.
Estimated values of the general evaluation parameters.
4. Discussion
The results obtained by applying the Genetic Algorithms were verified by experimentation. The TWB tubular structure was built according to the specifications resulting from applying the above method. Thus, the new tubular structure presents the dimensional characteristics shown in Table 16.
Table 16.
Dimensional characteristics of the new TWB tubular structures.
The dynamic loading process was performed respecting the following characteristics: the height between the impact surface of the sample and the gravitational hammer L = 2100 mm, the weight of the gravitational hammer G = 110 kg, and the developed kinetic energy Ec = 2266.11 J. Following the crushing tests on the new type of structure, the characteristic curves of the maximum force and absorbed energy were obtained. The general characterization and evaluation parameters could be determined. Thus, these results are presented in Figure 13 and Figure 14 and Table 17, respectively.
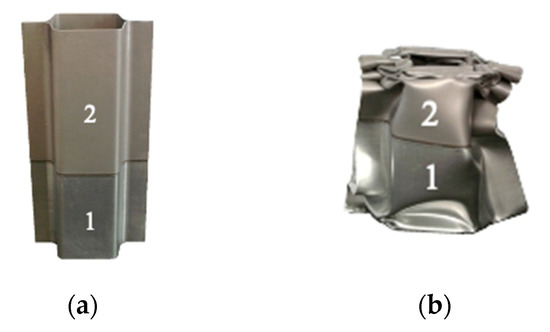
Figure 13.
TWB tubular structure with optimal positioning of the weald line: (a) initial state; (b) crashed state.

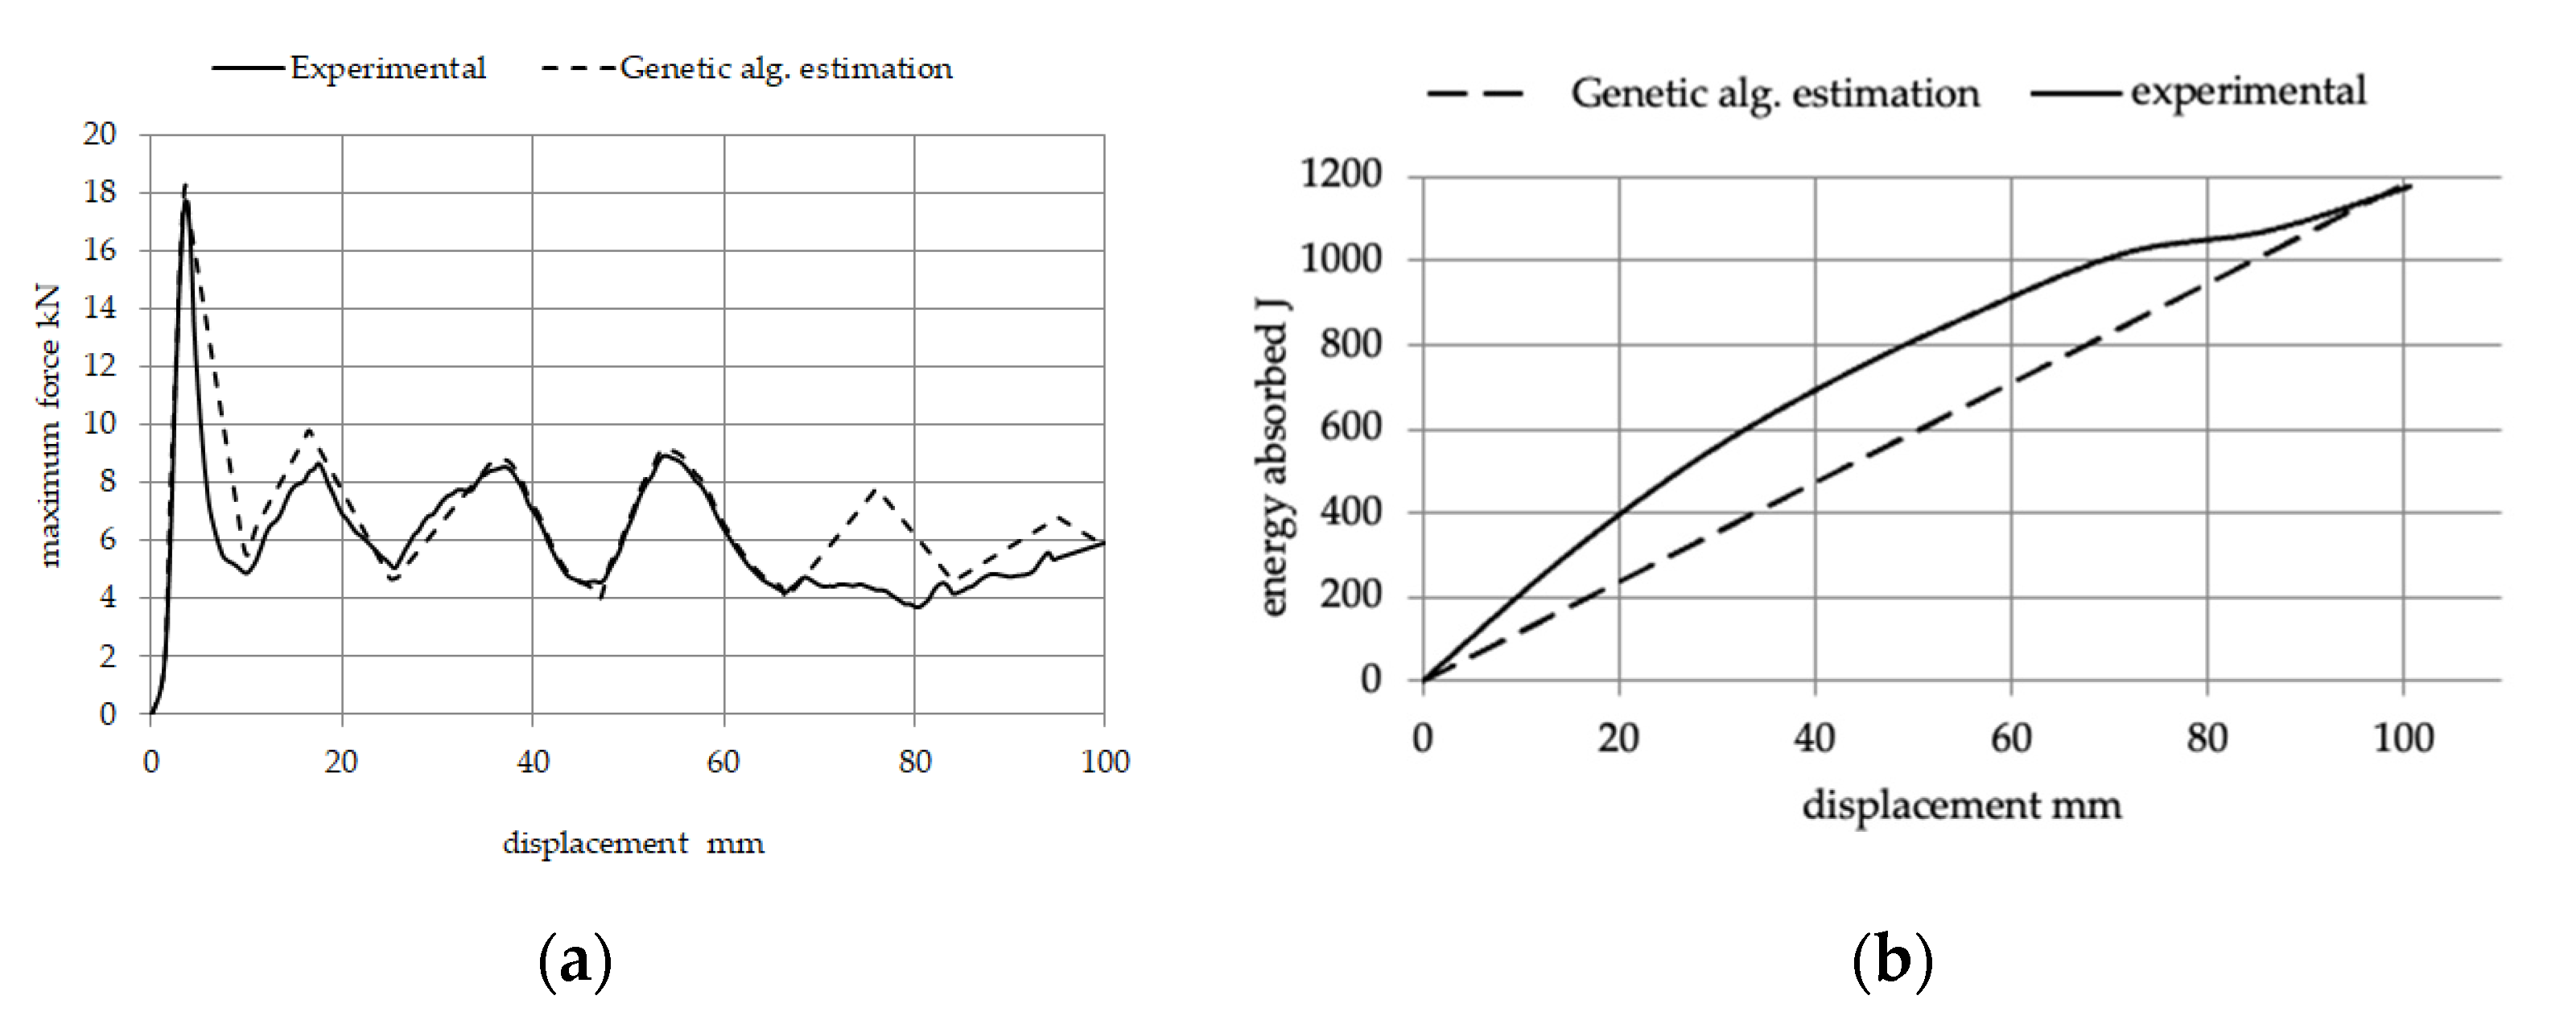
Figure 14.
Comparison between the estimated and experimental curves regarding: (a) maximum force, and (b) absorbed energy.
Table 17.
The values of the estimated general evaluation parameters and those obtained experimentally.
Figure 14a represents the load history for the TWB tubular structure in both simulation and experimental crash tests. Good agreement and almost full conformance can be observed between the maximum force of the estimated and experimental results for both tubular structures. The impact load applied to the TWB tubular structure, and the load-displacement graph, are illustrated here for comparison.
It is observed from Figure 14 that the results of the estimation are lower than the experimental results and the difference between them is about 3% at the peak of the diagram. However, in some parts of this diagram, the difference is more than 55% or without considerable differences.
Based on the data presented above, the values obtained for the new TWB tubular structure are very close to those obtained from the optimization process using the method of Genetic Algorithms. The resulted data have an error rate of less than 3%, thus considering that this method can be used successfully in the qualitative and quantitative estimation of dynamically loaded TWB tubular structures.
5. Conclusions
Using Taguchi’s method, technological parameters and tool geometry were optimized for each material in the welded assembly. Also, considering the influence that each of the materials has on the other components of the welded assembly, the technological parameters used have changed as follows:
- the holding force necessary to obtain parts with geometric parameters as close as possible to the nominal value was increased by an average of 52.9%, from an initial value of 45 kN to a final average value of 68.84 kN;
- the connection radius of the die was reduced, depending on each material in the welded assembly subjected to forming, as follows: for steel area 1, the connection radius of the die was decreased by 8.42%, from an initial value of 7 mm to 6.41 mm; for steel area 2, the connection radius of the die was decreased by 10.71%, from an initial value of 7 mm to 6.25 mm; for the weld line area, the connection radius of the die was decreased by 8.85%, from an initial value of 7 mm to 6.38 mm;
- the connection radius of the punch was reduced, depending on each material in the welded assembly subjected to forming, as follows: for steel area 1, the connection radius of the punch was reduced by 5.4%, from an initial value of 5 mm to 4.73 mm; for steel area 2, the connection radius of the punch was reduced by 9%, from an initial value of 5 mm to 4.55 mm; for the weld line area, the connection radius of the punch was reduced by 6.2%, from an initial value of 5 mm to 4.69 mm;
Generally, it is noted that for this type of welded assembly, the holding force must increase, and the geometric parameters of the tools must have lower values than the nominal ones.
By running the Genetic Algorithm, the final values of the obtained variables are characteristic of the 51st generation of data of the space of potential solutions. The value of the objective function presents an error of 6.13% compared to the initial requirement
The new TWB tubular structure has the following characteristics: the height of the area made of steel 1, which is the thicker steel sheet, is hS1 = 82 mm, under conditions of a total height of 200 mm; absorbed energy Ea = 1177.263 J, value very close to the nominal established value; strain rate efficiency Es = 0.503, a value that shows minimal differences from the theoretically set value.
By adequately positioning the weld line, the deformation can be distributed over the entire TWB tubular structure, effectively controlling the height of the crashed area. The weld line has a decisive influence on the distribution of stresses and strains at the time of dynamic impact loading, ensuring a higher rigidity than the transition zone between the two materials, thus improving the overall behaviour of the structure.
The data from using the Genetic Algorithms method regarding the dynamic impact process of TWB tubular structures are obtained experimentally. These results indicate the successful use of Genetic Algorithms in the qualitative and quantitative assessment of dynamically crashed thin-walled tubular structures made of tailored welded blanks.
Author Contributions
Conceptualization, V.A.C. and V.Z.; methodology, V.A.C.; software, V.A.C. and M.C.R.; validation, V.A.C., V.Z. and M.C.R.; formal analysis, V.A.C. and E.H.; investigation, V.A.C., E.H. and M.C.R.; resources, V.A.C., V.Z. and E.N.; data curation, V.A.C. and C.C.G.; writing—original draft preparation, V.A.C.; writing—review and editing, V.Z. and C.C.G.; visualization, V.A.C. and C.C.G.; supervision, V.A.C. and V.Z.; project administration, V.A.C.; funding acquisition, V.A.C., V.Z. and E.N. All authors have read and agreed to the published version of the manuscript.
Funding
This research was funded by the Ministry of Education, through the National Council for the Financing of Higher Education, Romania, grant number CNFIS-FDI-2022-0072 and CNFIS-FDI-2022-0208.
Institutional Review Board Statement
Not applicable.
Informed Consent Statement
Not applicable.
Data Availability Statement
Not applicable.
Conflicts of Interest
The authors declare no conflict of interest.
References
- Auto/Steel PARTNERSHIP. TWB Applications and Manufacturing; Auto/Steel Partnership: Southfield, MI, USA, 2001; pp. 9, 12, 43. [Google Scholar]
- Melbourne, S.; Noel, J.; Baron, J. Tailor Welded Blanks Design and Manufacturing Manual; General Motors: Detroit, MI, USA, 1995. [Google Scholar]
- Kumar, A.; Gautam, V. Formability of tailor welded blanks of high strength steel: A review. Mater. Today Proc. 2021, 46, 6547–6551. [Google Scholar] [CrossRef]
- Lu, R.; Gao, W.; Hu, X.; Liu, W.; Li, Y.; Liu, X. Crushing analysis and crashworthiness optimization of tailor rolled tubes with variation of thickness and material properties. Int. J. Mech. Sci. 2018, 136, 67–84. [Google Scholar] [CrossRef]
- Bartczak, B.; Gierczyzka, D.; Gronostajski, Z.; Polak, S.; Tobota, A. The use of thin-walled sections for energy absorbing components: A review. Arch. Civ. Mech. Eng. 2010, 10, 5–19. [Google Scholar] [CrossRef]
- Peroni, L.; Avalle, M.; Belingardi, G. Comparison of the energy absorption capability of crash boxes assembled by spot-weld and continuous joining techniques. Int. J. Impact Eng. 2009, 36, 498–511. [Google Scholar] [CrossRef]
- Zou, Y.Y.; Zou, K.Z.; Liu, H.H.; Zhou, D.L. Laser-based precise measurement of tailor welded blanks: A case study. Int. J. Adv. Manuf. Technol. 2020, 107, 3795–3805. [Google Scholar] [CrossRef]
- Kim, M.; Bae, G.; Park, N.; Song, J.H. Springback Reduction of Ultra-High-Strength Martensitic Steel Sheet by Electrically Single-Pulsed Current. Materials 2022, 15, 2373. [Google Scholar] [CrossRef]
- Zhang, X.G.; Li, L.Q.; Chen, Y.B.; Zhu, X.C.; Ji, S.J. Numerical Simulation Analysis of Dual-Beam Laser Welding of Tailored Blanks with Different Thicknesses. Metals 2019, 9, 135. [Google Scholar] [CrossRef] [Green Version]
- Gautam, V.; Kumar, D.R. Experimental and numerical investigations on springback in V-bending of tailor-welded blanks of interstitial free steel. Proc. Inst. Mech. Eng. Part B J. Eng. Manuf. 2018, 232, 2178–2191. [Google Scholar] [CrossRef]
- Zhang, Y.; Lang, L.; Wang, Y.; Chen, H.; Du, J.; Jiao, Z.; Wang, L. Spring Back Behaviour of Large Multi-Feature Thin-Walled Part in Rigid-Flexible Sequential Loading Forming Process. Materials 2022, 15, 2608. [Google Scholar] [CrossRef]
- Liavoli, R.P.; Gorji, H.; Bakhshi-Jooybari, M.; Mirnia, M.J. Investigation on Formability of Tailor-Welded Blanks in Incremental Forming. Int. J. Eng. 2020, 33, 906–915. [Google Scholar] [CrossRef]
- Gautam, V.; Raut, V.M.; Kumar, D.R. Analytical prediction of springback in bending of tailor-welded blanks incorporating effect of anisotropy and weld zone properties. Proc. Inst. Mech. Eng. Part L J. Mater. Des. Appl. 2018, 232, 294–306. [Google Scholar] [CrossRef]
- Saito, M.; Nakazawa, Y.; Otsuka, K.; Yasuyama, M.; Tokunaga, M.; Yoshida, T.; Hiwatashi, S. Effect of Weld Line Direction on Tensile Deformation Behaviour—Development of Forming Technology for Tailor Welded Blank Application—2nd Report. Mater. Trans. 2020, 61, 1760–1766. [Google Scholar] [CrossRef]
- Sun, G.Y.; Tan, D.D.; Lv, X.J.; Yan, X.L.; Li, Q.; Huang, X.D. Multi-objective topology optimization of a vehicle door using multiple material tailor-welded blank (TWB) technology. Adv. Eng. Softw. 2018, 124, 106029. [Google Scholar] [CrossRef]
- Moayedi, H.; Darabi, R.; Ghabussi, A.; Habibi, M.; Foong, L.K. Weld orientation effects on the formability of tailor welded thin steel sheets. Thin-Walled Struct. 2020, 149, 106669. [Google Scholar] [CrossRef]
- Kahhal, P.; Jung, J.; Hur, Y.C.; Moon, Y.H.; Kim, J.H. Neural Network-Based Multi-Objective Optimization of Adjustable Drawbead Movement for Deep Drawing of Tailor-Welded Blanks. Materials 2022, 15, 1430. [Google Scholar] [CrossRef]
- Kong, X.; Chu, X.; Chen, C.; Wang, Y.; Liu, P.; Wang, Z. Comparative Investigation of the Experimental Determination of AA5086 FLCs under Different Necking Criteria. Materials 2021, 14, 3685. [Google Scholar] [CrossRef]
- Mahalle, G.; Kotkunde, N.; Gupta, A.K.; Singh, S.K. Cowper-Symonds Strain Hardening Model for Flow Behaviour Of Inconel 718 Alloy. Mater. Today-Proceeding 2019, 18, 2796–2801. [Google Scholar] [CrossRef]
- Mennecart, T.; Hassan, H.; Guner, A.; Khalifa, N.; Hosseini, M. Deep Drawing of High-Strength Tailored Blanks by Using Tailored Tools. Materials 2016, 9, 77. [Google Scholar] [CrossRef] [Green Version]
- Mooli, H.; Seeram, S.R.; Goteti, S.; Boggarapu, N.R. Optimal weld bead profiles in the conduction mode LBW of thin Ti-6Al-4V alloy sheets. AIMS Mater. Sci. 2021, 8, 698–715. [Google Scholar] [CrossRef]
- Kondo, M.Y.; Pinheiro, C.; Souza, J.V.C.; Ribeiro, M.V.; Alves, M.C.S. Optimizing cutting parameters for cutting power and roughness in VAT 32(R) turning with an experimental Al2O3-MgO ceramic tool using Taguchi’s method. Procedia CIRP 2018, 77, 610–613. [Google Scholar] [CrossRef]
- Sathishkumar, T.P.; Sathishkumar, S.; Bhuvaneshkumar, K.; Sanjay, M.R.; Siengchin, S. Crashworthiness characterization of jute fibre woven mat reinforced epoxy composite tube for structural application using Taguchi’s method. Int. J. Crashworthiness 2021, 1–17. [Google Scholar] [CrossRef]
- Guo, P.F.; Wang, X.Z.; Han, Y.S. The enhanced genetic algorithms for the optimization design. In Proceedings of the 3rd International Conference on Biomedical Engineering and Informatics, Yantai, China, 16–18 October 2010; pp. 2990–2994. [Google Scholar] [CrossRef]
- Ding, C.C.; Chen, L.; Zhong, B.R. Exploration of intelligent computing based on improved hybrid genetic algorithm. J. Netw. Softw. Tools Appl. 2019, 22, S9037–S9045. [Google Scholar] [CrossRef]
- Zhang, J.M. The application research of genetic algorithm. In Proceedings of the 3rd International Workshop on Materials Engineering & Computer Sciences, Jinan, China, 27–28 January 2018; Volume 78, pp. 138–141. [Google Scholar] [CrossRef]
- Lilinc, M.; Caicedo, J.M. Finding Plausible Optimal Solutions in Engineering Problems Using an Adaptive Genetic Algorithm. Adv. Civ. Eng. 2019, 20, 7475156. [Google Scholar] [CrossRef]
- Nautiyal, L.; Shivach, P.; Ram, M. Optimal designs by means of genetic algorithms. In Soft Computing Techniques and Applications in Mechanical Engineering; IGI Global: Hershey, PA, USA, 2018; pp. 151–161. [Google Scholar] [CrossRef]
- Kusztelak, G.; Lipowski, A.; Kucharski, J. Population Symmetrisation in Genetic Algorithms. Appl. Sci. 2022, 12, 5426. [Google Scholar] [CrossRef]
- Yan, C.; Li, M.X.; Liu, W. Application of Improved Genetic Algorithm in Function Optimization. J. Inf. Sci. Eng. 2019, 35, 1299–1309. [Google Scholar] [CrossRef]


Publisher’s Note: MDPI stays neutral with regard to jurisdictional claims in published maps and institutional affiliations. |
© 2022 by the authors. Licensee MDPI, Basel, Switzerland. This article is an open access article distributed under the terms and conditions of the Creative Commons Attribution (CC BY) license (https://creativecommons.org/licenses/by/4.0/).