Abstract
This research paper aims to improve the quality of 3D printed parts made of the wax filament by implementing the Taguchi orthogonal array process optimization method. The manufactured parts can be used as cost-effective investment casting patterns. With the Taguchi method, it was concluded that the nozzle temperature has the most effect on the dimensional accuracy of printed parts. In addition, thermal, mechanical, and rheological characterization were performed on the wax filament, revealing several important findings. For instance, the rheological studies identified the low viscosity of melted wax at printing temperatures. This resulted in the rough surface of the printed parts. To improve the surface roughness, a post-processing procedure was implemented using a white spirit as a surface smoothing agent.
1. Introduction
Additive Manufacturing (AM) has proved to be a great technology for manufacturing 3D objects that can serve many purposes such as prototypes, fully functional parts, educational tools, or tools that facilitate other types of manufacturing technologies. In particular, AM has been significantly developed to be implemented in the investment casting (IC) industry during the last decades. When AM is used to produce the patterns for metal casting, the manufacturing process is referred to as rapid investment casting or RIC. Munich et al. [1] mentioned eight types of commercially available AM technologies that are used to produce either wax or non-wax patterns for IC. Among those methods, FDM technology is of particular interest for it is a low-cost and widely available method. Additional advantages include the larger build plate and simplicity of the manufacturing process. During the manufacturing process, a wire of plastic/filament is melted and immediately deposited on a flat platform, creating a cross-sectional feature of an intended object. The process is continuously repeated, and layers build upon layers, creating a solid object. The capabilities of FDM technology to produce IC patterns have been studied extensively. Different materials, such as general plastics and wax-based filaments, are available in the market to be used as patterns for RIC. Among non-wax materials, the acrylonitrile butadiene styrene (ABS) showed better performance due to a superior surface finish compared to wax filament [2]. The advantage of using non-wax material is in the superior mechanical properties that prevent the pattern from failing during handling or transportation [3,4]. Nevertheless, several downsides have been identified when using non-wax Rapid Prototyping (RP) patterns. They include large thermal expansion during pattern burnout, leading to ceramic shell cracking, and a higher amount of residual ash [5,6,7,8]. Moreover, the gases generated from burning non-wax patterns significantly contaminate the mold material, which in turn affects the casting quality. As far as the critical pattern burnout temperature is concerned, when using non-wax patterns, the ceramic shell cracking occurs when the pattern reaches its glass transition temperature (Tg), according to Wang et al. [6]. For ABS, the Tg is around 100 °C [9,10] with a melting temperature (Tm) ranging from 200 to 240 °C. From the physical properties of the ABS filament, it is evident that the burnout procedure is the only proper means of removing the pattern from the ceramic mold. In such a case, the material has a negative environmental effect due to wastage and high energy consumption.
As for wax-based filaments, the first materials were developed in the 1990s by Stratasys and had the commercial names ICW04 and MW01. In 1994, Comb et al. designed several experiments aiming to modify the composition of wax filaments by mixing wax-based materials ICW04 and MW01 with plastic formulations to improve physical and mechanical properties [11]. In addition, the authors briefly describe how the two factorial designs were implemented to analyze the effect of printing and envelope temperatures on the surface quality of manufactured parts. Although the study contains meaningful information on the material’s properties, the study is void of important details on printability, dimensional accuracy, and surface roughness of parts made of castable wax. The other mention of wax-based FDM material can be found in the review work done by Cheah et al. in 2005 [4], where the wax filament was described as a material having inferior mechanical properties. Table 1 summarizes the recent works on the application of FDM technology in IC.

Table 1.
Latest publications on the application of FDM technology in IC.
Considering the current market, a list of commercially available “made for casting” filament products with some characteristics is shown in Table 2.
Table 2.
Commercially available castable FDM filaments.
To the authors’ best knowledge, the reports on the effectiveness of the commercial FDM waxes listed in Table 2 are unavailable, except for the MoldLay. In 2019, Wang et al. performed a topology optimization of a RIC pattern using the MoldLay wax filament [18]. Among several drawbacks associated with 3D printing wax, a low solidification of material and layer curling were identified as the major downsides. As can be seen from Table 1, most of the castable filaments have printing/melting temperatures much higher than the melting temperature of traditional waxes used in IC. For example, the traditional IC waxes have a range of melting temperatures of 60–100 °C. Nevertheless, it can be argued that the Wax3D having a Tm around 100 °C makes it a potentially better candidate to be used in RIC. Moreover, when working with the material, it has been noticed that it has a low viscosity in its molten state, which is beneficial for the dewaxing process. As for mechanical properties, the filament has shown high flexibility and softness. Due to low tensile strength and elastic modulus, the manufacturing process is associated with challenges related to finding proper process parameters. Therefore, having considered all the properties of the wax-based FDM filament, the authors found it necessary to identify the optimal process parameters that can result in the successful manufacturing of RIC patterns. To achieve the goal, an Orthogonal Array (OA) L9 Taguchi optimization method was implemented with a focus on achieving higher dimensional accuracy. Higher-dimensional accuracy along with low surface roughness are two main requirements established for IC patterns. Thus, in addition to dimensional accuracy optimization, the appropriate surface treatment was selected. The research concludes with the work dedicated to finding the mechanical, rheological, and thermal properties of the wax filament.
2. Experimental Procedure
2.1. Materials and Equipment
Commercially available Wax3D filament (“Filamentarno”, Moscow, Russia) was used as a filament wire with ø1.75 mm. The melting temperature is 95 °C, as identified with a dropping point test. The material is of blue color. For 3D printing specimens, a Prusa I3 FDM machine (Prusa Research, Prague, Czech Republic) was used.
2.2. Printing Process Parameter Optimization by Taguchi Analysis
It has been revealed that many of the properties of Wax3D filament are significantly different from the regular plastics used in FDM manufacturing. Therefore, this circumstance necessitates a search for optimal process parameters for manufacturing wax patterns using an FDM machine. In our case, it was decided to optimize the process parameters for a better dimensional accuracy of printed parts, since dimensional accuracy is considered as the main requirement for IC patterns. Among existing process optimization tools that were previously successfully applied for the FDM process, Taguchi’s parametric design of the experiment proved to be a popular approach, according to Omar et al. [19]. Although the amount of research conducted on improving the FDM process parameters is immense, most of the works are limited to general plastics such as PLA or ABS, as was pointed out by Omar et al. [19]. As for the wax-based material having a soft nature and low Tm, little to no studies can be found in scientific reports regarding their 3D printing process parameter optimization. Thus, it is important for engineers and manufacturers to know about important process parameters that affect the quality of objects produced using such materials.
In Taguchi’s method, the so-called Orthogonal Array (OA) fractional factorial design is used to create a design matrix with a selected subset of combinations containing numerous factors at several levels. By performing experiments with suggested combinations, one can identify the significant parameters and choose the optimal combination of parameters’ levels that yield the desired outcome. One of the key benefits of using Taguchi’s method is that it allows for the number of experiments to be minimized significantly. Based on Taguchi’s design, nine experiments were needed to investigate the influence of three parameters with three control levels. As for the parameters, the layer thickness, nozzle temperature, and extrusion velocity were chosen, as shown in Table 3. From Table 3, it can be noticed that the tested temperatures were between 105 and 115 °C. This is because printing at lower temperatures increases the possibility of emerging issues such as delamination and weak bed adhesion. On the other hand, 3D printing above 115 °C causes frequent nozzle clog due to heat creep. Similarly, the preliminary experiments showed that the extrusion velocity of values higher than 60 mm/s makes the interlayer bonding weaker due to the quick solidification of the deposited layers. As for layer thickness, the values below 0.2 mm increase the chance of nozzle clogging. The layer thickness above 0.3 mm leads to inferior surface quality.
Table 3.
Selected parameters and levels for Taguchi analysis.
A Minitab software was used to perform the calculations of the Taguchi analysis. It should be noted that the FDM process has a considerable number of controllable parameters to choose from and, therefore, it is difficult to select the most important factors for designing the experiment. To identify the list of parameters, the preliminary work was done through 3D printing numerous simple geometry samples and studying the literature on the subject. The geometry chosen for the analysis was a cube with dimensions of 20 × 20 × 20 mm (L × W × H). Other important printing parameters which were kept constant were:
- -
- bed temperature, 65 °C;
- -
- wall count, 2;
- -
- top/bottom walls, 4;
- -
- the nozzle diameter, 0.4 mm; and
- -
- infill pattern, concentric with 80% fill.
The dimensions were measured using a digital caliper with an error of ±20 µm. The measured sides were height H (z print direction) and width W (x print direction). In total, 27 parts were manufactured and for each experiment, the average of deviations of three samples was recorded. The values for the average, standard deviations, and range are shown in Table 4.
Table 4.
The results of measurements taken from 3D printed 20 × 20 × 20 mm parts.
As far as a signal-to-noise (S/N) ratio is concerned, “the lower the better” response was chosen because the preference is to have a low dimensional deviation. By finding the S/N ratio, it is possible to identify the effect of input parameters on the responses. Equation (1) was used to find the S/N ratio as follows:
here, n is the number of repetitions and y is the characteristic under consideration. The calculated S/N ratio values are shown in Table 5.
Table 5.
Calculated S/N ratio values.
To identify the degree of importance of each parameter for three corresponding outputs, the analysis of variance (ANOVA) statistical tool was implemented. The significance of factors can be supported by calculated p values. A threshold value for p was chosen as 0.05, indicating that any factor’s p-value higher than this number can render it as insignificant.
2.3. Characterization
2.3.1. Thermal
The thermogravimetric (TGA) and differential scanning calorimetry (DSC) analyses were performed using simultaneous DSC-TG analyzer STA 6000 from Perkin Elmer (Waltham, MA, USA). The sample was heated from 25 °C to 600 °C at a rate of 10 °C/min. As a flowing agent, Nitrogen at a 20 mL/min flow rate was applied. Curves such as heat flow/temperature and weight loss/temperature were obtained.
2.3.2. Mechanical
To estimate the mechanical properties of the Wax3D printed part, five tensile samples were manufactured and tested according to ASTM D638. The values of Ultimate Tensile Strength (UTS) and Young’s Modulus were calculated. The specimens were 3D printed with 100% infill using a concentric infill pattern with layers aligned parallel to the load axes. A Tinius Olsen H25KS (Tinius Olsen, Ltd., Salfords, UK) tensile machine was used with a constant rate of 5 mm/min.
2.3.3. Rheological
A modular compact rotational rheometer MCR 102 from Anton Paar was used to perform rheological characterization with a set of 50 mm cone-plate measuring systems. To identify the limits of the linear viscoelastic region, strain sweeps up to 10% were performed. After that, a frequency sweep test took place with an angular frequency range of 100 to 0.1 rad/s at a constant amplitude of 5%. The 5% value is within the viscoelastic region, as was identified during the small amplitude oscillatory shear (SAOS) test. The found values are storage and loss moduli, as well as the complex viscosity. A time-temperature superposition method was also used to find values at higher and lower shear rates, taking 110 °C as a reference temperature.
3. Results and Discussion
3.1. Taguchi Analysis Results
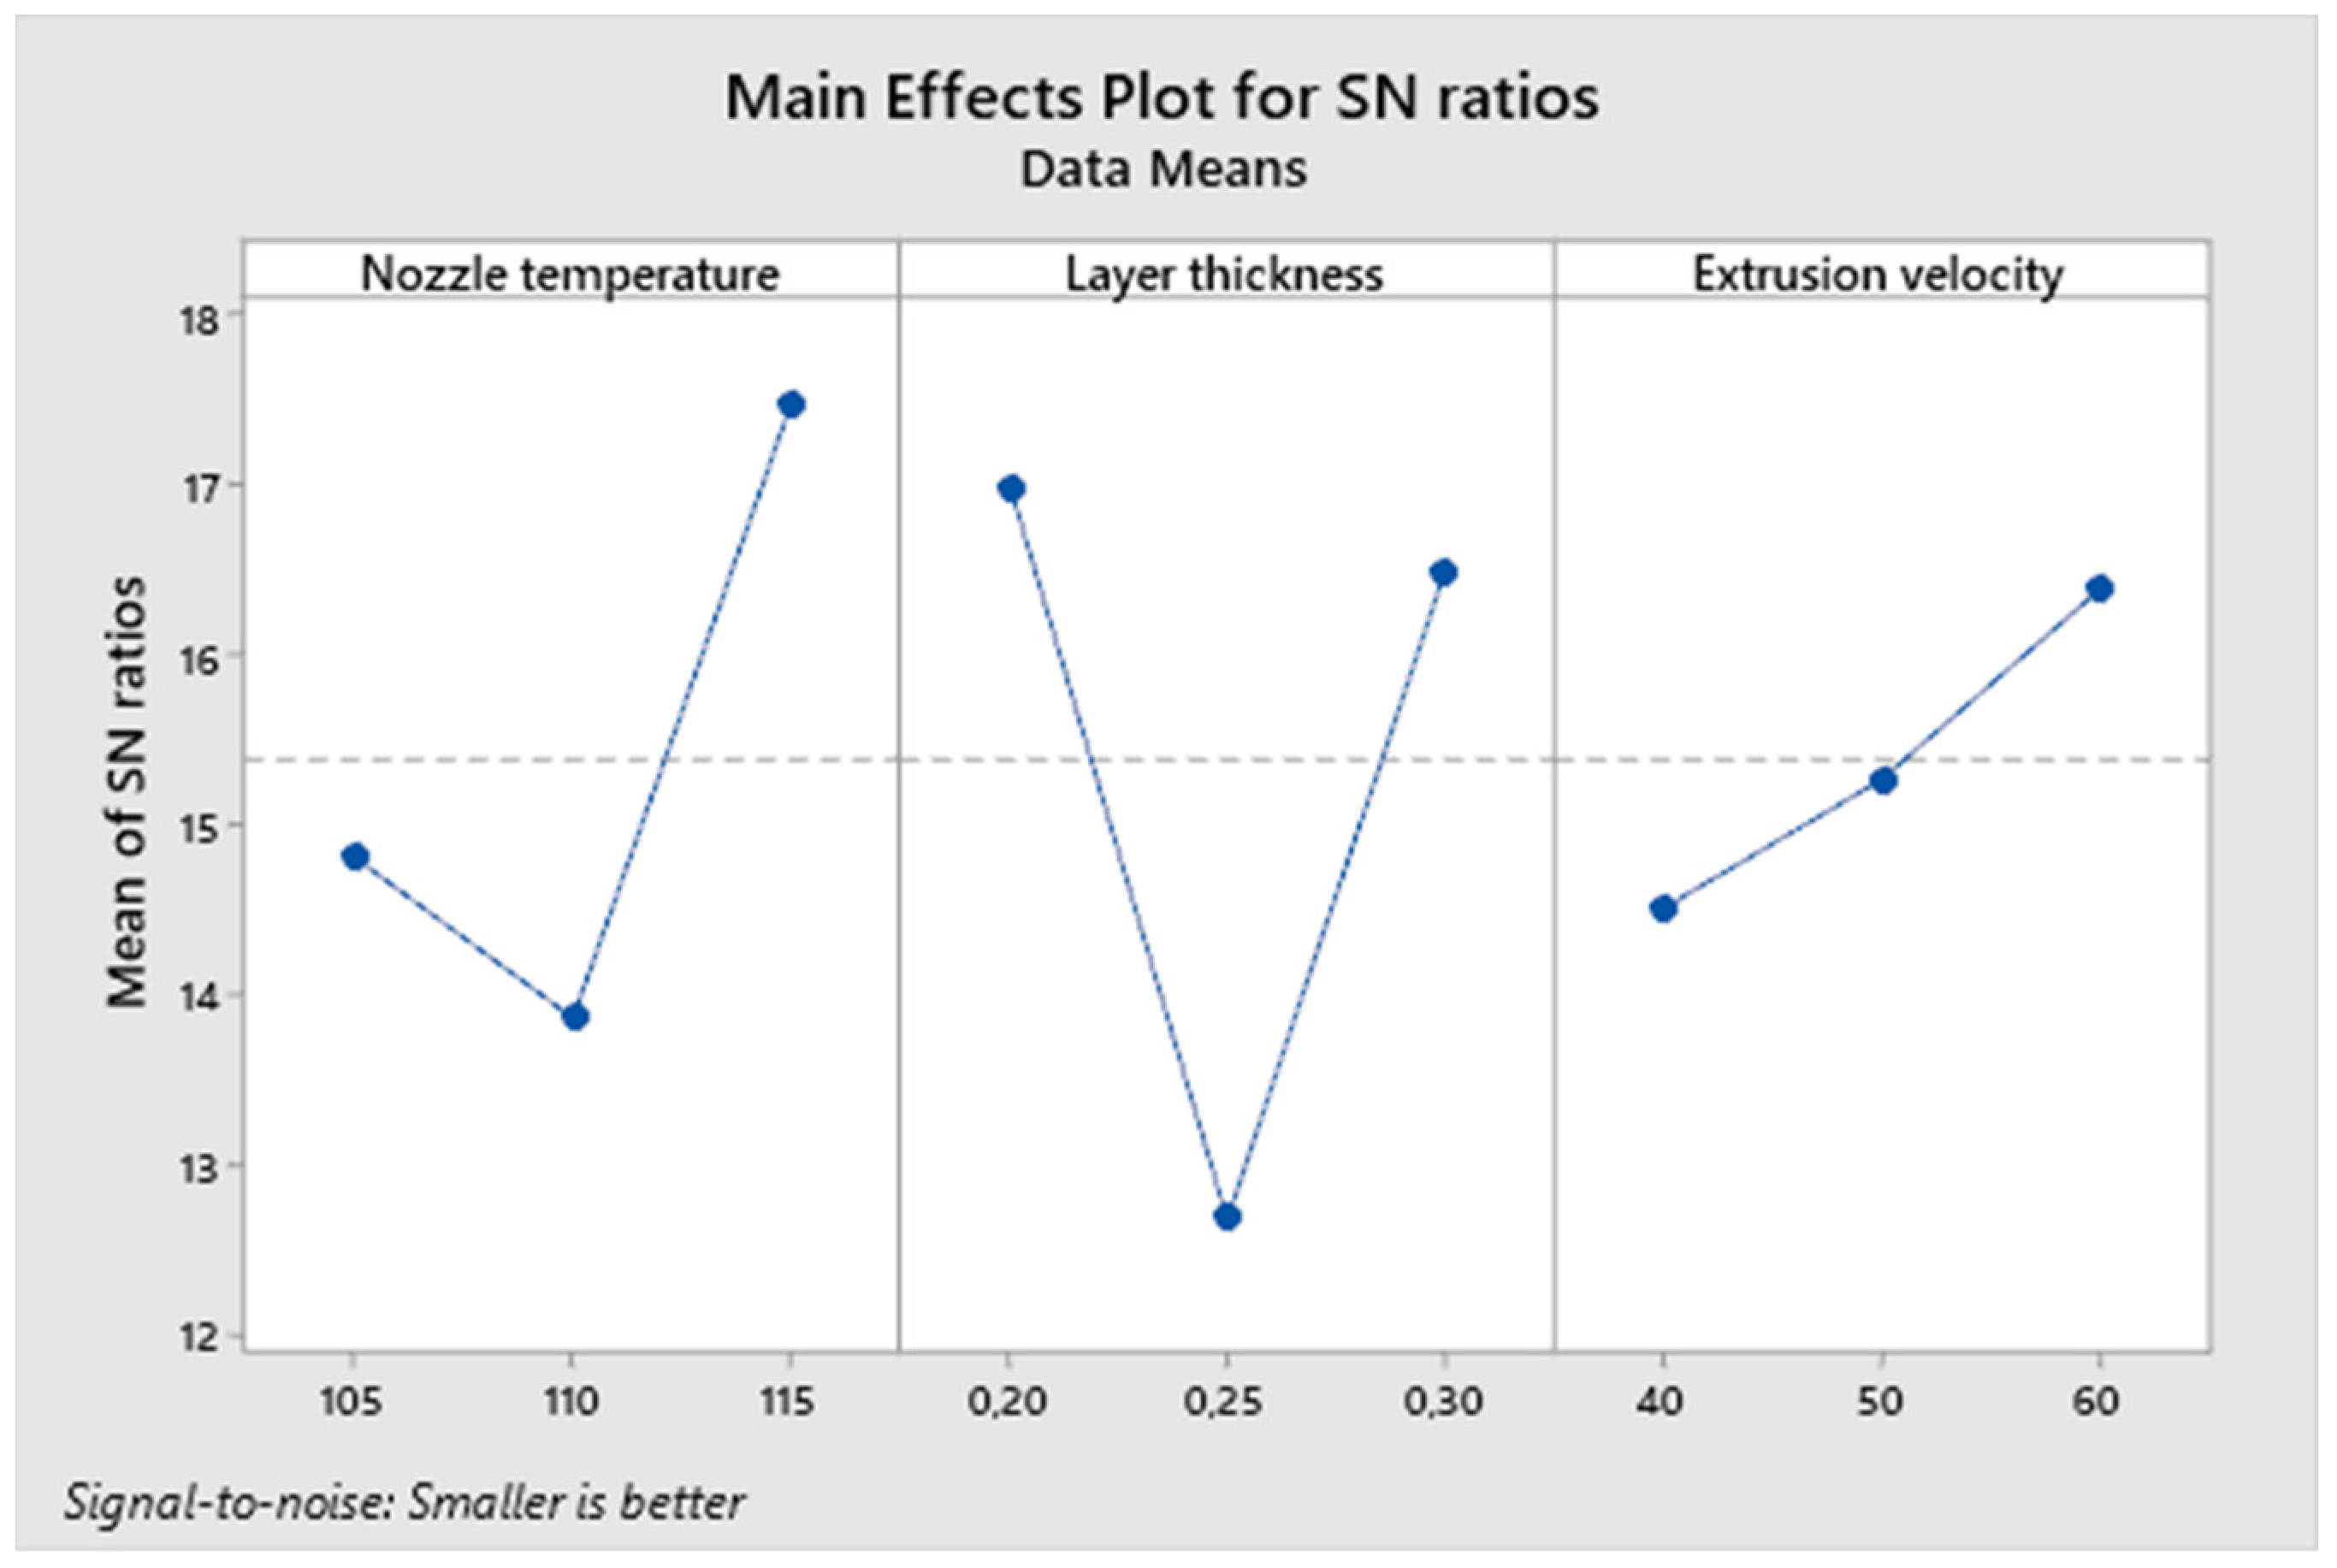
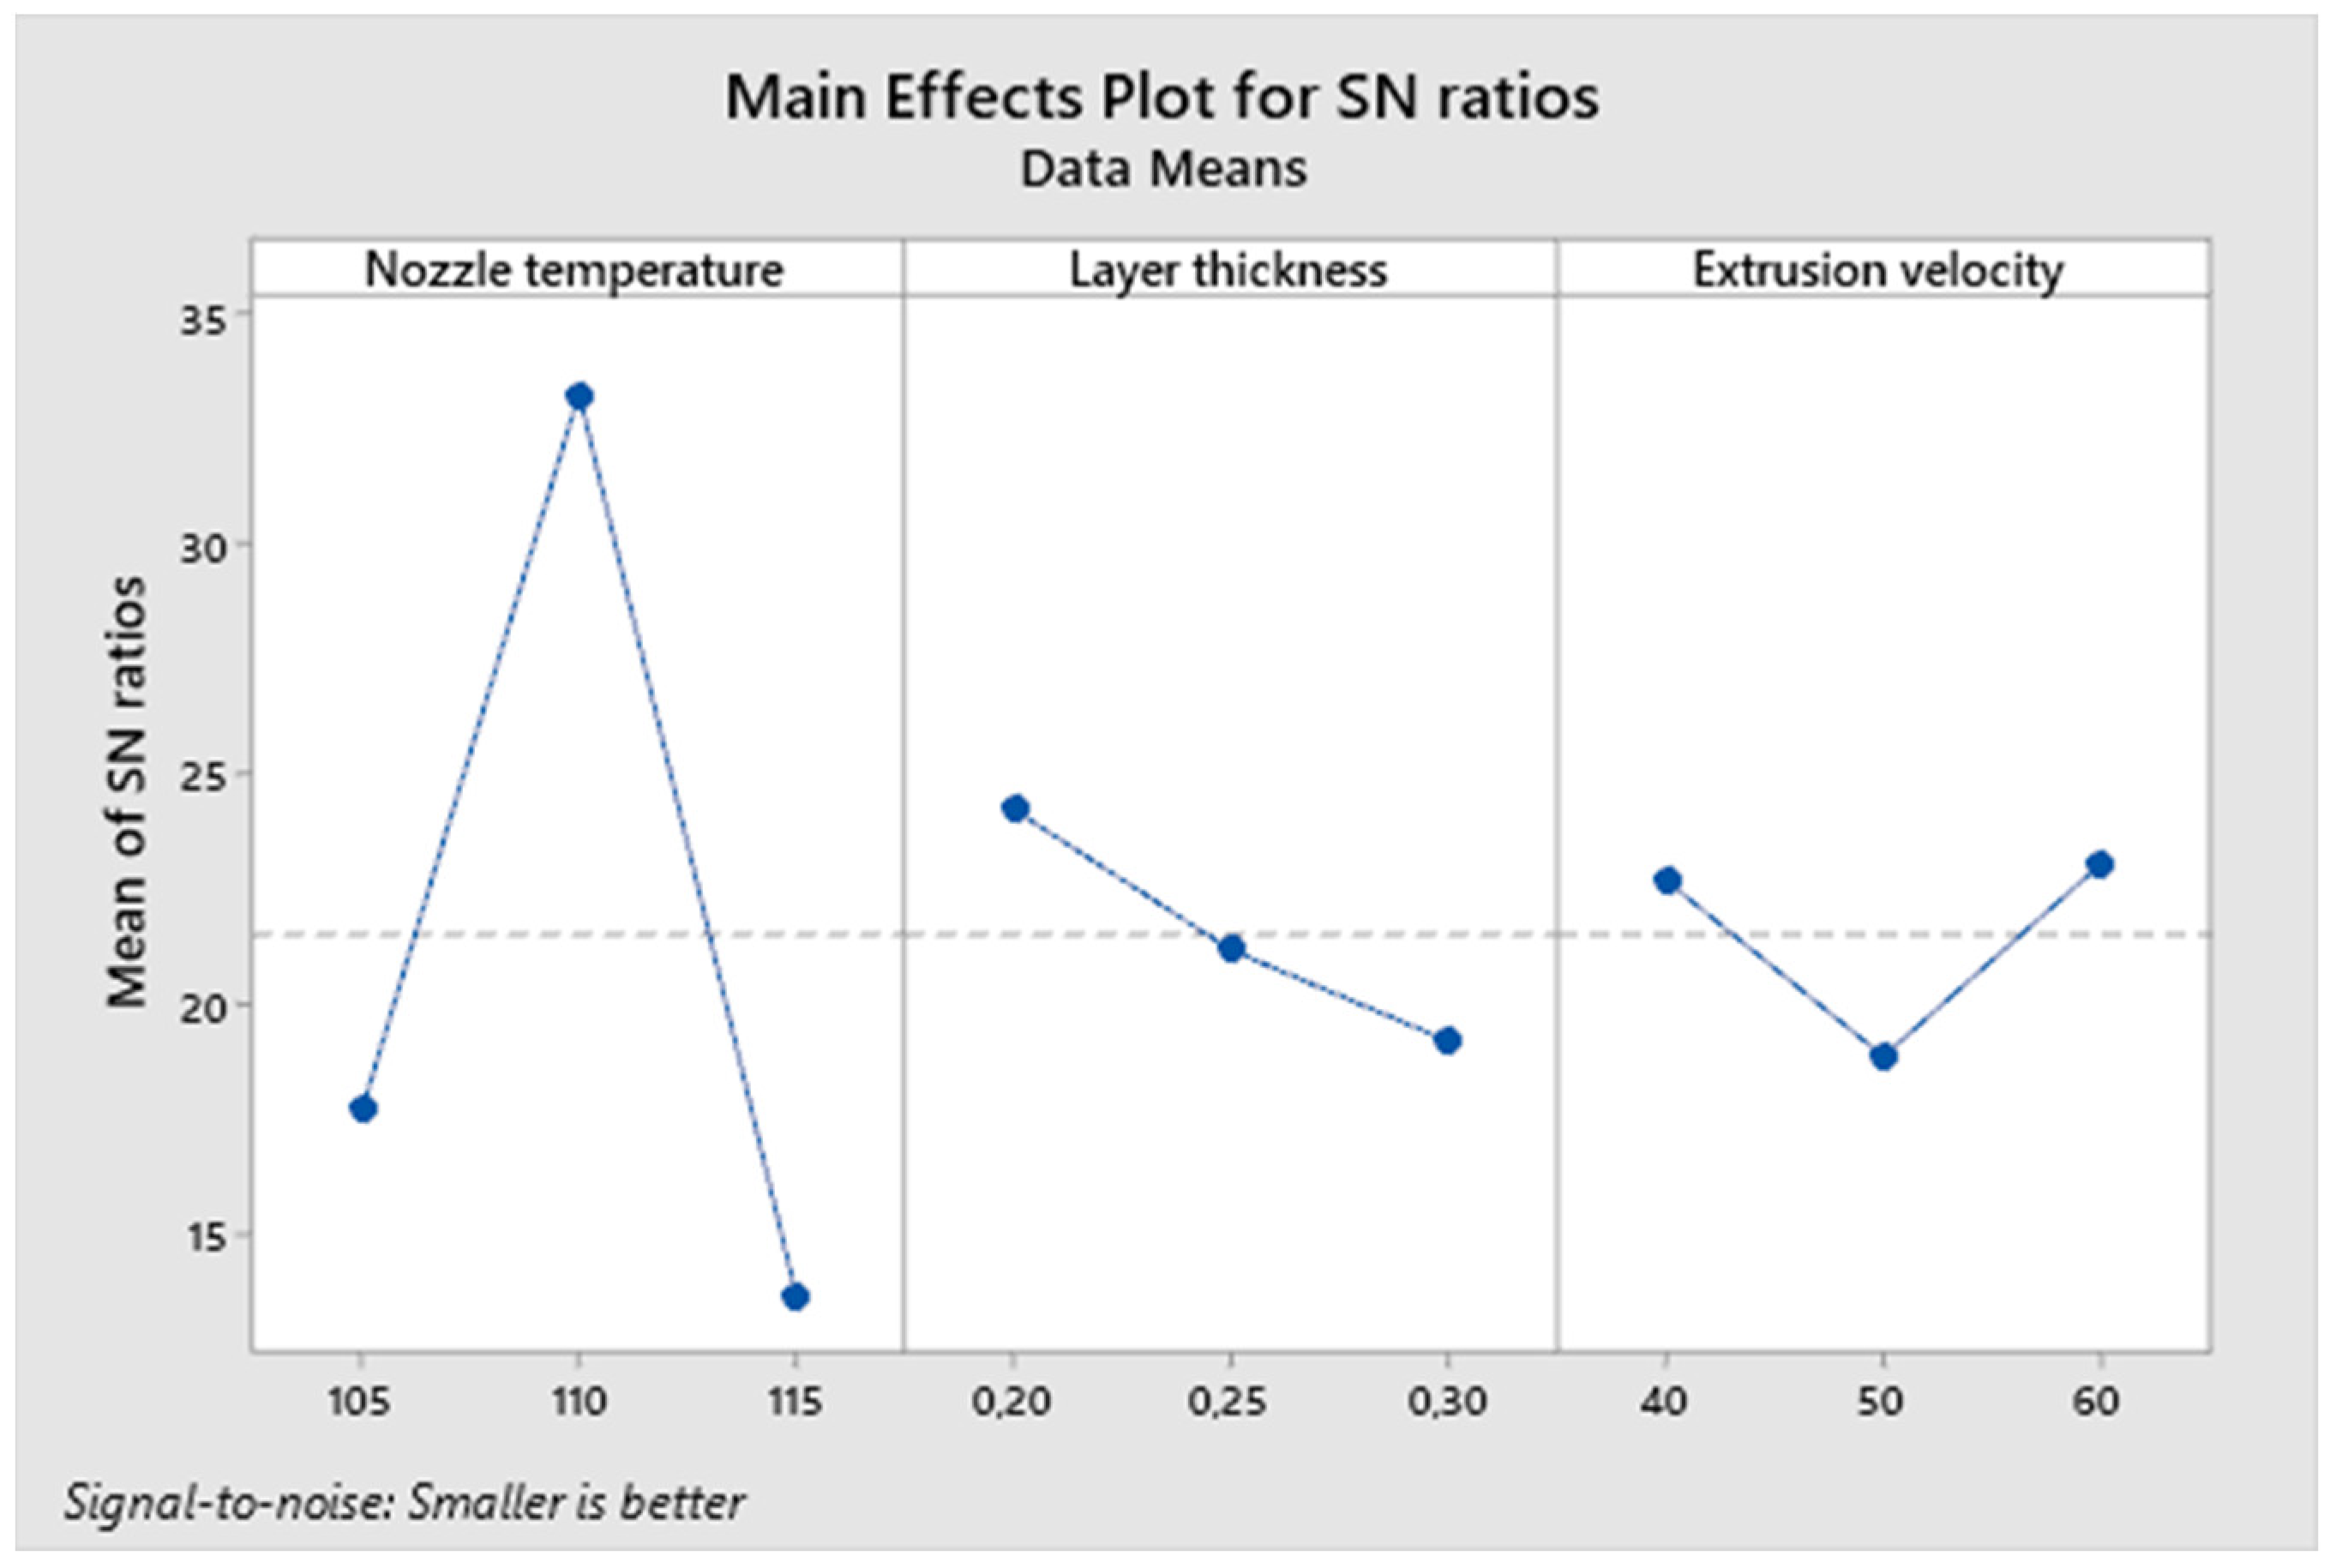
The Taguchi OA process optimization analysis revealed several important findings. The main effect plots for the S/N ratio are shown in Figure 1 and Figure 2. It is clear from the main effect plots that the dimensional accuracy in the horizontal direction is mostly influenced by the nozzle temperature, whereas the accuracy in the vertical direction depends on the layer thickness. The ANOVA analysis results in Table 6 and Table 7 show that with a high confidence level of p = 0.022, the dimensional accuracy in the horizontal direction is influenced by printing temperature, and 110 °C is the optimal value. As for the influence level of the rest of the factors, the high values of the p number suggest their small effect on the output. It is worth highlighting that supported by the Taguchi analysis, thermal and rheological characterization have helped to find the optimal temperature, which is equal to 110 °C.
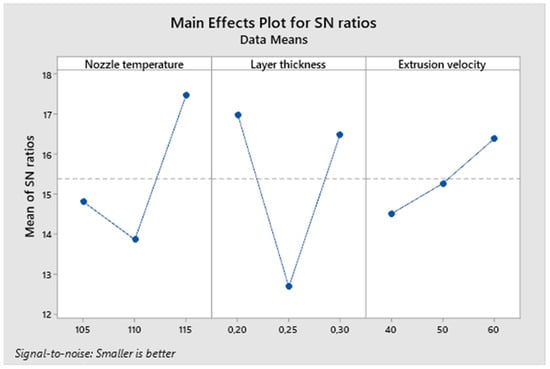
Figure 1.
Main effects plot for S/N regarding part’s height accuracy.
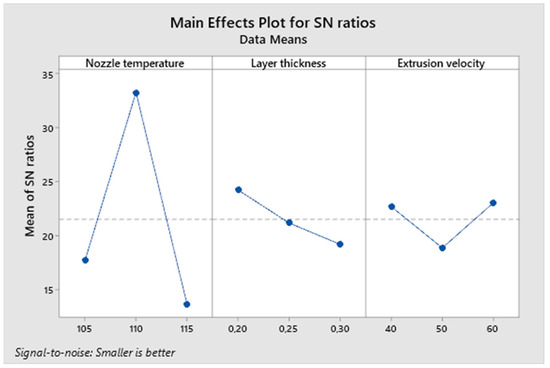
Figure 2.
Main effects plot for S/N regarding part’s width accuracy.
Table 6.
ANOVA results for part’s height accuracy.
Table 7.
ANOVA results for part’s width accuracy.
3.2. Thermal Analysis of Wax3D
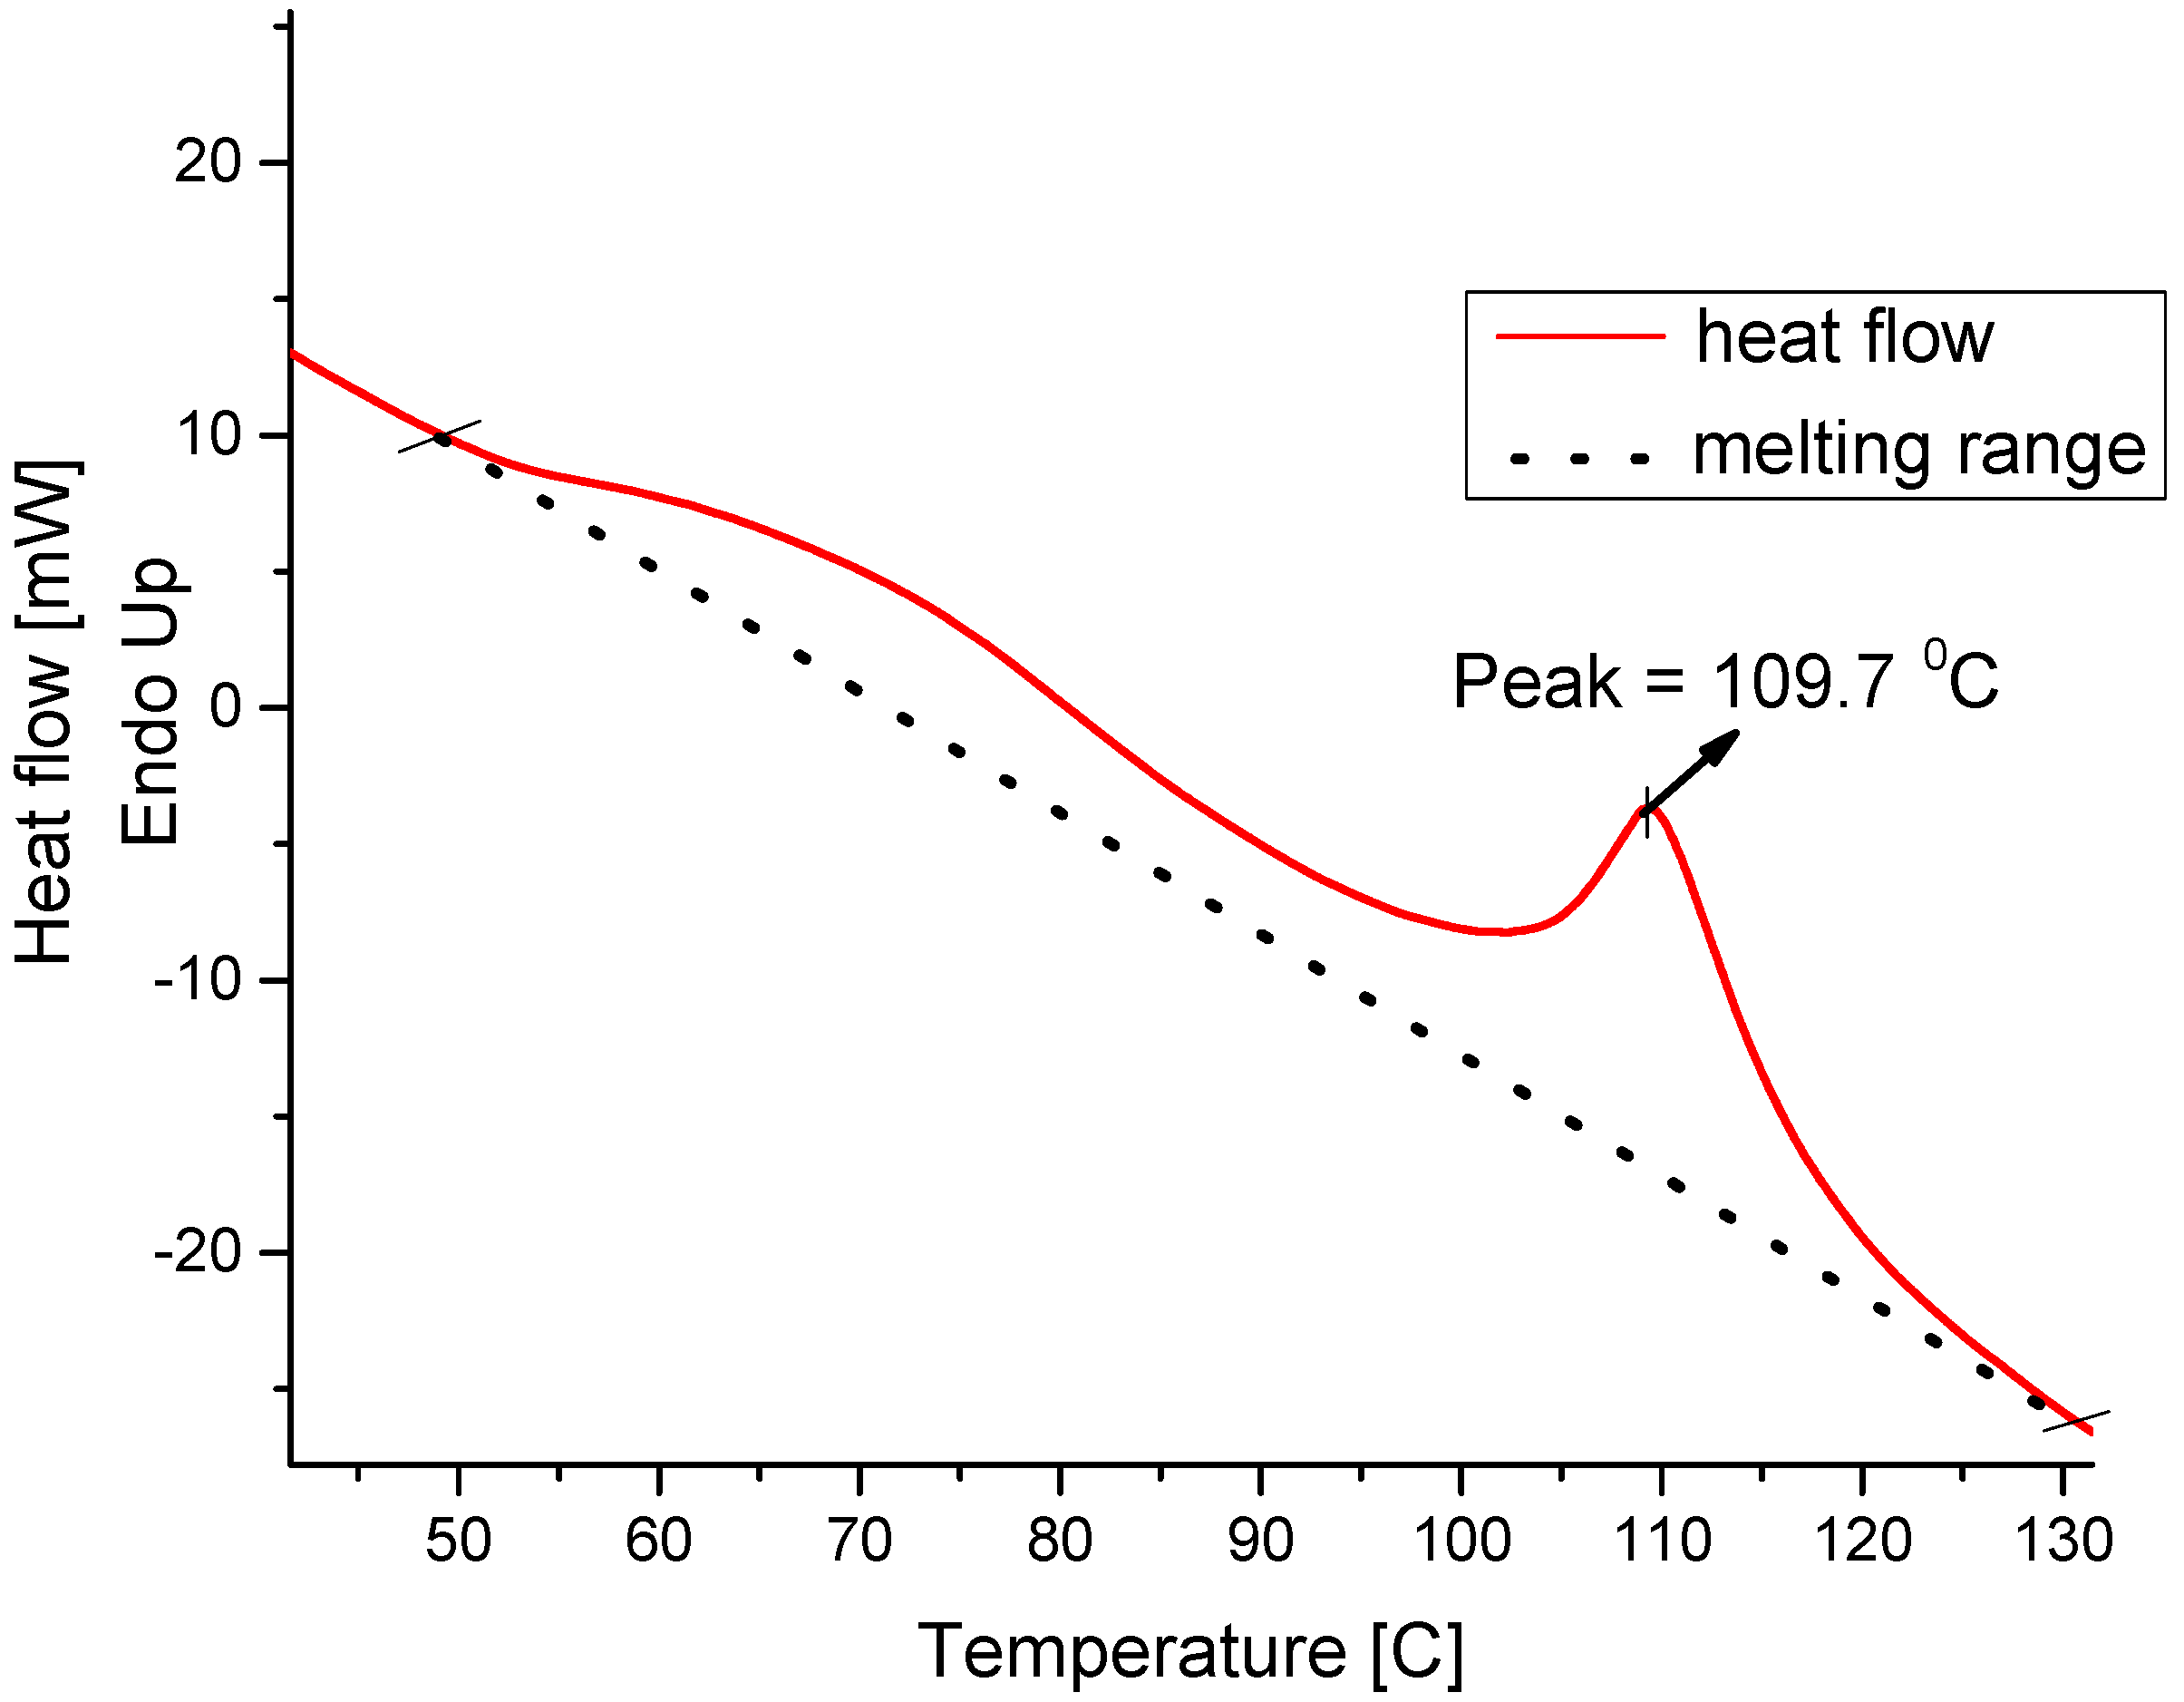
The DSC is one of the most effective analytical tools for wax and other polymer materials that helps to identify thermal properties such as melting point and glass transition temperature. A DSC curve shown in Figure 3 for the Wax3D filament indicates the presence of a melting range starting at 46 and ending at 130 °C. This is most probably due to the fact that the Wax3D represents a blend of different waxes. Nevertheless, a distinguishable peak can be observed at 110 °C. It is interesting to note that the Taguchi optimization method results have shown the printing temperature of 110 °C to be an optimal value for better dimensional accuracy. In addition, it is evident that such broad melting point ranges are similar to those found in polyethylene-based waxes [20]. Thus, a high probability exists that the Wax3D has polyethylene in its content. Polyethylene waxes can have higher hardness and melting points depending on the crystallinity level, according to Glenda Webber [20].
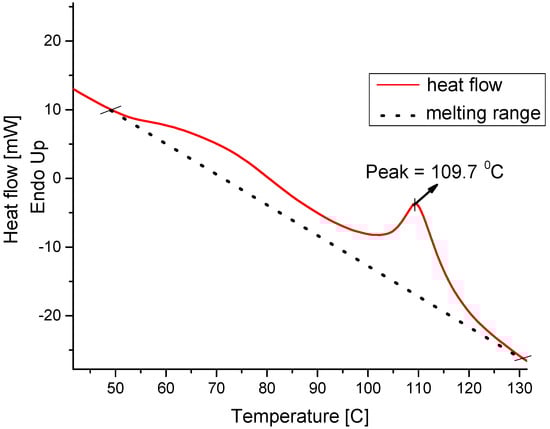
Figure 3.
DSC curve for Wax3d filament.
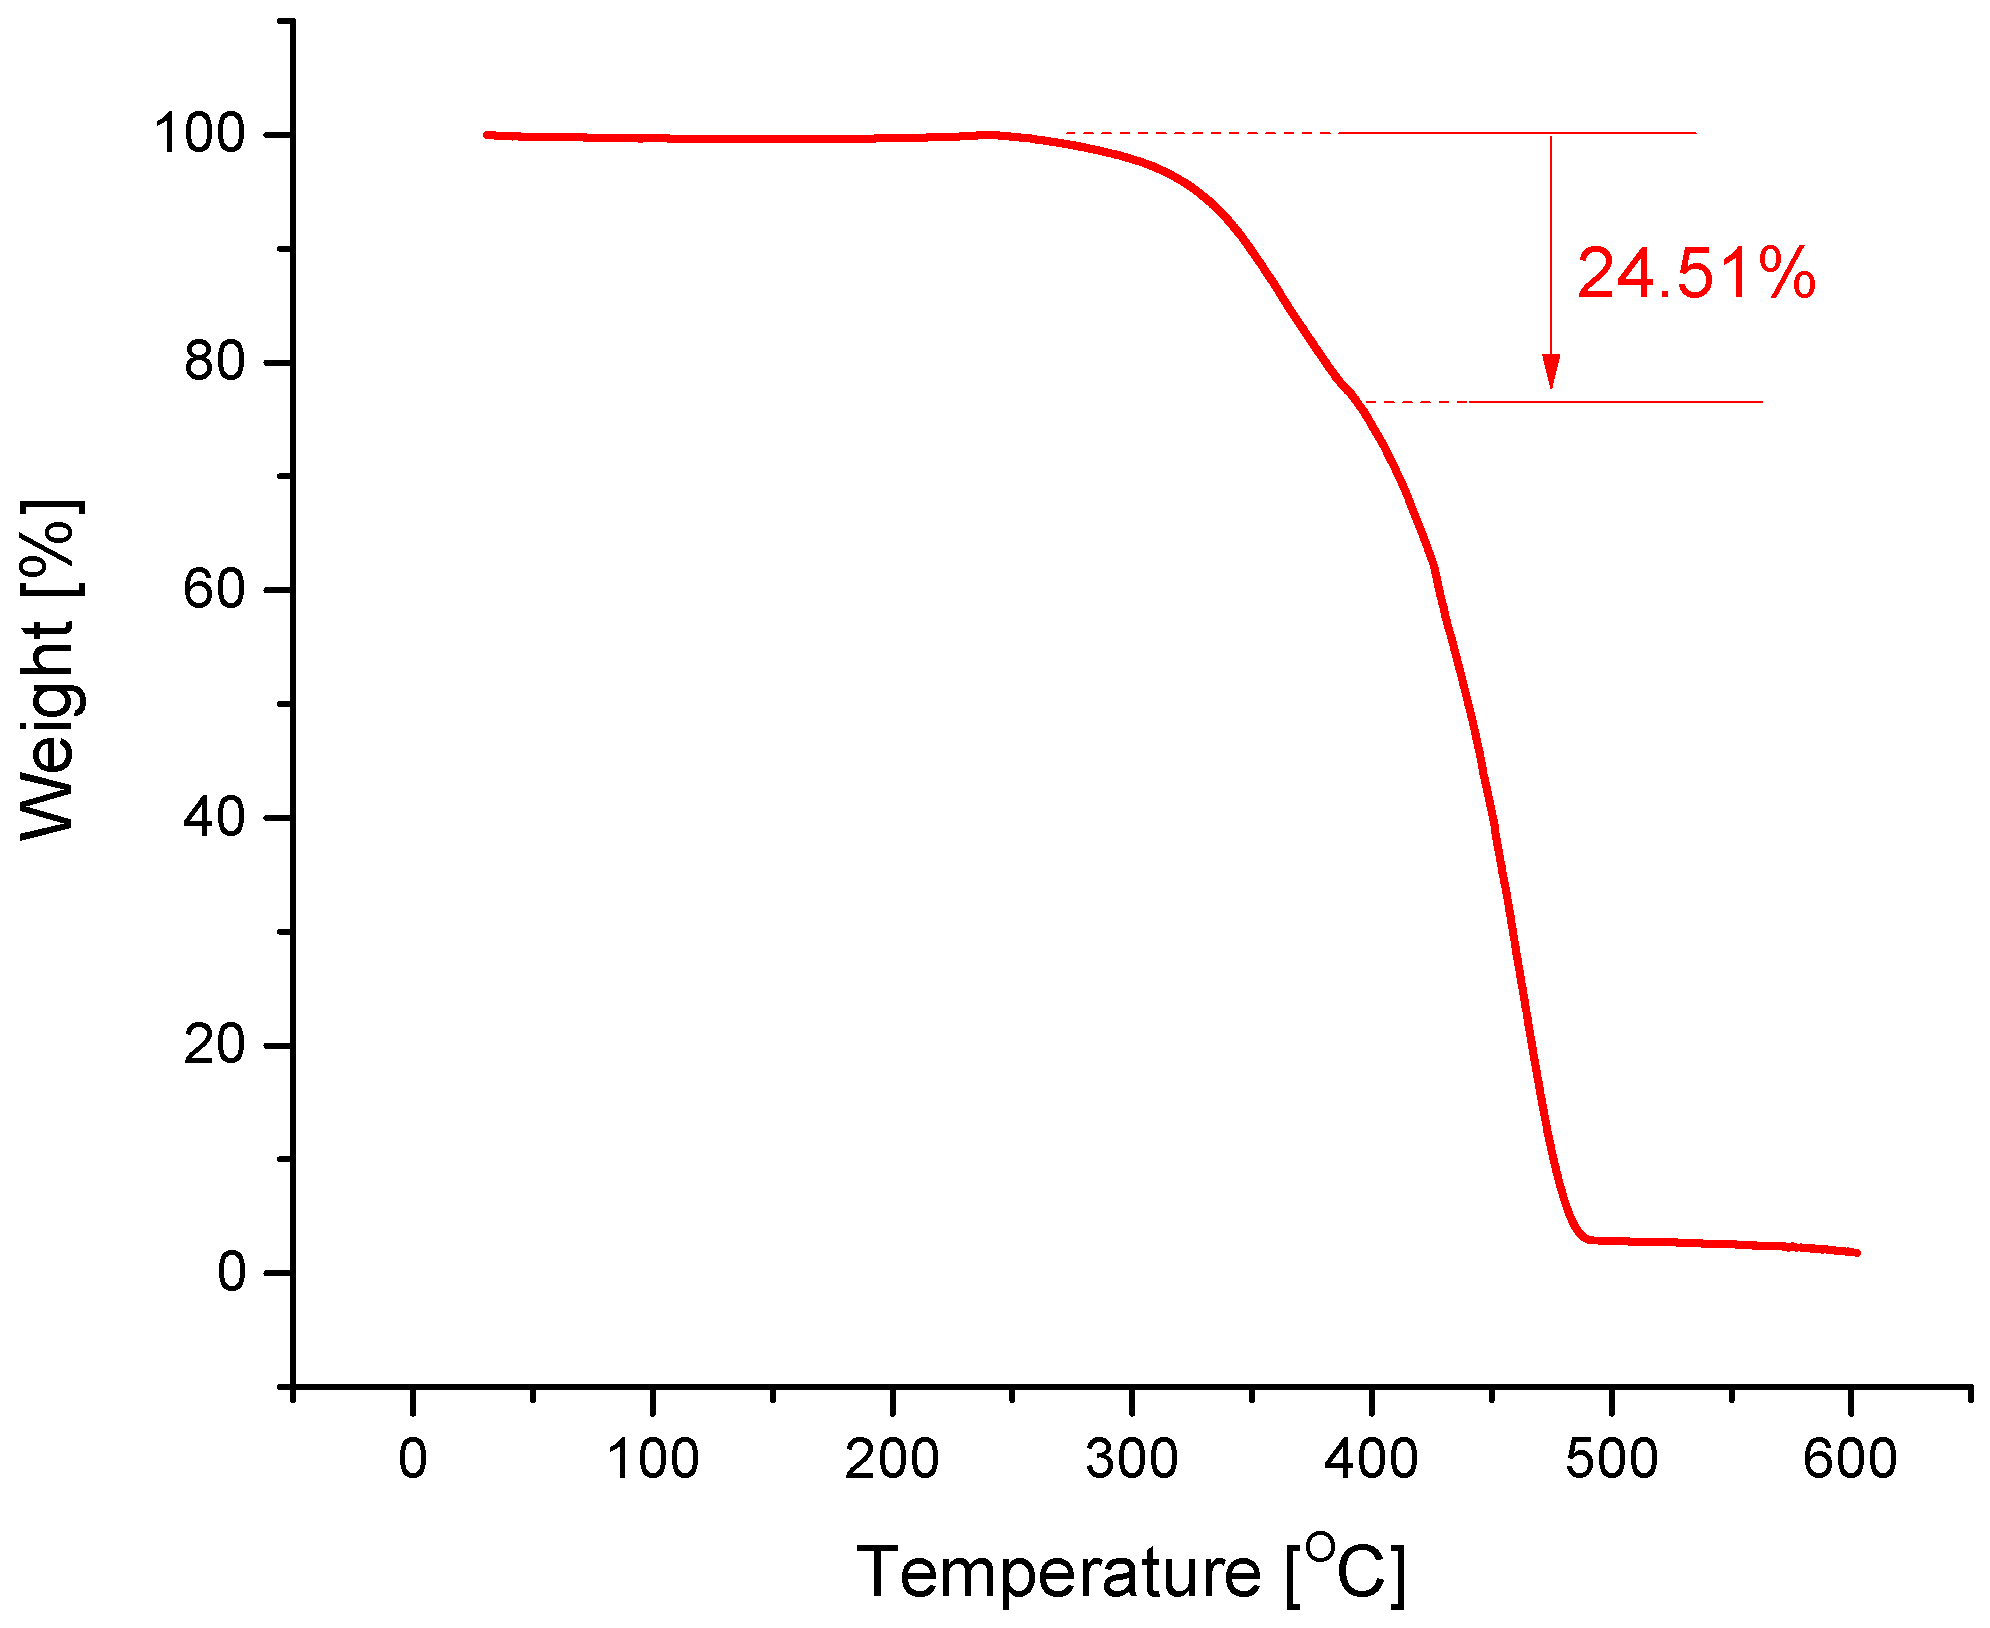
The TGA weight loss curve is presented in Figure 4. The temperature of 0.5% material decomposition at 327.2 °C for Wax3D is shown in Table 8. A non-apparent two-stage degradation pattern is observed, and the degradation start of low molecular weight components can be identified during the first step of degradation. From the analysis results, the wax filament may be polyethylene-based synthetic composite wax due to similarities found in the works of Gill et al. [21] and Glenda Webber [20]. For example, Glenda Webber performed DSC analyses on several commercial HDPE waxes and found melting temperature ranges that are very close to what was found in the current research.

Figure 4.
Thermogravimetric analysis curves of Wax3D filament.
Table 8.
Values obtained from TGA.
3.3. Mechanical Properties of Wax3D
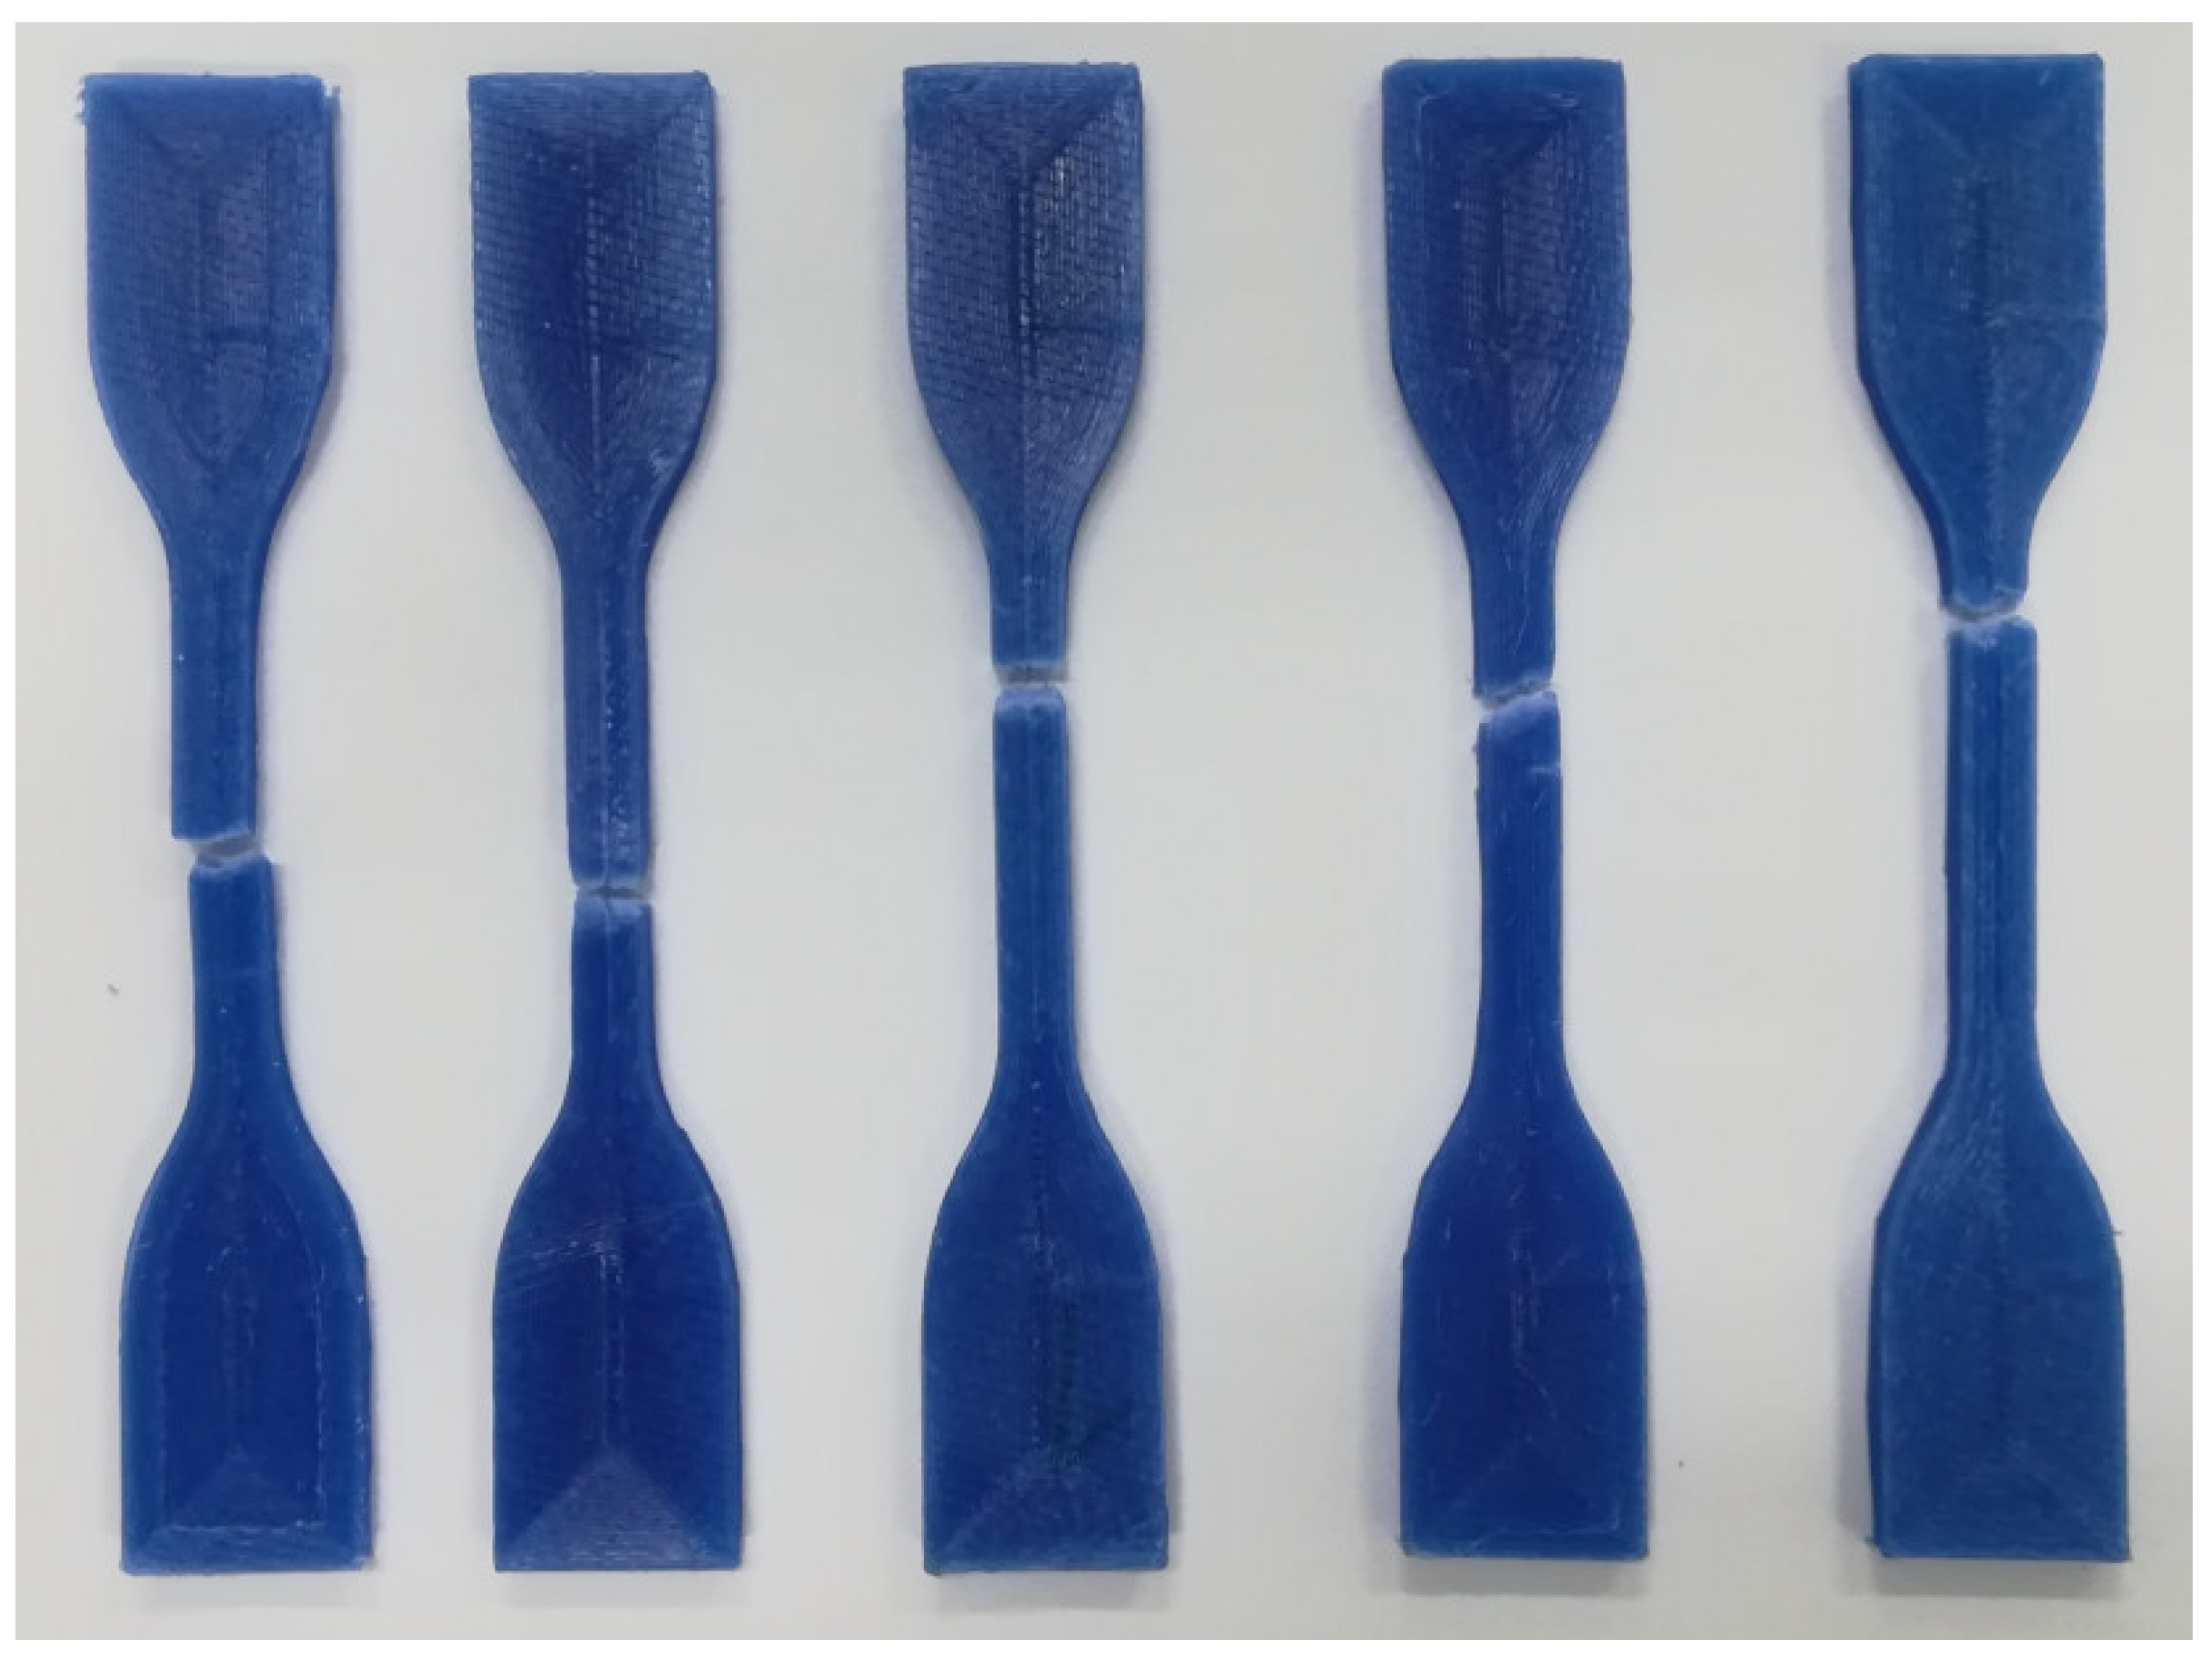
The results of the tensile strength test are shown in Table 9. It has been indicated that the Wax3D has tensile strength and Young’s modulus considerably lower compared to general 3D printing plastics such as PLA and ABS. For example, Adrian et al. [22] reported the UTS for PLA and ABS plastics to be close to 55 and 42 MPa, respectively. As for Young’s moduli, the values were found to be 1.94 (PLA) and 1.49 GPa (ABS). By comparing the data, we can see that the commonly used FDM plastics exceed the values of the wax filament by around 20 times in tensile strength and 10 times in modulus of elasticity. This means that both advantages and drawbacks can be found when working with the Wax3D filament. For instance, low elasticity is advantageous for avoiding ceramic shell cracking. On the other hand, the challenge exists when manufacturing parts with thin sections. Nonetheless, it should be noted that the strength of popular IC wax such as B140 is inferior to Wax3D, having a UTS value equal to 0.98 MPa [23]. The tested Wax3D specimens representing almost brittle failure mode are shown in Figure 5, and the average nominal strain at break was found to be 11.42%.
Table 9.
The UTS and Young’s modulus for Wax3D samples.
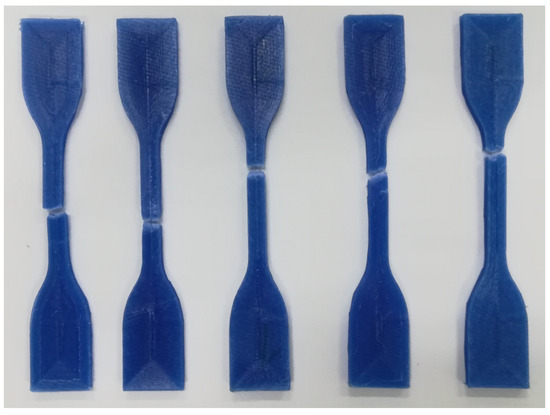
Figure 5.
Fractured tensile samples of Wax3D.
3.4. Rheological Characteristics of Wax3D
According to Gilmer et al. [24], the polymer melts may undergo a shear rate that may exceed 500 s−1 during the extrusion stage. Thus, the molten wax was exposed to shear rates between 100 and 0.1 s−1, and time-temperature superposition was applied to extend the shear rate boundaries from 0.01 to 1000 s−1. The reference temperature was chosen to be 110 °C because it is the optimal printing temperature, according to Taguchi’s analysis.
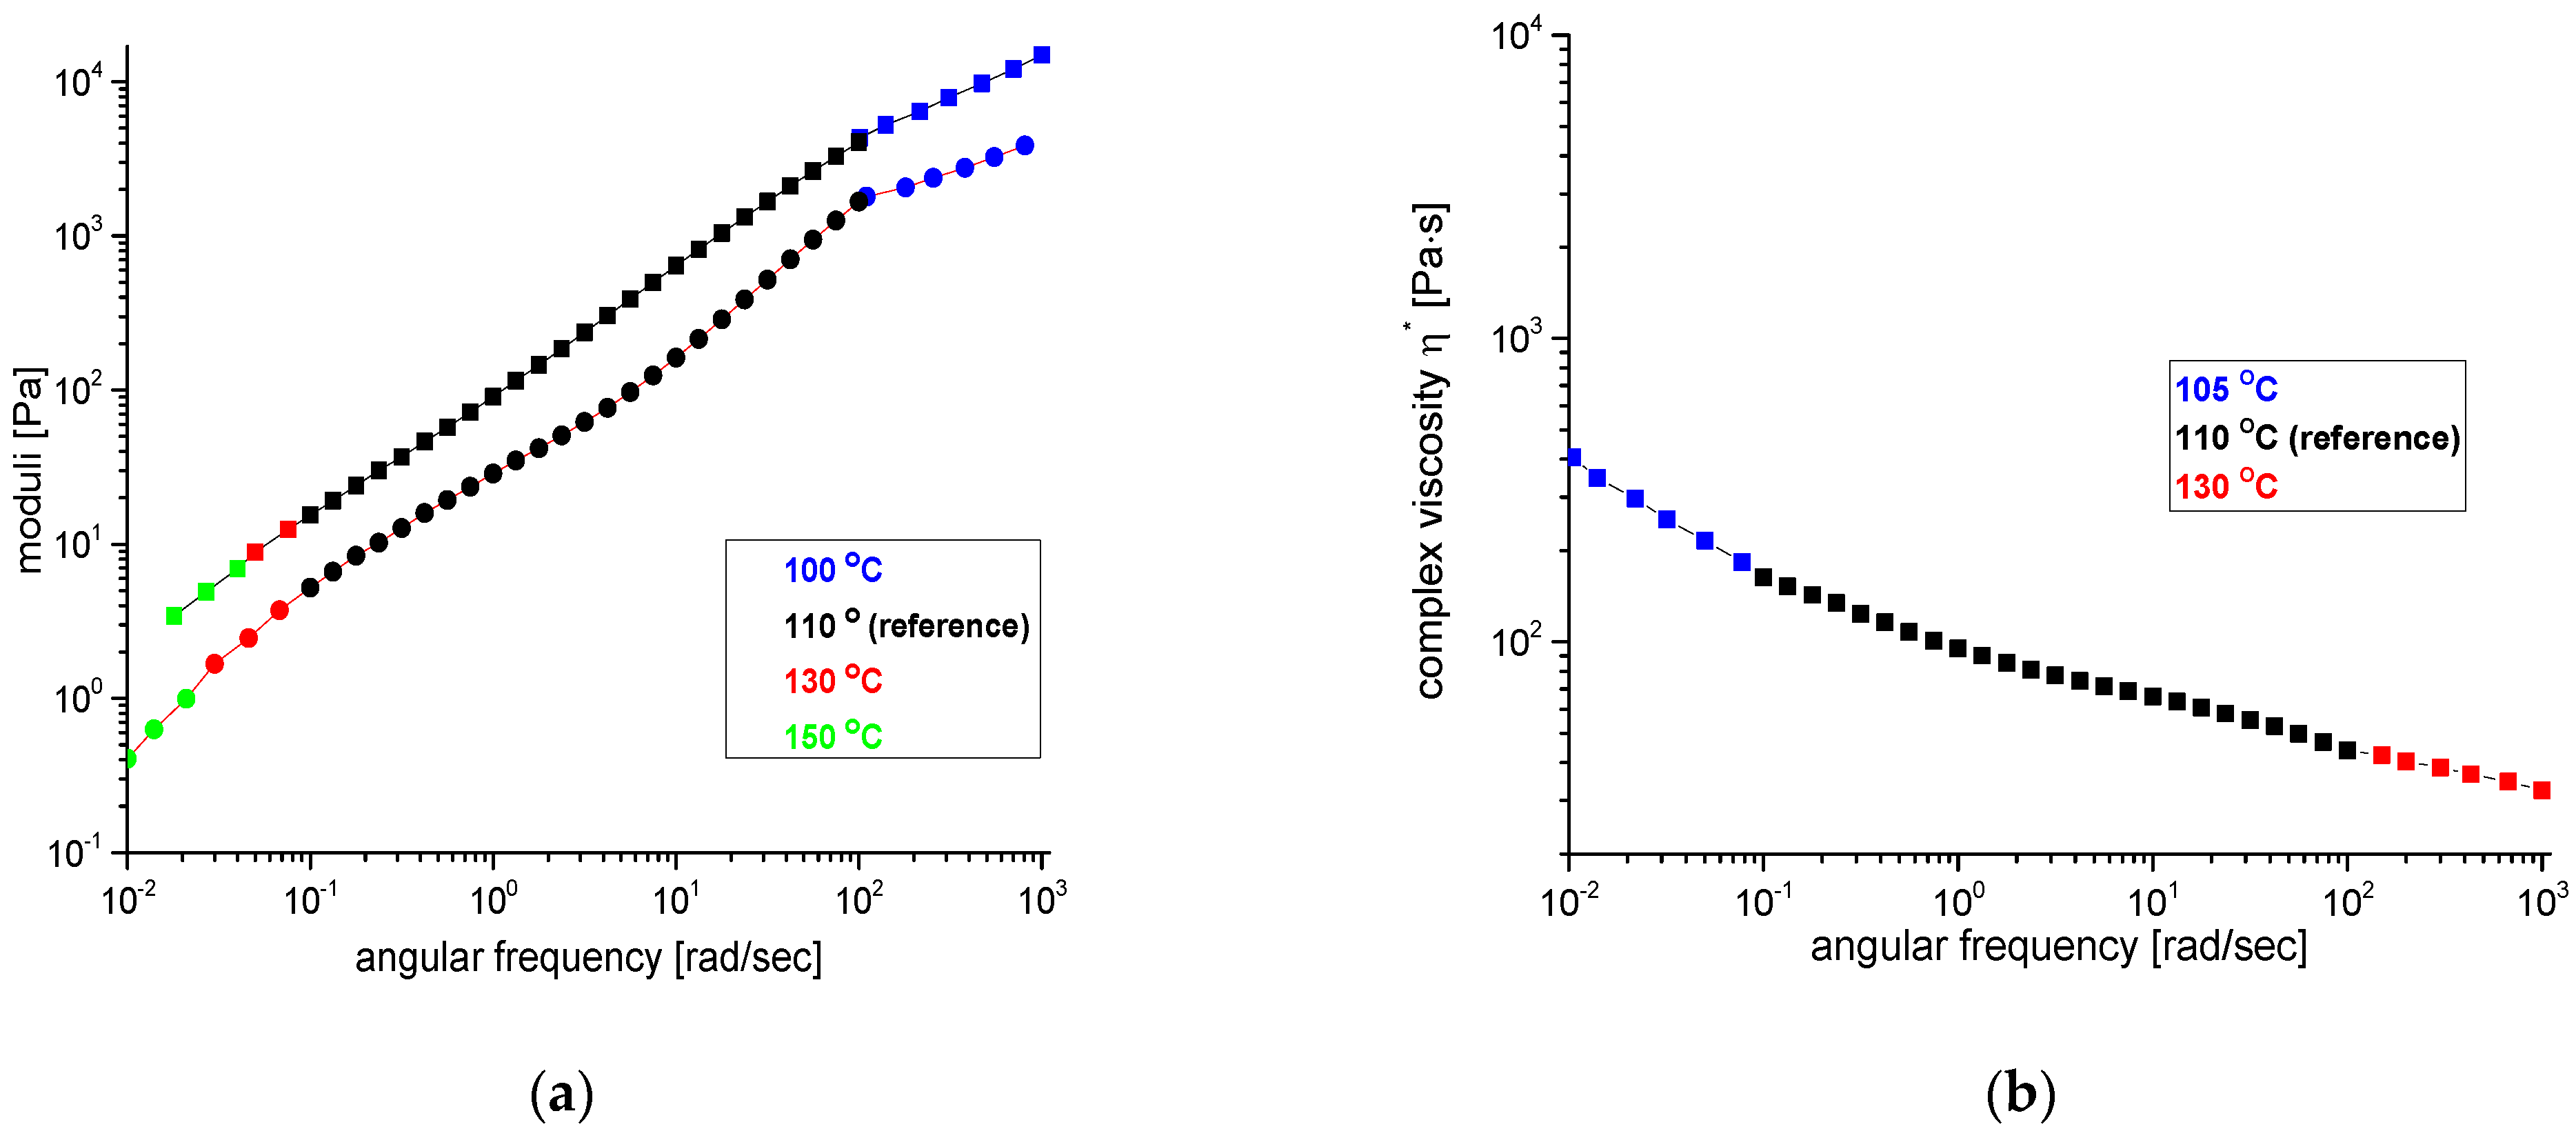
As was pointed out by Arit et al. [25], the SAOS test is extensively used to analyze the rheological properties of extrudates at shear rates close to zero. At a stage when an extrudate was just deposited on the print bed, it experiences a low shear rate that may cause some amount of deformation. Thus, the extrudate must have a sufficient level of viscosity to withstand large form distortions. The frequency sweep test results for Wax3D are shown in Figure 6.
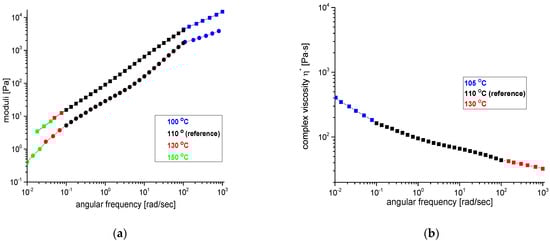
Figure 6.
(a) Loss (rectangles) and storage (circles) moduli and (b) complex viscosity values. Time-temperature superposition was applied to a temperature range from 100 to 150 °C.
From Figure 6a, it is evident that the material behaves more like viscous liquid at low shear rates, since the viscous modulus is higher than the elastic modulus G″ > G′. According to Figure 6b, the complex viscosity (η*) values of the Wax3D are within 44 and 163 Pa·s. In contrast, Gianluca et al. [26] found that within the same range of angular frequency, the η* values for PLA are in the range of 1000 and 3000 Pa·s. Likewise, the elastic and storage moduli of PLA can be one order of magnitude larger than the Wax3D [26]. The test results also showed that between 130 and 150 °C, the viscosity values are quite low and, therefore, the pattern made from this material can be dewaxed using autoclave boilers that are used extensively in the traditional IC industry. Thus, the 3D printed wax patterns can be introduced to the traditional IC process without modifying the technological sequence. However, the low viscosity and moduli values are probably the primary reasons for the printed parts to have high surface roughness values.
4. Post-Processing for Surface Roughness Improvement
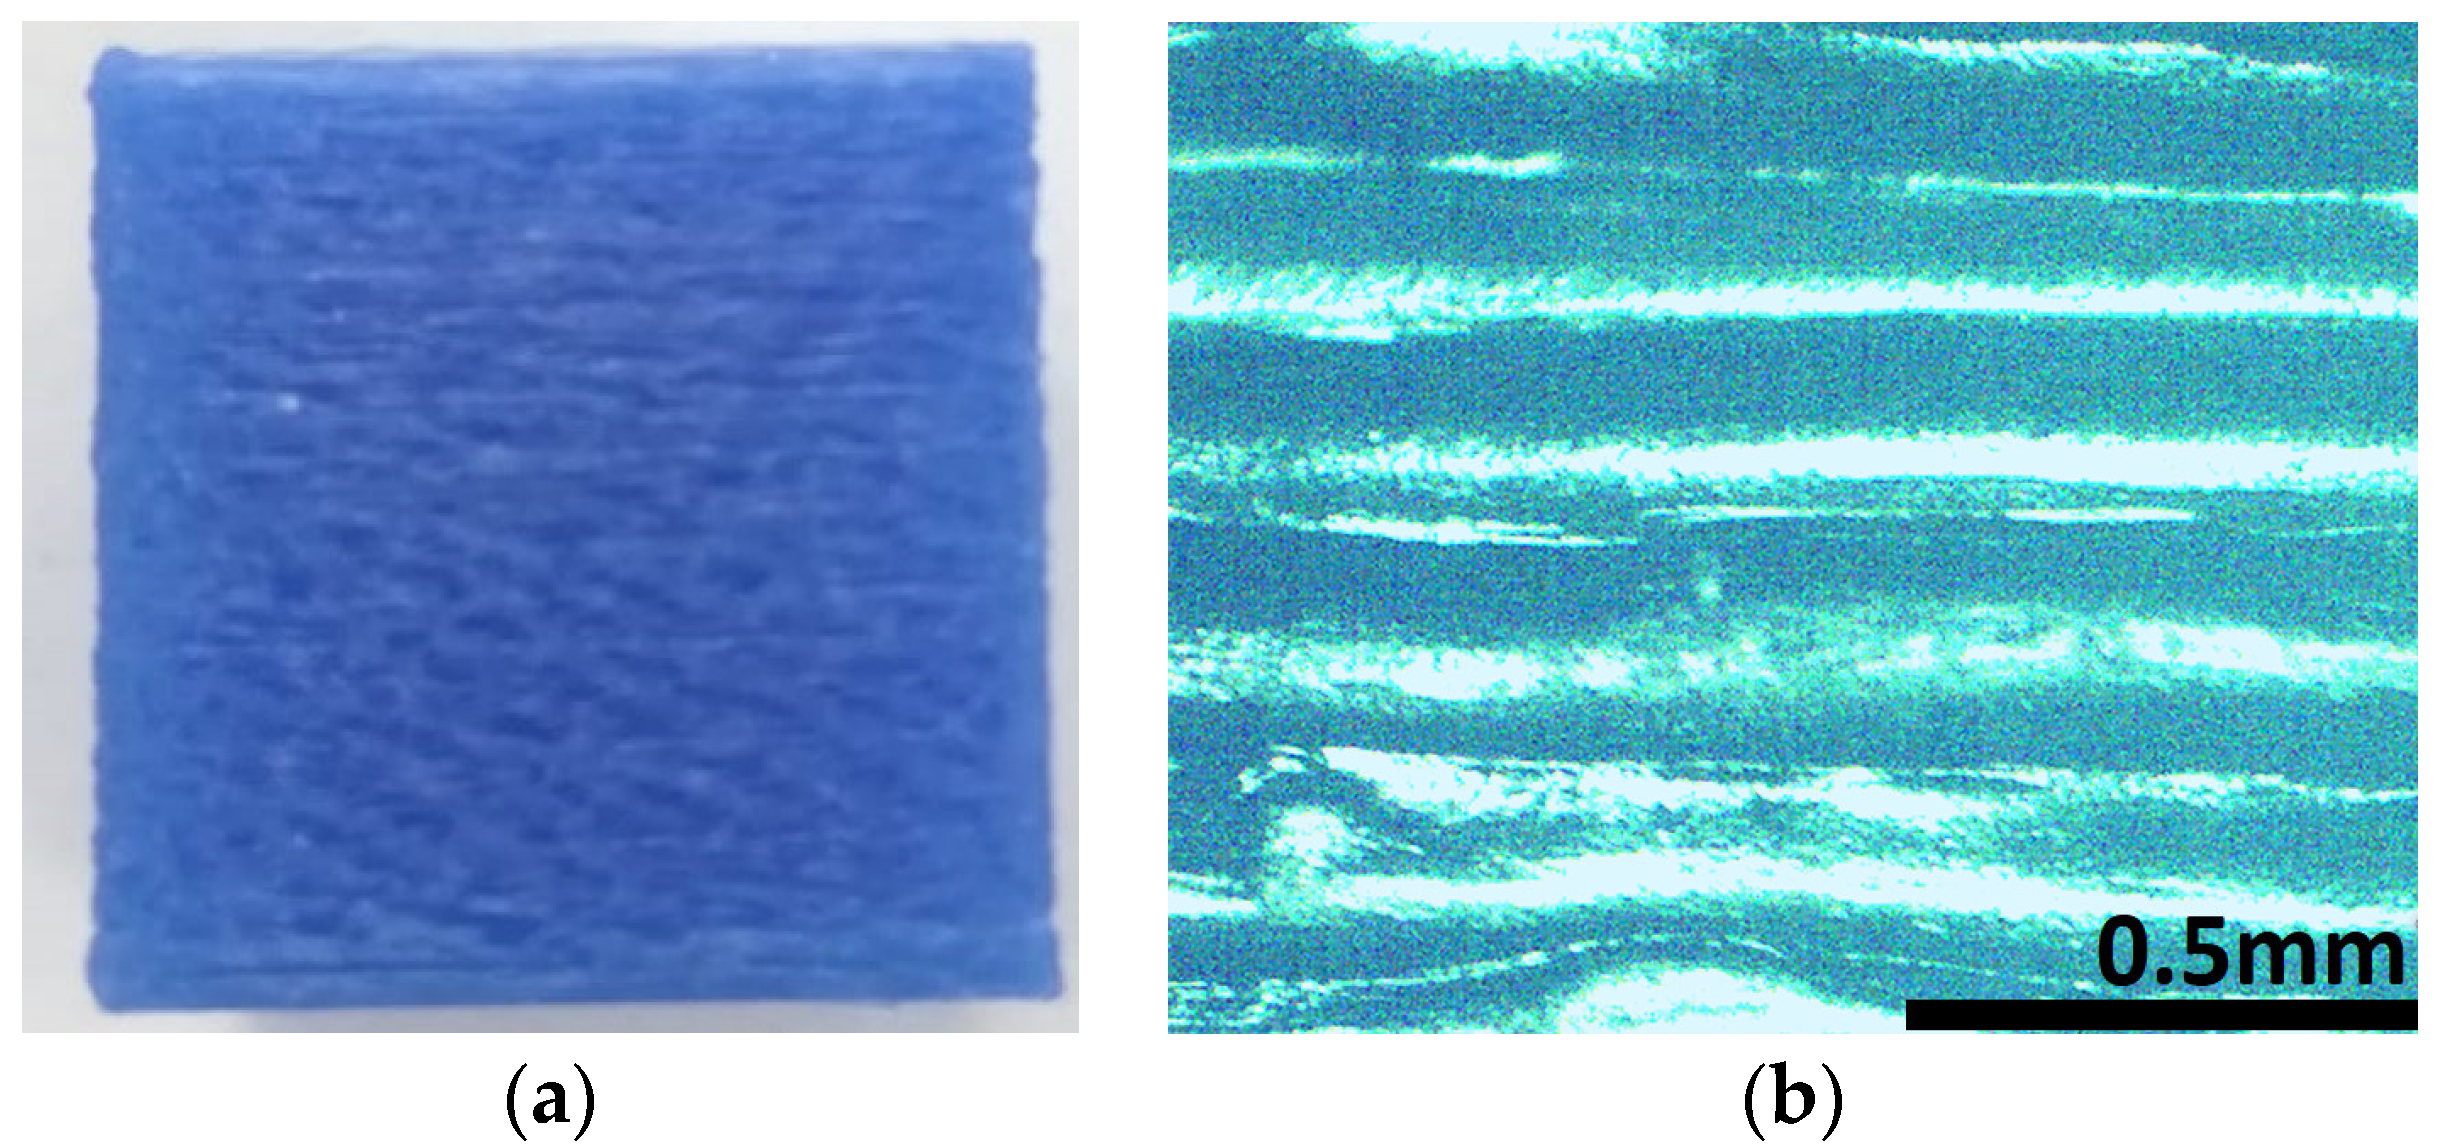
It is a well-known fact that IC manufacturing produces a high-quality surface finish due to the application of ceramic slurry coating. Therefore, it is required for the pattern to also have superior surface quality. In the case of 3D printed parts, surface roughness was always an issue due to the stair-stepping effect. The problem is aggravated even more for materials having low viscosity values at the molten state, such as wax. For example, Figure 7 shows a 20 × 20 × 20 mm wax cube with the presence of rippling on the side surface. The measured Ra values using the portable surface roughness tester showed values in the range of 25–39 µm. The parts tested are the cubes used in the Taguchi analysis.

Figure 7.
(a) 3D printed wax cube with visible ripples on the side surface and (b) magnified view of the surface.
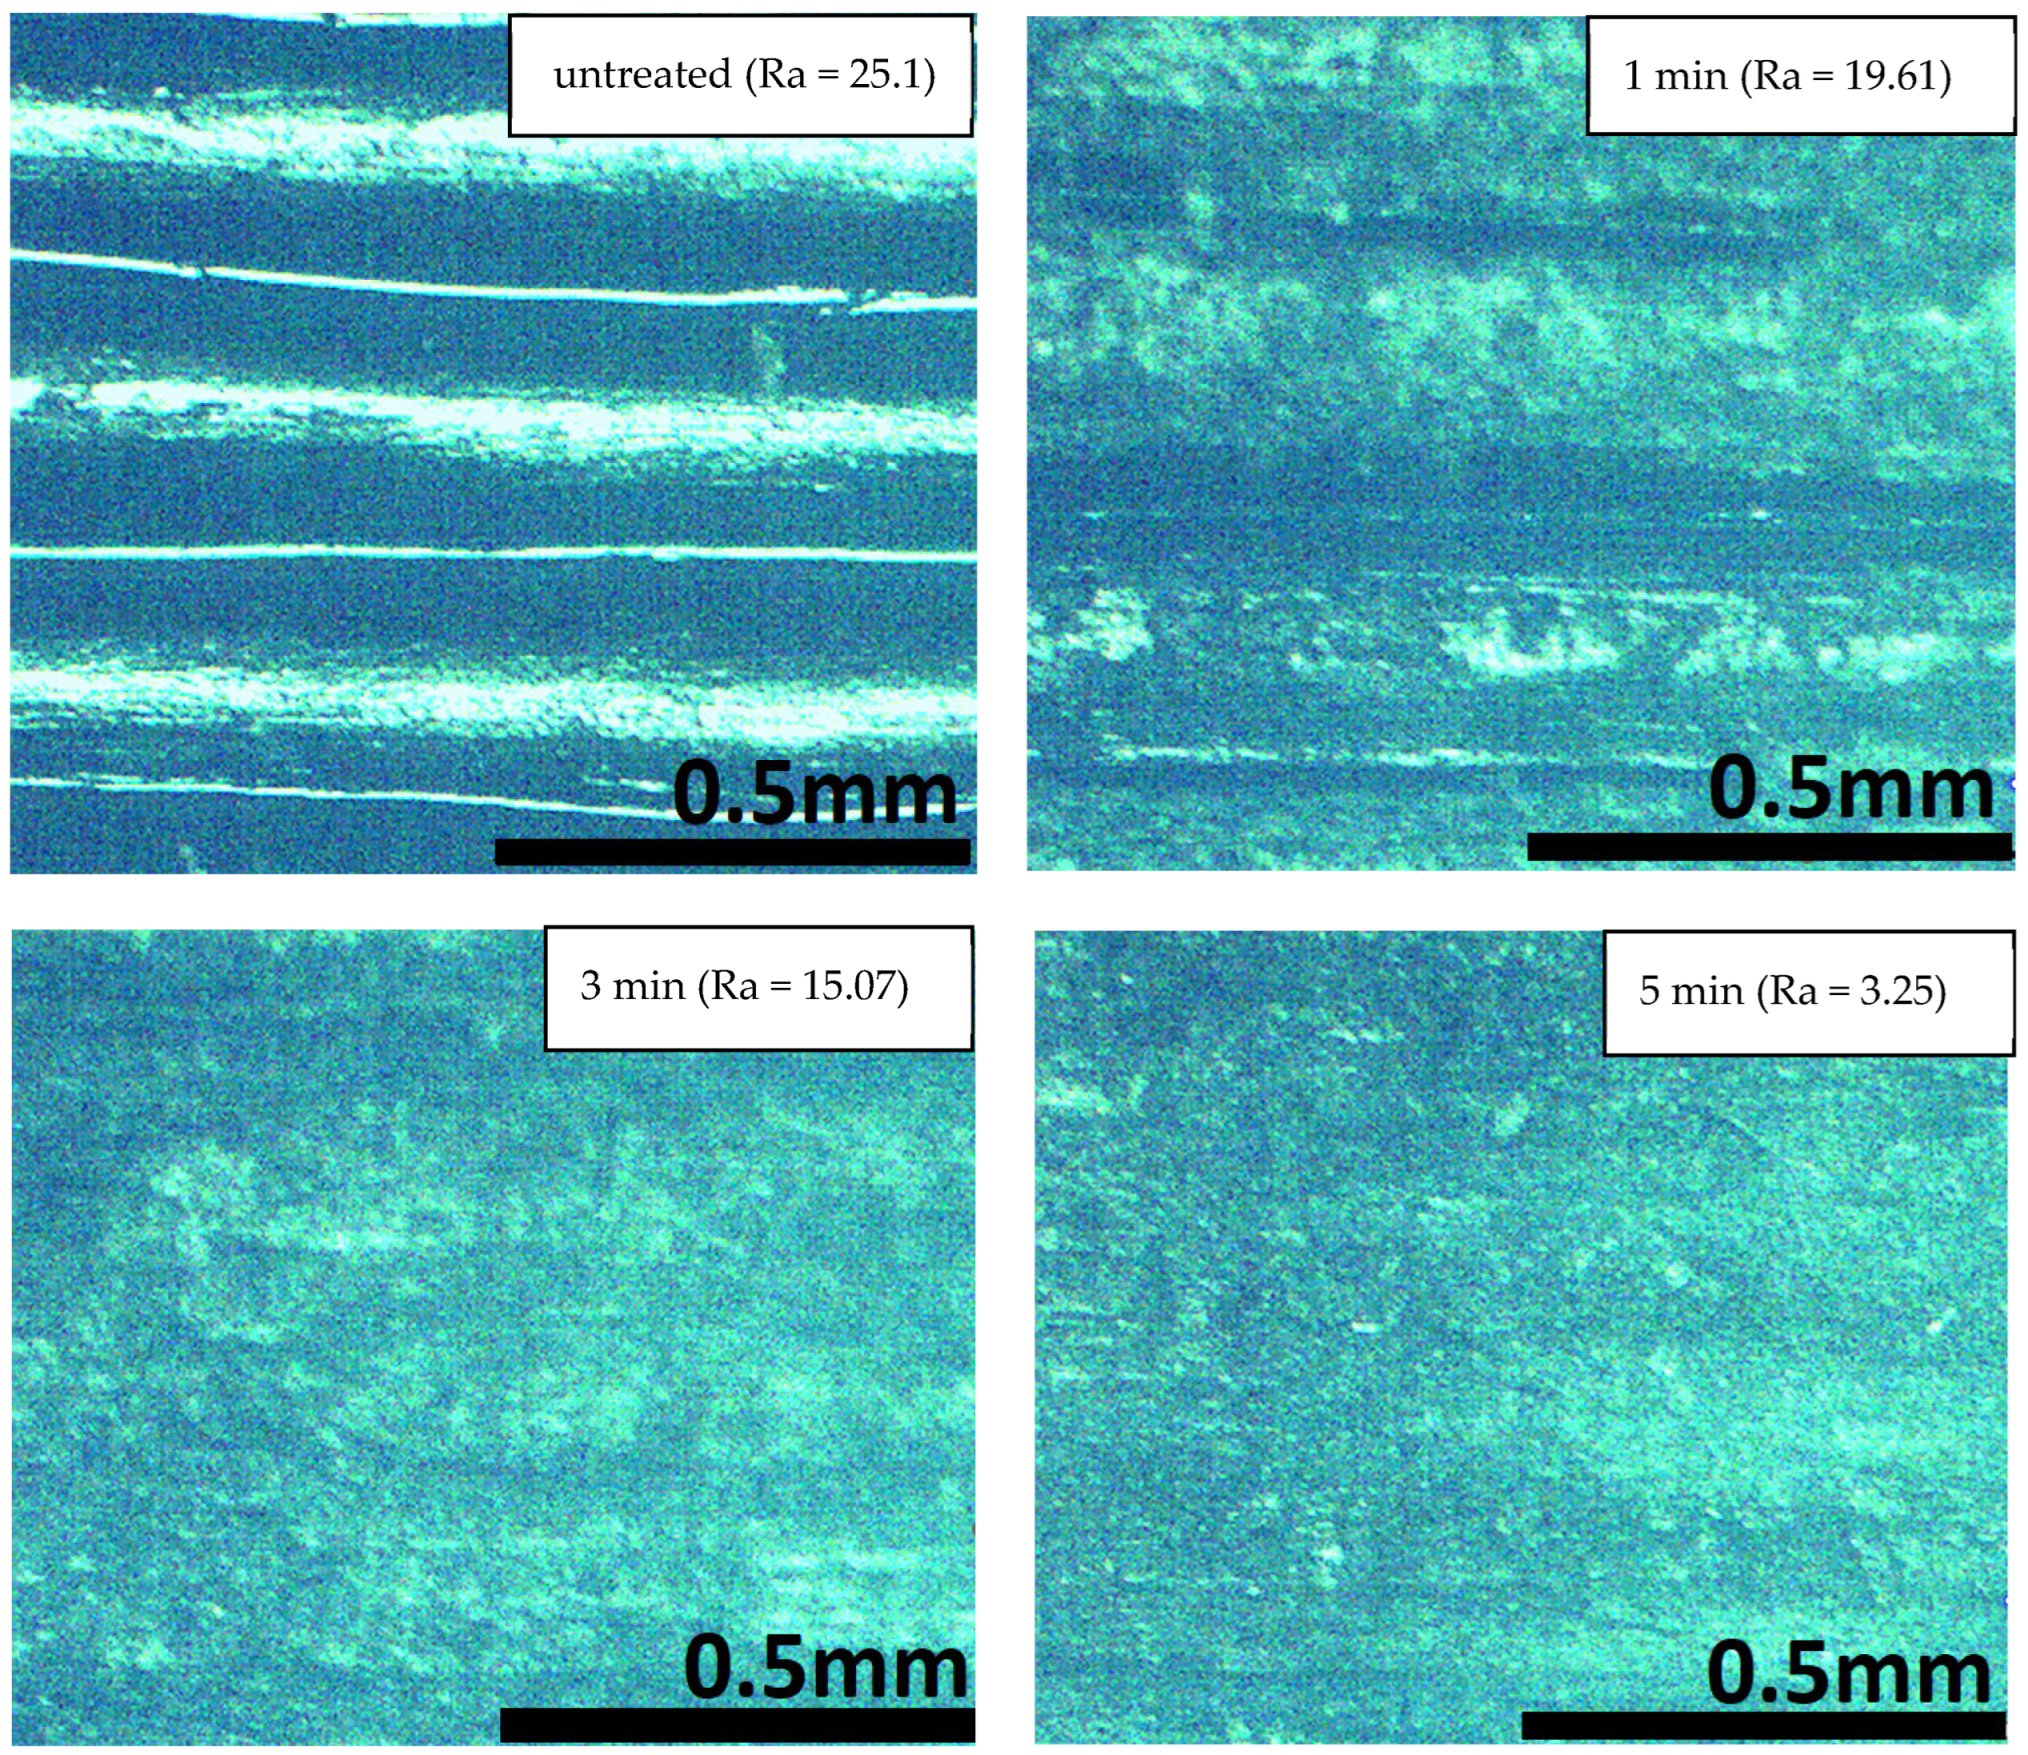
To overcome the issue of low surface quality, it was decided to apply a chemical treatment using a proper agent that can partially dissolve the material. From the literature, numerous works can be found on enhancing popular plastics such as PLA and ABS through chemical treatment. For example, one popular method for improving the surface roughness of ABS parts is the use of an acetone bath. Jayanth et al. [27] found that immersing the printed ABS parts in acetone for several minutes significantly decreases the Ra value from 9.42 to 0.84 µm. However, it was noticed that a longer immersion time may impair mechanical properties. In the current case, the same approach can be utilized by choosing different chemicals such as a white spirit. White spirit is known as a wax dissolver, therefore, it can be used to remove the surface irregularities, provided sufficient immersion time is applied. To see the effect of the chemical on the surface, the wax cubes were immersed in a white spirit bath for several periods of time. All the cubes were manufactured using the same process parameters to ensure that equal starting conditions are maintained for all samples. However, the Ra values of untreated samples were not equal and varied between 25.1 and 28.3 µm. Nevertheless, the experiment was conducted using three immersion time periods, such as 1, 3, and 5 min. The experiments showed that holding for more than 10 min has a negative effect on the object, and delamination might occur. On the other hand, a significant improvement was noticed when using a 5 min immersion time with the subsequent wiping of the surface using a soft tissue. Figure 8 shows the optical microscopic images of chemically treated and untreated parts. It should be noted that regardless of the magnitude of the starting Ra value, the Ra value after a 5 min immersion was approximately 3.2 µm ± 0.05 µm for all samples.
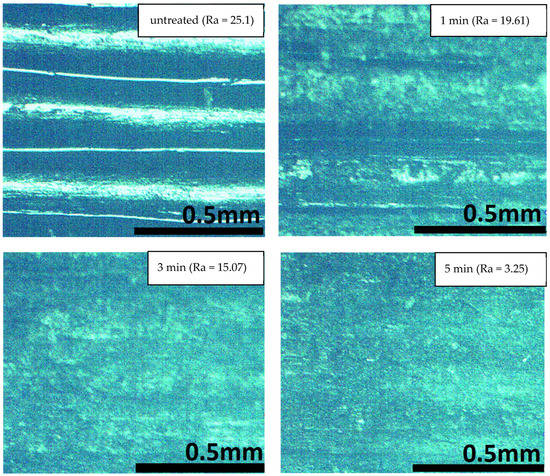
Figure 8.
Optical microscopic images of treated and untreated wax parts. The immersion time is indicated at the upper right corner of each image.
5. Conclusions
There are many process optimization techniques available for improving the final product’s quality in manufacturing goods. In this research, the implementation of the Taguchi method has allowed to identify that the printing temperature followed by layer thickness are the most influential process parameters to ensure a higher dimensional accuracy of wax patterns manufactured through FDM AM technology. In addition, to highlight important material properties of the wax-based filament, the next types of characterization experiments were performed with the following results:
- -
- Thermal analysis. Thermal analysis by means of DSC revealed a broad range of melting points which can identify the wax-based filament as a blend of waxes with a high probability of polyethylene being present in its content. In addition, no glass transition temperature was identified during the analysis, with a noticeable melting peak at approximately 110 °C. The absence of a Tg is advantageous since it eliminates the sharp transition from a solid to a soft state. Interestingly, the apparent melting peak at 110 °C identified by DSC analysis coincides with the optimal printing temperature found by the Taguchi analysis. This can be explained by the fact that one of the major components of the wax blend experiences phase transition from solid to liquid at 110 °C, resulting in lower melt viscosity that compromises melt stability. If we consider that the actual temperature of the melt is always lower than the printing temperature, then it is clear that the extrudate achieves an optimal condition for better shape stability between a lower boundary that is below 105 °C and a higher boundary at 110 °C.
- -
- The mechanical analysis on 3D printed samples shows that UTS and Young’s modulus are significantly lower compared to ABS and PLA plastics. However, the mechanical properties of Wax3D are superior in comparison to some commercially available IC waxes. Nevertheless, to manufacture thin-walled objects, the stiffness of the Wax3D material should be improved. As for the rheological characterization employing a rotational rheometer, the results show that the Wax3D melt has low complex viscosity and viscoelastic moduli at printing temperature compared to popular FDM polymer melts. On the one hand, the low viscosity of the material is beneficial when it comes to dewaxing the pattern during the RIC process. On the other hand, it greatly increases surface roughness. Nevertheless, it was found that by applying the chemical treatment on the surface of the printed part, the surface quality can be improved to reach the value of Ra = 3.2 µm. As for the chemical agent, white spirit has proved to be an effective material. Future work might include an investigation aiming to address the quality of castings made with the help of 3D printed wax patterns and the selection of proper dewaxing procedures.
In sum, the current work has shown that by running a Taguchi analysis and material characterization, it was possible to identify that the quality of 3D printed wax parts are mainly influenced by printing temperature. The results of the study can be helpful for those who are interested in using the Wax3D filament for the fabrication of IC patterns or other applications.
This study is a part of an ongoing research project which will also evaluate the quality of castings produced using Wax3D patterns.
Author Contributions
Conceptualization, M.M. and M.H.A.; methodology, M.M.; formal analysis, M.M., M.H.A. and E.S.; investigation, M.M.; resources, M.H.A. and E.S.; data curation, M.M.; writing—original draft preparation, M.M.; writing—review and editing, M.H.A. and E.S.; supervision, M.H.A. and E.S.; funding acquisition, M.H.A. All authors have read and agreed to the published version of the manuscript.
Funding
This research was funded by Nazarbayev University under the project “Design and Development of Next Generation Multi-material SLS-based 3D Printer”, grant number: 021220FD1551.
Institutional Review Board Statement
Not applicable.
Informed Consent Statement
Not applicable.
Data Availability Statement
The data presented in this study are available on request from the corresponding author.
Acknowledgments
We gratefully acknowledge funding support from Nazarbayev University under the Faculty Development Competitive Research Grant Program (FDCRGP), Grant No 021220FD1551.
Conflicts of Interest
The authors declare no conflict of interest.
References
- Chhabra, M.; Singh, R. Rapid casting solutions: A review. Rapid Prototyp. J. 2011, 17, 328–350. [Google Scholar] [CrossRef]
- Harun, W.S.W.; Safian, S.; Idris, M.H. Evaluation of ABS patterns produced from FDM for investment casting process. WIT Trans. Eng. Sci. 2009, 64, 319–328. [Google Scholar] [CrossRef] [Green Version]
- Blake, P.; Fodran, E.; Koch, M.; Menon, U.; Priedeman, B.; Sharp, S. FDM of ABS patterns for investment casting. In Proceedings of the 1997 International Solid Freeform Fabrication Symposium, Austin, TX, USA, 11–13 August 1997. [Google Scholar]
- Cheah, C.M.; Chua, C.K.; Lee, C.W.; Feng, C.; Totong, K. Rapid prototyping and tooling techniques: A review of applications for rapid investment casting. Int. J. Adv. Manuf. Technol. 2005, 25, 308–320. [Google Scholar] [CrossRef]
- Kumar, P.; Ahuja, I.P.S.; Singh, R. Application of fusion deposition modelling for rapid investment casting—A review. Int. J. Mater. Eng. Innov. 2012, 3, 204–227. [Google Scholar] [CrossRef]
- Wang, S.; Miranda, A.G.; Shih, C. A study of investment casting with plastic patterns. Mater. Manuf. Process. 2010, 25, 1482–1488. [Google Scholar] [CrossRef]
- Singh, S.; Kumar, P.; Singh, J. An approach to eliminate shell cracking problem in fused deposition modeling pattern based investment casting process. In Proceedings of the IOP Conference Series: Materials Science and Engineering, Coimbatore, India, 22–23 January 2021; Volume 1091, p. 12035. [Google Scholar]
- Mukhtarkhanov, M.; Perveen, A.; Talamona, D. Application of Stereolithography Based 3D Printing Technology in Investment Casting. Micromachines 2020, 11, 946. [Google Scholar] [CrossRef] [PubMed]
- Yin, J.; Lu, C.; Fu, J.; Huang, Y.; Zheng, Y. Interfacial bonding during multi-material fused deposition modeling (FDM) process due to inter-molecular diffusion. Mater. Des. 2018, 150, 104–112. [Google Scholar] [CrossRef]
- Baca, D.; Ahmad, R. The impact on the mechanical properties of multi-material polymers fabricated with a single mixing nozzle and multi-nozzle systems via fused deposition modeling. Int. J. Adv. Manuf. Technol. 2020, 106, 4509–4520. [Google Scholar] [CrossRef]
- Comb, J.; Priedeman, W.; Turley, P.W. FDM® Technology process improvements. In Proceedings of the 1994 International Solid Freeform Fabrication Symposium, San Diego, CA, USA, 8–13 May 1994. [Google Scholar]
- Carneiro, V.H.; Rawson, S.D.; Puga, H.; Meireles, J.; Withers, P.J. Additive manufacturing assisted investment casting: A low-cost method to fabricate periodic metallic cellular lattices. Addit. Manuf. 2020, 33, 101085. [Google Scholar] [CrossRef]
- Prakash, C.; Singh, S.; Kopperi, H.; Ramakrihna, S.; Mohan, S.V. Comparative job production based life cycle assessment of conventional and additive manufacturing assisted investment casting of aluminium: A case study. J. Clean. Prod. 2021, 289, 125164. [Google Scholar] [CrossRef]
- Kumar, P.; Ahuja, I.S.; Singh, R. Effect of process parameters on surface roughness of hybrid investment casting. Prog. Addit. Manuf. 2016, 1, 45–53. [Google Scholar] [CrossRef] [Green Version]
- Singh, N.; Singh, R.; Ahuja, I.P.S.; Farina, I.; Fraternali, F. Metal matrix composite from recycled materials by using additive manufacturing assisted investment casting. Compos. Struct. 2019, 207, 129–135. [Google Scholar] [CrossRef]
- Prakash, C.; Singh, S.; Ramakrishna, S. Characterization of indigenously coated biodegradable magnesium alloy primed through novel additive manufacturing assisted investment casting. Mater. Lett. 2020, 275, 128137. [Google Scholar] [CrossRef]
- Gomes, C.; Nobre, E.; Grassi, D.; Paulo, C.; Jos, C.; Ara, D. Mechanical behavior of a NiTi superelastic bone plate obtained by investment casting assisted by additive manufacturing. Smart Mater. Struct. 2020, 30, 025009. [Google Scholar] [CrossRef]
- Wang, J.; Sama, S.R.; Lynch, P.C.; Manogharan, G. Design and topology optimization of 3D-printed wax patterns for rapid investment casting. Procedia Manuf. 2019, 34, 683–694. [Google Scholar] [CrossRef]
- Mohamed, O.A.; Masood, S.H.; Bhowmik, J.L. Optimization of fused deposition modeling process parameters: A review of current research and future prospects. Adv. Manuf. 2015, 3, 42–53. [Google Scholar] [CrossRef]
- Webber, G.V. Wax Characterisation by Instrumental Analysis; Stellenbosch University: Stellenbosch, South Africa, 2000. [Google Scholar]
- Gill, Y.Q.; Saeed, F.; Shoukat, M.H.; Irfan, M.S.; Abid, U. A Study on the Dewaxing Behavior of Carbon-Black-Modified LDPE–Paraffin Wax Composites for Investment Casting Applications. Arab. J. Sci. Eng. 2021, 46, 6715–6725. [Google Scholar] [CrossRef]
- Rodríguez-Panes, A.; Claver, J.; Camacho, A.M. The influence of manufacturing parameters on the mechanical behaviour of PLA and ABS pieces manufactured by FDM: A comparative analysis. Materials 2018, 11, 1333. [Google Scholar] [CrossRef] [Green Version]
- Pattnaik, S.; Karunakar, D.B.; Jha, P.K. Developments in investment casting process—A review. J. Mater. Process. Technol. 2012, 212, 2332–2348. [Google Scholar] [CrossRef]
- Gilmer, E.L.; Mansfield, C.; Gardner, J.M.; Siochi, E.J.; Baird, D.G.; Bortner, M.J. Characterization and analysis of Polyetherimide: Realizing practical challenges of modeling the extrusion-based additive manufacturing process. In Polymer-Based Additive Manufacturing: Recent Developments; ACS Publications: Washington, DC, USA, 2019; pp. 69–84. ISBN 1947-5918. [Google Scholar]
- Das, A.; Gilmer, E.L.; Biria, S.; Bortner, M.J. Importance of Polymer Rheology on Material Extrusion Additive Manufacturing: Correlating Process Physics to Print Properties. ACS Appl. Polym. Mater. 2021, 3, 1218–1249. [Google Scholar] [CrossRef]
- Cicala, G.; Giordano, D.; Tosto, C.; Filippone, G.; Recca, A.; Blanco, I. Polylactide (PLA) filaments a biobased solution for additive manufacturing: Correlating rheology and thermomechanical properties with printing quality. Materials 2018, 11, 1191. [Google Scholar] [CrossRef] [PubMed] [Green Version]
- Jayanth, N.; Senthil, P.; Prakash, C. Effect of chemical treatment on tensile strength and surface roughness of 3D-printed ABS using the FDM process. Virtual Phys. Prototyp. 2018, 13, 155–163. [Google Scholar] [CrossRef]
Publisher’s Note: MDPI stays neutral with regard to jurisdictional claims in published maps and institutional affiliations. |
© 2022 by the authors. Licensee MDPI, Basel, Switzerland. This article is an open access article distributed under the terms and conditions of the Creative Commons Attribution (CC BY) license (https://creativecommons.org/licenses/by/4.0/).