
Permeation Effect Analysis of Drug Using Raman Spectroscopy for Iontophoresis


Abstract
:1. Introduction
2. Method
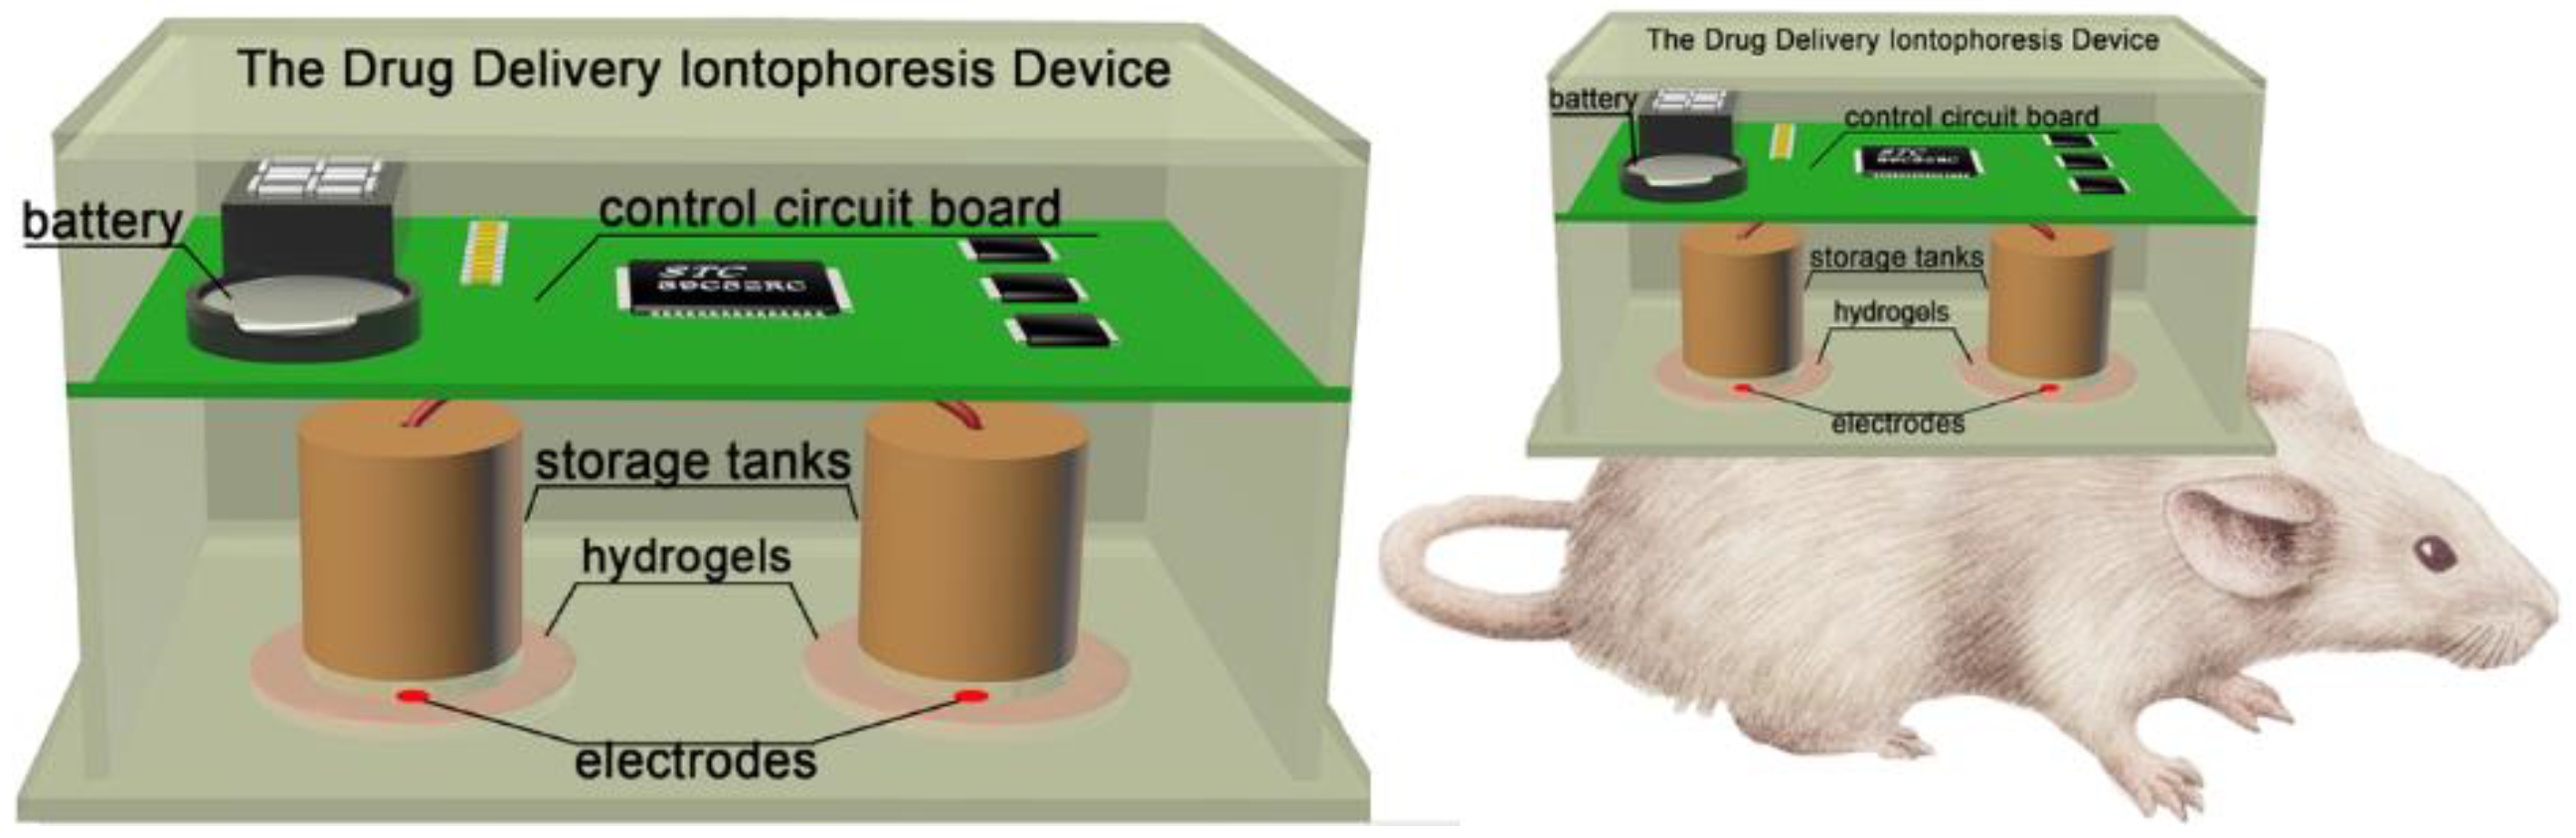
2.1. Materials and Device
2.2. Experimental Method
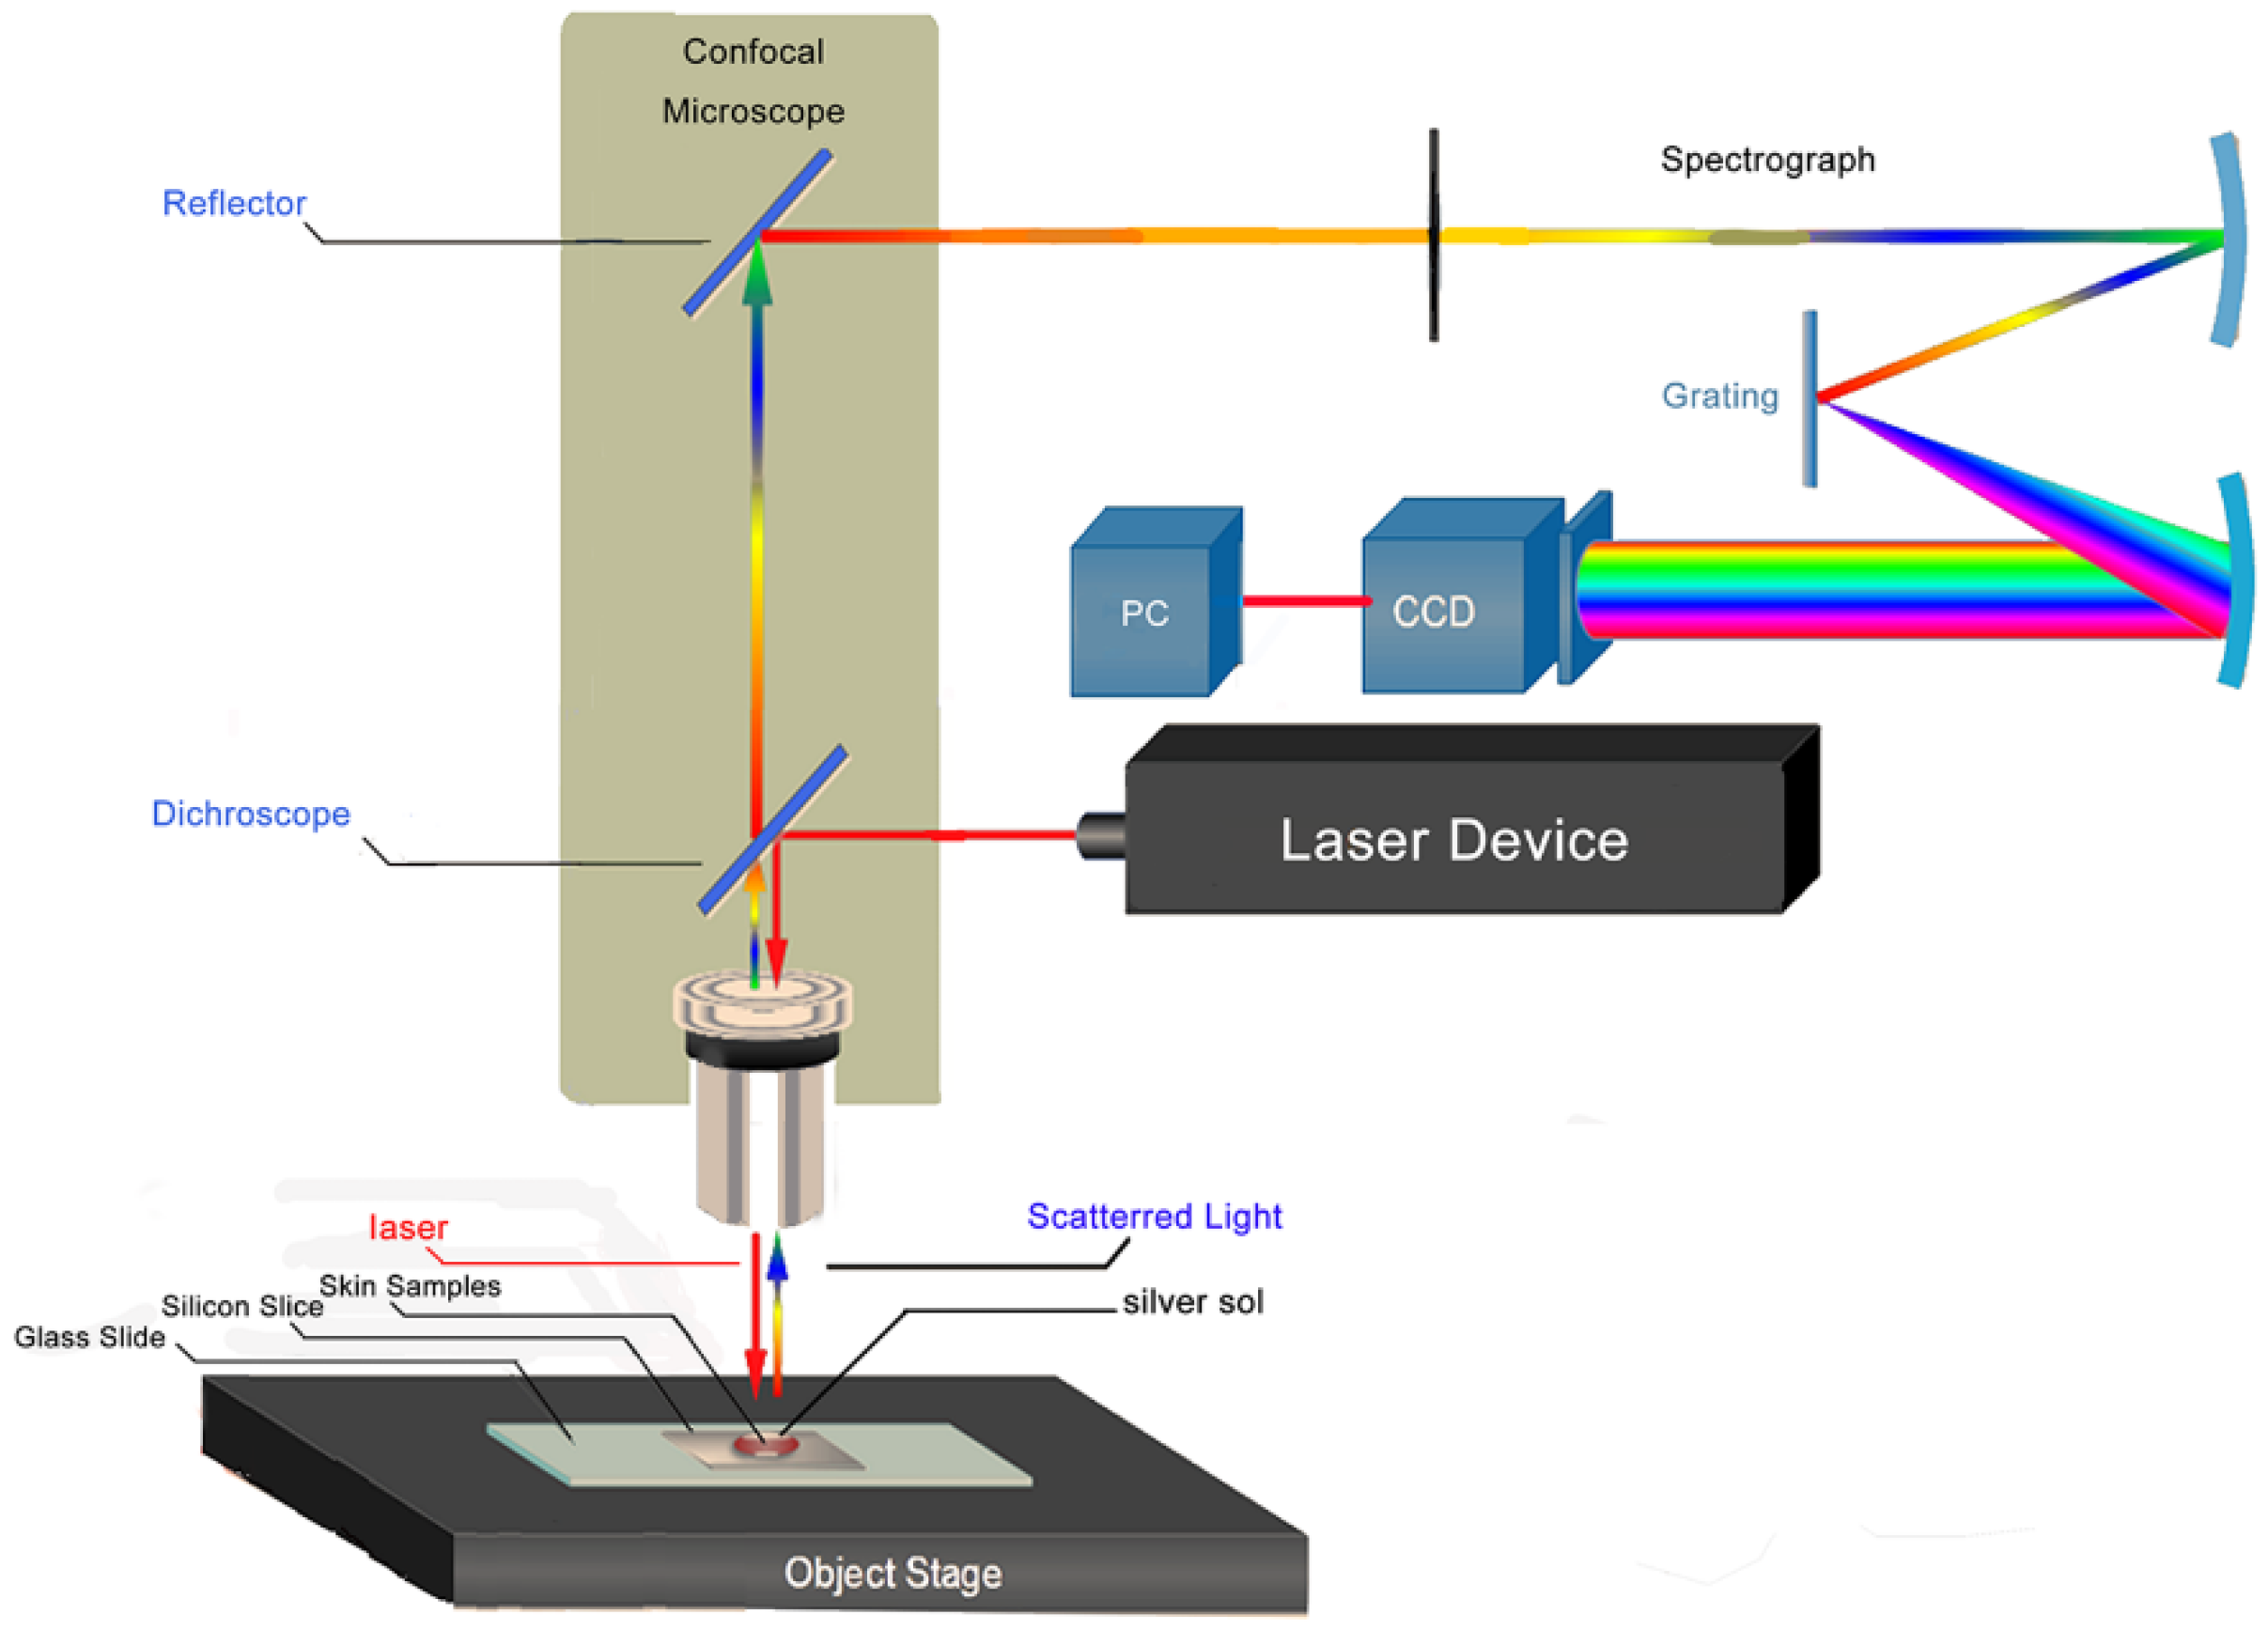
2.3. SERS Measurement
3. Results
4. Discussion
5. Conclusions
Author Contributions
Funding
Institutional Review Board Statement
Informed Consent Statement
Conflicts of Interest
References
- Jhawat, V.C.; Saini, V.; Kamboj, S.; Maggon, N. Transdermal drug delivery systems: Approaches and advancements in drug absorption through skin. Int. J. Pharm. Sci. Rev. Res. 2013, 20, 47–56. [Google Scholar]
- Bolzinger, M.A.; Briançon, S.; Pelletier, J.; Chevalier, Y. Penetration of drugs through skin, a complex rate-controlling membrane. Curr. Opin. Colloid Interface Sci. 2012, 17, 156–165. [Google Scholar] [CrossRef]
- Wang, Y.; Thakur, R.; Fan, Q.; Michniak, B. Transdermal iontophoresis: Combination strategies to improve transdermal iontophoretic drug delivery. Eur. J. Pharm. Biopharm. 2005, 60, 179–191. [Google Scholar] [CrossRef] [PubMed]
- Garvie-Cook, H.; Stone, J.M.; Yu, F.; Guy, R.H.; Gordeev, S. Femtosecond pulsed laser ablation to enhance drug delivery across the skin. J. Biophotonics 2016, 9, 144–154. [Google Scholar] [CrossRef]
- Singh, A.; Yadav, S. Microneedling: Advances and widening horizons. Indian Dermatol. Online J. 2016, 7, 244. [Google Scholar]
- Prausnitz, M.R.; Langer, R. Transdermal drug delivery. Nat. Biotechnol. 2008, 26, 1261. [Google Scholar] [CrossRef]
- Singh, P.; Maibach, H.I. Iontophoresis in drug delivery: Basic principles and applications. Crit. Rev. Ther. Drug Carr. Syst. 1994, 11, 161–213. [Google Scholar]
- Kanikkannan, N. Iontophoresis-based transdermal delivery systems. BioDrugs 2002, 16, 339–347. [Google Scholar] [CrossRef]
- Sieg, A.; Wascotte, V. Diagnostic and therapeutic applications of iontophoresis. J. Drug Target. 2009, 17, 690–700. [Google Scholar] [CrossRef]
- Nitsche, M.A.; Cohen, L.G.; Wassermann, E.M.; Priori, A.; Lang, N.; Antal, A.; Pascual-Leone, A. Transcranial direct current stimulation: State of the art 2008. Brain Stimul. 2008, 1, 206–223. [Google Scholar] [CrossRef]
- Bannon, Y.B.; Corish, J.; Corrigan, O.I.; Masterson, J.G. Iontophoretically induced transdermal delivery of salbutamol. Drug Dev. Ind. Pharm. 1988, 14, 2151–2166. [Google Scholar] [CrossRef]
- Volpato, N.M.; Santi, P.; Colombo, P. Iontophoresis enhances the transport of acyclovir through nude mouse skin by electrorepulsion and electroosmosis. Pharm. Res. 1995, 12, 1623–1627. [Google Scholar] [CrossRef] [PubMed]
- Chopra, P.; Hao, J.; Li, S.K. Iontophoretic transport of charged macromolecules across human sclera. Int. J. Pharm. 2010, 388, 107–113. [Google Scholar] [CrossRef] [Green Version]
- Teong, B.; Kuo, S.; Tsai, W.H.; Ho, M.L.; Chen, C.H.; Huang, H. Liposomal encapsulation for systemic delivery of propranolol via transdermal iontophoresis improves bone microarchitecture in ovariectomized rats. Int. J. Mol. Sci. 2017, 18, 822. [Google Scholar] [CrossRef] [Green Version]
- Hasan, M.; Khatun, A.; Kogure, K. Iontophoresis of Biological Macromolecular Drugs. Pharmaceutics 2022, 14, 525. [Google Scholar] [CrossRef]
- Manda, P.; Angamuthu, M.; Hiremath, S.R.; Raman, V.; Murthy, S.N. Iontophoretic drug delivery for the treatment of scars. J. Pharm. Sci. 2014, 103, 1638–1642. [Google Scholar] [CrossRef]
- Junaid, M.; Banga, A. Transdermal Delivery of Baclofen Using Iontophoresis and Microneedles. AAPS Pharm. Sci. Tech. 2022, 23, 84. [Google Scholar] [CrossRef] [PubMed]
- Liu, S.P.; Bao, X.; Zhang, S.B.; Zhang, H.; Lu, X.; Li, T.; Chen, Z.Y.; Chen, N. The study of ultrasound and iontophoresis on oxaprozin transdermal penetration using surface-enhanced Raman spectroscopy. Drug Deliv. Transl. Res. 2020, 10, 83–92. [Google Scholar] [CrossRef]
- Paula, D.D.; Martins, C.A.; Bentley, M.V.L.B. Development and validation of HPLC method for imiquimod determination in skin penetration studies. Biomed. Chromatogr. 2008, 22, 1416–1423. [Google Scholar] [CrossRef]
- Sjövall, P.; Greve, T.M.; Clausen, S.K.; Moller, K.; Eirefelt, S.; Johansson, B.; Nielsen, K.T. Imaging of distribution of topically applied drug molecules in mouse skin by combination of time-of-flight secondary ion mass spectrometry and scanning electron microscopy. Anal. Chem. 2014, 86, 3443–3452. [Google Scholar] [CrossRef]
- Liu, C.; Wang, H.; Jiang, Y.; Du, Z. Rapid and simultaneous determination of amoxicillin, penicillin G, and their major metabolites in bovine milk by ultra-high-performance liquid chromatography–tandem mass spectrometry. J. Chromatogr. B 2011, 879, 533–540. [Google Scholar] [CrossRef] [PubMed]
- Paudel, A.; Raijada, D.; Rantanen, J. Raman spectroscopy in pharmaceutical product design. Adv. Drug Deliv. Rev. 2015, 89, 3–20. [Google Scholar] [CrossRef] [PubMed] [Green Version]
- Fukunaga, Y.; Okada, T. Quantification using statistical parameters derived from signal intensity distributions in surface enhanced Raman scattering (SERS). Anal. Chim. Acta 2021, 1181, 338931. [Google Scholar] [CrossRef] [PubMed]
- Chen, Y.; Li, X.; Yang, M.; Yang, L.; Han, X.; Jiang, X.; Zhao, B. High sensitive detection of penicillin G residues in milk by surface-enhanced Raman scattering. Talanta 2017, 167, 236–241. [Google Scholar] [CrossRef] [PubMed]
- Razavi, M.; Khandan, A. Safety, regulatory issues, long-term biotoxicity, and the processing environment. In Nanobiomaterials Science, Development and Evaluation; Woodhead Publishing: Sawston, UK, 2017; pp. 261–279. [Google Scholar]
- Rashid, T.U.; Sadia, S.; Biswas, S.; Ahmed, T.; Mallik, A.; Shahruzzaman, M.; Sakib, M.N.; Papia, H.; Mohammed, M.R. Gelatin-Based Hydrogels. In Cellulose-Based Superabsorbent Hydrogels; Polymers and Polymeric Composites: A Reference Series; Mondal, M., Ed.; Springer: Berlin/Heidelberg, Germany, 2019; pp. 1601–1641. [Google Scholar]
- Khandan, A.; Jazayeri, H.; Fahmy, M.D.; Razavi, M. Hydrogels: Types, structure, properties, and applications. Biomat. Tiss. Eng. 2017, 4, 143–169. [Google Scholar]
- Zhang, H.; Liu, S.P.; Yang, X.F.; Chen, N.; Pang, F.F.; Chen, Z.Y.; Wang, T.Y.; Zhou, J.S.; Ren, F.J.; Xu, X.Y.; et al. LED phototherapy with gelatin sponge promotes wound healing in mice. Photochem. Photobiol. 2018, 94, 179–185. [Google Scholar] [CrossRef]
- Braun, G.B.; Lee, S.J.; Laurence, T.; Fera, N.; Fabris, L.; Bazan, G.C.; Reich, N.O. Generalized approach to SERS-active nanomaterials via controlled nanoparticle linking, polymer encapsulation, and small-molecule infusion. J. Phys. Chem. C 2009, 113, 13622–13629. [Google Scholar] [CrossRef]
- Finholt, P.; Jürgensen, G.; Kristiansen, H. Catalytic effect of buffers on degradation of penicillin G in aqueous solution. J. Pharm. Sci. 1965, 54, 387–393. [Google Scholar] [CrossRef]
- Förster, M.; Bolzinger, M.A.; Ach, D.; Montagnac, G.; Briançon, S. Ingredients tracking of cosmetic formulations in the skin: A confocal Raman microscopy investigation. Pharm. Res. 2011, 28, 858–872. [Google Scholar] [CrossRef]
- Sagdinc, S.G.; Esme, A. Theoretical and vibrational studies of 4, 5-diphenyl-2-2 oxazole propionic acid (oxaprozin). Spectrochim. Acta Part A Mol. Biomol. Spectrosc. 2010, 75, 1370–1376. [Google Scholar] [CrossRef]
- Zhao, F.T.; Wang, W.P.; Zhong, H.D.; Yang, F.; Fu, W.Y.; Ling, Y.H.; Zhang, Z.J. Robust quantitative SERS analysis with Relative Raman scattering intensities. Talanta 2021, 221, 121465. [Google Scholar] [CrossRef] [PubMed]
- Strachan, C.J.; Rades, T.; Gordon, K.C.; Rantanen, J. Raman spectroscopy for quantitative analysis of pharmaceutical solids. J. Pharm. Pharmacol. 2007, 59, 179–192. [Google Scholar] [CrossRef] [PubMed]
- Franzen, L.; Anderski, J.; Windbergs, M. Quantitative detection of caffeine in human skin by confocal Raman spectroscopy–a systematic in vitro validation study. Eur. J. Pharm. Biopharm. 2015, 95, 110–116. [Google Scholar] [CrossRef] [PubMed]

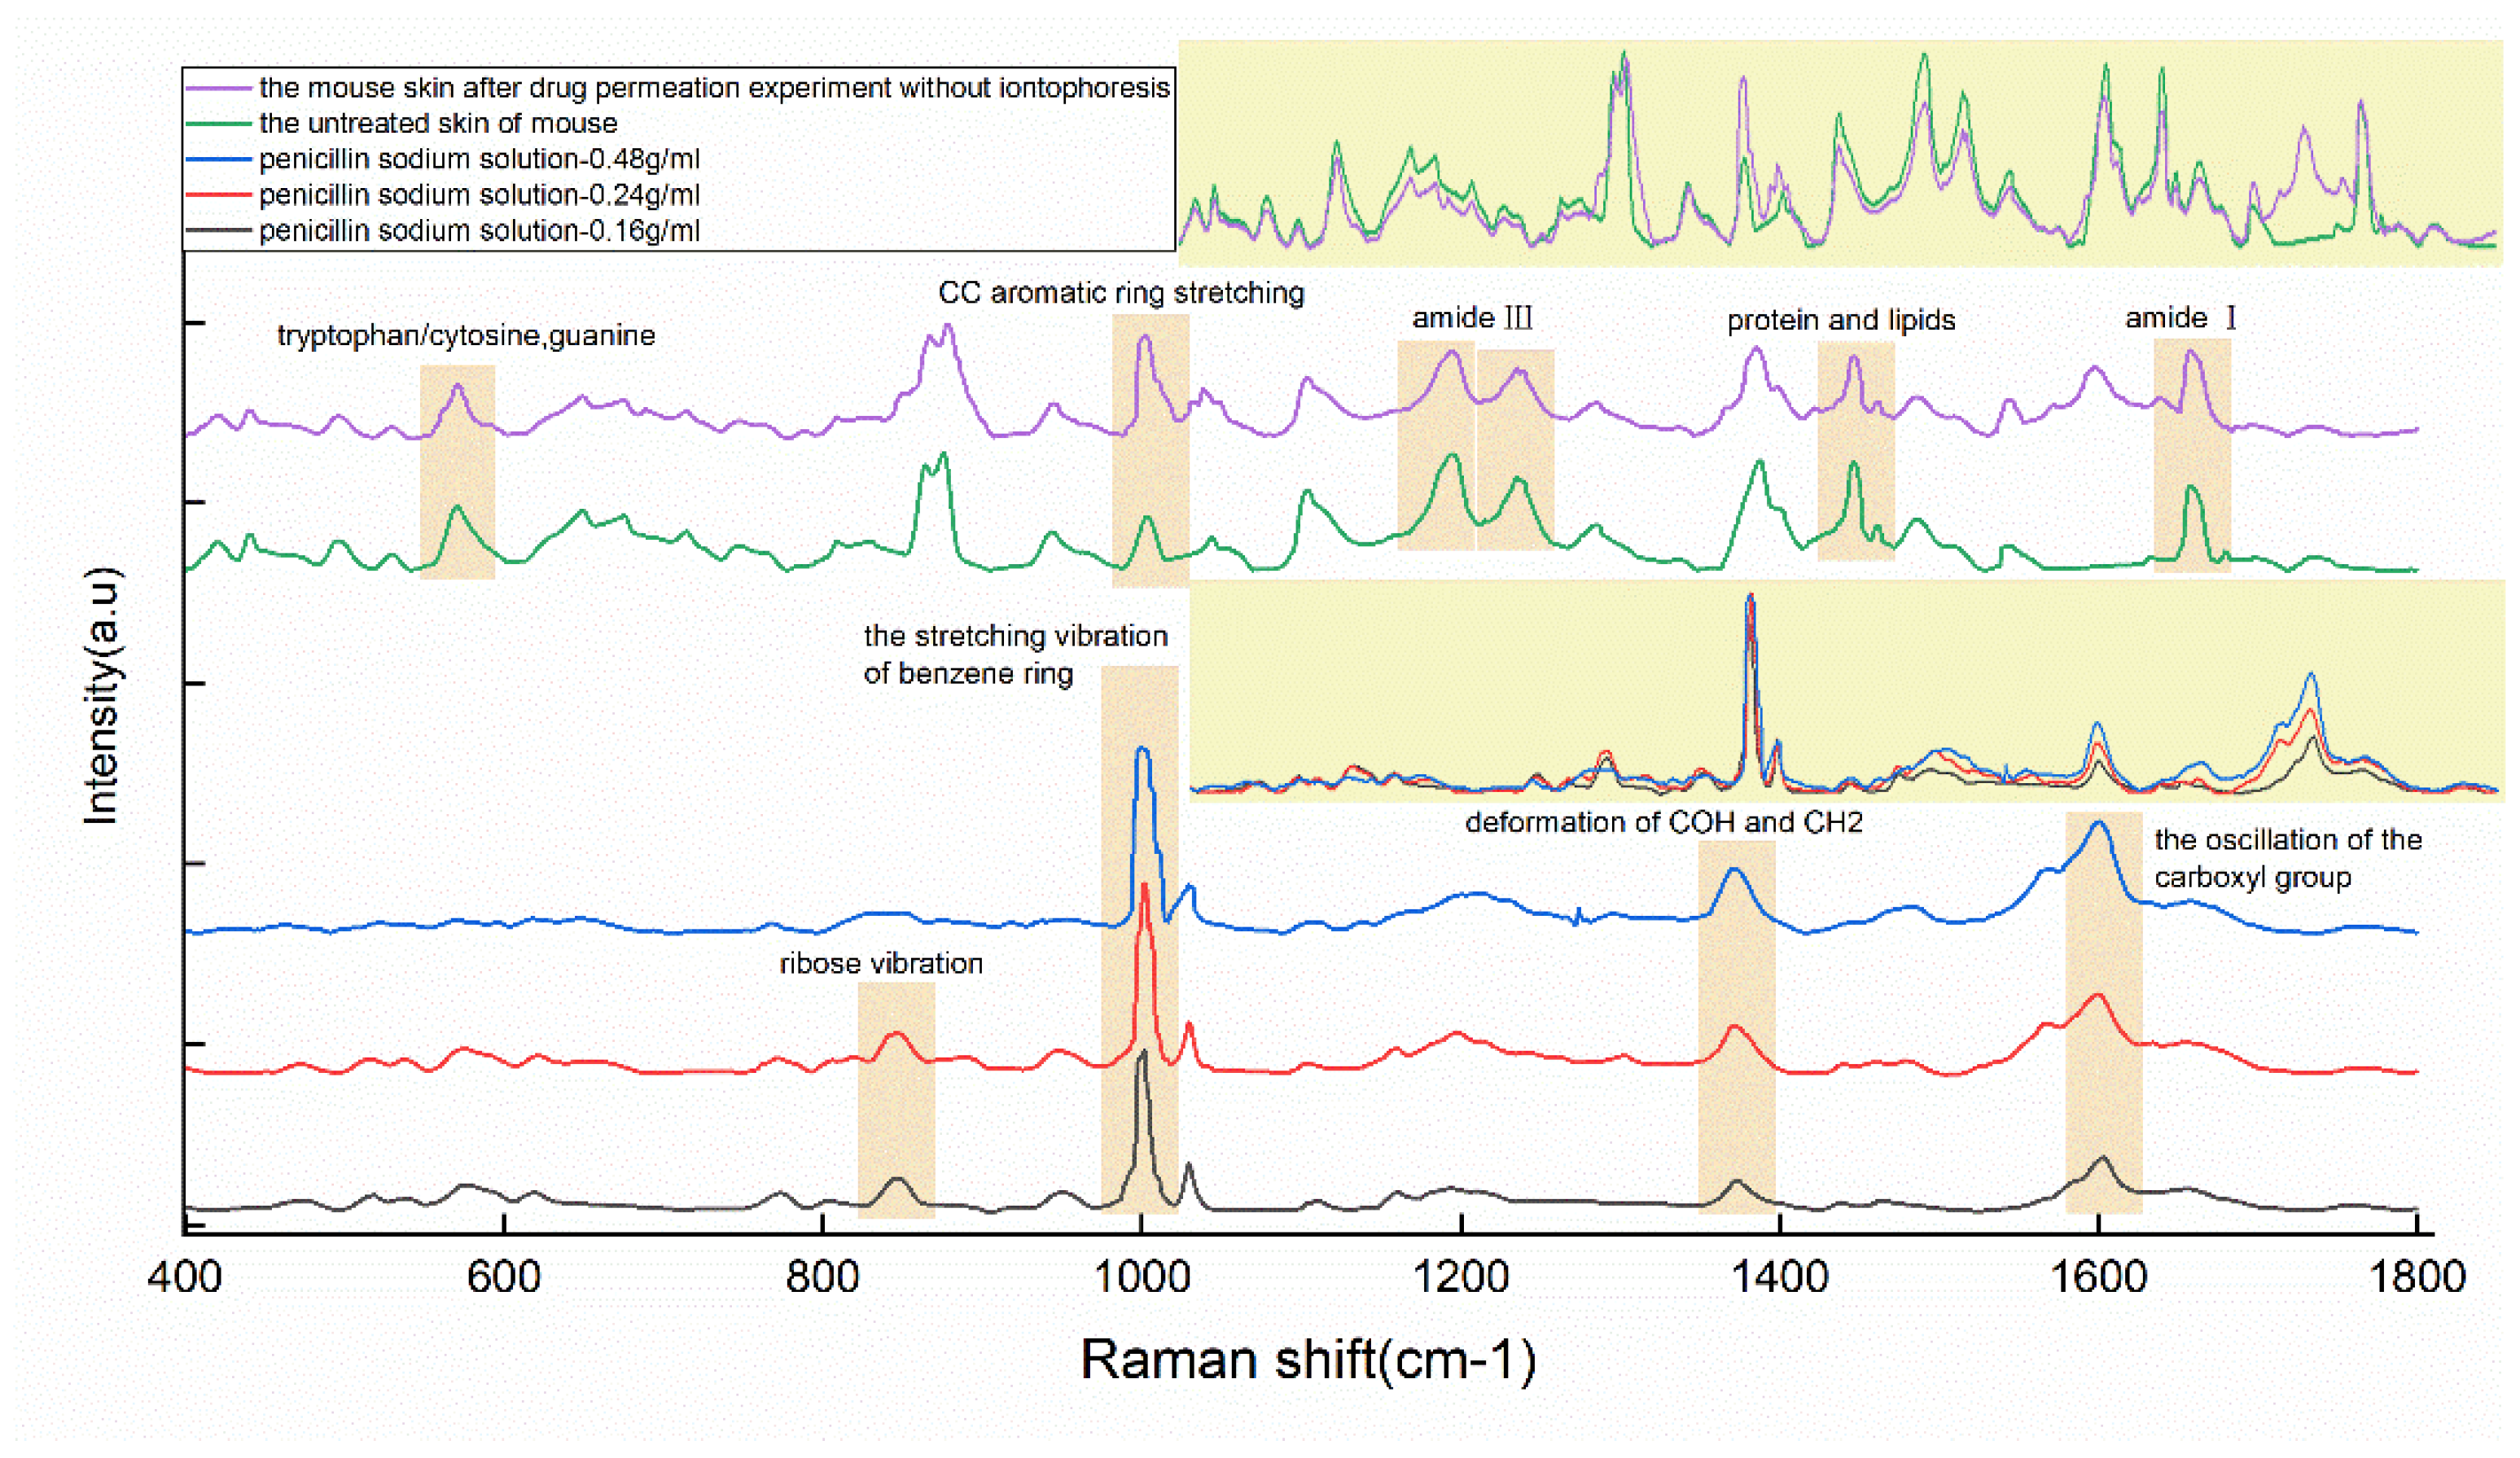
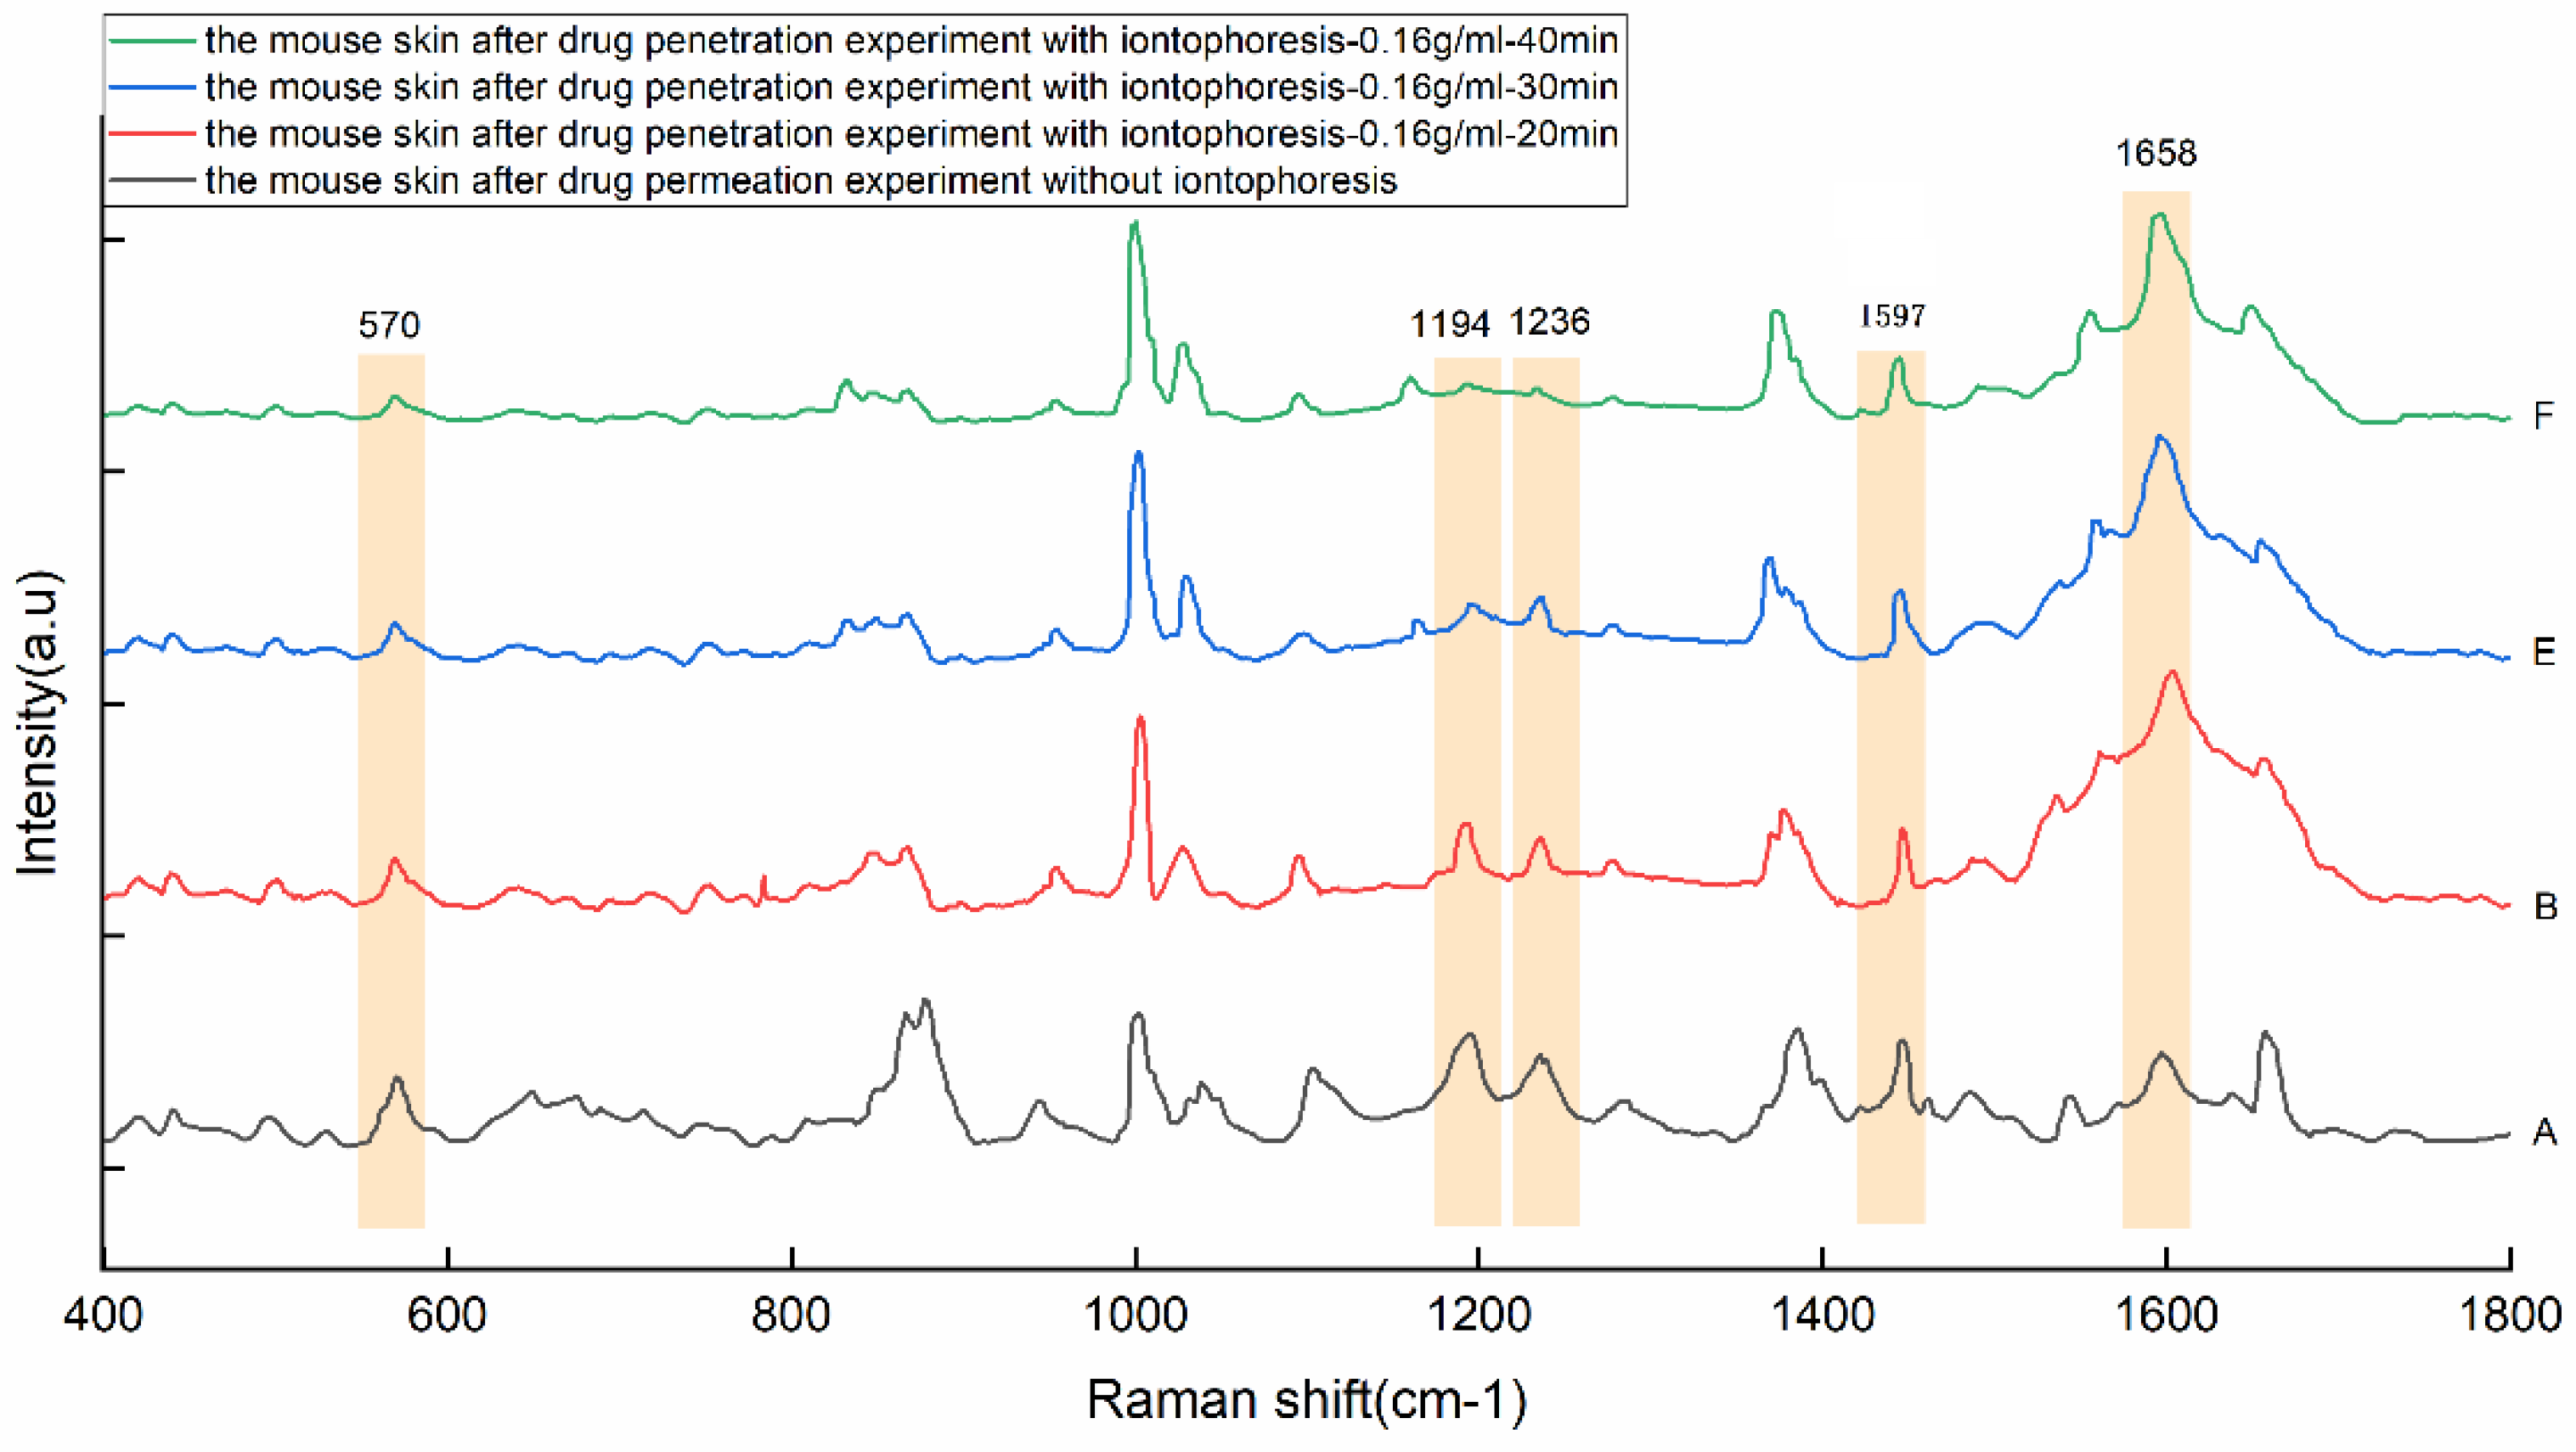
| Peaks/cm−1 | Major Assignments |
|---|---|
| 570 | Tryptophan/cytosine, guanine |
| 847 | Ribose vibration |
| 877 | ρ(C-C-N) symmetric stretching (lipids) |
| 1002 | ν(C-C) phenylalanine/the stretching vibration of the benzene ring |
| 1032 | ν(C–C) skeletal cis conformation |
| 1104 | Phenylalanine (proteins) |
| 1194 | Amide III due to C-N stretching and δ(N-H) bending |
| 1236 | Amide III (proteins) |
| 1373 | δ(COH), δ(CH)2 |
| 1388 | CH3 band |
| 1446 | CH2 bending mode of proteins and lipids |
| 1597 | The oscillation of the carboxyl group |
| 1658 | Amide I |
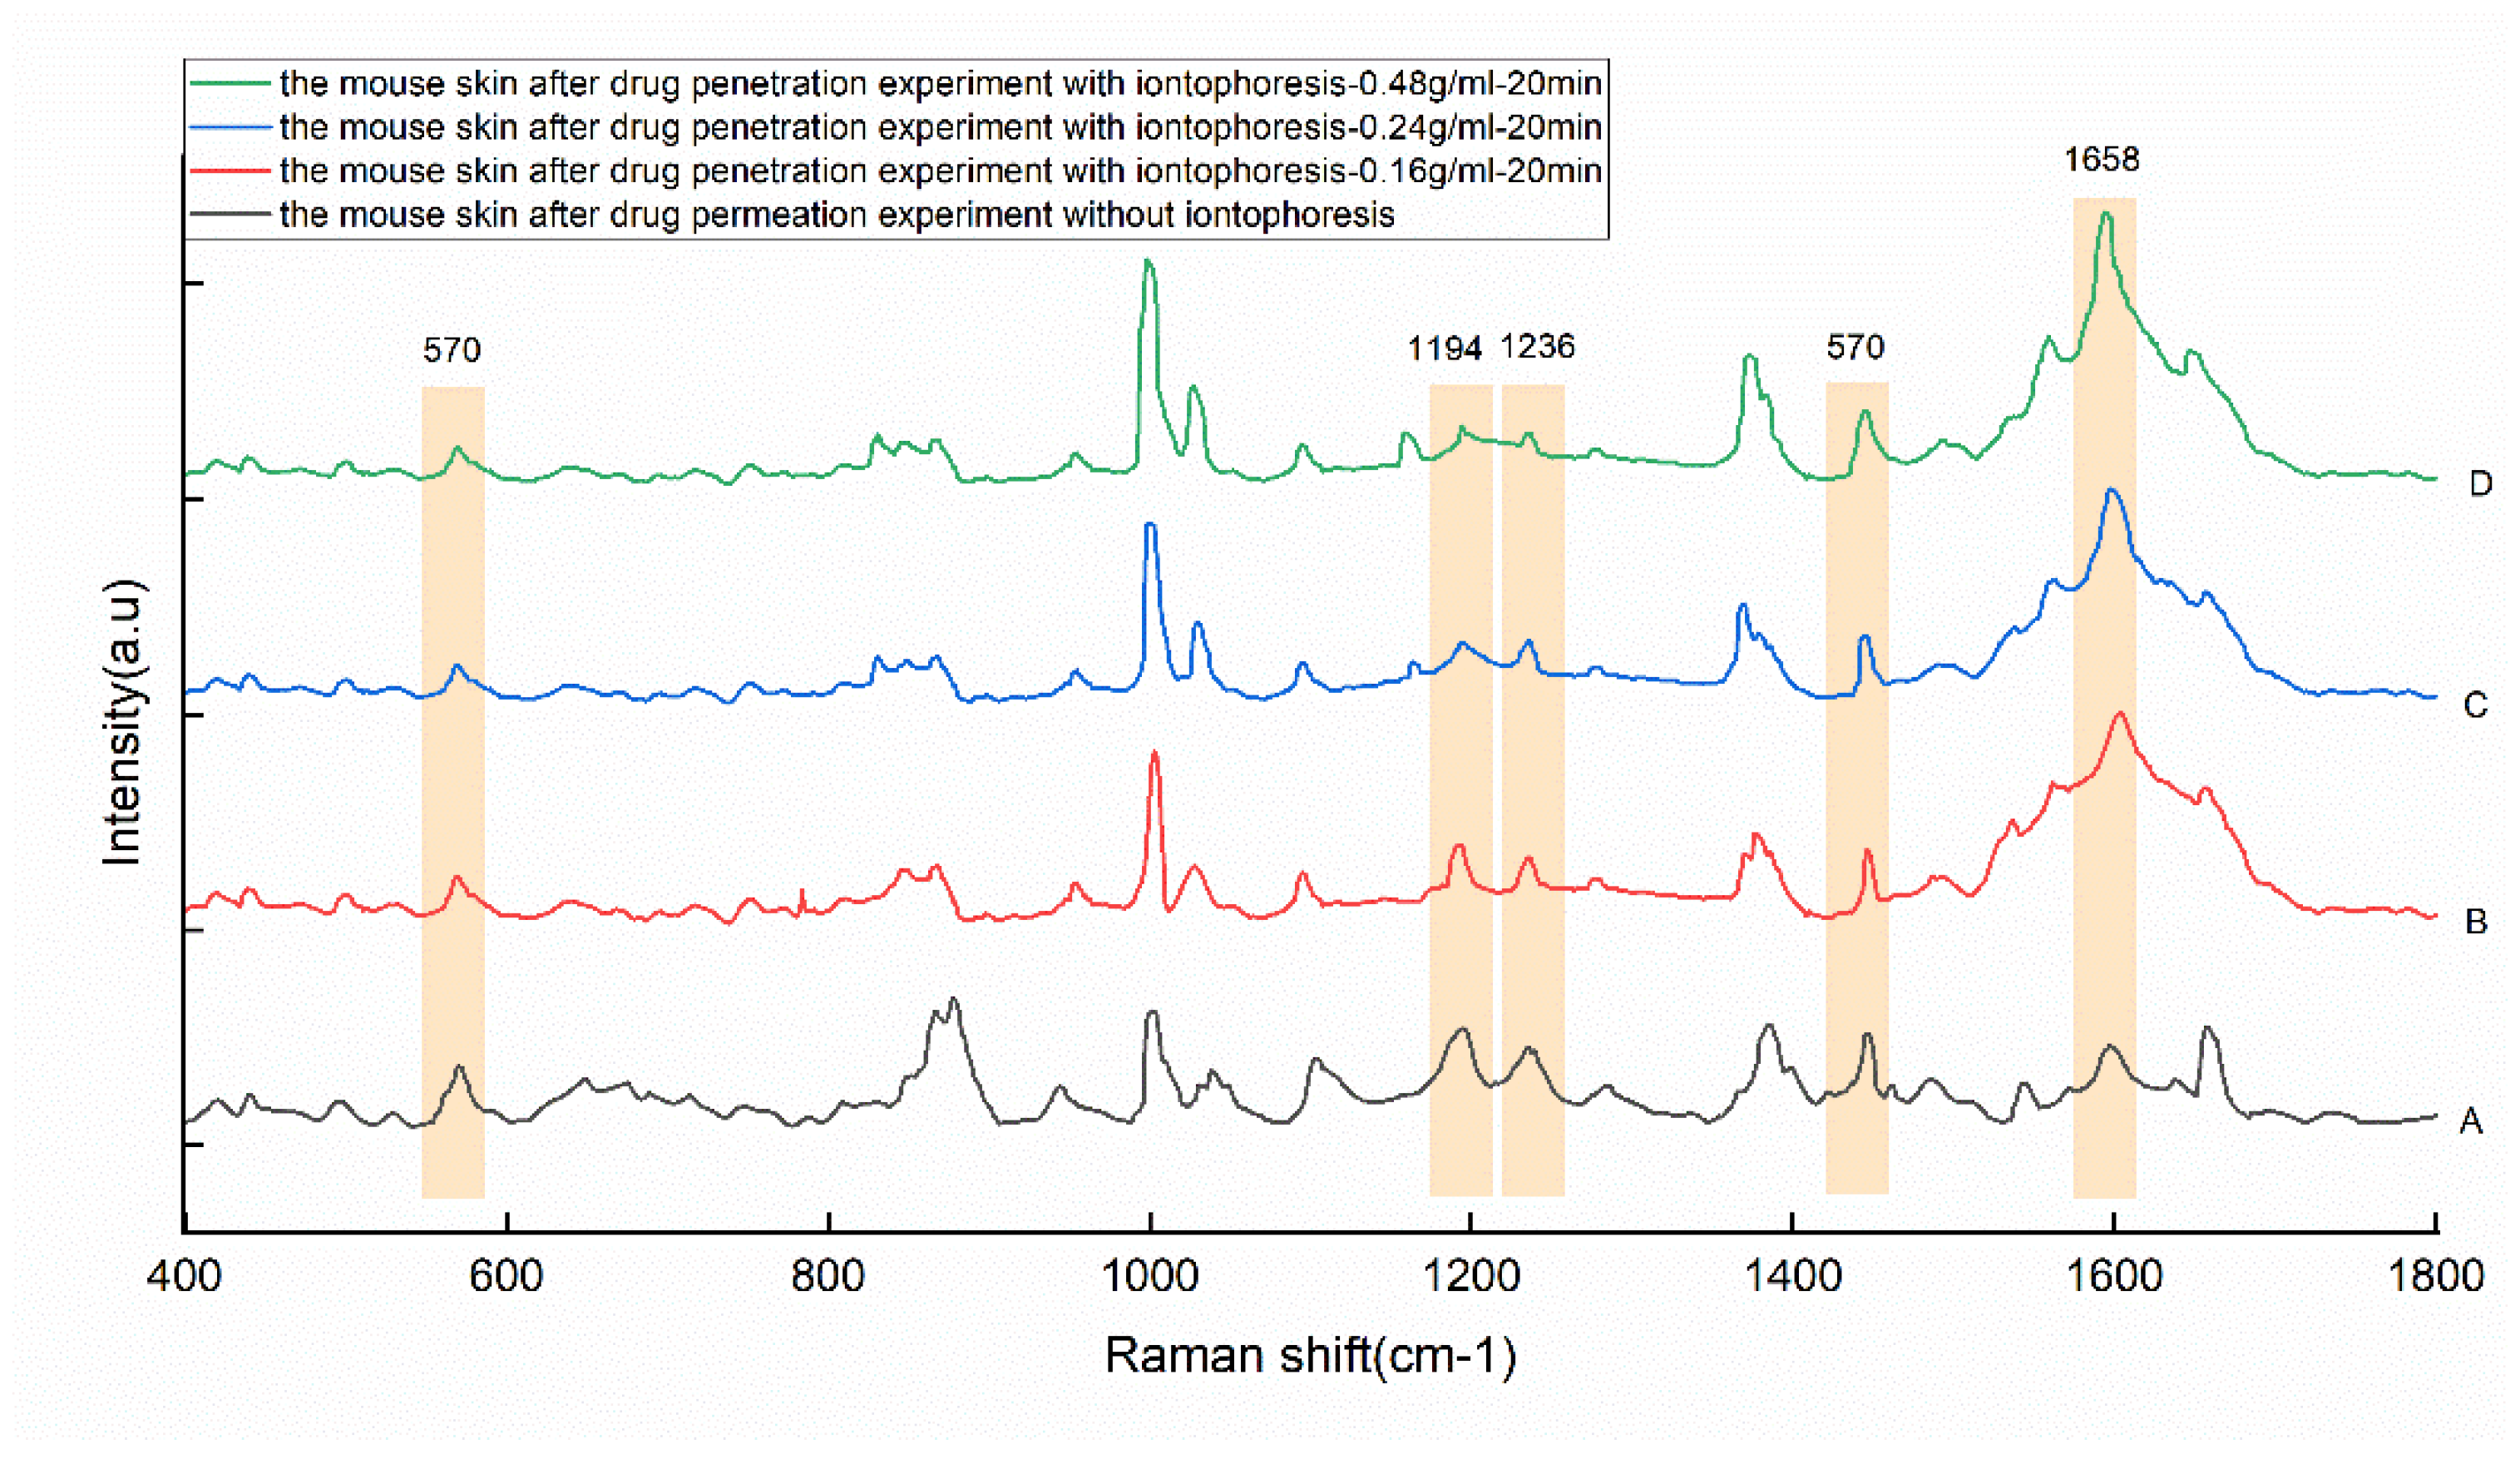
| Peaks (cm−1) | 570 | 1194 | 1236 | 1446 | 1597 |
|---|---|---|---|---|---|
| A | 152 ± 18 | 162 ± 17 | 123 ± 15 | 160 ± 14 | 121 ± 19 |
| B | 125 ± 12 | 134 ± 18 | 111 ± 14 | 160 ± 12 | 612 ± 64 |
| C | 100 ± 13 | 101 ± 11 | 90 ± 11 | 151 ± 15 | 886 ± 102 |
| D | 106 ± 14 | 108 ± 9 | 105 ± 14 | 203 ± 23 | 1223 ± 169 |
| E | 86 ± 10 | 128 ± 14 | 92 ± 13 | 147 ± 18 | 684 ± 98 |
| F | 130 ± 12 | 194 ± 18 | 134 ± 17 | 224 ± 28 | 1115 ± 126 |
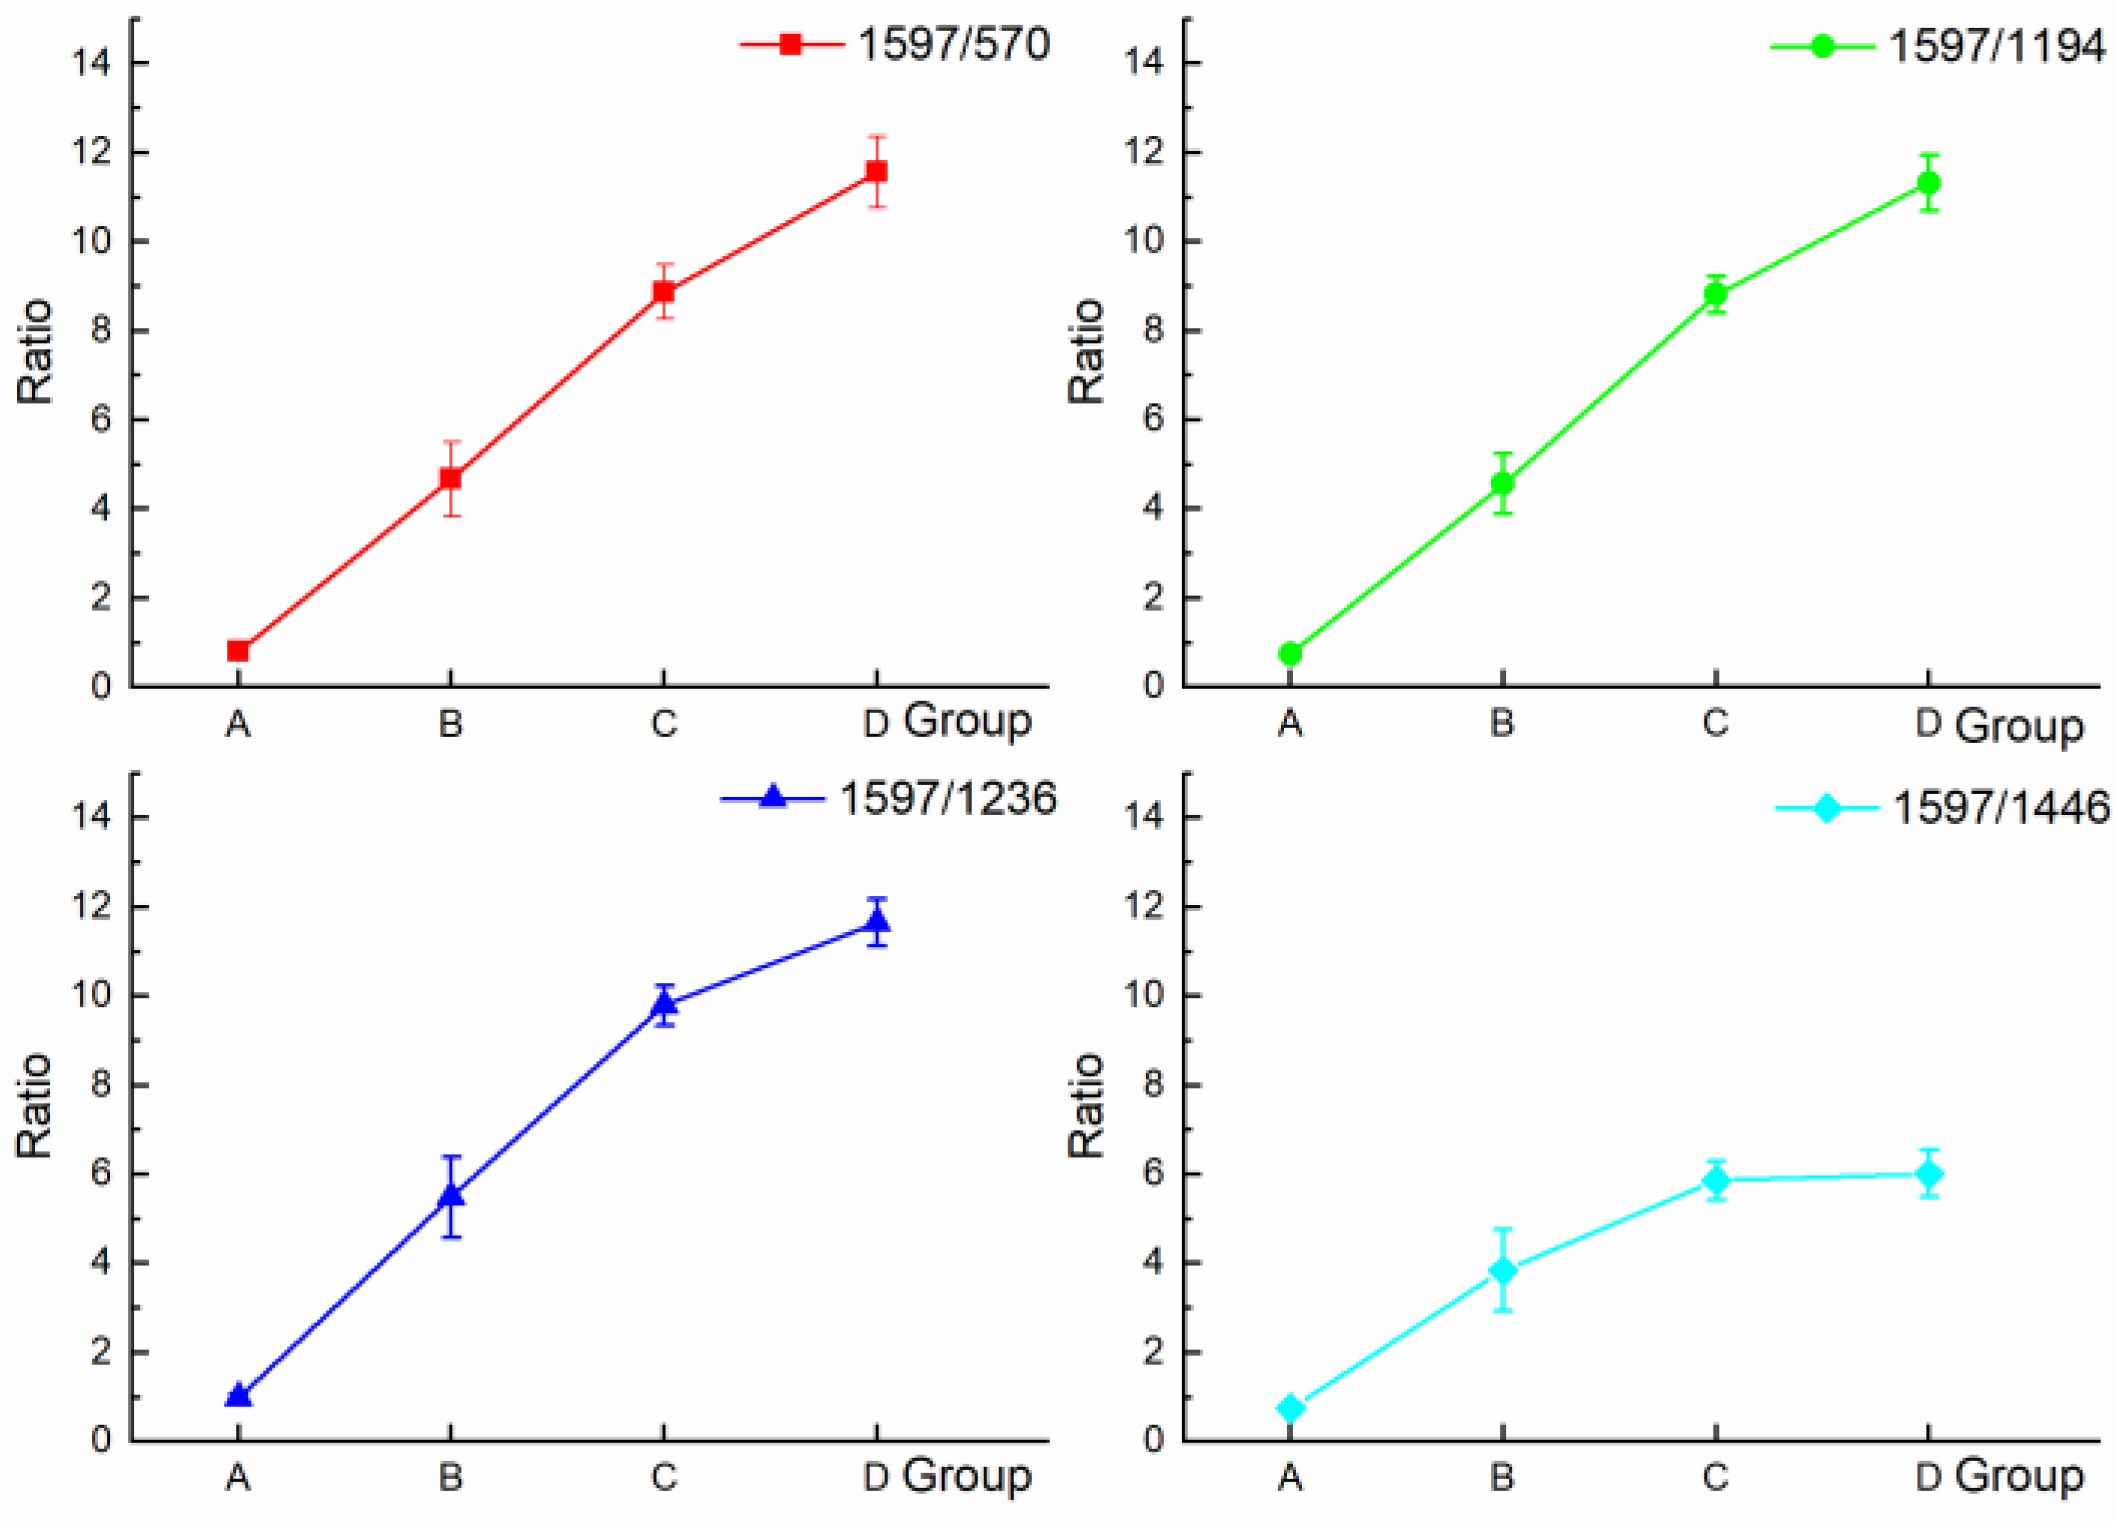
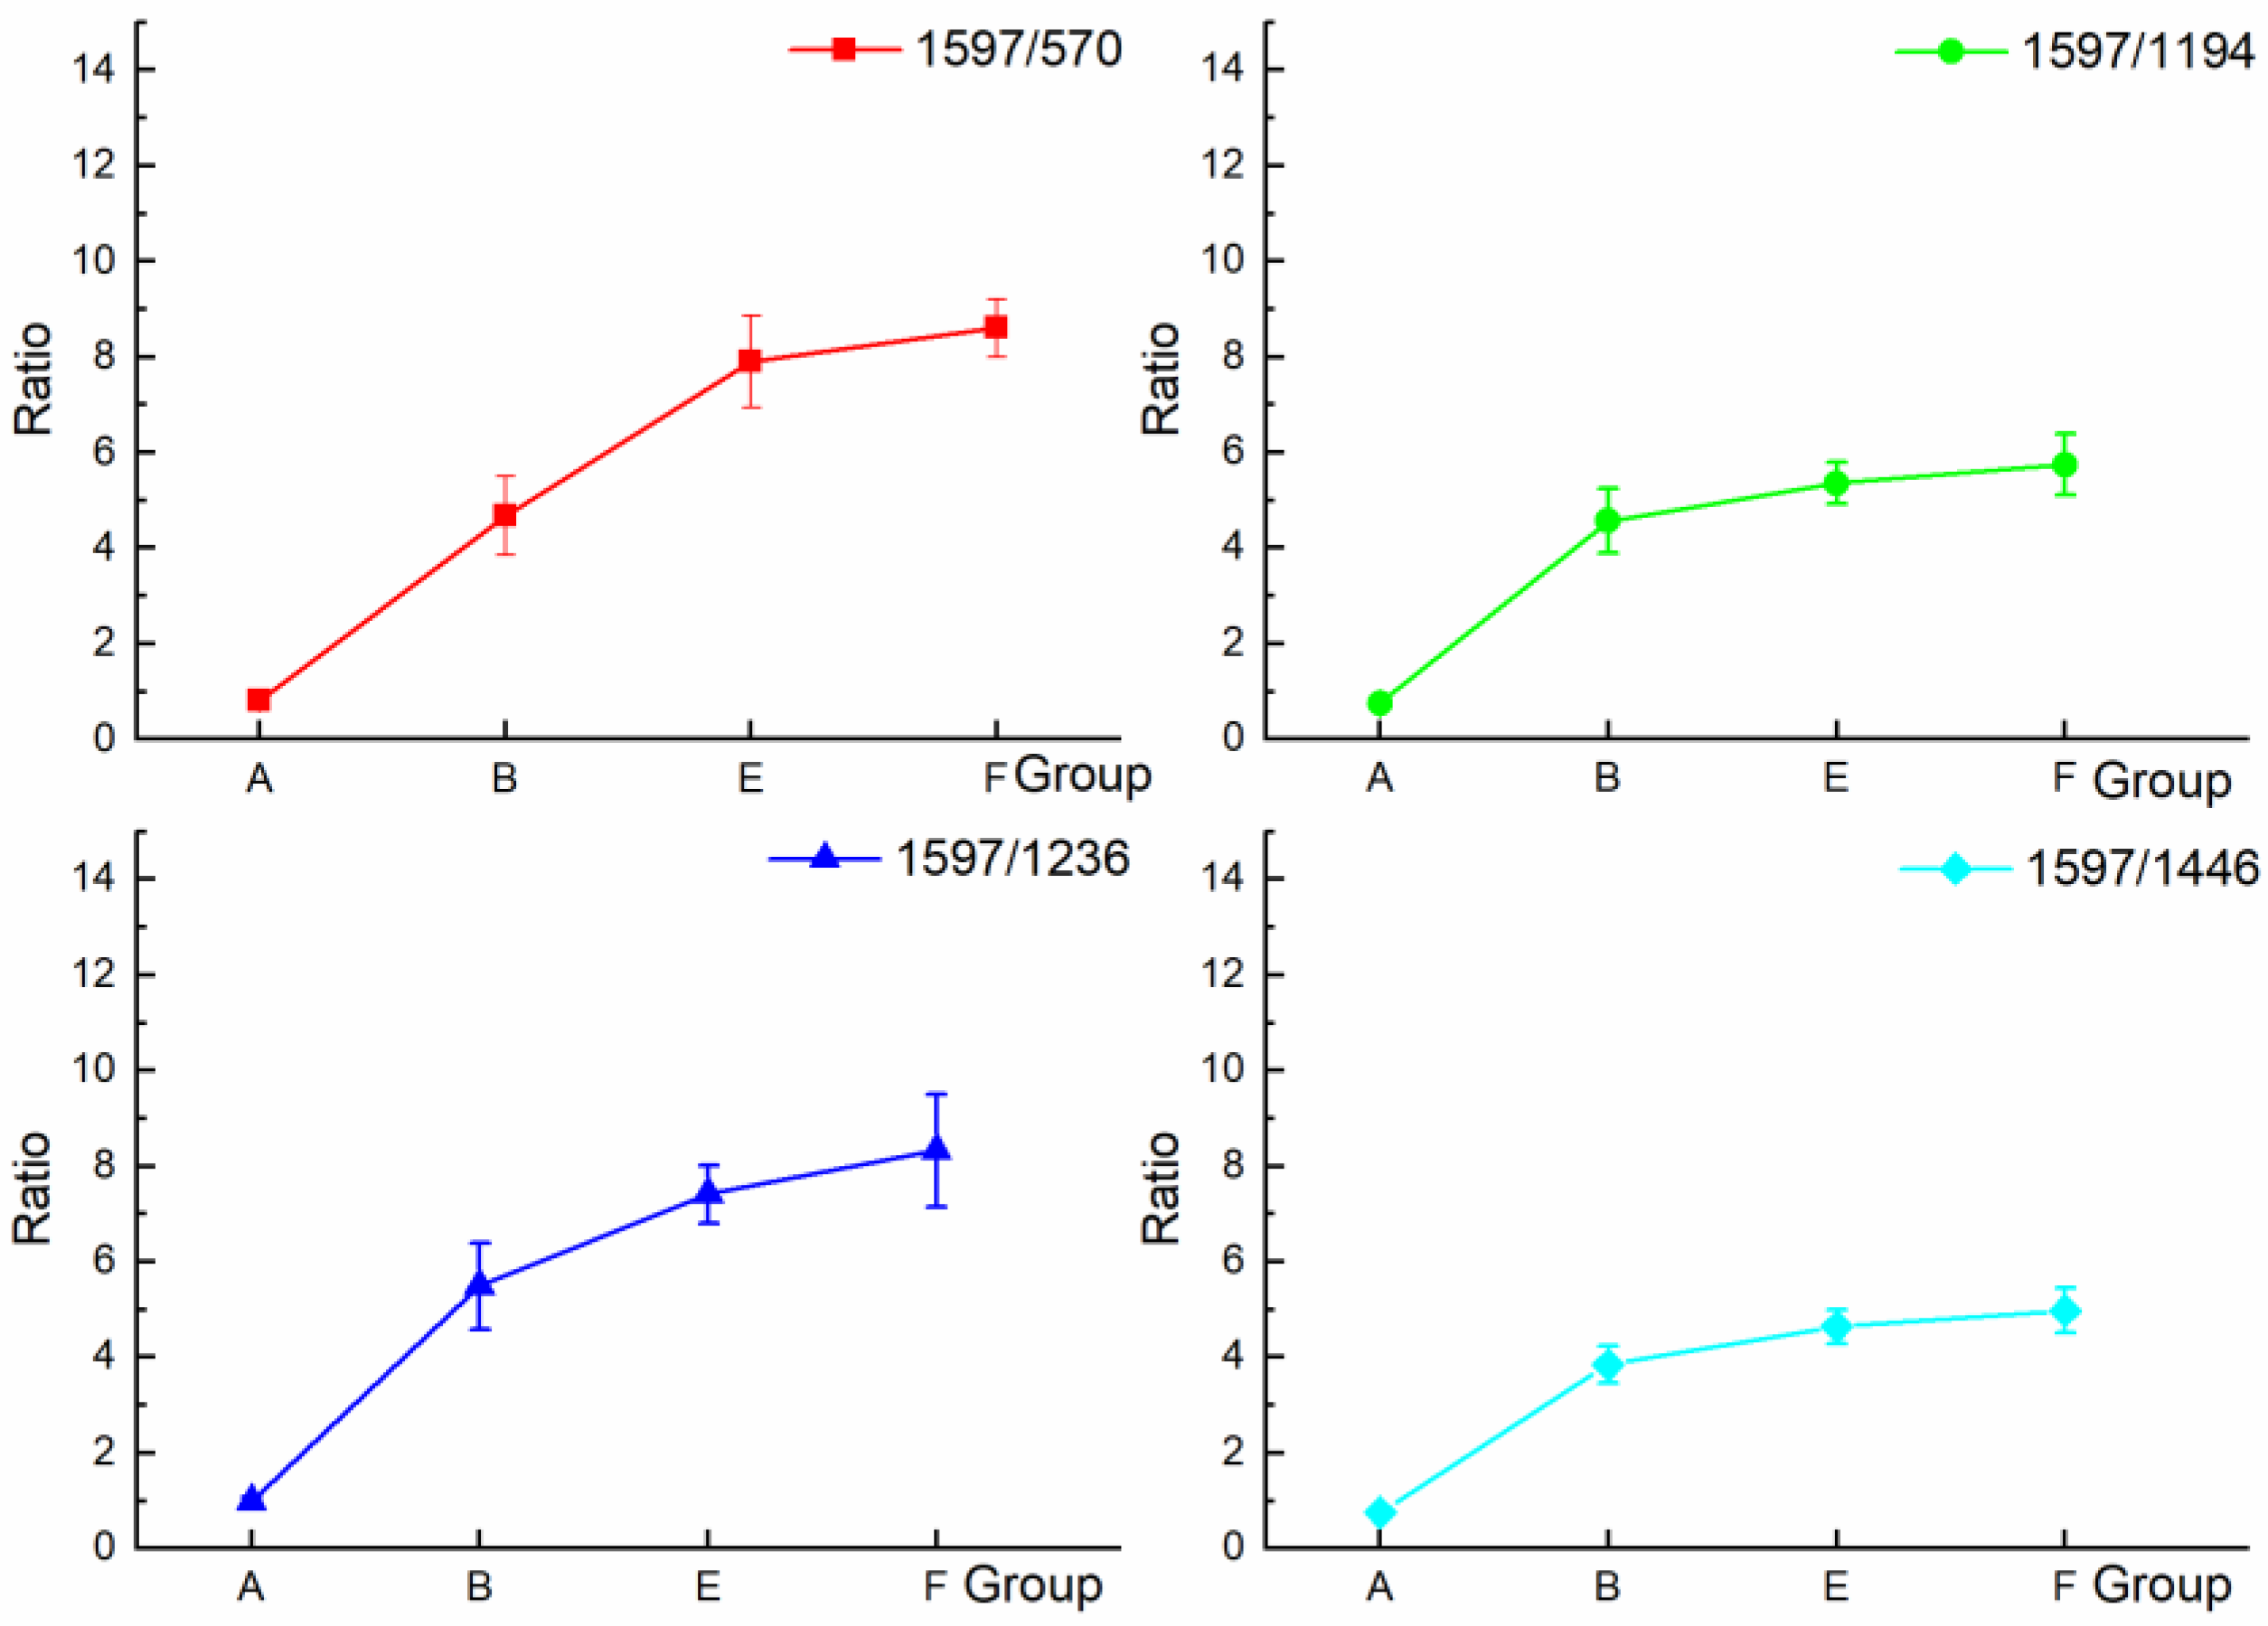
| Ratios | 1597/570 | 1597/1194 | 1597/1236 | 1597/1446 |
|---|---|---|---|---|
| A | 0.80 ± 0.09 | 0.75 ± 0.05 | 0.99 ± 0.09 | 0.75 ± 0.04 |
| B | 4.90 ± 0.83 | 4.57 ± 0.67 | 5.50 ± 0.91 | 3.84 ± 0.39 |
| C | 8.87 ± 0.61 | 8.82 ± 0.41 | 9.80 ± 0.44 | 5.86 ± 0.48 |
| D | 11.57 ± 0.80 | 11.33 ± 0.63 | 11.65 ± 0.53 | 6.02 ± 0.52 |
| E | 7.99 ± 0.96 | 5.35 ± 0.43 | 7.41 ± 0.60 | 4.64 ± 0.35 |
| F | 8.60 ± 0.61 | 5.75 ± 0.64 | 8.32 ± 1.18 | 4.98 ± 0.46 |
Publisher’s Note: MDPI stays neutral with regard to jurisdictional claims in published maps and institutional affiliations. |
© 2022 by the authors. Licensee MDPI, Basel, Switzerland. This article is an open access article distributed under the terms and conditions of the Creative Commons Attribution (CC BY) license (https://creativecommons.org/licenses/by/4.0/).
Share and Cite
Bi, J.; Li, S.; Bao, X.; Chen, N.; Fan, K.; Liu, S. Permeation Effect Analysis of Drug Using Raman Spectroscopy for Iontophoresis. Appl. Sci. 2022, 12, 6871. https://doi.org/10.3390/app12146871
Bi J, Li S, Bao X, Chen N, Fan K, Liu S. Permeation Effect Analysis of Drug Using Raman Spectroscopy for Iontophoresis. Applied Sciences. 2022; 12(14):6871. https://doi.org/10.3390/app12146871
Chicago/Turabian StyleBi, Jiachen, Shuyang Li, Xiang Bao, Na Chen, Kai Fan, and Shupeng Liu. 2022. "Permeation Effect Analysis of Drug Using Raman Spectroscopy for Iontophoresis" Applied Sciences 12, no. 14: 6871. https://doi.org/10.3390/app12146871