Abstract
In order to study the influence of workpiece surface topography on deformation and residual stress during shot peening, the paper built a rough surface single-shot peening simulation model and designed a rough surface workpieces shot peening experiment to verify the correctness of the built simulation model, which differed from the smooth surface simulation model and was closer to the actual processing situation. Based on the W-M fractal dimension theory, the shot peening model of the target with a rough surface is established, and the simulation analysis is carried out by finite element software. The effect of different impact positions of the pellet on surface residual stress and surface displacement were also simulated. The simulation found that with the increase of surface complexity, the surface deformation and residual stress would both increase after shot peening. Through shot peening tests on workpieces with different surface roughness, it is found that the error between simulation and experiment results on surface deformation and residual stress are both less than 20%, which verifies the validity of the rough surface single-shot peening model and that the established model could provide a new method on shot peening simulation analysis.
1. Introduction
In the hydrogen production reactor, hydrogen embrittlement and hydrogen corrosion of materials may appear due to the permeation and corrosion of hydrogen. By using the surface strengthening process, the density of surface and subsurface microstructure of materials, the surface compress residual stress could increase, and the distribution of residual stress on the surface of material could be improved, which could effectively avoid hydrogen embrittlement and hydrogen corrosion caused by hydrogen and improve the reliability and service life of the hydrogen production reactor. Therefore, in order to avoid the phenomenon of hydrogen embrittlement and hydrogen corrosion, the shot peening technology is used during the manufacturing process of the hydrogen production reactor. Shot peening is a strengthening technology that uses high-speed pellet flow to impact the surface of workpieces. During the processing, the impact of pellet flow causes plastic deformation and residual stress on the surface of workpieces, and the subsurface structure is refined, which could improve the fatigue and corrosion resistance of processed workpieces, enhancing their working lives [1]. The shot peening process has the advantages of simple operation and high processing efficiency, making it widely used in aerospace, automobile, machinery, and other fields [2,3].
Many researchers use the finite element method to study the shot peening process. Wang et al. [4] used the diffusion model established by Oriani and Sofronis et al. and made a numerical analysis of the influence of plastic deformation and residual stress on hydrogen transport into PSB1080 high-strength steel. He et al. [5] built different geometric feature single-shot peening simulation models by ABAQUS simulation finite element simulation software. Used the software to analyzed the target material’s geometric feature and shot peening parameters on the surface to strengthen effect, converted the model into a double-shot peening model, and carried out the double-shot peening technology research. Wu et al. [6] studied parameter optimization in model mesh density and friction coefficient of the single-shot peening simulation model; a multi-shot peening simulation model of AISI304 stainless steel was built based on the simulation results and optimized AISI304 stainless steel processing parameters. Meguid et al. [7,8,9,10] built different single-shot peening models, including the quarter model, axial symmetry model etc., and researched the effect law of shot peening parameters on different surface integrity parameters based on the models. Purohit et al. [11] mentioned a new elasto-plastic numerical approach. The pseudo-dynamic explicit model is validated by a single-ball dropping experiment from the literature and applied to the design of parameters for multi-shot peening of the hardened steel surface, which provides a new method to analyze the expected residual stress distribution in the strip curvature calculation target. The scholars mentioned above carried out a single-shot peening simulation study, analyzed the regulation of model geometry characters, mesh division form and other factors on shot peening simulation results in the simulation process, and the residual stress obtained from the single-shot peening simulation model is applied to the simulation analysis of other factors. During the modeling process, the scholars mentioned above set the surface of the target material as a smooth plane, the research on the impact of a single pellet provides theoretical and data support for the subsequent development and research of a multi-shot peening model.
Li et al. [12] compared the differences between the single-shot peening model and multi-shot penning model and found that the equivalent plastic strain increases with the peening frequency in the case of the single-shot impact model. However, the residual stress is not significantly affected by the frequency. Zhang et al. [13] also built a shot peening model and studied the propagation and interaction of stress waves in the treated material. They studied the overlapping ratio between shots by the established high peening coverage model and examined the effects of impact sequence, material strain rate and initial residual stress on the residual stress and the surface deformation. Wang et al. [14] used secondarily development with the ABAQUS single-shot peening model to build a finite element model with multiple randomly distributed shots whose number depends on the accurate number of models calculated under different working conditions and different shot peening coverage. Astaraee et al. [15] developed a detailed numerical model of dual-shot peening on case hardened gears by considering the variation of material properties through the thickness, various modeling approaches were incorporated to consider the deviation of the impact angle due to geometrical features, and the built model could predict the final distribution of residual stresses and surface roughness. Liu et al. [16] established a random multi-shots model which incorporated dislocation density-based constitutive equations; with the developed model, the effects of peening velocity, peening coverage, and double peening on the surface integrity in terms of the residual stress, surface roughness, and dislocation cell size were analyzed. Tu et al. [17] coupled the Discrete Element Model (DEM)—Finite Element Model (FEM) to predict the process’ effects in terms of residual stresses and roughness. Wang et al. [18] combined the finite element method and response surface methodology; the proposed shot peening finite element model could give a reasonable prediction of compressive residual stress field and dimple size, and the shot peening process parameters could be optimized based on the data obtained from shot peening simulation. Liu et al. [19] established a random multiple-shot model to obtain the rough surface profile under the peening parameters, and the rough surface profile was processed by Gaussian filtering to calculate the roughness of the shot peening surface. Qiang et al. [20] employed a random-shots finite element model and a new coverage calculation method to study the effect of shot peening coverage on the residual stress field and surface roughness; the validity of the simulation model was verified by experiments. The scholars mentioned above, according to the actual shot peening and based on the research results of single-shot peening, developed the multi-shot peening simulation model. During the modeling process, the surface of the target material is also set as a smooth plane; although the simulation model could predict the residual stress, surface deformation, and other characteristics of the workpiece after shot peening, the models still ignores the effect of initial surface roughness on shot peening.
Maleki et al. [21] combined the results of shot peening and finite element simulation method and carried out a numerical simulation of residual stress relaxation due to fatigue loading. Mahmoudi et al. [22] used a four-point bending rig and grinding to generate the initial stresses, and employed the incremental center hole drilling technique to measure the residual stresses on the bent, ground, shot peened, and bend plus shot peened specimens. After that, they carried out a simulation analysis to compare the redistribution of residual stress caused by different techniques after shot peening, which gave a better understanding of how shot peening residual stresses were redistributed. Maleki et al. [23,24] carried out a simulation and experiment on shot peening and severe shot peening and tested the properties of workpieces after processing. It is found that after grinding, shot peening and severe shot peening have significant effects on the improvement of fatigue life, and the coverage of shot peening could affect the generation of surface compress stress, which could improve the service life of workpieces. Unal et al. [25] performed shot peening, severe shot peening, re-shot peening and precise grinding combined simulation and experiments, tested the depth and value of residual stress of workpiece after different combined machining, and analyzed the law of combined process on fatigue life of workpieces. The scholars mentioned above combined the results of shot peening simulation and experiments, considered the effect of the former process on shot peening, analyzed the interaction between shot peening and other processes, and finally predicted and analyzed the microstructure, mechanical properties, residual stress distribution, and fatigue life of the workpiece after the combined machining. However, during the combinatorial analysis, it is assumed that the workpiece processed, when shot peening is the first process, it is a smooth surface or only extracts the stress field after the previous process as the initial condition for subsequent shot peening, ignoring the change of surface deformation or surface topography caused by a former mechanical process.
After years of research and development, the simulation models built in the process of shot peening research transformed from 2D to 3D models and gradually developed into a combination of various processes. As the foundation of the shot peening model, the single-shot peening model plays a crucial role in mechanism research on the impact process of shot peening. The modeling process gradually considers the influence of original residual stress on the shot peening effect, and the model could comprehensively analyze the shot peening parameters and explain the processing phenomenon well [26,27]. However, in most of the shot peening simulation studies, the surface shape of the target material surface is neglected as a smooth surface, and the simulation process ignores the influence of surface topography on simulation results. Therefore, to make up for the current stage of shot peening simulation research mainly based on smooth surfaces, ignoring the shortcomings of the initial shape of the workpiece surface on the impact of the shot peening process, the paper mentioned a rough surface single-shot peening simulation model. The model considers the effect of target material surface roughness and surface topography on shot peening and sets the surface of the target material as a rough surface. The target material surface changes into an anon-ideal smooth surface, and the change of surface roughness due to the removal of workpiece surface material due to machining are considered in the simulation. Therefore, the rough surface shot peening model is more consistent with the actual processing situation, and the simulation results could be more consistent with the actual processing result.
In this paper, a rough surface solid model was constructed by using the spline curve generated by W-M fractal dimension theory, and a rough surface shot peening simulation model was built based on the constructed rough surface solid model. The paper is based on the rough surface shot peening simulation model to analyze the law of surface roughness, surface topography, and impact positions on surface deformation and surface residual stress. This study carried out shot peening experiments on different rough surfaces, and compared the surface topography, pit sizes, and surface residual stresses before and after shot peening to verify the effectiveness of the established simulation model. The single-shot peening simulation model established in this paper can be used for the subsequent development of the multi-shot peening model and provides a new research idea for shot peening simulation.
2. Rough Surface Single Pellet Impact Model
The strengthening effect of shot peening is mainly manifested in residual compressive stress strengthening and material microstructure strengthening. During the shot peening process, the high-speed pellet impacts the surface of the workpiece, and plastic deformation appears on the workpiece surface. The uneven deformation between the surface and inner of the workpiece would cause the residual compressive stress layer to appear in the plastic deformation layer on the surface, which could cause the residual compressive stress strengthening effect. Moreover, the microstructure would regularly change after plastic deformation, which mainly appears in grain refinement, the increase of microstrain and dislocation number and so on [28]. The strengthening principles of shot peening are shown in Figure 1.
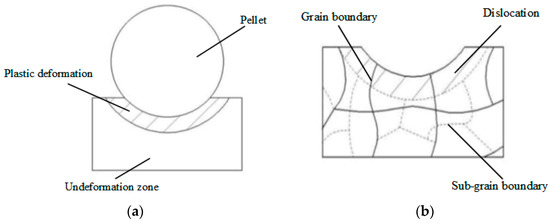
Figure 1.
Strengthening effect of shot peening. (a) Pellet and surface strengthening effect; (b) microstructure of shot peening layer.
The pellet impacts the workpiece surface at high speed during the contact process; the pellet’s kinetic energy decreases and presses into the surface of the workpiece, eventually. Plastic deformation appears on the surface to form a pit similar to its shape; as the kinetic energy of the pellet decreases to zero. The pellet is subjected to the elastic action of the workpiece surface, gains kinetic energy, is ejected from the workpiece surface, and finally, leaves the workpiece surface. Other pellets repeat the same process. Therefore, the shot peening process could also be simplified as the process of a blunt head pressing into the workpiece. The whole process is a high-speed instantaneous contact process, so the Johnson–Cook constitutive model is used to simulate the plastic deformation of the shot peening process. The expression of the Johnson–Cook constitutive model is:
where σe is the equivalent stress, εe is the equivalent strain, is normalized equivalent plastic strain rate, A is initial yield stress under the temperature Tr, B is strain hardening parameters, n is strain hardening exponent, C is coefficient of strain rate sensitivity, T is experimental temperature, Tm is material melting temperature, Tr is reference temperature, and m is the thermal softening coefficient.
When the blunt head presses into the surface, it causes the material under the solid surface to be displaced radially with the contact point as the center, and the isostrain surface is approximately semicircular with the initial point of contact as the center [29]. Based on this situation, it can be considered that the contact between the target material surface and the blunt head is wrapped into a ball cavity with radius a. Due to the indentation of the blunt head, there is a uniformly distributed pressure Pi at the cavity boundary, and the Pi increases with the pressing of the pressure head. The stress and strain outside the cavity are assumed to be radial symmetry in a coordinate system. The stress and strain on the cavity are the same as stress and strain in the thick spherical shell under pressure Pi, neglecting the material’s compressibility in the cavity. The volume of material flowing out on the cavity boundary is equal to that under the blunt head, and the spherical cavity expansion model can be used to analyze the stress field. Based on the conditions above, Xiao, based on the Johnson–Cook constitutive equation, obtained the press stress model in the plastic deformation area in spherical cavity model where the target material was only under the vertical shot impact of pellet; the radius R pellet impacted the smooth target material surface vertically with a speed of V. Finally, the spherical cavity internal pressure model caused by pellet impacted the target material surface, as shown in [30]:
where σy is the strain field, rc is the radius of the plastic deformation zone in the spherical cavity model, r0 is the global radius of the spherical cavity model, r is the radius of any region in the spherical cavity model, and a is the pit radius caused by impact.
The differential relationship between pit size caused by impaction and variation of impact speed is:
where V is the velocity after the pellet contacts with the target, p is the actual average contact pressure, mp is the mass of the pellet, and E is the elastic modulus of the target material.
Equations (2) and (3) are cavity models proposed based on pellet vertical impact on the smooth surface. However, considering the pellet impact on the rough surface, the impact position could be the bump slant of the rugged peak. Based on the situations mentioned above, the modified spherical cavity pellet impact model is shown in Figure 2. Assuming the impact velocity of the pellet is perpendicular to the horizontal plane, at the moment of impact, the rough surface of the contact area is regarded as a plane at an angle of α to the horizontal plane. The rough surface deforms along the normal line direction after the pellet impact. The modified spherical cavity internal pressure model caused by the pellet impact on rough surface shows as:
where α is the angle between tangent direction and horizontal direction of the contact point at impact moment.
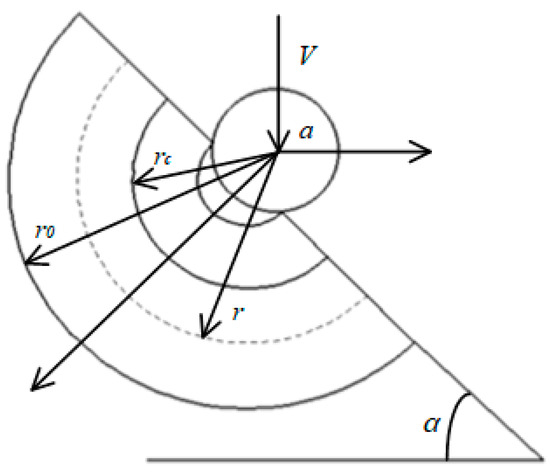
Figure 2.
Spherical cavity model of rough surface impact.
When the pellet contact with the rough surface, the differential relationship between pit size caused by impact and variation of impact speed is:
The whole shot peening process contains conversion of kinetic energy, target deformation and other energy, so the shot peening process satisfies the energy balance equation:
where EI is the internal energy, EV is the viscous energy dissipated, EFD is the frictional energy dissipated, EKE is the kinetic energy, EIHE is the internal heat energy, EW is the work done by the externally applied loads, EPW is the work done by contact penalties, ECW is the work done by constraint penalties, EMW is the work done by propelling added mass, EHF is the external heat energy through external fluxes, and Etotal is the sum of energy components.
In Equation (6), the internal energy is:
where EE is the recoverable elastic strain energy, EP is the energy dissipated through inelastic processes, ECD is the energy dissipated through viscoelasticity or creep, EA is the artificial strain energy, EDMD is the energy dissipated through damage, EDC is the energy dissipated through distortion control, and EFC is the fluid cavity energy.
In the shot peening process, the dynamic system of pellets and target material satisfies the dynamic equilibrium equation:
where M is the mass of the structure, is the acceleration of the structure, I is the internal forces in the structure, and P is the applied external forces.
Considering the influence of material damping on the internal force of the system, the dynamic equilibrium equation of system internal force could be rewritten to include damping as:
where is system displacement, Cs is damping matrix of system, and is the velocity of structure.
3. Establishment of Fractal Model of Rough Surface Single-Shot Peening
3.1. Fractal Model Establishment of Rough Surface and Surface Roughness Measurement
The W-M fractal function has continuity, non-differentiability, and similarity; it is a typical function representing random contour [31]. Therefore, a random rough outline is built based on the 3D W-M function model. The expression of the 3D W-M function model is:
where Cn is the scale dimension; it is a random number that follows a normal distribution with a mean of 0 and a variance of 1; An, Bn are random numbers that obey the uniform distribution on [0, 2π] independent of each other; Ds is the fractal dimension, 2 < Ds < 3; γ is a characteristic parameter, it is a constant greater than 1, usually taken 1.5; and n is a natural sequence number.
The fractal dimension is set to 2.1, and the scale dimension equivalent grows between 0.01 and 0.06 to generate different random spline curves. The spline curves are transformed into a solid model with one side of the rough surface using 3D modeling software. The 3D model surface calculates the average contour deviation Ra, which is set as an evaluating indicator. The average contour deviation Ra program is consistent with the relevant calculation standards in the surface roughness ISO 25178, calculates the average profile deviation Ra in both horizontal and vertical directions, and takes the average value. The relation between scale dimension and surface roughness Ra is shown in Table 1. Finally, the rough solid model is imported into the finite element simulation software and transformed into the finite element simulation model; the modeling process is shown in Figure 3. From Table 1, there is little difference in generated surface roughness between scale dimensions 0.02 and 0.03. The roughness of surfaces generated by scale dimensions 0.04 and 0.05 is equal. So, the spline curves generated by 0.01, 0.03, 0.04, and 0.06 are chosen for the developed solid model during the simulation modeling process.

Table 1.
Relation of scale dimension and surface roughness.
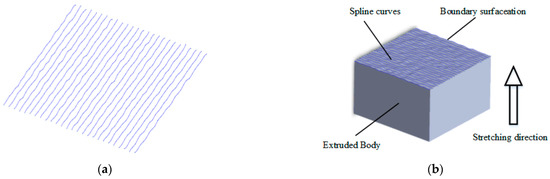
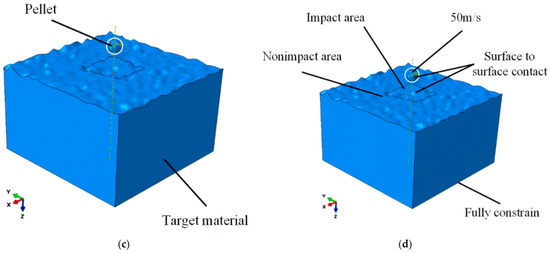
Figure 3.
The establishing process of rough surface single-shot peening simulation model. (a) The generated spline curves; (b) the process of spline curves transfers into 3D solid model; (c) the established simulation model; (d) the boundary conditions and kinetic parameters of simulation model.
3.2. Establishment of Finite Element Simulation Model
The rough surface single-shot peening simulation model is built by ABAQUS finite element analysis software based on W-M fractal dimension. The whole scale of the target material is 5 mm × 5 mm × 3 mm, and the diameter of the pellet is 0.5 mm. The target material uses a regular hexahedron grid to mesh. According to the principle of the relationship between the target material and pellet, the grid size on the surface of the impacted specimen shall be less than 1/10–1/20 of the pellet size [32,33]. The impact area is divided into 2 mm × 2 mm square area and the mesh size in this area is locally densified by 1/15 of pellet size, which is 0.03 mm. The mesh size of the nonimpact contact area of the rough surface is set at 0.5 mm, and the mesh size along the depth direction is set from 0.03 mm to 0.5 mm based on single precision. The pellet mesh size is set at 0.03 mm.
The pellet is set as a rigid body in the single-shot peening model. “Surface to surface contact” is selected as the contact form between the pellet and target material surface. The target material model only fully constrained its bottom surface. During the shot peening process, the pellet velocity is set at 50 m/s. In the establishment of modeling, it is only considered the influence of surface roughness on shot peening and ignores the residual stress on the rough surface during the manufacturing process; therefore, the initial residual stress on the surface and inner of the model is set at zero. The established single-shot peening model and boundary conditions of the simulation model are shown in Figure 3d,e.
3.3. Material Constitutive Model Parameters
The pellet material in the simulation model is steel, and the material parameters of the pellet are shown in Table 2. The target material is Q235B, and the Johnson–Cook constitutive model parameters are shown in Table 3 [34].
Table 2.
Parameters of pellet.
Table 3.
J-C parameters of Q325B.
4. Simulation Analysis of Roughness on Shot Peening Residual Stress and Surface Deformation
4.1. Effect Analysis of Roughness on Residual Stress and Deformation of Shot Peening
4.1.1. Maximum Residual Stress of Different Surface Roughness
The generated rough surface is random due to the target material model being established based on the W-M fractal dimension. Different impact positions are selected on each surface roughness to prevent the randomness from affecting the simulation results. The chosen principle is the different contact positions between pellet and surface topography during shot peening, such as pit positions on the target material surface.
The pellet impacts on different rough target material surfaces with a speed of 50 m/s, the average maximum residual stress produced by impact at other positions under five roughness conditions is analyzed, and the pellet impacts on four typical surface topography positions. The maximum residual stress produced by each rough surface after impact is averaged. The surface roughness of the target material is 0, 10, 16, 24, and 29 μm, respectively. Eventually, the moderate maximum residual stress under different surface roughness after impact shows in Figure 4. It shows that, with the increase of surface roughness of the target material, the maximum residual stress on the rough surface caused by pellet impact appears to have a trend of first increasing and then decreasing. The maximum residual stress on the rough surface of 0 and 10 μm produced by impact are relatively close, and the maximum residual stress on the rough surface of 16 and 24 μm are also close. The maximum average residual stress appears on the workpiece with a surface of 24 μm, which is 1124.7 MPa.
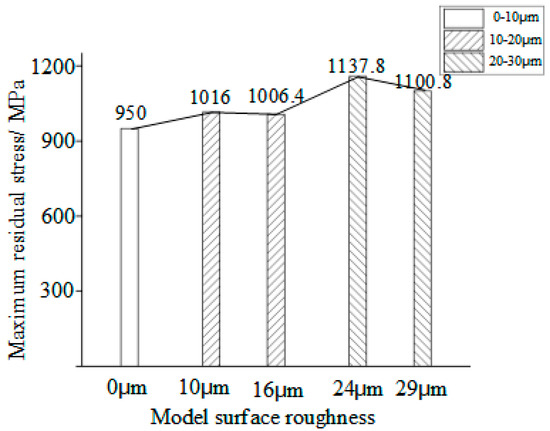
Figure 4.
Effect of target surface roughness on maximum residual stress.
4.1.2. Discussion of Relation between Surface Roughness and Maximum Surface Residual Stress
The reason for the phenomenon may be that during the shot peening process, the kinetic energy of the pellet decreases rapidly with the increase of impact indentation depth. When the kinetic energy decreases to zero, the rebound effect of plastic and elastic deformation on the target material surface pushes the pellet apart. During the impact process on the smooth surface, the depth of impact and pit size gradually increases. Moreover, the contact area of the pellet and target surface increase with the deformation degree of the target material, which reduces the stress effect caused by the impact of the pellet on the surface of the target material. This reason, reflected in Figure 4, is that the average maximum residual stress caused on low rough surfaces such as 0 and 10 μm surfaces is relatively small. Meanwhile, the generated surface with a roughness of 10 μm is relatively smooth; there are no noticeable surface features such as bumps and pits. Therefore, the maximum residual stress caused by impact on those surfaces increased relatively small than that on a smooth surface, only increasing by 1.51%.
Surface waviness increases with the increase of surface roughness, and more apparent peaks and pits form on the surface. The actual contact area in the shot peening process converts a smooth surface to a small plane or curved surface. During the pellet impact on the surface with the same kinetic energy, the contact area of the surface and pellet reduces, and the topography limits the deformation of the target surface. The two reasons lead to the contact area on a rough surface being smaller than the contact area on a smooth surface with the depth increase of the impact and the stress effect increase caused by the pellet impact.
Therefore, the maximum residual stress on the rough surface caused by the pellet impact is relatively high. The maximum residual stress increases with the increase of target material surface roughness. Therefore, in Figure 4, the average maximum residual stress generated by the surface with a pellet impact roughness of 16 and 24 μm is, respectively, 16.5% and 18.4% higher than that of the surface with impact roughness of the smooth surface. The maximum residual stress of the 29 μm surface is 13.7% higher than that of the smooth surface.
It also can be seen that in Figure 4, the average maximum residual stress on the roughness of 29 μm is slightly smaller than that of the roughness of 24 μm. The main cause of the trend of average maximum residual stress first increases and then decreases. With the increase of surface roughness, the surface topography becomes more complex, and the stress effect caused by pellet impact would be increased, so the average maximum average residual stress on the workpiece surface after the impact has a trend of increasing. When the surface roughness is larger than 24 μm, the surface topography becomes over complex, which could limit the deformation of impact; the stress caused by impact could easily be released, so the trend of average maximum residual stress decreases. The average maximum residual stress first increases and then decreases.
It also should notice that under the condition of current simulation model settings, when the surface roughness of the simulation model is Ra 24 μm, after the pellet impacts on different positions, the average maximum residual stress could be obtained. This phenomenon could assume that, under the condition of the built model, the surface roughness of Ra 24 μm is the best initial surface roughness.
4.1.3. Analysis of Different Roughness Surface Deformation Effects
In order to study the effect of surface roughness on the deformation of surface materials after shot peening, the surface displacements of five target materials with different surface roughness in the deformation zone after shot peening were simulated and analyzed. The stress and displacement of each node are extracted, and the selected nodes are on the surface of the target material in the stress distribution area under the direction marked in Figure 5. In the analysis process, the positive direction of displacement is consistent with the impact direction of pellets set in modeling, which is the positive direction of the Z-axis.
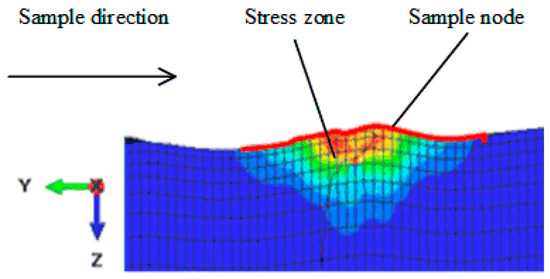
Figure 5.
Sampling diagram of displacement analysis node.
The typical stress nephogram of the impact area on the material surface after shot peening is shown in Figure 6, and the range of residual stress is shown in Table 4. As can be seen, with the increase of surface roughness, the topography of the target material surface becomes more complex, and the range of residual stress distribution gradually decreases. The stress distribution nephogram slowly changes from a standard circle to an irregular shape. The stress value distribution gradually changes from “first increases and then decreases” into “attenuation from the center of impact to all sides”.
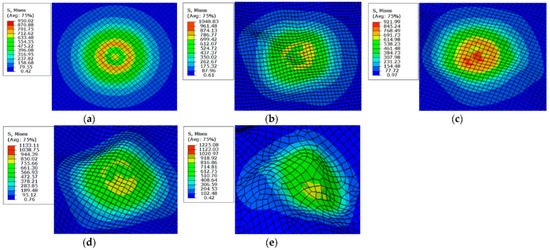
Figure 6.
Deformation effect of different roughness target material surface. (a) Smooth Surface; (b) 10 μm; (c) 16 μm; (d) 24 μm; and (e) 29 μm.
Table 4.
Range of residual stress distribution.
After the pellet impacts the smooth surface, the residual stress distribution is circular around the pit, generated by the impact. Due to the deformation and accumulation of materials on the target surface, the stress distribution first increases and then decreases outward from the circle’s center, the range of distribution is around 0.87 mm, and the residual stress rises from 548.2 MPa to 771.7 MPa and finally falls to 79.5 MPa. The stress generated by the impact distributed on the low surface roughness is 10 μm and 16 μm; the distribution trend of stress value and stress distribution shape is similar to that of a smooth surface, with a distribution range of 0.99 mm and 0.79 mm, respectively. The surface roughness is 10 μm, and the residual stress rises from 269.9 MPa to 771.5 MPa and finally decreases to 80.4 MPa. The surface roughness is 16 μm and rises from 654.6 MPa to 741.2 MPa and then decreases to 76.1 MPa. However, the pellets are affected by the surface target, resulting in stress concentration phenomena, as marked in Figure 6c. Due to its location at the edge of the pit, the target on the material’s surface is subject to more significant stress and the accumulation of the combination of materials, resulting in stress concentration. When the roughness of the target is 24 μm and 29 μm, the surface residual stress distribution is greatly affected by the surface topography of the target, and the distribution range is relatively small, which the distribution range of 24 μm and 29 μm rough surface are 0.75 mm and 0.51 mm, respectively. The residual stresses both appear to have a decreasing trend, which decrease from 864.8 MPa and 854.1 MPa to 85.6 MPa and 79.4 MPa, respectively. There are two reasons for this phenomenon: the contact area between the target and projectile is relatively small; the angle between the target surface and the horizontal plane is large. Both reasons weaken the vertical impact effect of the pellet. The stress distribution shows the trend of “attenuation from the center of impact to all sides”.
4.1.4. Analysis of Average Deformation of Different Roughness Surface
Average the displacement sampling data of the surface stress and strain area of the target with the same roughness after impact; the average displacement of the deformation area after impact is shown in Figure 7. The positive displacement in Figure 7 is caused by pellet impact, consistent with the impact direction in the modeling process.
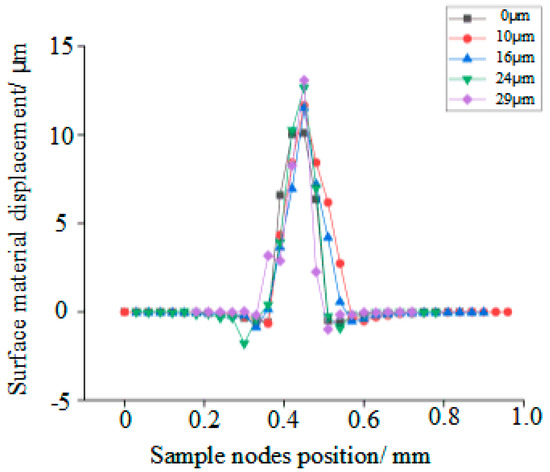
Figure 7.
Schematic diagram of surface material deformation.
Figure 7 shows that when the pellet vertically impacts the rough target surface at 50 m/s, the average material displacement and material accumulation on the target material surface both increase with the increase of surface roughness. The displacement of the small rough surface is relatively small after impact, and the displacement is almost the same under different roughness conditions. The material accumulation is also symmetrically distributed on both sides of the pit. The width of the pit is also approximately the same, with a width of 0.21 mm. The displacement of 10 μm and 16 μm roughness surface has little difference, which are 11.6 μm and 11.5 μm, but slightly higher than the displacement of 0 μm after shot peening, which is 10.1 μm. Due to the relatively simple surface topography of a small rough surface, the material displacement is less affected by the shape limitation and the different impact points of the pellet. Therefore, when the target material surface roughness is small, the material surface displacement has little difference.
The deformation of the large rough surface caused by the impact is more evident than that on the small rough surface with the displacement of 12.7 μm and 13.1 μm. Due to the impact position and the more complex surface morphology of the target, the width of the pit caused by impact on the large roughness surface is relatively small than the impact on small surface roughness; the width of the pit is 0.15 mm. The material accumulation presents high accumulate volume, narrow deformation range, and dissymmetric accumulation.
4.1.5. Analysis of Average Residual Stress Distribution of Different Roughness Surface
Figure 8 shows the distribution of the residual compress stresses-counting position on the target material surface after shot peening. Table 5 shows the average range of residual stress distribution. It can be further proved that surface roughness directly affects the stress distribution. With the increase of surface roughness, the value of residual stress on the surface caused by shot peening also increases; however, the range distribution of residual compress stress decreases. The axis of symmetry is the axis where the pellet impact causes the deepest position of the pit. After shot peening, the distribution range of residual compress stress on a small roughness surface is wide and approximately symmetrical; the surface roughness is 0, 10, and 16 μm, with a range of 0.87, 0.99, and 0.87 mm, respectively. The distribution range of surface residual compress stress on large roughness surfaces is relatively narrow, and the symmetry of residual stress change is relatively weakened. The residual compress stress distribution ranges of 24 μm and 29 μm rough surfaces are 0.75 mm and 0.54 mm, respectively. When the surface roughness is 0 μm and 10 μm, after shot peening, the residual compress stress shows a changing trend of “the residual stress near the axis of symmetry is relatively low, then increases, and finally decreases”. Figure 6a,b reflect the phenomenon. The phenomenon indicates that when the surface is smooth, or the surface topography is relatively simple, the surface morphology has little effect on the surface material accumulation after impact. The combined effect of impact and material accumulation leads to the distribution regulation of “the residual compress stress near the axis of symmetry is relatively low, then increases, and finally decreases” when the target material has small surface roughness. However, when the surface roughness is larger than 10 μm, surface topography is relatively complex, the maximum residual compress stress appears at the impact center, and the residual stress produced by impact also has the characteristics of the asymmetric distribution.
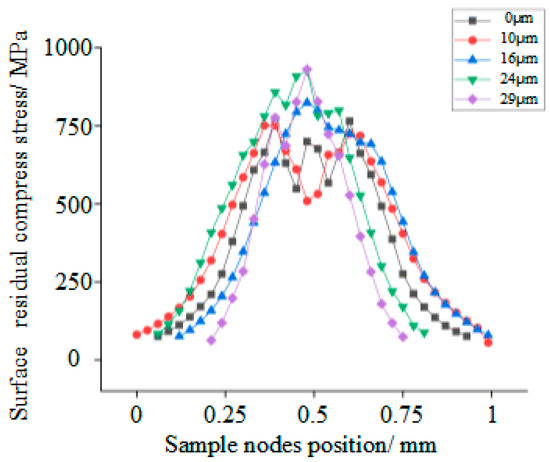
Figure 8.
Distribution of surface residual stress.
Table 5.
Average range of residual stress distribution.
According to the analysis of Figure 7 and Figure 8, the changing trends of residual stress and displacement produced by impact both increase with the increase of surface roughness. The residual stress caused by the impact is the fundamental cause of target material surface displacement. It can be inferred that the surface roughness and topography are the main reasons that affect the surface deformation amount after the pellet impact. In contrast, the residual stress produced by contact form and contact position between pellet and surface is the direct reason for surface deformation and surface material accumulation. Based on the simulation results, it can be inferred that, during the process, the surface finishing treatment of processed parts will affect the surface roughness of parts after shot peening. Under the same machining condition, shot peening would have a specific repair effect on the large roughness of surface topography; moreover, reducing the surface roughness of workpieces could get a better stress strengthening effect. Although the workpieces with the large surface roughness would have a large surface material deformation, there still needs to be attention to the fact that when the surface roughness of the workpiece is over large, the shot peening could not achieve the expected repair effect due to the depth of the wave trough of the workpiece surface topography being large. Therefore, during the process before shot peening, while increasing the surface roughness of the workpiece, it should also make sure that the roughness of the machined workpiece is within a certain range. For the workpieces with small roughness and simple surface topography, the surface material displacement produced by shot peening is relatively low. Shot peening will also change the original roughness and surface morphology and reduce the surface quality of the workpiece. The stress strengthening effect is relatively poor compared with the surface with large roughness.
4.2. Analysis of Residual Stress and Deformation of Different Impact Positions in Rough Surface
The influence law of surface roughness on shot peening could be analyzed by average residual stress and average displacement of selected nodes. However, the analysis of the average value may ignore the particularity of different impact positions. Therefore, to avoid the influence of randomness on analysis and in order to analyze the effect of the impact positions of the pellet on shot peening under different surface roughness conditions, the residual stress distribution and surface material displacement on different target material positions are analyzed after shot peening. The sampling method of analysis nodes is consistent with that in Figure 5. The diagrams of deformation displacement and residual distribution on the same roughness target material surface after pellet impact on different positions are shown in Figure 9 and Figure 10, respectively.
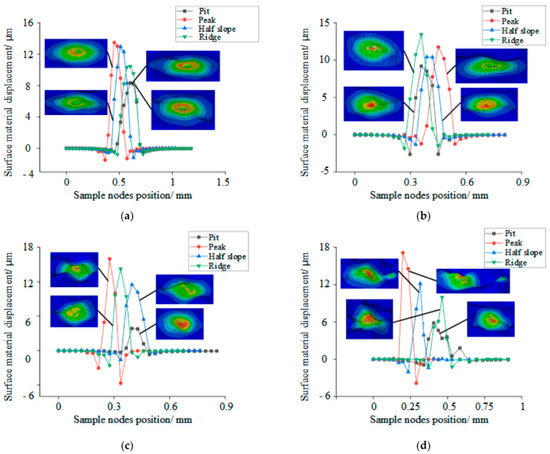
Figure 9.
Deformation of target material surfaces. (a) 10 μm; (b) 16 μm; (c) 24 μm; and (d) 29 μm.
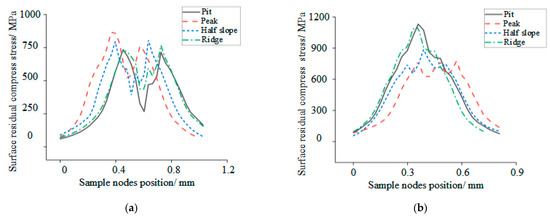
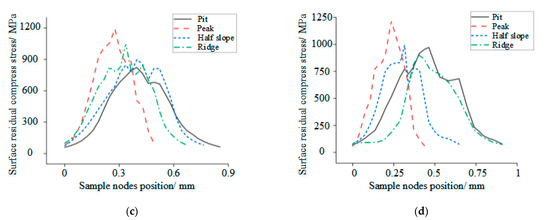
Figure 10.
Distribution effect of residual stress. (a) 10 μm; (b) 16 μm; (c) 24 μm; and (d) 29 μm.
4.2.1. Analysis of Surface Deformation in Different Impact Positions
Four common target morphologies are selected in the process of shot peening, which are pit, peak, half slope, and ridge; the surface material displacement and nephogram characteristics of the target material surface after shot peening are shown in Figure 9. As shown in Figure 9, the surface topography of the target material has a noticeable influence on the impact effect of shot peening. Under the same surface roughness, displacement of the pit under the impact of shot peening is the smallest, the deformation displacement of the impact is the largest at the peak; the displacement of impact on the ridge and the half slope is not fixed, which the surface roughness is 10 μm the displacement at the half slope and is larger than that at the ridge, while the surface roughness is 16 μm the displacement at the half slope and is smaller than that at the ridge. With the increase of surface roughness, the displacement at the pit produced by pellet impact gradually decreases, and the displacement produced by pellet impact gradually increases at the peak. The displacement on the ridge and the half slope is still not fixed, and the surface roughness is 24 μm the displacement at the half slope and is smaller than that at the ridge, while the surface roughness is 29 μm the displacement at the half slope and is smaller than that at the ridge. With the increase of surface roughness, the accumulation of target material surface after impact also shows an asymmetric trend.
Through the comparison of the nephogram, when the surface roughness is 10 μm, the distribution of residual stress in the nephogram has the trend of “first increases and then decreases”, but the stress concentration caused by the surface topography appears in the pit. When the surface roughness is 16 μm, the residual stress distribution trend in the nephogram shows different trends affected by the impact position, which is that the maximum residual stress at the ridge and pit is concentrated in the impact center of the impact, while the trend of first increases and then decreases and still appears at the peak and half slope. The changing trend of residual stress also appears after impact at the half slope. When the surface roughness is greater than or equal to 24 μm, the maximum residual stress concentrates at the impact center. When the surface roughness is 29 μm, at peak and half slope, the pellet leaves the surface after the first impact, which would impact the other position of the target material surface, causing the secondary impact as shown in Figure 9d. Under the condition of the surface roughness of the target material is relatively large, and the surface topography is relatively complex. When the pellet impacts on the half slope of surface topography, the reflect angle of pellet is relative large after impact, making the pellet stick to the target material surface and leave the impact center; during the process of the pellet leaving the impact center, the pellet impacts on the bump of target material surface, causing “secondary impact”. When the pellet impacts on the peak of target material surface, the pellet leaves the impact center with a certain angle, the pellet may have an impact on the position higher than the impact center, which would also cause the “secondary impact”. The accidental appearance of “secondary impact” phenomenon means that when the surface roughness of the workpiece is over large, the pellet which finishes the processing will have a certain effect on the subsequent processing during the shot peening process.
The displacement on the position of the ridge shows the trend of first increasing and then decreasing with the increase of target material surface roughness and surface topography. Mainly this is because when the surface roughness of the target material is relatively small, the ridge on the workpiece surface is much wider and easier to deform due to the impact of the pellet. With the increase of surface roughness, the ridge becomes narrow; although this would cause a larger deformation, the material on the surface of workpiece rebounds seriously due to the serious rebound effect of these target material part, which makes the distribution of the ridge show a trend of first increasing and then decreasing.
4.2.2. Analysis of Different Impact Positions on Surface Residual Stress Distribution
The distribution of residual stress on the surface of the target material after impact is shown in Figure 10. As can be seen, with the increase of surface roughness, the residual stress produced by impact changes obviously, and at the position of the peak and the pit, the change is the most obvious. When the surface roughness is 16 μm, the residual stress caused by shot peening is the largest at the pit while the smallest at the peak. This is because the contact area between the pellet and pit of the small roughness target material surface is relatively small compared with the high roughness surface, and the contact form is on only one side. During the contact process, the deformation on the surface caused by continuous in-depth contact and the one side accumulation caused by the scratch effect on one side strengthens the deformation and stress concentration behavior. Although the contact area at the peak is relatively small, the peak with a small rough surface has an obvious deformation effect through impact. The deformation increases the actual contact area between the pellet and surface, which reduces the stress caused by impact and makes the residual stress relatively small. When the surface is 24 μm and 29 μm, the situation is opposite; the topography of the surface is more complex with the increase of surface roughness, and the contact form between the pellet and peak converts into point contact. Therefore, the maximum residual compress stress appears at the impact center, and the residual stress becomes larger. In addition, the residual compress stresses at the ridge are normally larger than that at the half slope.
By comparing Figure 9 and Figure 10, the surface roughness and surface topography have a noticeable effect on surface material deform displacement and residual stress. It mainly reflects that the values of surface material displacement and surface residual stress change obviously, which is caused by the pellet impacting the peak and the pit, two typical surface topographies. By comparing analysis, we can also see that when the surface roughness is relatively large, the pellet impacted on the surface would have a secondary impact on other surface areas, affecting other pellets, and changing the moment tracking of non-impacted pellets, thus finally affecting the processing effect of shot peening. The phenomenon shows that it is not that the larger the initial surface roughness, the better effect of shot peening it will be. However, in order to achieve a better shot peening processing effect, the initial surface roughness of workpieces should also be considered. It should be processed with relatively small surface roughness and simple surface topography before shot peening, which means the roughness of the workpiece should be controlled within a reasonable range.
5. Experiments of Roughness Surface Shot Peening
5.1. Experimental Design
In order to verify the analysis effectiveness of the simulation model on residual stress and surface deformation on rough workpieces after shot peening, shot peening was carried out on the workpieces with different surface processing. The surface topography workpieces before and after shot peening were tested by Alicona infinite focus G5 auto-zoom surface topography measuring instrument, and the PANalytical X-ray diffractometer was used to test surface residual stress.
The effect of shot peening on surface deformation and residual stress were analyzed by comparing the change of topography and surface residual stress before and after shot peening. Meanwhile, the effect of different initial surface topography on the processing effect of shot peening was analyzed, which was compared with the results of the simulation to verify the validity of the simulation model.
Based on the simulation process, surface morphology plays a major role in shot peening; therefore, the paper designed a single-factor experiment to testify to the regulation of the simulation; the single control variable is the treatment method of the workpiece before shot peening. The whole process of the experiment is divided into three parts, which are pre-processing, shot peening process, and testing. In the pre-processing, three groups of the workpiece with the size of 60 mm × 20 mm × 10 mm were selected to remove the rust on the surfaces. After removing the rust, the surfaces were polished by file, 80# sandpaper, and 1200# sandpaper into different surface topography, respectively. The surfaces of the workpiece were cleaned with absolute alcohol after polishing. The order of surface roughness caused by different surface treatment processes is by 1200# sandpaper, by 80# sandpaper, and by file; in this order, the surface roughness of workpiece becomes larger. The workpieces were cut into the size of 20 mm × 20 mm × 10 mm by wire cut equipment and cleaned with absolute alcohol. After pre-processing, the cut workpieces were processed by shot peening, respectively; the diameter of the steel pellet was 0.5 mm, and the shot peening pressure was 0.25 MPa. After the shot peening, the compressed air was used to blow away the residue of the pellet on the surfaces of the workpiece, which was caused by shot peening, then cleaned the surface with absolute alcohol again. The surface morphometer and X-ray diffractometer were used during the experiment process to measure the surface topography and residual stress before and after shot peening. The whole process of the experiment is shown in Figure 11a, the workpieces before and after shot peening are shown in Figure 11b,c, and the relationship between different groups is shown in Table 6. During the experiment process, the measurement of residual stress by X-ray diffractometer should obey the definition of <Non-destructive testing-Practice for residual stress measurement by X-ray> GB/T 7704-2017. The measurement of surface topography and deformation obey the definition of surface roughness ISO 25178.
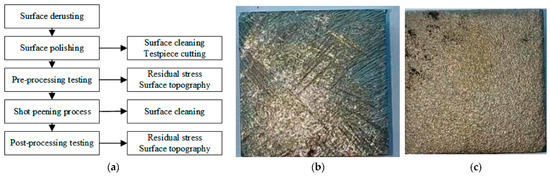
Figure 11.
Experimental process and test piece. (a) Experimental process; (b) unprocessed workpiece; and (c) processed workpiece.
Table 6.
Details of experiment.
5.2. Comparison Analysis of Surface Deformation between Simulation and Experiment
In order to verify the validity of the established simulation model on surface deformation, the depth of pits on surfaces of the workpiece caused by shot peening in the experiment and surface material displacement of simulation results were compared. The result data are shown in Figure 12 and Table 7.
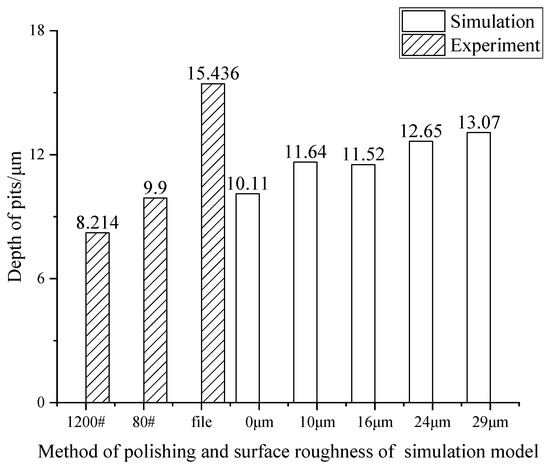
Figure 12.
Pit depth and surface displacement in experiment and simulation.
Table 7.
Depth of pits on the workpiece in simulation and experiment.
It can be seen in Figure 12 and Table 7 that the minimum pit depth is 8.124 μm, which appears on the workpiece surface processed by 1200# sand paper, and the depth is 18.75% different from the 10.11 μm depth of the simulated smooth surface. The maximum pit depth is 15.436 μm, which appears on the workpiece processed by file; the measured depth of the experiment result is −18.1% different from the 13.07 μm of the maximum simulation result. The main reason for the error between simulation and test result is that the workpiece surface roughness is only considered in the modeling process; the effect of surface hardening caused by the machining process is ignored. Thus, the deformation of the material surface caused by the lower roughness surface is affected, making the simulation result larger than the experiment result. When the surface of the processed workpiece is rather rough, the depth of the pit is deeper; mainly this is because the stress caused by shot peening is strengthened because of the rough surface topography, resulting in obvious deformation. Finally, the depth of the pits on the surface of workpieces produced by shot peening is larger than that obtained by simulation. However, the difference in pit depth between experimental and simulation results is less than 20%, which testifies that the simulation model could effectively analyze the deformation caused by shot peening numerically.
5.3. Measurement and Analysis of Residual Stress before and after Shot Peening
5.3.1. Analysis of Residual Stress Variation before and after Shot Peening
Due to the different surface polishing methods that were used to polish the surface to workpieces before shot peening, the residual stress values introduced during the polishing process are different, so the value and increment of residual stress before and after shot peening were analyzed. The PANalytical X-ray diffractometer was used to measure the residual stress on the surfaces of the workpiece before and after shot peening, which could be used to analyze the influence of surface topography and surface roughness on residual stress caused by shot peening. The value and the increment of surface residual stress before and after shot peening are shown in Figure 13 and Table 8.
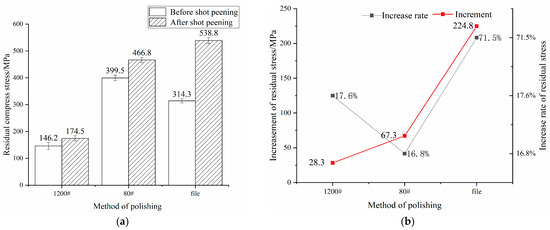
Figure 13.
Surface residual stress of test pieces before and after shot peening. (a) Surface residual compressive stress; (b) variation of residual compressive stress.
Table 8.
Residual stress of workpieces in experiment.
It can be seen in Figure 13 and Table 8 that, with the decrease of polishing accuracy, the surface residual stress and the increment of residual stress are both increased after shot peening: the residual compress stress on the surface polished by 1200# sandpaper increased by 28.3 MPa after shot peening, which means the residual compress stress relatively increased by 17.6%; and the residual compress stress on the surface polished by 80# sandpaper increased by 16.8%, which is no noticeable change in the increase rate compared with that on the surface of polished by 1200# sandpaper. Mainly it is because the residual compress stress caused by polishing is relatively large, however, the residual compress stress on the surface polished by 80# sandpaper increased by 67.3 MPa after shot peening still indicates that the decrease of surface polishing accuracy may cause the increase of residual stress after shot peening. However, the residual compress stress on the surface polished by file increased by 224.8 MPa, which increased by 71.5% before shot peening; both the increment and increase in the rate of residual compress stress are the largest of the three groups of the workpiece. The experimental result is consistent with the regulation of “with the increase of surface roughness, the residual stress increase after shot peening” obtained from the simulation result, which verifies the validity of the rough surface single-shot peening simulation model.
5.3.2. Comparison of Residual between Simulation and Experiment
In the process of residual stress detection, due to the principle of X-ray residual stress measurement, the measured residual stress value is the average residual stress value on the surface of the workpiece. Therefore, the average residual stress obtained by the simulation model is selected to compare with the residual stress results of the shot peening experiment. The residual stresses measured from simulation and experiments are shown in Figure 14 and Table 9.
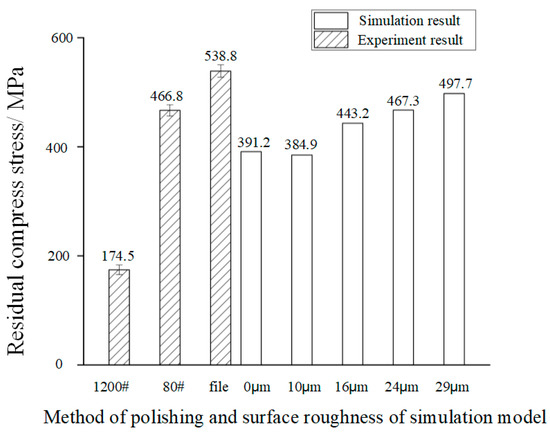
Figure 14.
Residual compressive stress of experiment and simulation.
Table 9.
Residual stress of workpieces in simulation and experiment.
It can be seen in Figure 14 and Table 9 that when the surface was polished by 1200# sandpaper, the surface residual compress stress caused by shot peening is 174.5 MPa, which varies widely from the simulation result of a 0 μm smooth surface. In contrast, the residual stress caused by shot peening on the surface polished by 80# sandpaper and file is larger than the simulation results of the same level. The main reasons for the small residual compress stress on the surface polished by 1200# sandpaper are that the surface becomes smooth in the process of multiple polishing, and residual tensile stress is generated along with the overall residual compressive stress effect on the surface, which relatively weakens the strengthening effect of the surface treatment on the sample surface, resulting in a weaker shot peening effect. However, the residual compress stress on the surface of workpieces polished by 80# sandpaper and file, the residual compress stress caused by the former polishing process has a specific strengthening effect on the surface which improves the surface residual compress stress on the surface; finally, those two workpieces have larger residual compress stress on the surface. However, during the process of establishing the simulation model, the surface topography was only considered, and the residual stress and surface strengthening effect caused by the former processing were ignored. Meanwhile, the simulation model is a single-shot peening model, and the coverage of the simulation model does not reach 100%, which may also cause errors between the simulation and experiment results. Therefore, the residual stress produced by shot peening on a small roughness surface is small, and the simulation result would have a relatively large error in the small roughness surface. In contrast, the simulation average residual stress of the surface with low accuracy of polishing is 8.25% less than that of the experimental residual stress. The error between the experimental and simulation results is less than 20%, proving that the simulation model can effectively analyze the residual stress caused by shot peening on the surface with large roughness.
6. Conclusions
In this paper, a rough surface single-shot peening simulation model was built based on W-M fractal dimension theory. The established simulation model is based on the fact that before shot peening, the surface would be pre-processed, which would change the surface roughness and topography of the workpiece. The simulation model built in this paper considered this situation and set the surface as a rough surface, which is closer to the actual processing situation. The surface roughness is chosen as a variable, and surface maximum residual stress and surface deformation are chosen as indicators. The influence law of different surface roughness and different impact positions on shot peening were analyzed by the built simulation model. The established shot peening simulation model takes into account the influence of surface roughness and surface morphology, which makes the shot peening simulation process closer to the actual shot peening process, and can establish a relationship between the impact of shot particles and surface morphology in the shot peening process, which provides a new way for shot peening simulation.
- (1)
- Based on the built simulation model, the average maximum residual stress was analyzed; the maximum residual stress on the 24 μm surface is 1137.8 MPa after shot peening, which is the largest among all rough surfaces. Meanwhile, the stress caused by impact under the roughness of 24 μm surface increases with the increase of surface roughness. When the surface roughness is greater than 24 μm, the material deformation of the workpiece is limited, which makes the average maximum residual stress shows a trend of first increasing and then decreasing.
- (2)
- The average deformation increases with surface roughness after shot peening, which increases from 10.1 μm to 13.1 μm, while the distribution range of residual stress decreases from 0.87 mm to 0.54 mm. The width of pits decreases with the increase of surface roughness, which decreases from 0.21 mm to 0.15 mm. The residual stress distribution and the surface material accumulation all have the character of asymmetric distribution after the impact.
- (3)
- When the pellet impacts on different positions on the surface with the same surface roughness, it can be seen that large deformation would appear after the pellet impacts at the peak; with the increase of the surface roughness, the deformation at the ridge appears the trend of first increases and then decreases due to ridge at small roughness surface is wider and easy to deform, when the surface roughness is large, the rebound of surface material makes the deformation of ridge relatively small. It is worth noting that when the surface roughness of the target material is 29 μm, the “secondary impact” appears after a single pellet impact, which would affect the subsequent shot peening. Therefore, in order to ensure the complexity of the surface topography is relatively small, the surface roughness should not be too large. In addition, under the condition of the simulation model in the paper, the optimal initial machining surface roughness should be 24 μm.
- (4)
- The shot peening experiments were conducted, and the surface topography and residual stress of processed and unprocessed test pieces were tested. The results show that the residual stress on surfaces polished by 1200# sandpaper, 80# sandpaper and file increased by 17.6%, 16.8%, and 71.5%, respectively; the surface topography test shows that the surface with big surface roughness changes obviously after shot peening. The experiment results mentioned above consist with tend of the rough surface single shot peening simulation results. The errors of residual stress and pit deformation size between the experiment and simulation are less than 20%, which verified the effectiveness of the simulation model.
Author Contributions
S.Z. and Y.L. conceived the idea of this work. Z.W. and J.Y. conducted the simulation and shot peeing experiment; data curation, H.G.; original draft preparation, Z.L.; review and editing S.Z. and Y.L. All authors have read and agreed to the published version of the manuscript.
Funding
This research was funded by the National Key R&D Program of China (2020YFA0714403).
Institutional Review Board Statement
Not applicable.
Informed Consent Statement
Not applicable.
Data Availability Statement
The data used to support the findings of this study are available from the corresponding author upon request.
Conflicts of Interest
The authors declare no conflict of interest.
References
- Miao, H.; Zuo, D.W.; Wang, M.; Zhang, R.H.; Wang, H.F. Numerical calculation and experimental research on residual stresses in precipitation-hardening Layer of NAK80 steel for shot peening. Chin. J. Mech. Eng. 2011, 24, 439–445. [Google Scholar] [CrossRef]
- Gao, Y.K.; Wu, X.R. Experimental investigation and fatigue life prediction for 7475-T7351 aluminum alloy with and without shot peening-induced residual stresses. Acta Mater. 2011, 59, 3737–3747. [Google Scholar] [CrossRef]
- Zhang, H.W.; Zhang, Y.D.; Wu, Q. Three-dimensional numerical analysis of residual stress field for shot peening. J. Aerosp. Power 2010, 25, 603–609. [Google Scholar]
- Wang, Y.F.; Wu, X.P.; Zhou, Z.L.; Li, X.F. Numerical analysis of hydrogen transport into a steel after shot peening. Results Phys. 2018, 11, 5–16. [Google Scholar] [CrossRef]
- He, Z.S.; Chen, L.; Li, C.; Yu, H.Q. Finite element simulation of single and double shot peening model. J. Plast. Eng. 2020, 143, 159–164. [Google Scholar]
- Wu, G.; Wang, Z.; Gan, J.; Yang, Y.; Huang, H.M. FE analysis of shot-peening-induced residual stresses of AISI 304 stainless steel by considering mesh density and friction coefficient. Surf. Eng. 2018, 35, 242–254. [Google Scholar] [CrossRef]
- Meguid, S.A.; Shagal, G.; Stranart, J.C. 3D FE analysis of peening of strain-rate sensitive materials using multiple impingement model. Int. J. Impact Eng. 2002, 27, 119–134. [Google Scholar] [CrossRef]
- Hong, T.; Ooi, J.Y.; Shaw, B.A. A numerical study of the residual stress pattern from single shot impacting on a metallic component. Adv. Eng. Softw. 2008, 39, 743–756. [Google Scholar] [CrossRef]
- Baragetti, S. Three-dimensional finite-element procedures for shot peening residual stress filed prediction. Int. J. Comput. Appl. Technol. 2001, 14, 51–63. [Google Scholar] [CrossRef]
- Klemenz, M.; Schulze, V.; Vöhringer, O.; Löhe, D. Finite element simulation of the residual stress states after shot peening. Mater. Sci. Forum 2006, 524, 349–354. [Google Scholar] [CrossRef]
- Purohit, R.; Verma, C.S.; Rana, R.S.; Dwivedi, R.; Dwivedi, S. Simulation of shot peening process. Mater. Today Proc. 2017, 4, 1244–1251. [Google Scholar] [CrossRef]
- Li, Y.H.; Wang, F.; Lv, J.; Xu, K.W. Finite element analysis for shot peening models of single shot impact and multiple impingement. J. Xi’an Jiaotong Univ. 2007, 3, 100–104. [Google Scholar]
- Zhang, H.W.; Zhang, Y.D.; Wu, Q. Numerical simulations of shot peening process and impact effect. ACTA Metall. Sin. 2010, 46, 111–117. [Google Scholar] [CrossRef]
- Wang, Y.Z.; Li, F.; Chen, Y.Y.; Zhang, Y.P.; Wu, Z.G.; Wang, C. TC4 shot peening simulation and experiment. J. Beijing Univ. Aeronaut. Astronaut. 2019, 45, 1723–1731. [Google Scholar]
- Astaraee, A.H.; Bagherifard, S.; Bradanini, A.; Duó, P.; Henze, S.; Taylor, B.; Guagliano, M. Application of shot peening to case-hardened steel gears: The effect of gradient material properties and component geometry. Surf. Coat. Technol. 2020, 395, 186–210. [Google Scholar]
- Lin, Q.; Liu, H.; Zhu, C.; Chen, D.; Zhou, S. Effects of different shot peening parameters on residual stress, surface roughness and cell size. Surf. Coat. Technol. 2020, 398, 126054. [Google Scholar] [CrossRef]
- Tu, F.; Delbergue, D.; Miao, H.; Klotz, T.; Brochu, M.; Bocher, P.; Levesque, M. A sequential DEM-FEM coupling method for shot peening simulation. Surf. Coat. Technol. 2017, 319, 200–212. [Google Scholar] [CrossRef]
- Wang, X.L.; Wang, Z.; Wu, G.; Gan, J.; Yang, Y.; Huang, H.M.; He, J.X.; Zhong, H.L. Combining the finite element method and response surface methodology for optimization of shot peening parameters. Int. J. Fatigue 2019, 129, 105231. [Google Scholar] [CrossRef]
- Liu, H.; Dong, H.; Tang, J.; Ding, H.; Shao, W.; Zhao, J.; Jiang, T. Numerical modeling and experimental verification of surface roughness of 12Cr2Ni4A alloy steel generated by shot peening. Surf. Coat. Technol. 2021, 422, 127538. [Google Scholar] [CrossRef]
- Qiang, B.; Li, Y.; Yao, C.; Wang, X. Effect of shot peening coverage on residual stress field and surface roughness. Surf. Eng. 2018, 34, 938–945. [Google Scholar] [CrossRef]
- Maleki, E.; Farrahi, G.H.; Reza, K.K.; Unal, O.; Gugaliano, M.; Bagherifard, S. Effects of conventional and severe shot peening on residual stress and fatigue strength of steel AISI 1060 and residual stress relaxation due to fatigue loading: Experimental and numerical simulation. Met. Mater. Int. 2021, 27, 2575–2591. [Google Scholar] [CrossRef]
- Mahmoudi, A.H.; Ghasemi, A.; Farrahi, G.H.; Sherafatnia, K. A comprehensive experimental and numerical study on redistribution of residual stresses by shot peening. Mater. Des. 2016, 90, 478–487. [Google Scholar] [CrossRef]
- Maleki, E.; Unal, O.; Reza, K.K. Efficiency analysis of shot peening parameters on variations of hardness, grain size and residual stress via Taguchi approach. Met. Mater. Int. 2019, 25, 1436–1447. [Google Scholar] [CrossRef]
- Maleki, E.; Unal, O.; Kashyzadeh, K.R. Effects of conventional, severe, over, and re-shot peening processes on the fatigue behavior of mild carbon steel. Surf. Coat. Technol. 2018, 344, 62–74. [Google Scholar] [CrossRef]
- Unal, O.; Maleki, E.; Karademir, I.; Husem, F.; Efe, Y.; Das, T. Effects of conventional shot peening, severe shot peening, re-shot peening and precised grinding operations on fatigue performance of AISI 1050 railway axle steel. Int. J. Fatigue 2022, 155, 106613. [Google Scholar] [CrossRef]
- Lawerenz, M.; Ekis, I. Optimum shot peening specification-I. Gear Technol. 1991, 8, 15–22. [Google Scholar]
- Seki, M.; Yoshida, A.; Ohue, Y.; Hongo, T.; Shimoyama, I. Influence of Shot Peening on Surface Durability of Case-Hardened Steel Gears. J. Adv. Mech. Des. Syst. Manuf. 2007, 1, 518–529. [Google Scholar] [CrossRef][Green Version]
- Jiang, C.H.; Zhan, K.; Yang, C.Z. Material Shot Peening Strengthening and X-ray Diffraction Characterization; Science Press: Beijing, China, 2019; pp. 2–7. [Google Scholar]
- Johnson, K.L. Contact Mechanics; Cambridge University Press: New York, NY, USA, 1985; pp. 157–172. [Google Scholar]
- Xiao, X.D. Modelling of Shot Peening Stresses and Simulation of Integral Deformation of Strip Peen Forming. Ph.D. Thesis, Xi’an Northwestern Polytechnical University, Xi’an, China, November 2015. [Google Scholar]
- Deng, K.Y.; Liu, Z.; Deng, J.J.; Zhao, Y.C. Variation of surface profile Topography based on W-M function model. Mach. Des. Manuf. 2017, 1, 47–50. [Google Scholar]
- Bagherifard, S.; Ghelichi, R.; Guagliano, M. A numerical model of severe shot peening (SSP) to predict the generation of a nanostructured surface layer of material. Surf. Coat. Technol. 2010, 204, 4081–4090. [Google Scholar] [CrossRef]
- Qiu, Q.Y.; Wang, J.M.; Zheng, L.B. Study on the correlation between surface roughness and residual stress of shot peening. Modul. Mach. Tool Autom. Manuf. Tech. 2018, 8, 23–28. [Google Scholar]
- Wei, S.; Wang, Z.; Yang, Y.; Wang, X.L.; Zhong, H.L.; Tian, W.Z. Finite element analysis of residual stress field of butt welded joint of Q235B by shot peening. Hot Work. Technol. 2020, 49, 122–129. [Google Scholar]


Publisher’s Note: MDPI stays neutral with regard to jurisdictional claims in published maps and institutional affiliations. |
© 2022 by the authors. Licensee MDPI, Basel, Switzerland. This article is an open access article distributed under the terms and conditions of the Creative Commons Attribution (CC BY) license (https://creativecommons.org/licenses/by/4.0/).