Article

Age-Related Study and Collision Response of Material Properties of Long Bones in Chinese Pedestrian Lower Limbs

1
Department of Forensic Science, Soochow University, Suzhou 215000, China
2
School of Mechanical and Vehicle Engineering, Hunan University, Changsha 410000, China
3
Shanghai Key Laboratory of Forensic Medicine, Academy of Forensic Science, Ministry of Justice, 1347 West Guangfu Road, Shanghai 200063, China
*
Authors to whom correspondence should be addressed.
Appl. Sci. 2022, 12(14), 6911; https://doi.org/10.3390/app12146911
Submission received: 9 June 2022 / Revised: 23 June 2022 / Accepted: 24 June 2022 / Published: 8 July 2022
(This article belongs to the Special Issue Forensic Medicine and Its Applications)

Abstract

:
In forensic examination cases, lower limb injuries are common, and pedestrians of different ages suffer different injuries when they are hit by vehicles, especially the injuries to the long bones of the lower limbs. Aging remains a challenging issue for the material properties and injury biomechanical properties of pedestrian lower limb long bones. We analyzed the regression relationship between the age of 50 Chinese pedestrians and the material properties of the lower limb long bones (femur, tibia). We compared them with previous studies to propose a regression model suitable for Chinese human long bone material properties. Through the established Human Active Lower Limb (HALL) model that conforms to the Chinese human anatomy, seven pedestrians’ (20/30/40/50/60/70/80 years old (YO)) lower limbs were parameterized to assign long bone material properties. In the finite element analysis, the Hall model was side-impacted by a family car (FCR) at speeds of 30/40/50/60/70 km/h, respectively. The results showed that an increase in age was negatively correlated with a decrease in the material properties of each long bone. Moreover, with an increase in age, the tolerance limit of long bones gradually decreases, but there will be a limit, and there is no obvious positive correlation with age. During a standing side impact, the stress change in the femur was significantly smaller than that of the tibia, and the stress of the femur and tibia decreased with age. Age is a more significant influencing factor for lower limb injuries. Older pedestrians have a higher risk of lower limb injuries. Forensic experts should pay attention to the critical factor of age when encountering lower limb traffic accident injuries in forensic identification work.

1. Introduction

Pedestrians are highly vulnerable to traffic accidents. The World Health Organization (WHO) reports that 22% of traffic accident victims are pedestrians exposed to the external environment [1]. In the case of pedestrian–vehicle collisions, 85% of pedestrians have lower limb injuries, which is much higher than that of vehicle occupants [2]. China is a typical developing country with a mixed traffic environment, a large population, and an aging population [3]. Although lower limb injuries rarely lead directly to death, they often result in long-term or lifelong disability, resulting in high medical costs and suffering for society and families [4,5,6]. In forensic practice, cases of lower limb injuries are often encountered. Pedestrians of different ages have different injury characteristics after being hit by a collision [7,8,9,10]. In the case of pathological bone disease, young pedestrians also suffer fractures from minor collisions, and inexperienced forensics may ignore the pathological cause and lead to errors because, in cognition, it is difficult for young pedestrians to have severe fractures that occurred in the collision [11,12,13,14]. There seems to be a lack of regular research on how age is related to the material properties of the long bones of lower limbs and the regularity of the tolerance limits for long bones. Henary et al. [15] analyzed the Pedestrian Collision Database Study (PCDS) statistical analysis. After a traffic accident, they found that the elderly obtain a higher AIS score in almost every area than adults, at approximately twice as much. The elderly will suffer more severe injuries and a longer course of treatment. Hu et al. [16] found that age has an essential impact on the injury risk when pedestrians of different ages collide with different vehicles. Many studies have proved that, with an increase in age, a series of degenerative diseases such as osteoporosis and joint stiffness will appear in the long bones and joints of the lower limbs. The bones’ tolerance limit and mechanical properties will also be affected, making damage to the lower limbs more likely to occur [17,18,19,20]. In 1967 and 1974, Mather [21] and Reilly et al. [22] conducted experimental studies on the Youn’s modulus of femoral cortical bone in various age groups. They found that the Young’s modulus showed a downward trend with age. In 1998, Krischak et al. [23] performed mechanical compression on 33 femoral head slices and introduced the Singh index to evaluate the effect of bone mineral density (BMD) and Young’s modulus on bone strength. BMD and Young’s modulus were found to be important factors affecting the mechanical properties of bone. In 1970, Yamada et al. [24] conducted a quasi-static three-point bending experiment on long bones of several typical age groups. They found that, with an increase in age, the tolerance of long bones gradually decreased. In 2021, Hamandi et al. [25] found that the material properties of the long bones of the lower limbs are very different between white and black races and Asian races.
Pedestrian injuries can be prevented and predicted, and many researchers have established different lower limb models to study pedestrian collisions’ responses and injury mechanisms. In 2015, Schoell et al. [26] developed a finite element model of a 65 YO male and performed a whole-body validation to explore the complex relationship between age and injury risk. Moreover, compared with the 35 YO GHBMC general finite element model, it was found that the 65 YO finite element lower limb model had a higher probability of AIS3+. In 2018, Huang et al. [27] established a male lower limb model at the 50th percentile of a 30 YO and 70 YO based on CT scan data to verify the age-specific model’s biological fidelity and stability and to evaluate its response. In the published literature [28,29], many scholars have conducted research based on the general model. However, due to differences in objective physiological factors, such as race, body type, age, etc., the general model is not applicable in a particular type of situation and cannot reflect the difference in the pedestrians’ injury degree regarding different ages in traffic accidents. Many forensic practitioners have gradually used finite element analysis, and the general model lacks sufficient reliability. In parametric studies, the effect of age on the finite element model should be considered because this age difference can lead to very different results after the finite element analysis. This study focuses on the important influencing factor of age. By analyzing the material properties of the long bones of the lower limbs of 50 Chinese pedestrians, a model that adapts to the changes in the material properties of the lower limbs with age in Chinese is summarized. The finite element method was used to study the response of age differences to the injury of the long bones of the lower limbs. The bending moment and stress parameter values were extracted to observe the changes in the tolerance limit of the long bones of the lower limbs.

2. Materials and Methods

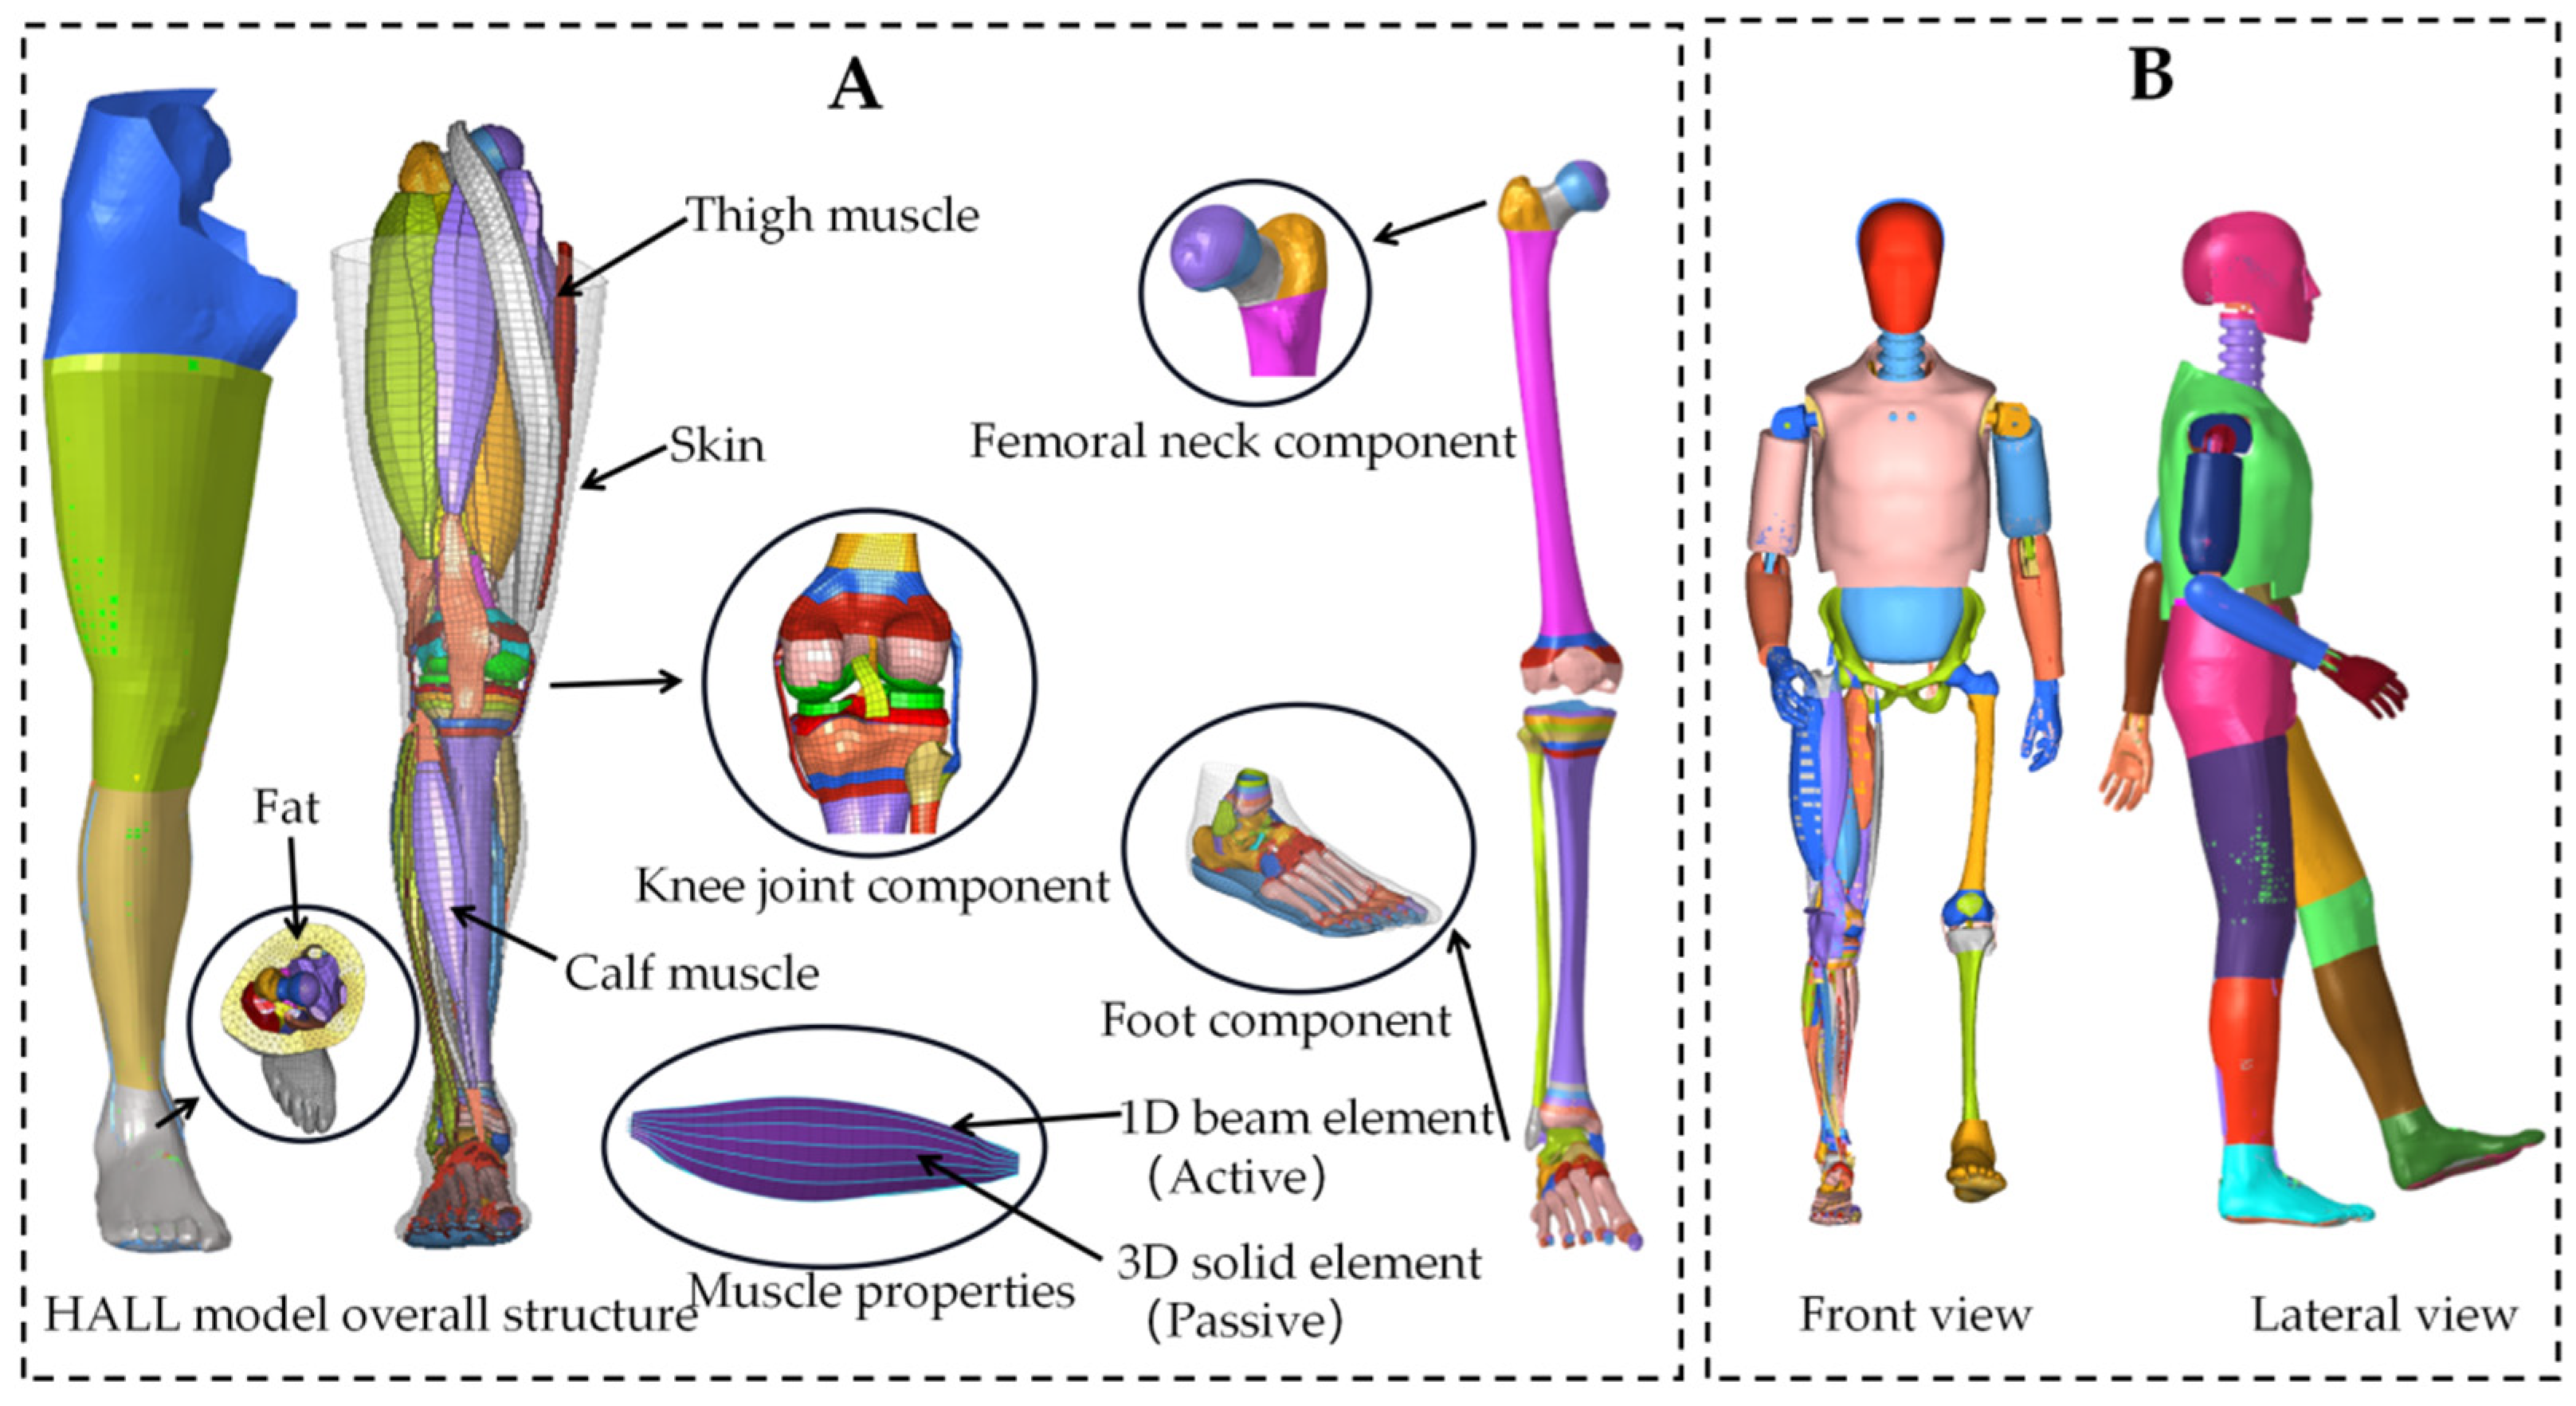
2.1. Chinese Human Body Lower Limb Model

This study used the HALL model for simulation calculations with the Chinese human lower limb model (Figure 1A). This model was initially constructed by researchers at Hunan University [30] from the 50th percentile of Chinese males based on CT and MRI data. Then, it was further improved and verified by comparing the data of the lateral impact load of the cadaver test and the predicted data.
This showed that the HALL model matched the test data well [31]. This model includes detailed bones, ligaments, and 3D muscles with 194 components, 140,000 nodes, and 290,000 elements. The 3D active segmented muscle was established by coupling the 1D beam element (simulating active force) and the 3D solid element (simulating passive force), which changed the previous modeling method. It became the first in China with main dynamic characteristics and lower limb models with anatomical 3D muscle morphology. To consider the collision of upper body mass on the risk of pedestrian lower limb injury in a vehicle collision, we coupled the HALL model with the upper body of the Chinese human body model to form a Chinese human 50th percentile finite element model (height 168 cm, weight 59 kg) (Figure 1B). This coupling method has been widely used before [32,33,34].

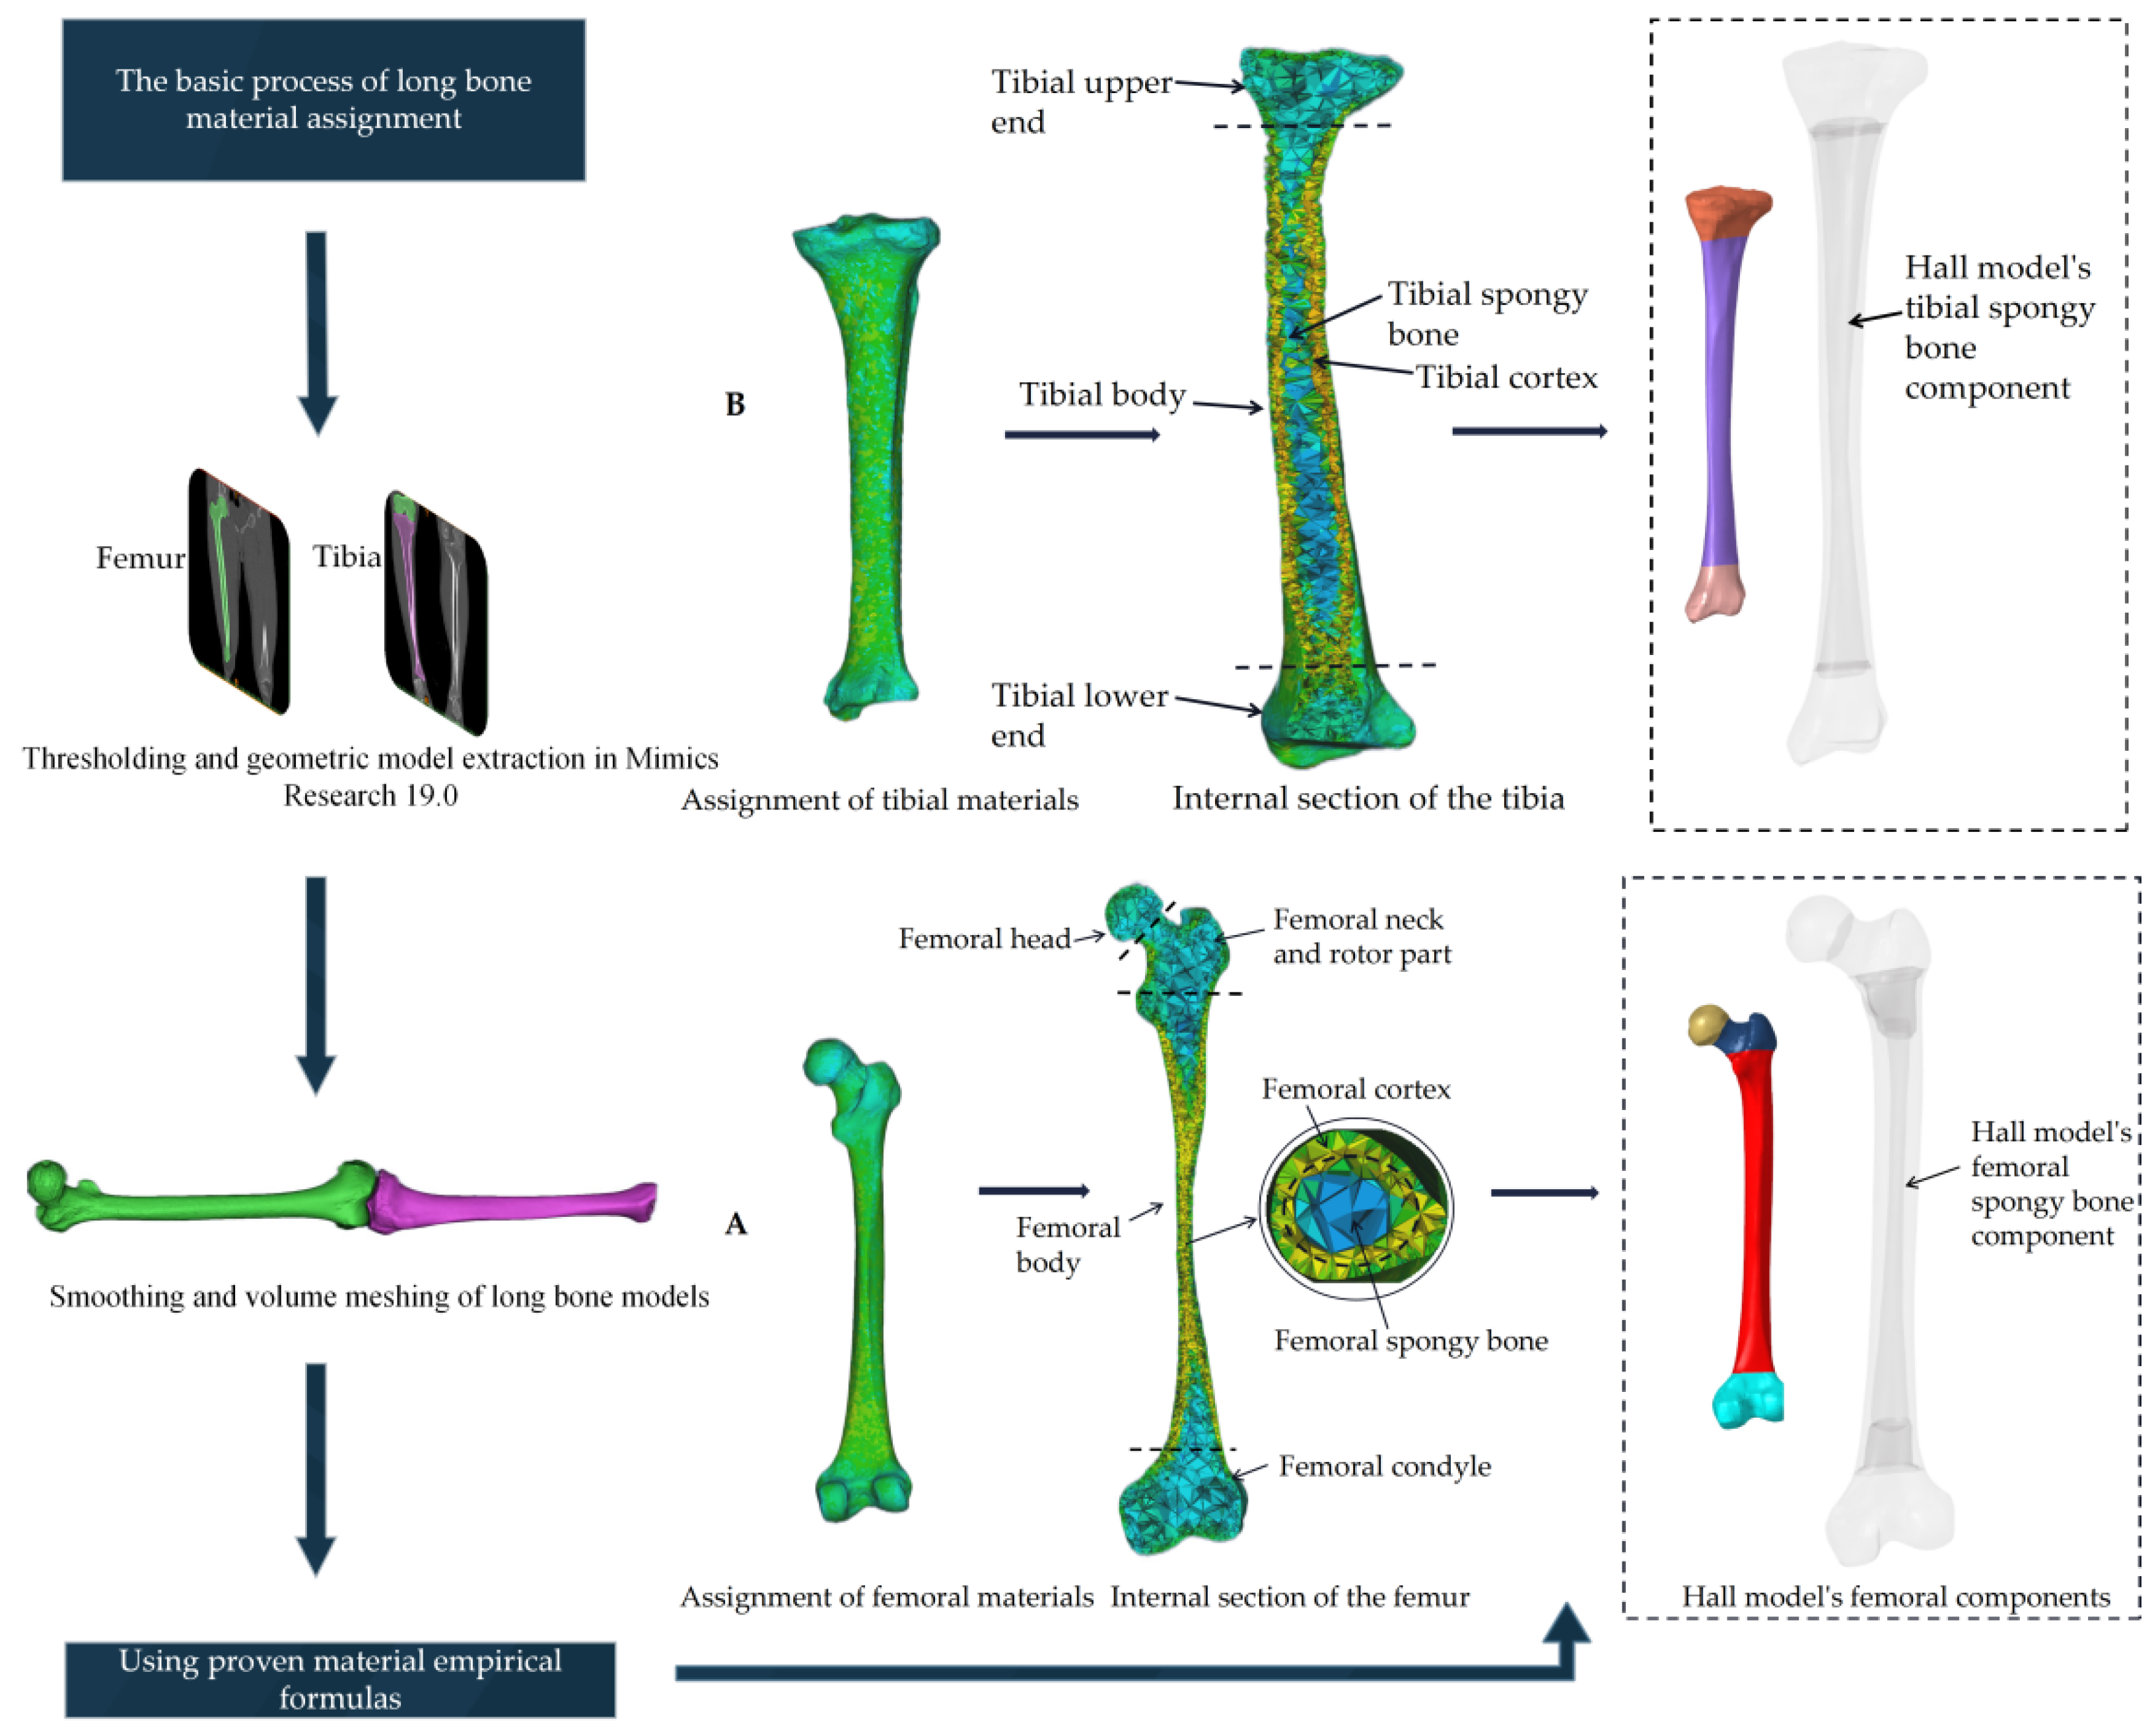
2.2. Geometric Extraction and Material Assignment of Long Bones of Lower Limbs

We randomly stratified the Chinese CT data (36 males, 14 females, average age of 48.02 YO) after a virtual autopsy from the 2019–2020 traffic accident database of the Academy of Forensic Science (Shanghai, China). A 40-slice spiral CT scanning system (Siemens AG corporation, Munich, Germany) was used to scan and obtain thin-slice CT data of the lower limbs. The raw data settings are tube voltage: 120 kV and tube current: 240 mA. The CT data of the lower limbs were artificially extracted and anonymized. Experienced imaging experts analyzed CT scans, and the possibility of lower limb pathological diseases was excluded. In Mimics Research 19.0 (Materialise corporation, Leuven, Belgium), we extracted geometric models of Chinese lower limb long bones (including femurs and tibias) from 50 cases. We then smoothed them in Geomagic Wrap 2015 (Geomagic corporation, Research Triangle Park, NC, USA) and finally in 3-Matic (Materialise corporation, Leuven, Belgium), performing volume meshing to complete the creation of the geometric model. Based on the verified empirical equations related to the gray value and material properties [35,36,37,38,39,40] in Equations (1) and (2), the equation is as follows:
E = 0.004 ρ 2.01   ( MPa )
ρ = 1.067 × H U + 131   ( kg / m 3 )
Equation (1): Femoral material empirical equation.
E = 0.004 ρ 2.01   ( MPa )
ρ = 0.916 × H U + 114   ( kg / m 3 )
Equation (2): Tibial material empirical equation.
Among them, E represents the Young’s modulus, an index reflecting the difficulty of Young’s deformation of the object material. ρ stands for BMD and is an essential indicator of bone strength. These two indicators have been proven to be important factors affecting the mechanical properties of bones. The HU value (Hounsfield unit) represents an index that quantitatively measures the absorption rate of X-rays by human tissues. We counted the mean values of the Young’s modulus and BMD of the femur, tibial cortical bone, and spongy bone, looking for the regression relationship. Moreover, we assigned materials according to the components that the HALL model has already divided. Among them, the femur was divided into 8 components (4 pieces of cortical bone and spongy bone each), and the tibia was divided into 6 pieces (3 pieces of cortical bone and three pieces of spongy bone) for subsequent simulation analysis (Figure 2).

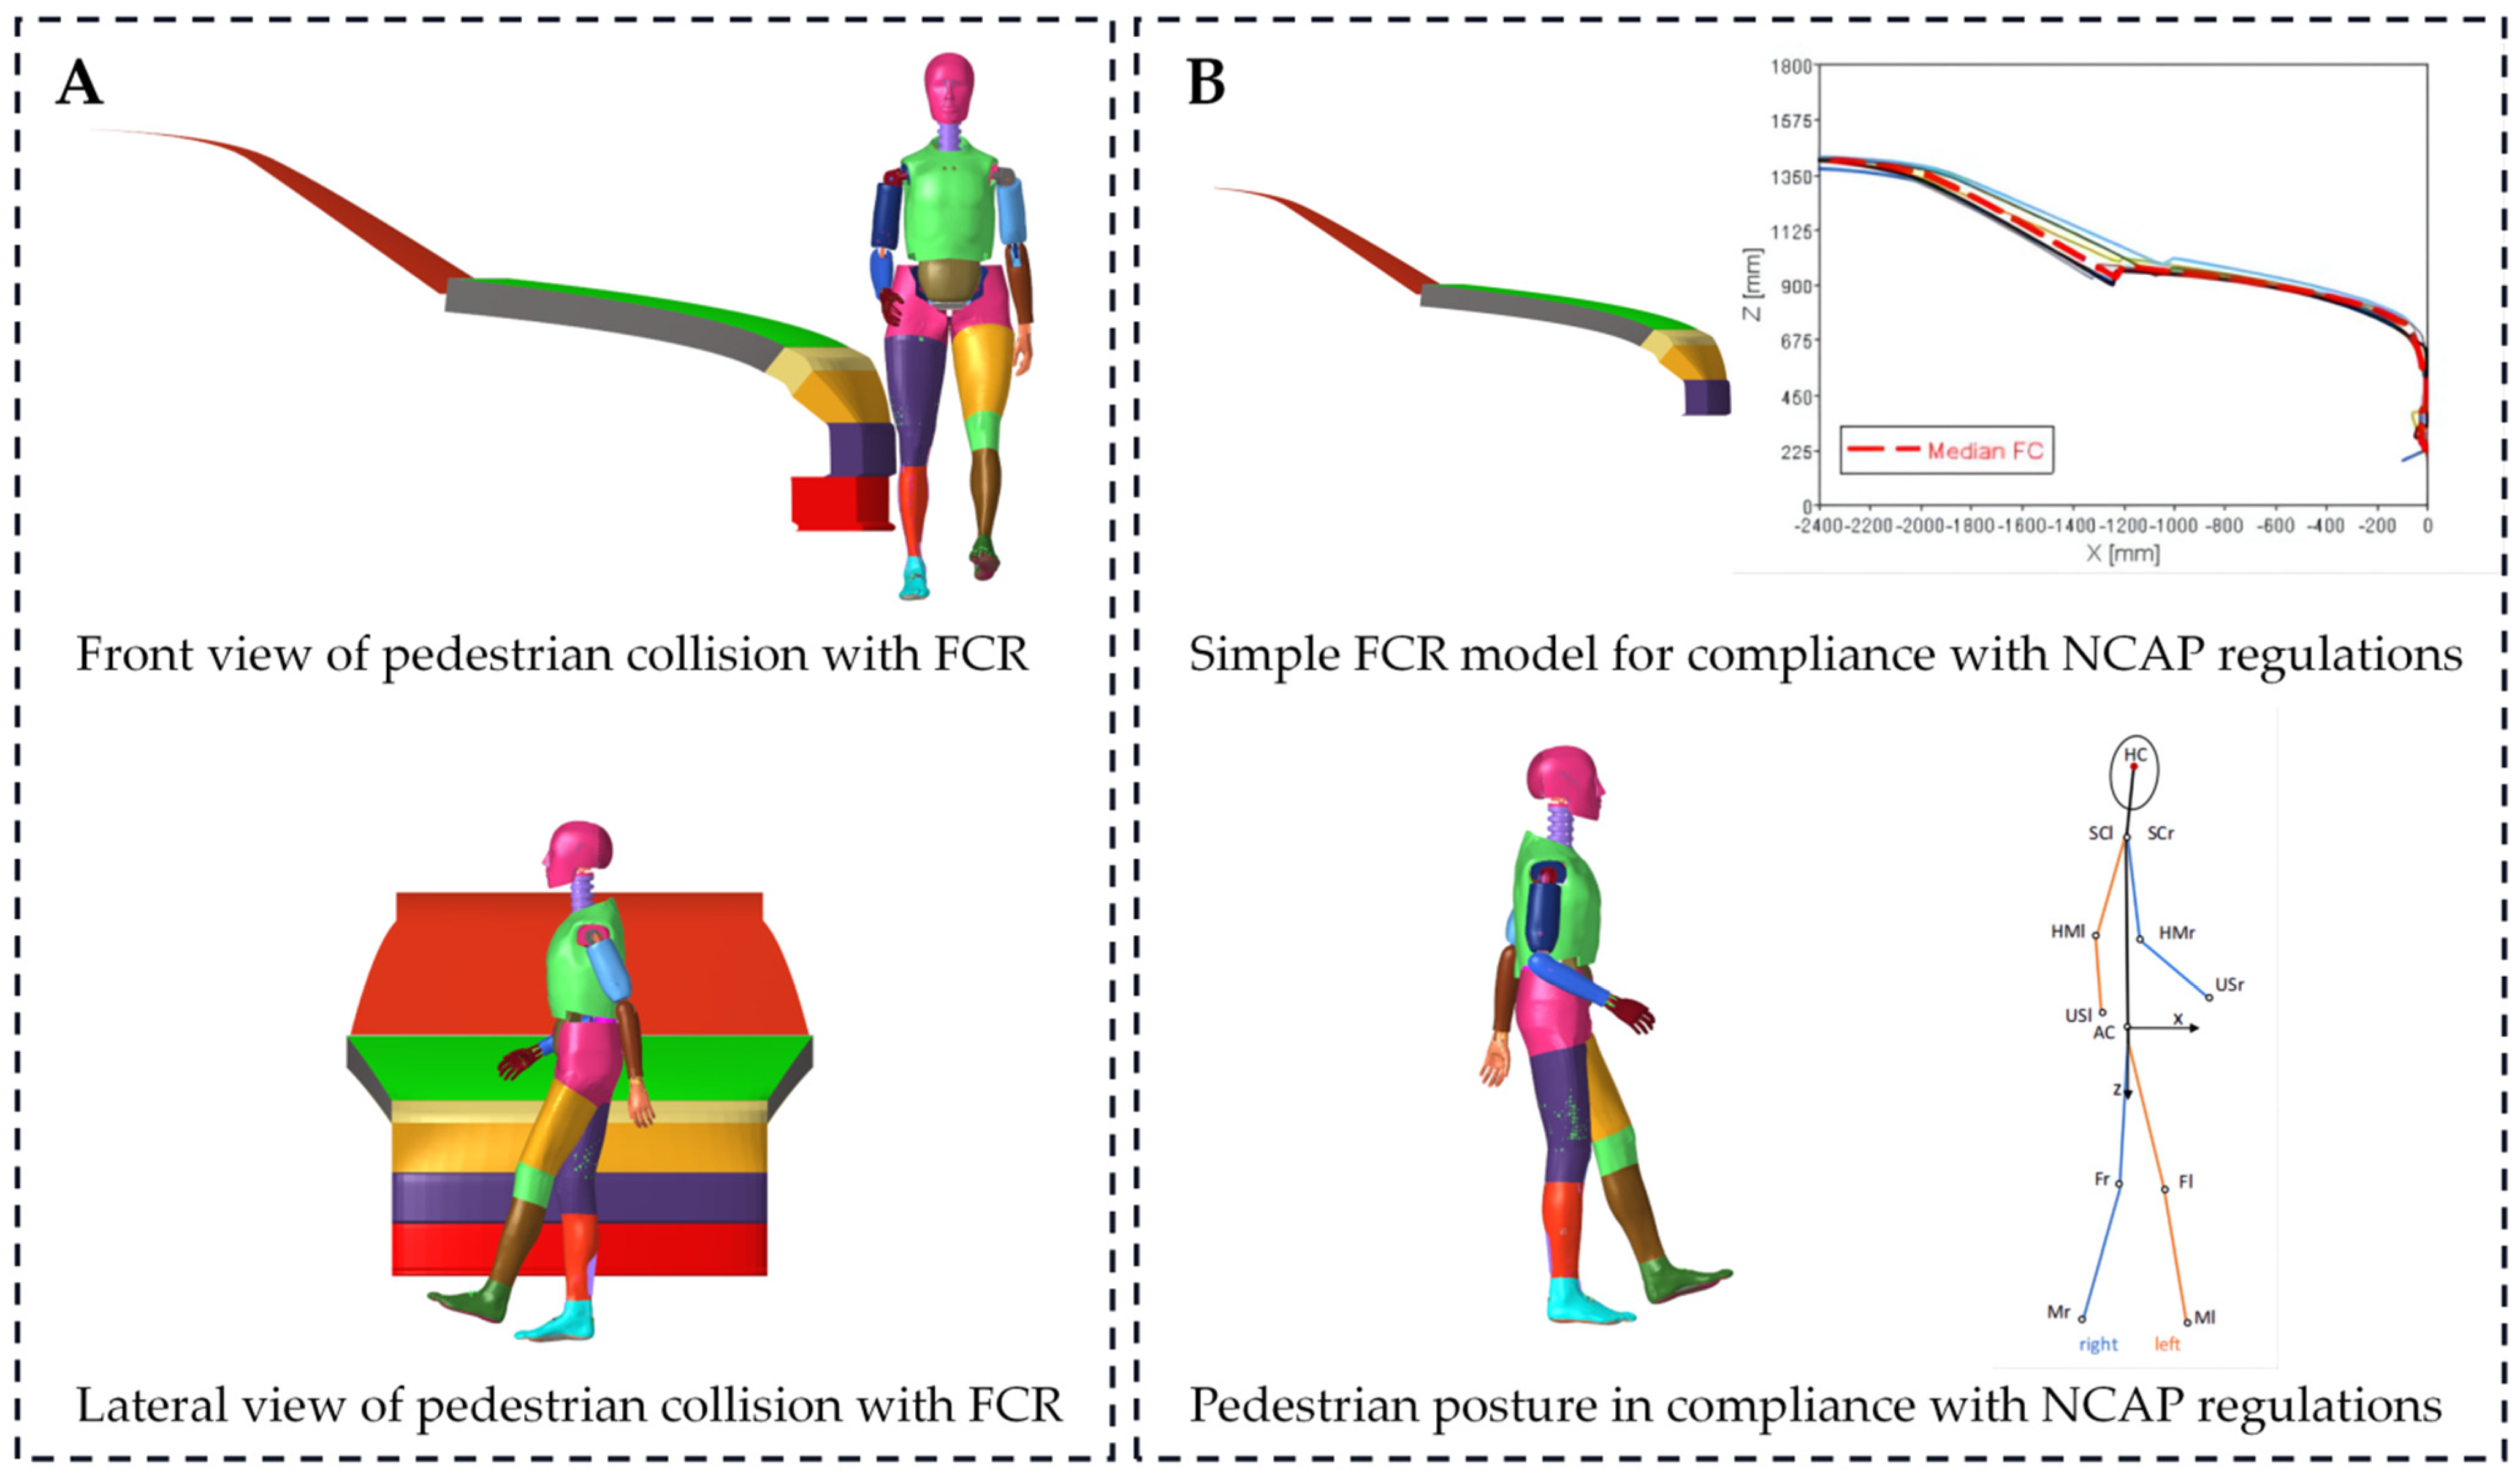
2.3. Simulation Matrix of Age Sensitivity Analysis

To analyze the effect of different ages, we divided seven typical age groups (20/30/40/50/60/70/80 YO) from the linear regression results in Section 2.2. Moreover, we assigned the value to the HALL model according to the above method. To explore the changes in lower limb collisions in these seven typical age groups, the exact material values of each part are shown in (Table A2). The Poisson’s ratio was set to 0.36 for cortical bone and 0.30 for spongy bone [41]. Considering that the family car (FCR) is the most common vehicle on the road [42] (the vehicle mass is 1690 kg), we referred to the regulations of New Car Assessment Program (NCAP) for the establishment of a simple FCR [43] between people and the ground. The friction factor between the vehicle and the vehicle was set to 0.7 and 0.3. Collision simulation analysis was carried out on those aforementioned Chinese whole-person models under the speed settings of 30/40/50/60/70 km/h (Figure 3). A total of 35 sets of simulation simulations were performed. The corresponding bending moment and stress parameter values were extracted as indicators for collision analysis. At present, only the collision response process of the lower limbs is concerned, so the collision time was set to 50 ms to save time consumption and reduce computing costs.

2.4. Data Analysis

All model establishment and parameter settings were in Hyper Mesh 2020 (Altair corporation, Troy, MI, USA), the physical calculation of the simulation was in LS-DYNA R11.0 (LSTC corporation, Livermore, CA, USA), and the subsequent results are in Hyper View 2020 (Altair corporation, Troy, MI, USA) output. Statistical analysis was performed in IBM SPSS Statistics 26.0 (IBM corporation, New York, NY, USA).

3. Results

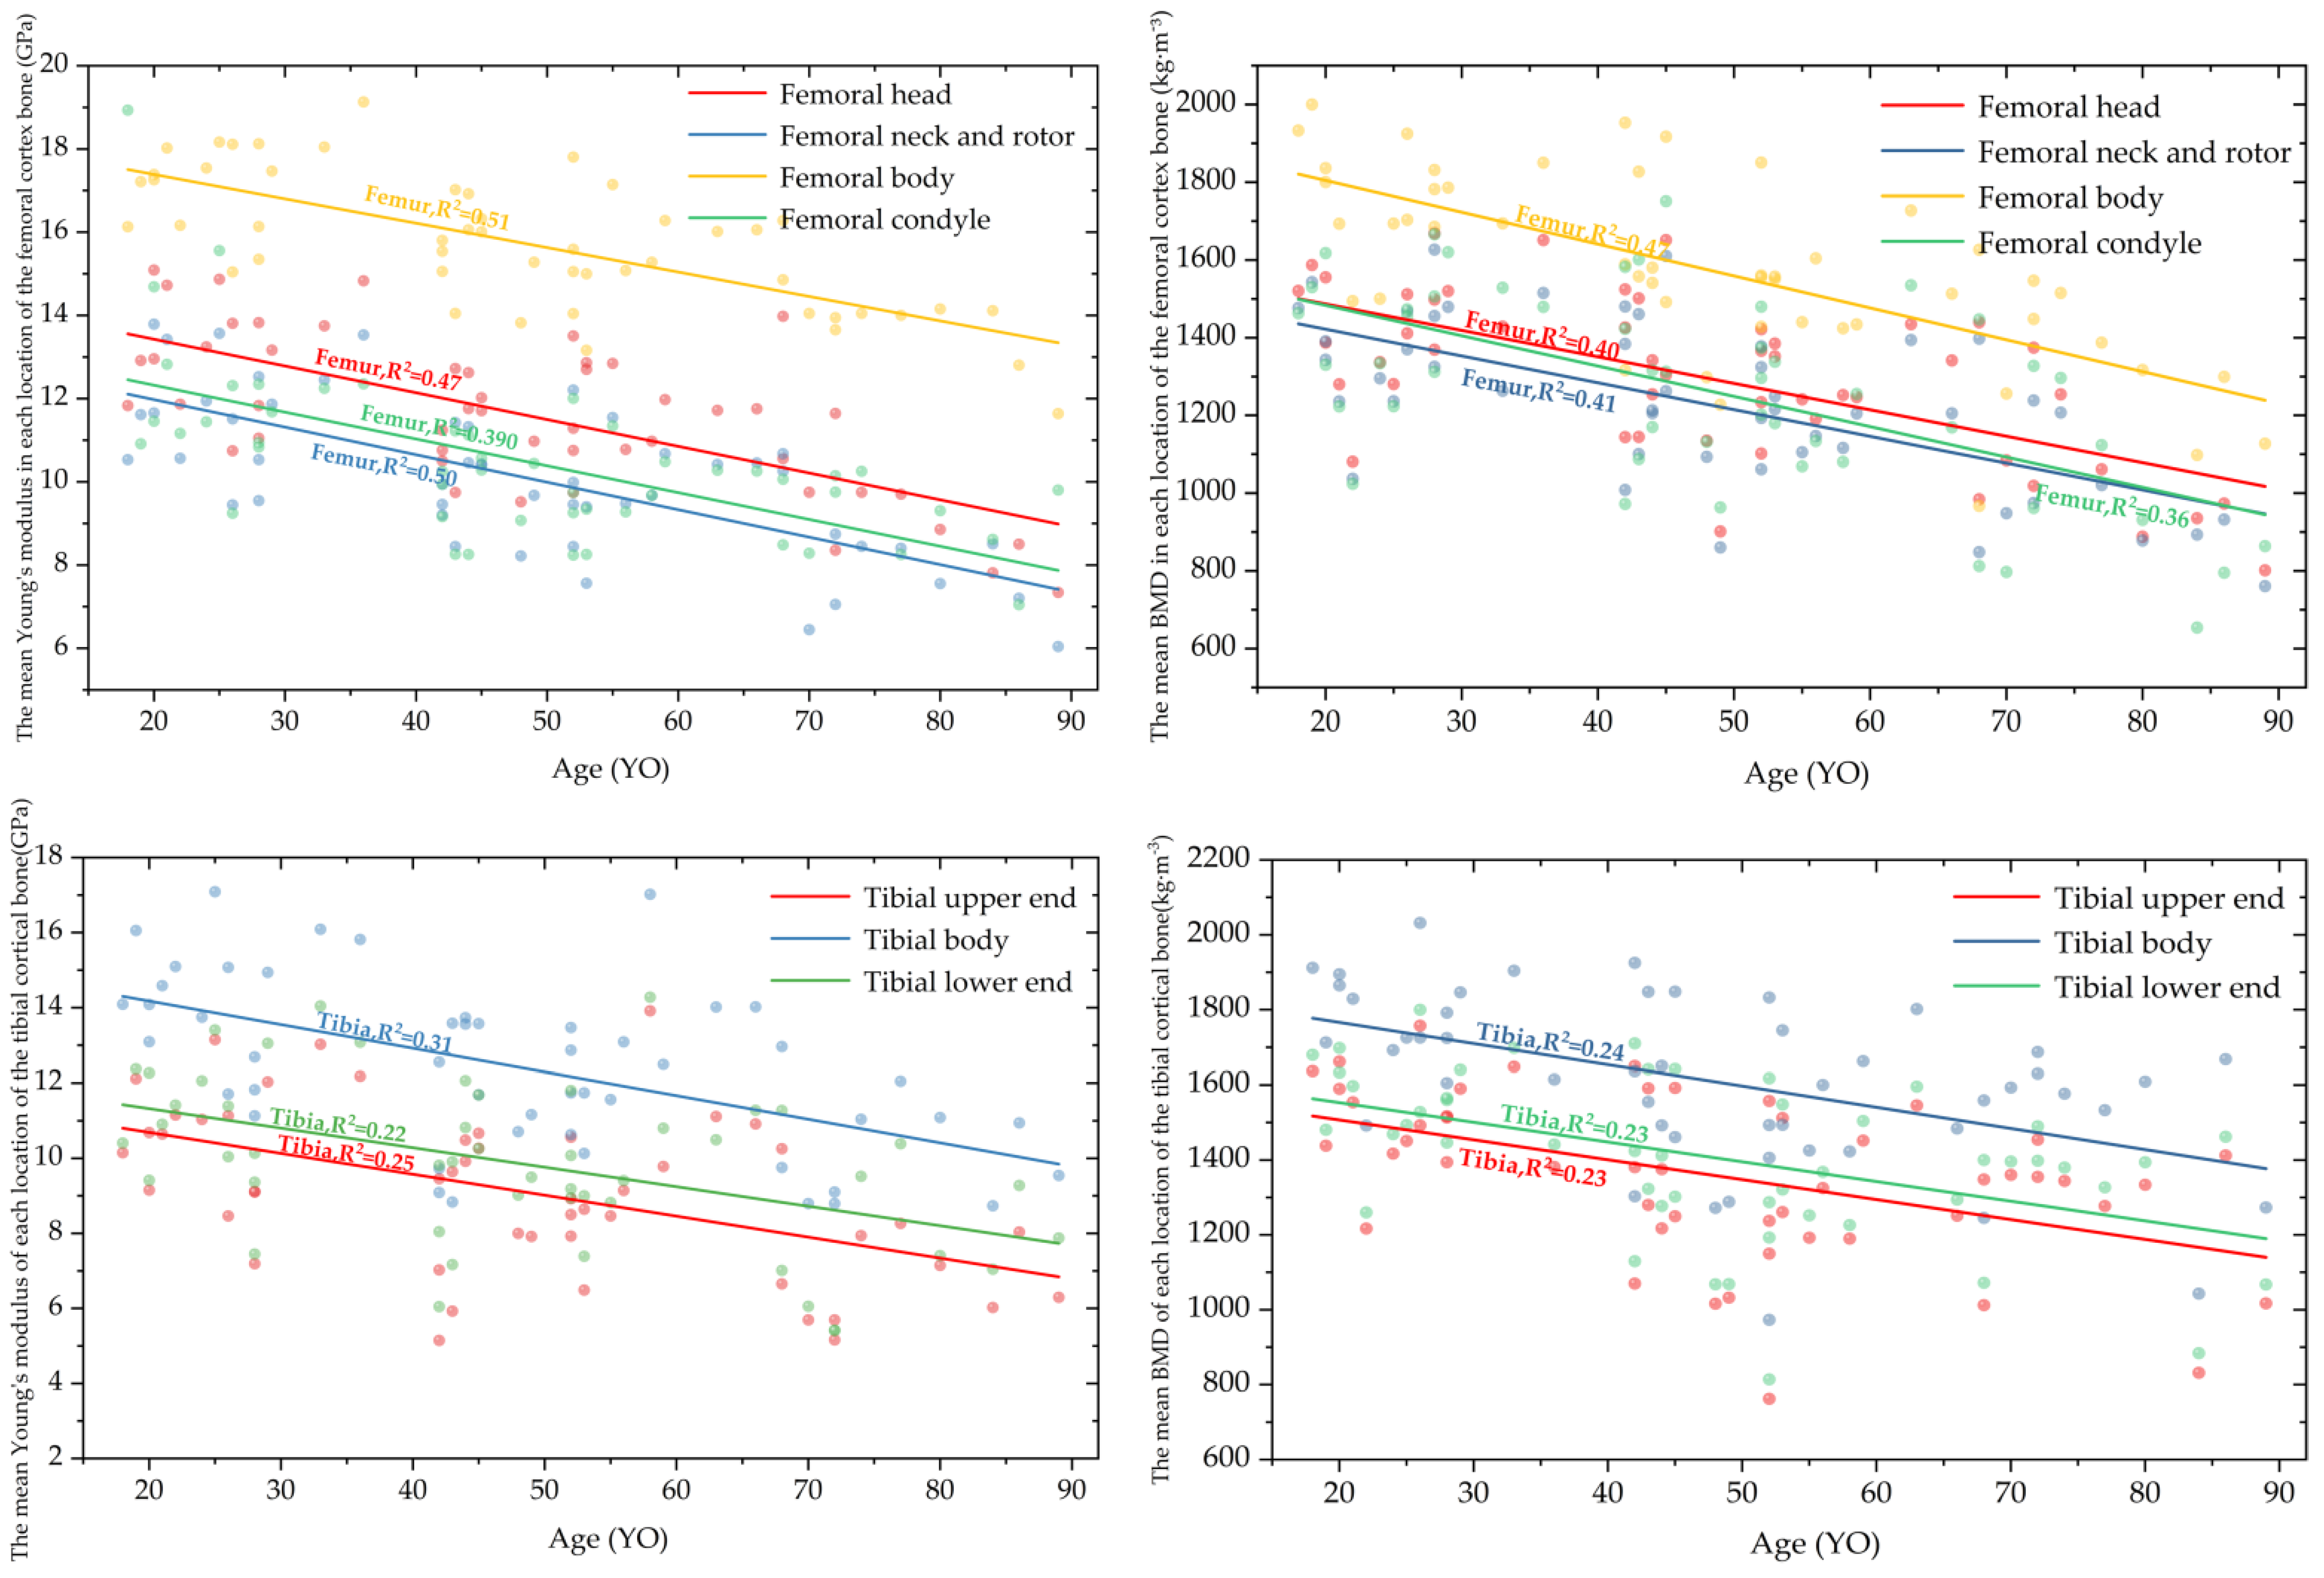
3.1. Correlation Fitting of Material Properties of Lower Limb Long Bones and Analysis and Comparison with Previous Studies

Previously, many methods have been used to study the correlation between age and the material properties of bone, such as dynamic or quasi-static three or four-point bending experiments of long bones in a material testing machine. Compression or tension experiments were performed on sliced specimens of bone in osteopathy, and the material properties of long bones were measured by CT and DXA combined with empirical formulas. Of course, there will be differences between studies due to different material testing machines, different loading methods, different samples selected, and the age and ethnicity between samples. We reviewed previous studies (Table A1) and compared them with this study. After extracting, smoothing, and assigning the geometric model of the long bones of the lower limbs in 50 cases, the related scatter plots were linearly fitted. The long bones of our study were used as far as possible to correspond to the previous research sites (Figure 4). At the same time, after partitioning the long bones described in Section 2.2, we performed a linear fitting of the Young’s modulus and BMD of each location of the long bone and compared whether there were differences in material properties between the locations (Figure A1).
Among them, the line segment in the style of a dotted line represents a similar study by previous scholars. The line segment in the straight–line style represents the linear fitting result of this study, which is compared with each other. Our findings are different from previous studies, but the same regression trend is specific. We found that both cortical and spongy bone decreased overall in the Young’s modulus and BMD with age. However, the R2 values were different, which may be due to the material distribution of the long bones. The correlations between the Young’s modulus and BMD of the femur with different cortical/spongy bone R2 values with age were significantly more robust than those of the tibia. There appears to be a weak correlation between the Young’s modulus of spongy bone and BMD, which may be due to the properties and distribution of spongy bone itself. However, the overall mechanical properties of bone do have a linear trend of decreasing with age.
In the linear regression analysis of each location of a single long bone, we found that the Young’s modulus of the cortical bone in the diaphysis of each long bone was significantly higher than the distribution at both ends of each long bone. This is also in line with the results that we observed from the original CT. The thickness and density of the cortical bone in the diaphysis are also more detailed than those at the ends of the long bones.

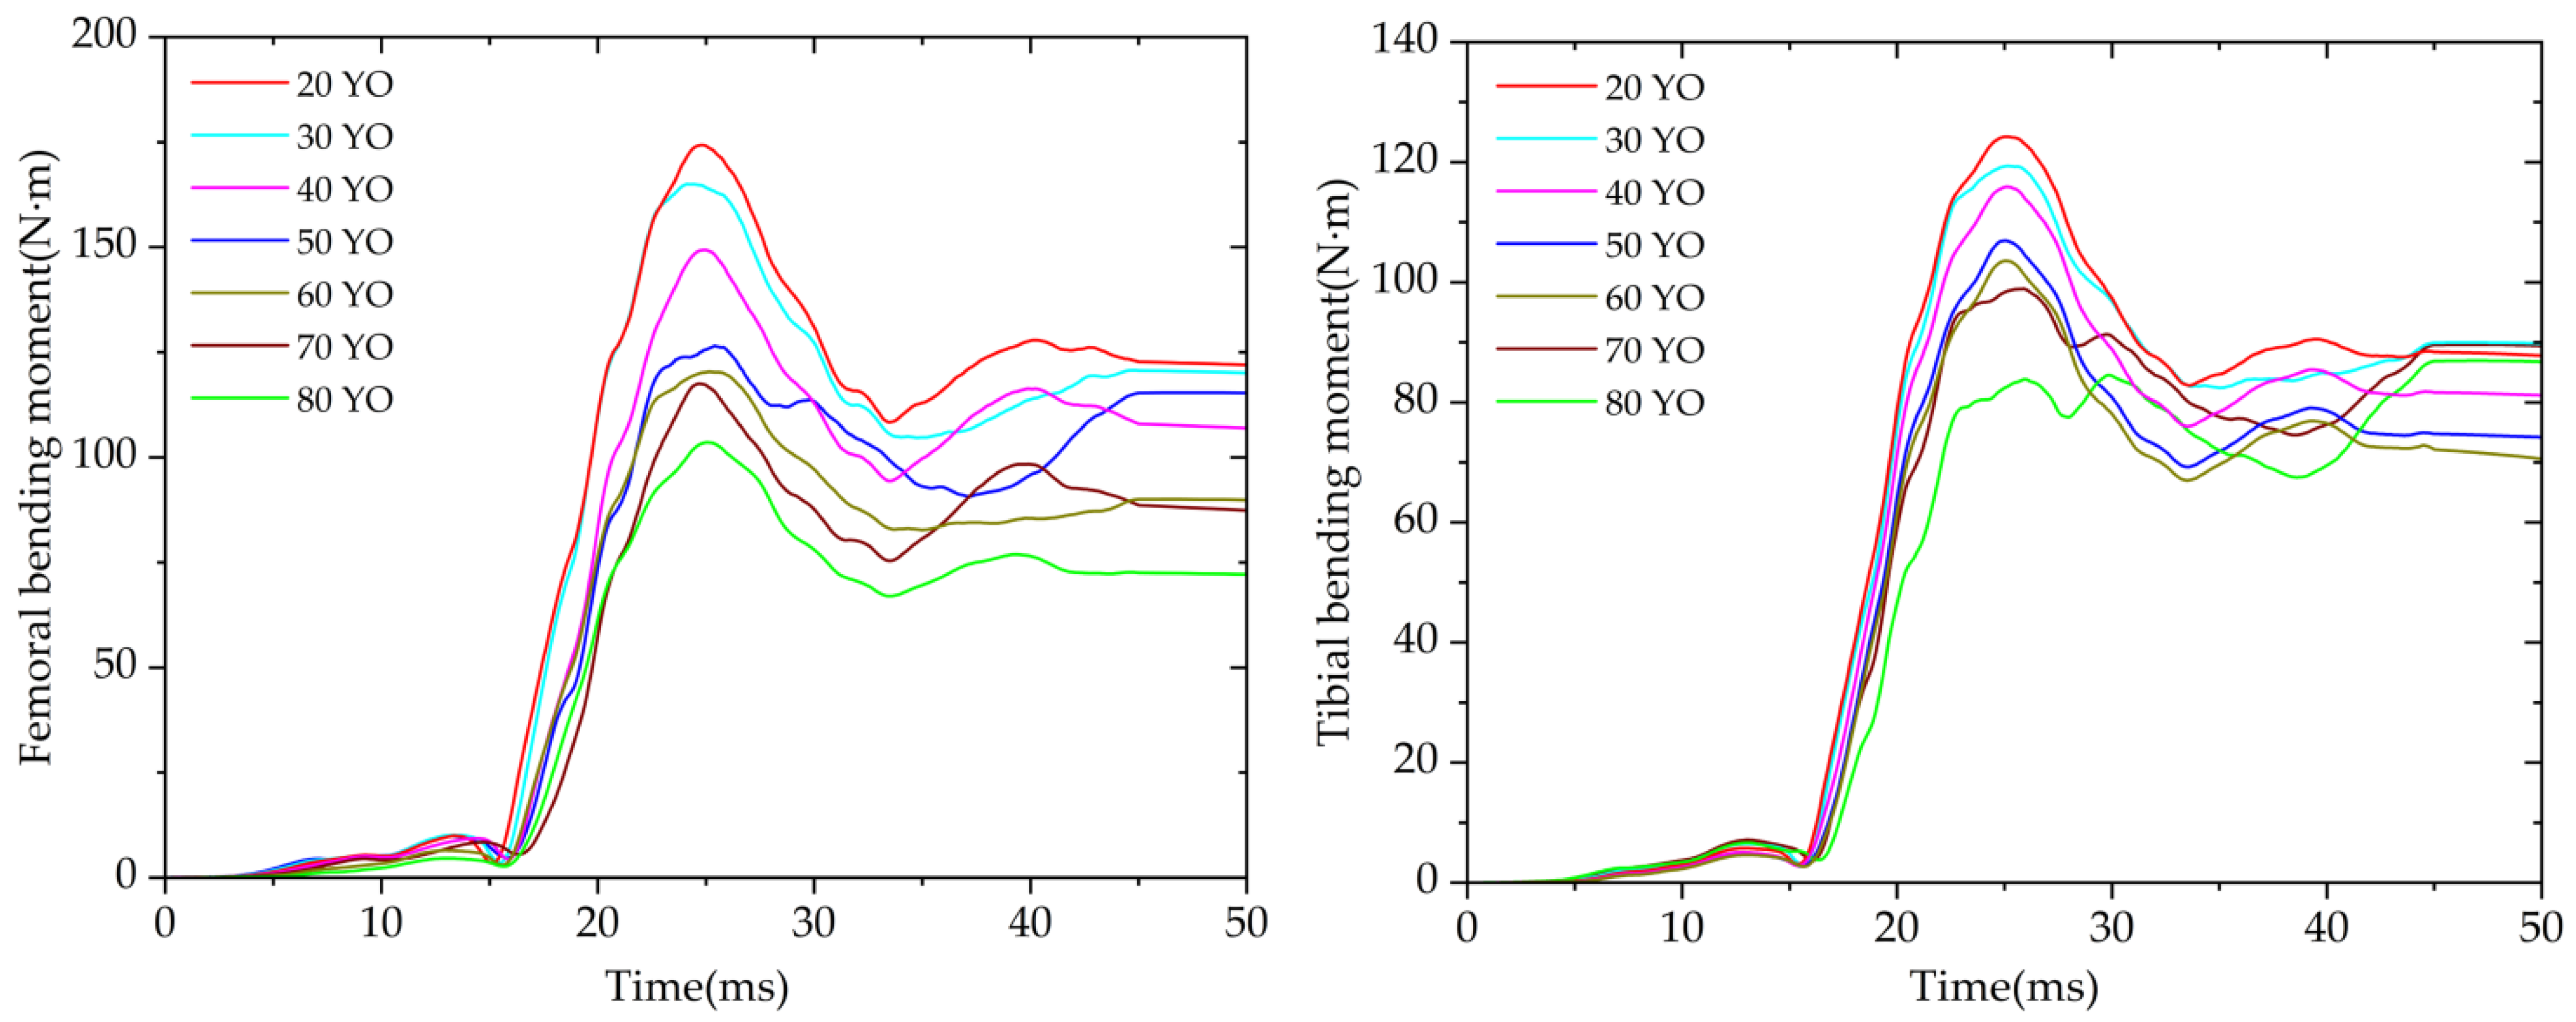
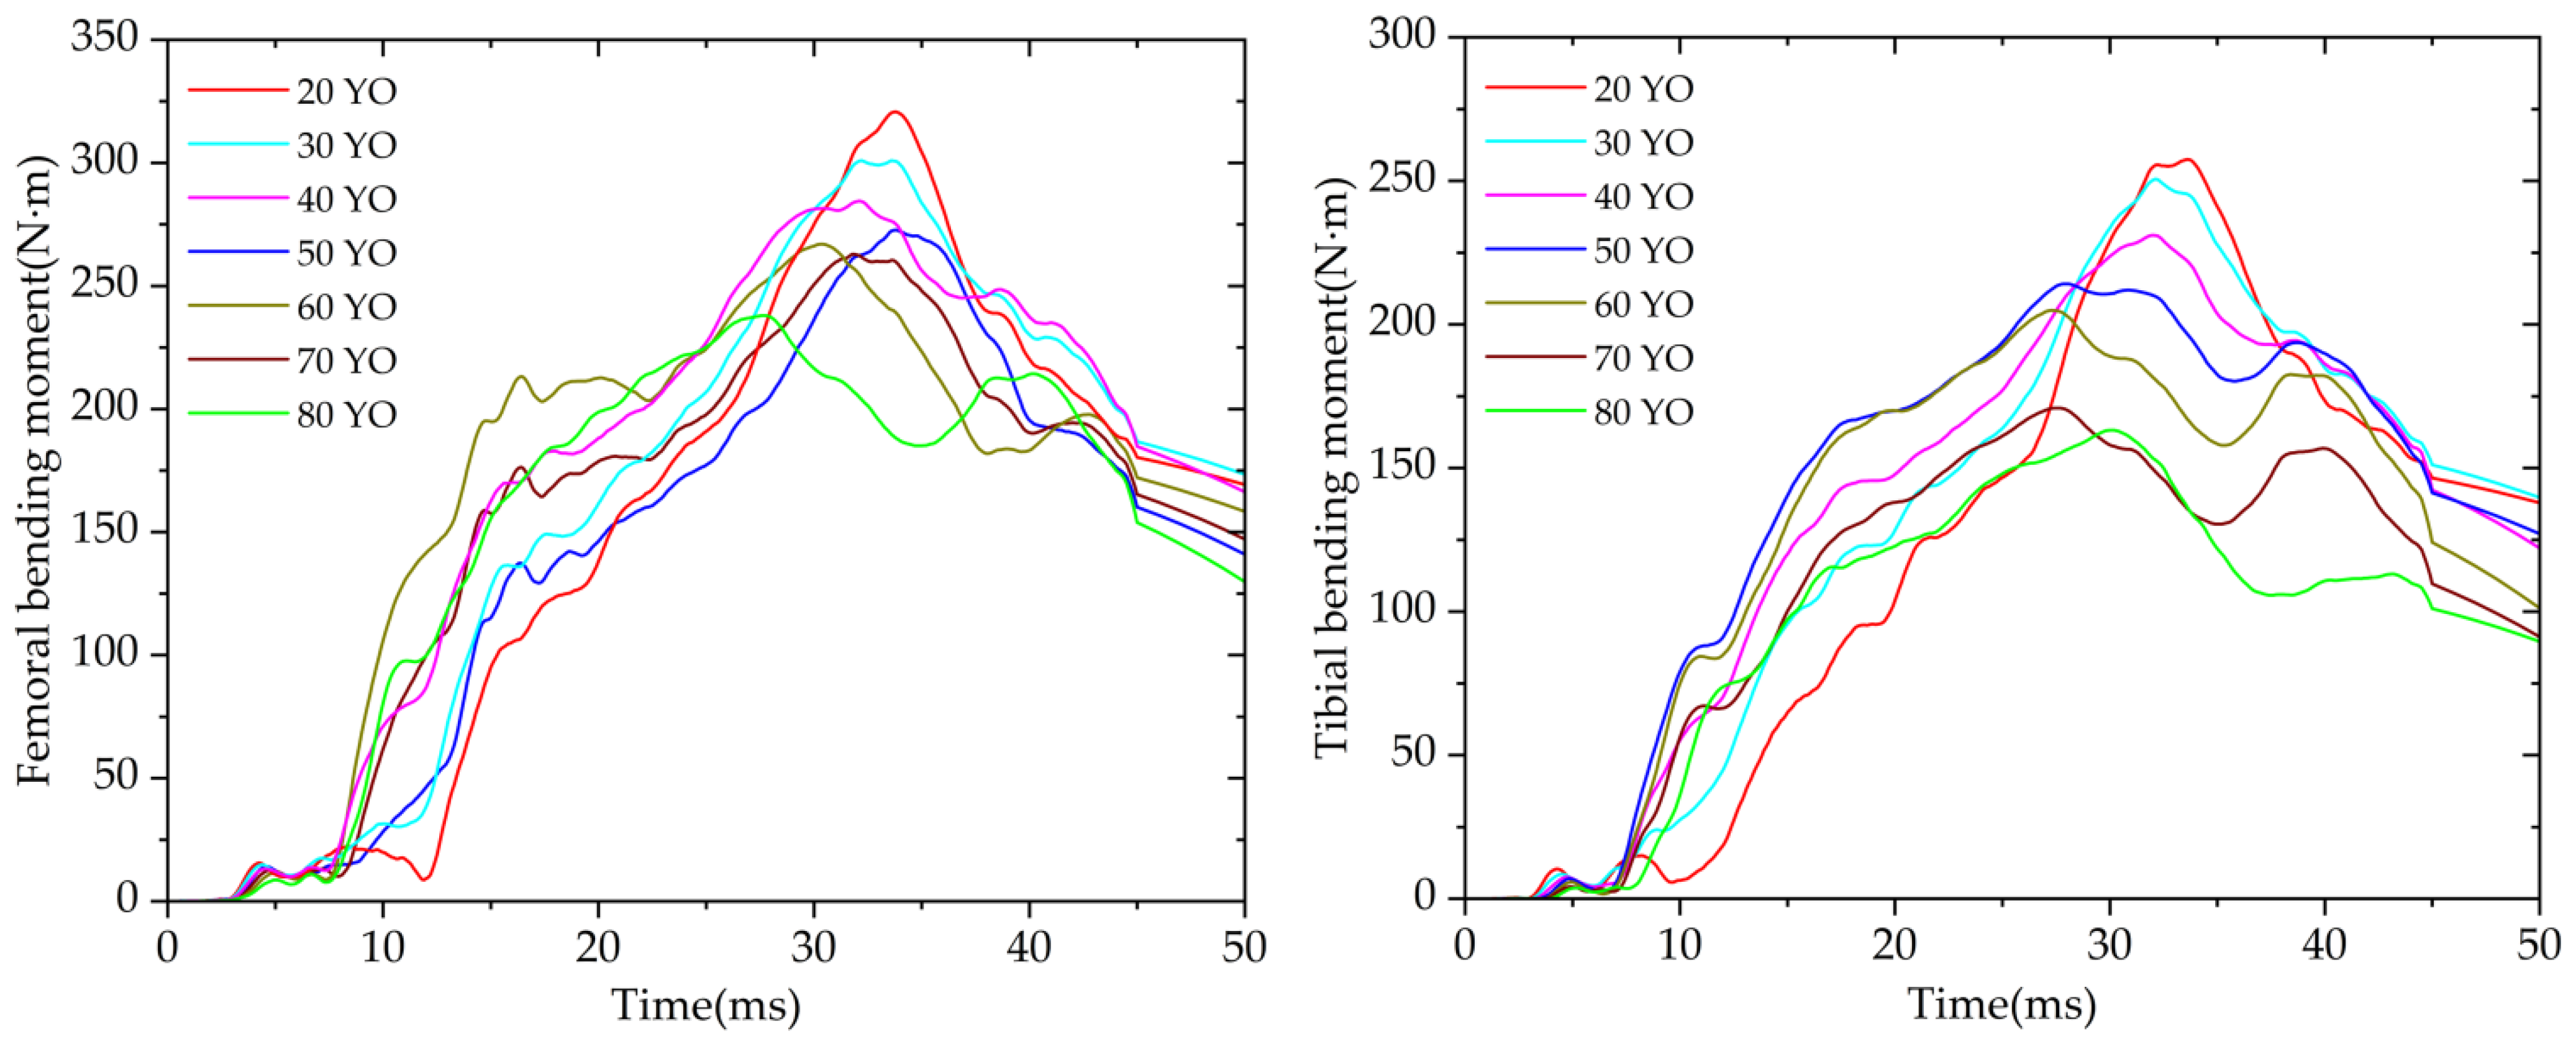
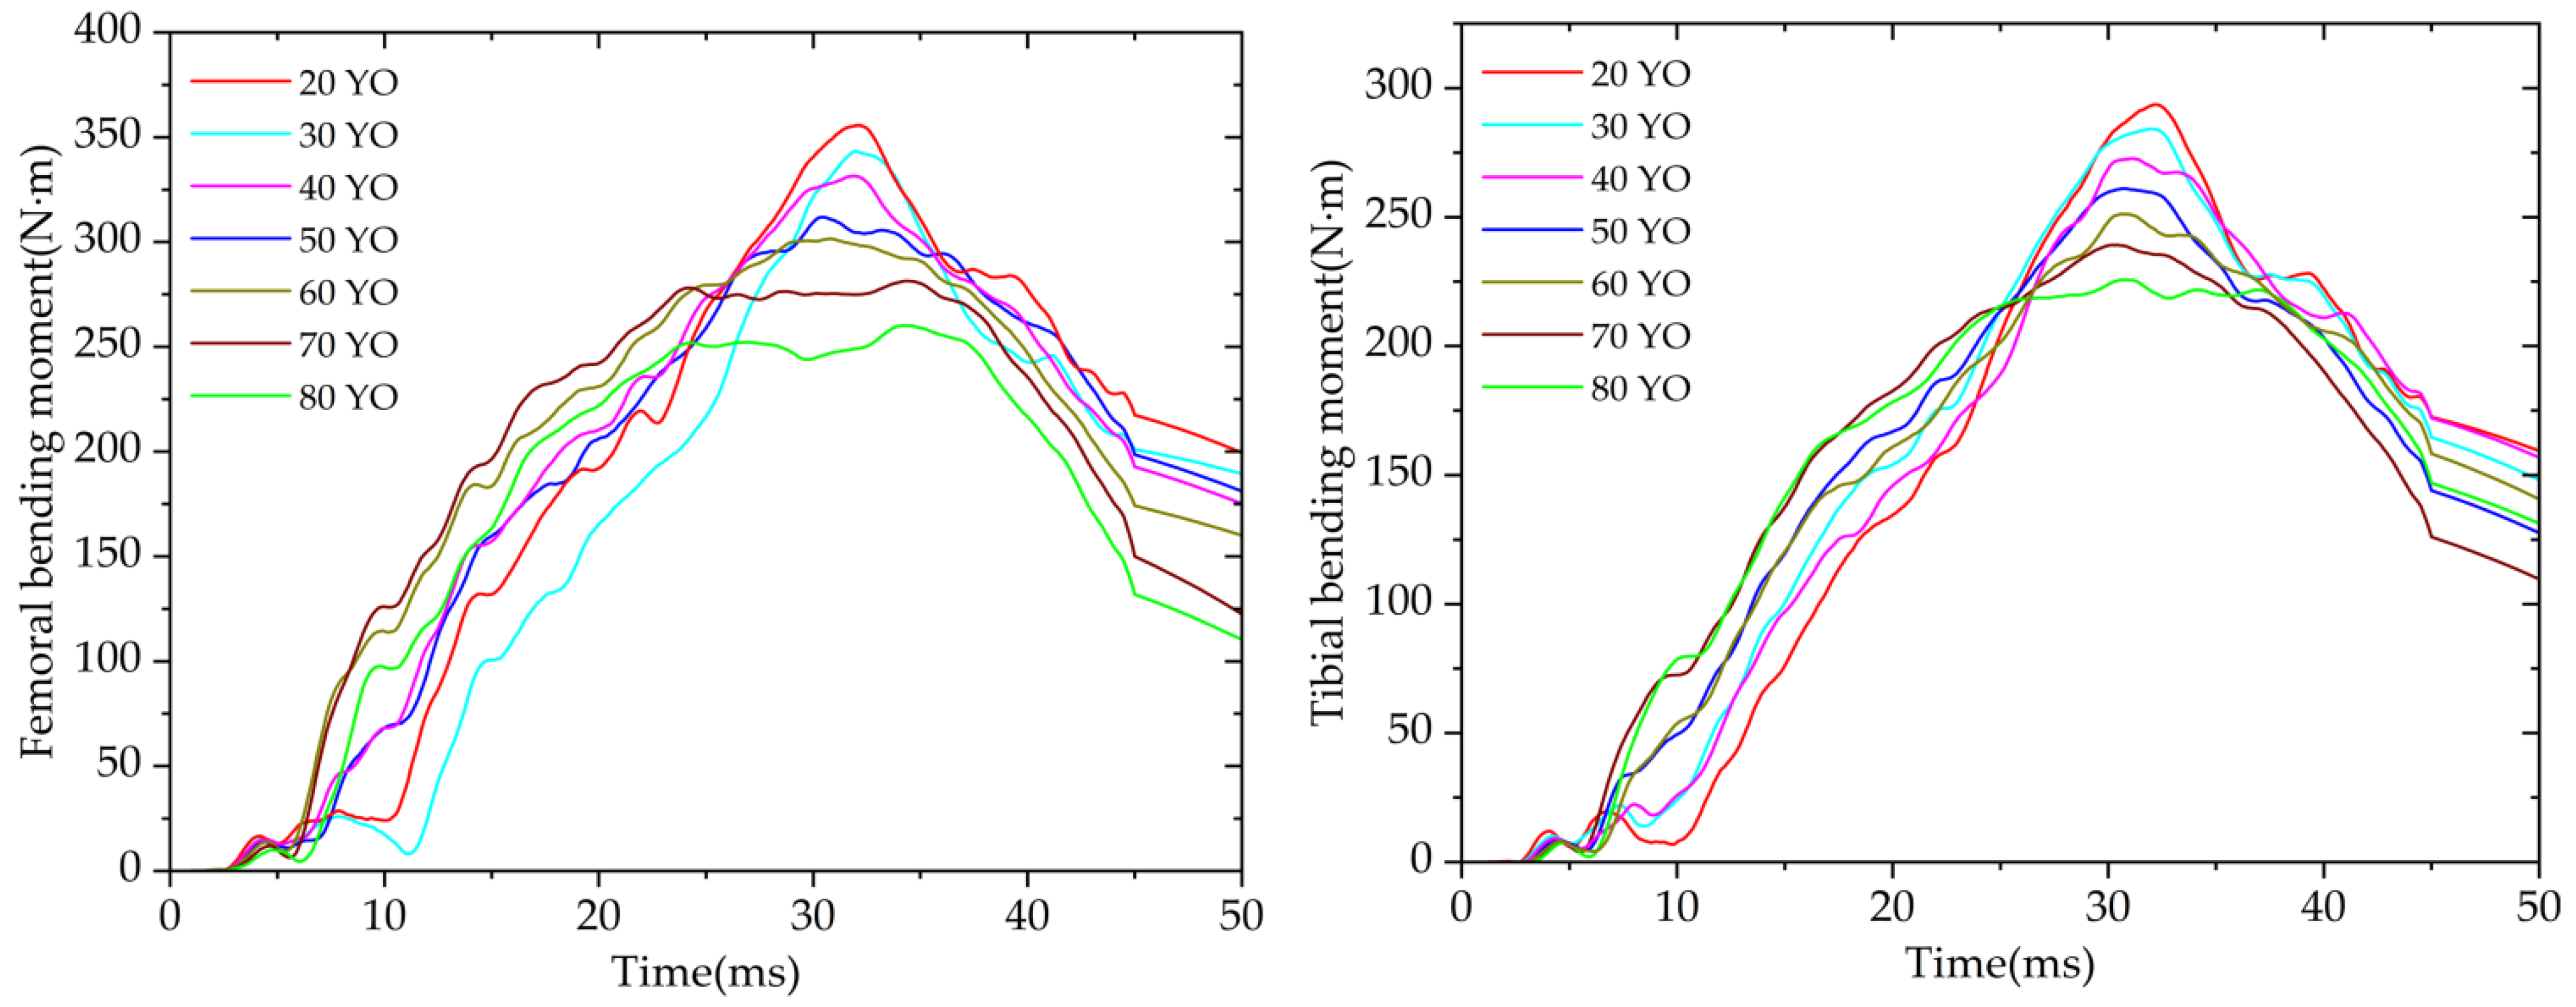
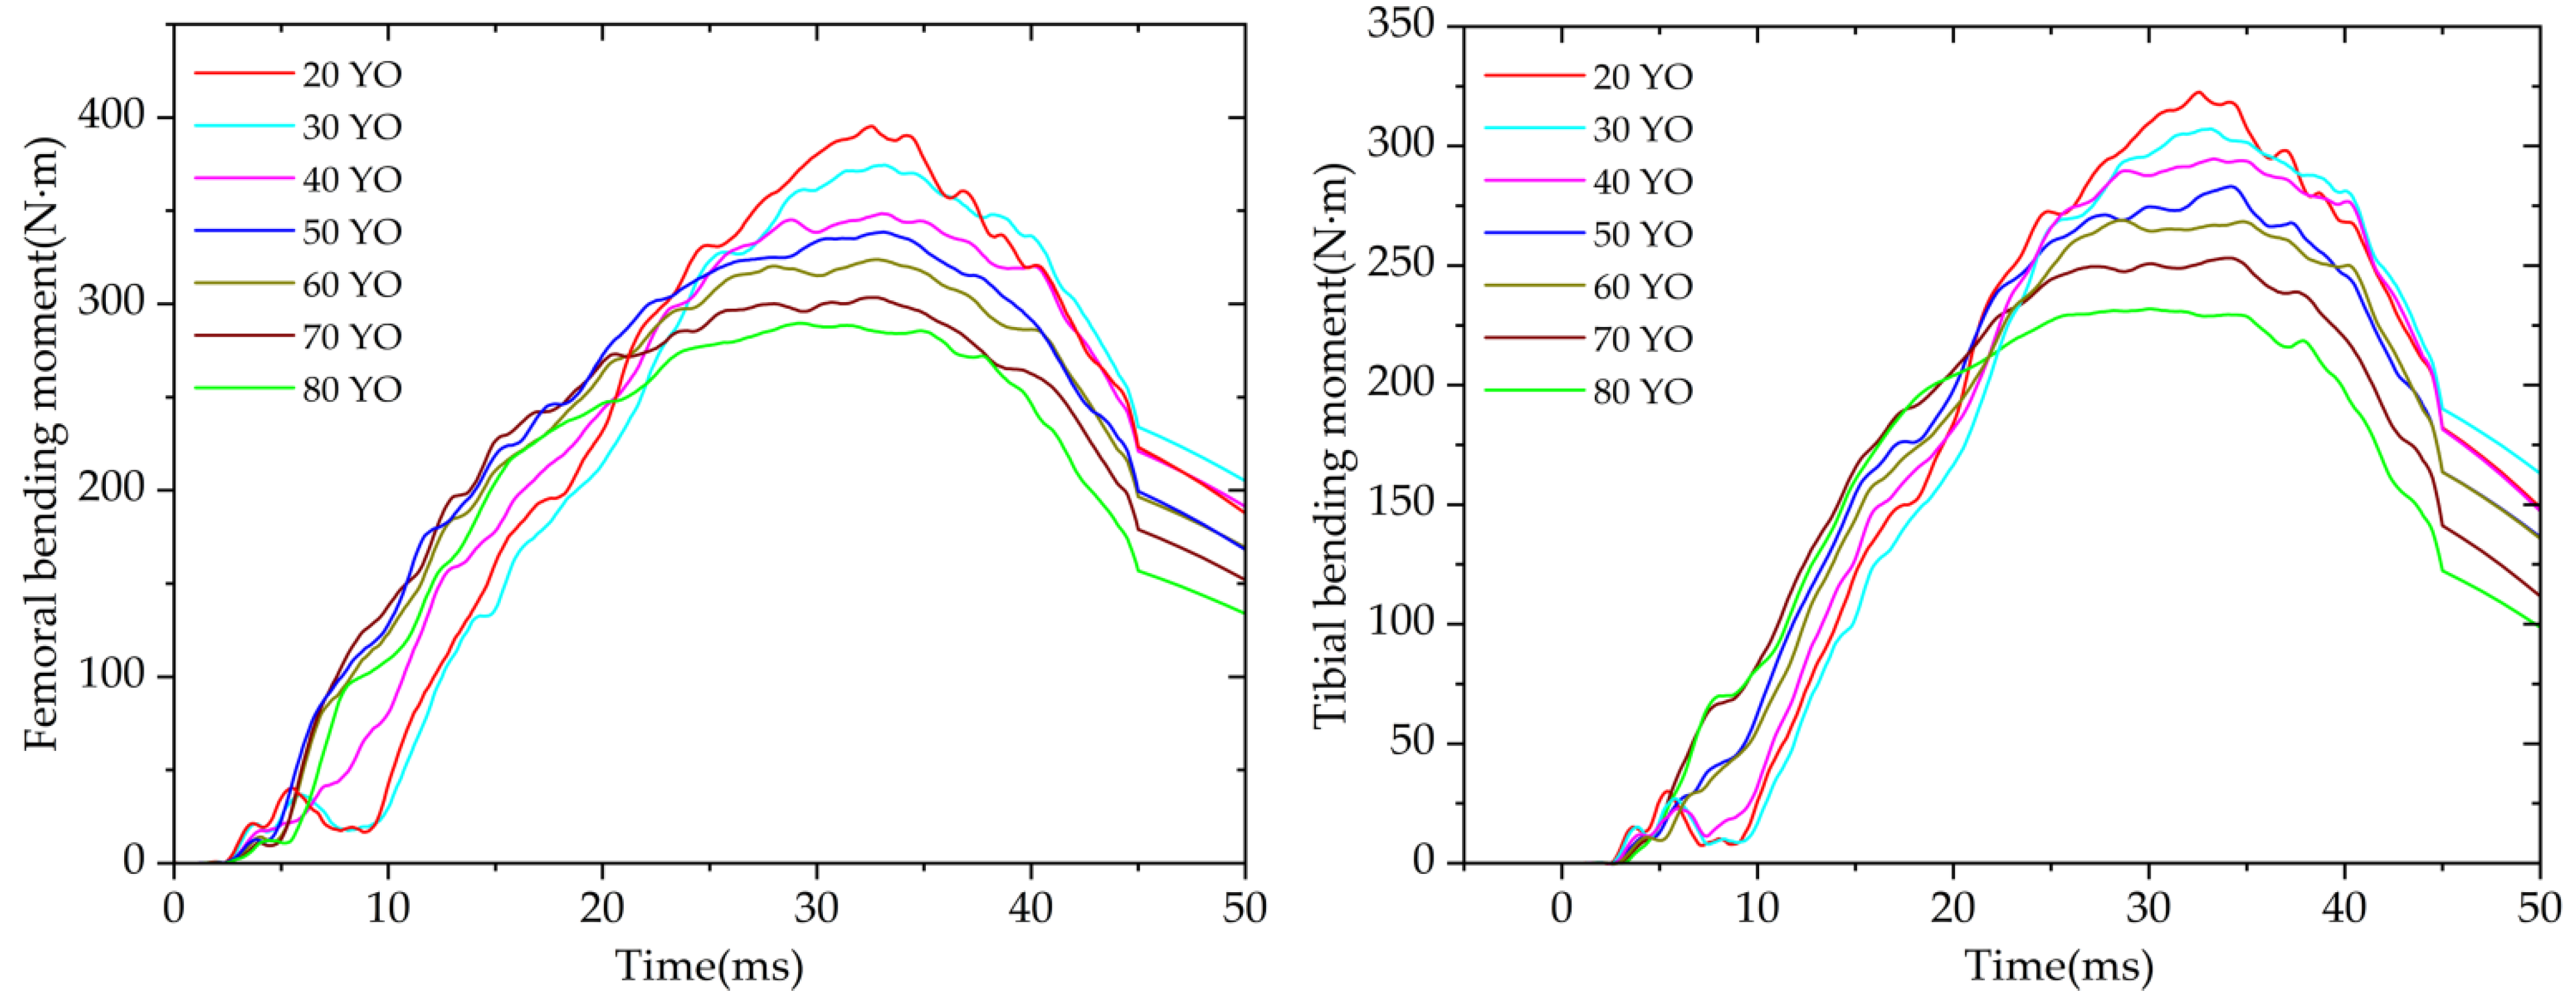
3.2. Extraction and Analysis of the Simulation Results

First, we extracted one of the simulation animations to demonstrate the collision kinematics process. When the pedestrian age is 30 YO, at a collision speed of 40 km/h, time = 20 ms and 30 ms, the thigh contacted the front of the FCR vehicle and forced it to deform gradually, and then, after, the thigh made complete contact with it. Then, the calf began to bend until the long bones of the lower limb reached the maximum deformation at 40 ms. Then, the lower limb gradually separated from the vehicle, and the collision of the lower limb ended (Figure 5).
We found that, with an increase in age, the tolerance limits of the femur and tibia also decreased to different degrees under the collision of 40 km/h. At 40 km/h, the peak bending moment of the femur at the age of 80 decreased compared with that at the age of 20. The tibia decreased by 54 N·m, and the tibia decreased by 68 N·m (Figure 6). At the same time, we found that this difference in the tolerance limit of long bones did not show a regular change. At the same speed, although with an increasing age, especially after 60 YO, the peak bending moment did not show a more significant gap, possibly reaching the ultimate tolerance limit of long bones. This is also in line with the conclusion of Forman et al. [20] that, after reaching 45 YO, the bending moment of long bones decreases with age. When the age is the same, the impact energy from the collision gradually increases with the increase in speed, especially after 50 km/h. Initially, the peak bending moment value will reach a higher peak, but the tolerance limit of the bone will reach a limit where the peak value of the peak bending moment value does not increase with an increasing speed (Figure A2, Figure A3, Figure A4 and Figure A5). At 40 km/h, the peak stress of the femur was significantly more extensive than that of the tibia. With the increase in age, the peak stress of the femur and tibia also decreased, but after 60 YO, the decrease was gradually less noticeable. The ultimate stress of the femur was reached (Figure 7). The variation in peak stress under different conditions is shown in (Figure A6). From the stress cloud map, we can see that, at 40 km/h, in a side collision of a standing pedestrian, a significant stress concentration occurred at the upper end of the femur and the middle end of the tibia, and fractures were most likely to occur in this part. Stress at the stress concentration sites of the femur and tibia decreased with age (Figure 8 and Figure 9).

4. Discussion

In forensic practice, the injury mechanisms and degrees of lower limb injuries in various traffic accidents are complex and diverse. The injury characteristics of the lower limbs urgently need to be clearly understood in multiple directions in forensic identification. The age of pedestrians is also an essential factor. With an increase in age, the bone structure of the human body will change to different degrees, and the damage in traffic accidents will also show different characteristics due to different ages. A more critical issue is that age-related lower limb injuries are nonlinear [50,51,52]. In the past, studies related to finite element analysis have considered the size and height of pedestrians. In forensic science, the identification of lower limb injuries is based chiefly on empirical judgment. We reviewed the previous studies on the material properties of long bones by scholars. However, we found that the previous studies were still from a macroscopic perspective because the material properties of the long bones of the lower limbs varies with different races and ages. This study conducted a stratified sampling study on the material properties of human lower limb long bones in China, explored the correlation between the material properties of the femur and tibia with age, and made specific comparisons with previous studies.
The Young’s modulus and BMD of the spongy bone at each site. The density values are relatively small. We could not perform statistical and linear fitting on the Young’s modulus and BMD of the spongy bone at each site because we found that the spongy bone was relatively evenly distributed inside the long bone. The difference is relatively insignificant, so we did not analyze and compare such situations. We used a more detailed, high-fidelity 50th percentile Chinese human lower limb model (HALL model) to simulate the collision changes between seven age groups and five typical speeds (35 groups of simulation simulations). This matrix covers common traffic accidents. For comparative analysis, key damage reference indicators, the bending moment and stress, were extracted in order to provide theoretical support for forensic experts to identify and research in the future.
In 2015, Klein et al. [51] established two occupant seating models of a 25 YO and 75 YO through CT data to simulate the response after a frontal collision. The results show that, with age, an increase in the geometric cross-sectional shape of the femur and a decrease in the cortical bone of the femur do not substantially lead to an increase in the long bone strain. In contrast, the femur strain increases with a decrease in BMD, consistent with our obtained results. The analysis results are consistent. In addition, research on such parametric finite element analyses has continuously challenged past research using generic models, and parametric modeling will be indispensable in future research. In similar parametric studies, if the material properties, such as the Young’s modulus and BMD, that change with age are not considered, and the material values obtained from the past references are applied, such a finite element model will be complicated. Although this study could not obtain the experimental data of the material properties of the long bones of pedestrians in a specific case on the material testing machine, we maximized the use of CT data and 3D modeling software to extract the corresponding material data, which are in line with previous studies [26,53,54,55] and have specific practical significance. We chose the already validated material empirical equation based on the gray values of the CT data in order to obtain the values of the material of the long lower limb bones. Edidin et al. [56], Kayak et al. [37], and Marom et al. [57] used the CT data to predict the apparent densities that provide parameters for the finite element model. Later, Rho et al. [36] established a preliminary set empirical formula based on the HU value (Hounsfield unit), after which, the Mimics Research software also had a set mature material assignment method and was widely used [58,59], but the material value’s final impact depends on the thin layer thickness, CT data, and the reverse 3-D modelling process specification.
Of course, we also have to admit the deviation in the accuracy of the current finite element model. In 2019, Kluess et al. [60] conducted seven sets of compression experiments on human femurs on a material testing machine. They then used the measured mechanical data for the subsequent femur limited element modeling of material assignments, followed by similar simulated compression experiments in finite element analysis software. They found that the deviation between the experiment and the simulation was at least less than 40% under the same loading conditions and at most more than 120%. Even with accurate material data and advanced modeling, large deviations can still occur.
At the same time, we must recognize the superiority of this analysis, which allows us to more intuitively obtain the response changes and practical mechanism analysis of long bones in the event of a collision, which could not be achieved using animal experiments and physical models in the past. We did not add failure criteria to the long bones to simulate the fracture phenomenon because we performed this simulation operation before the pre-experiment and found that fractures would occur at some speeds when the failure criteria were added. However, we found that the bending moment, stress, and the value of strain also have an effect, and that the comparison between different ages cannot be carried out. This may be because, when the failure criterion is added, with the passive deletion of the grid, the grid’s energy gradually disappears, making the finite element model ineffective, and stabilizing it. At the same time, the natural fracture phenomenon is not an immediate fracture just beyond the failure stress or strain but a developmental and hysteretic process [61,62]. Our study may be the first to verify the response changes in lower limb long bones at different ages and speeds by studying the regularity of material properties of long bones in the Chinese population and then parameterizing the HALL model. These conclusions may provide theoretical support for future forensic studies in lower limb injuries.
Of course, this study also has certain flaws. When analyzing the properties of long bone materials, we did not consider gender, BMI, etc. We only conducted a stratified sampling study divided by age range, which will be discussed in our future research—appropriate supplements. We refer to the empirical equation in previous research, and an empirical equation suitable for Chinese human body materials is necessary. Due to the lack of traffic accident cases, we could not conduct a lateral comparison between real-case lower limb injuries and simulations. More real-case simulations are needed to verify whether the parametric modeling method we used can be used as forensic evidence.

5. Conclusions

In conclusion, this study investigated the regularity of material properties of 50 Chinese human lower limb long bones (femur, tibia) and compared them with previous studies. Moreover, the HALL model that conforms to the 50th percentile of the Chinese human body was used for collision analysis. A parametric simulation study was carried out with seven ages and five speeds (35 groups of simulations). The collision response of the long bones of the lower limbs of pedestrians at different ages was compared. We found that age affects the material properties of long bones, but, in traffic accidents, the tolerance limits of long bones gradually decrease with an increasing age. However, when the age is above 60 YO, the bending moment and stress change trend of long bones seem less noticeable, which may reach the tolerance limit of long bones. Our research preliminarily expands on the changes in the age factors of Chinese pedestrians on the material properties of the long bones of the lower limbs and the response characteristics of the long bones of the lower limbs in collisions, which can provide a specific basis for both future forensic experts to study the material properties of long bones and parameterized finite element analysis. Methods and theories, as well as in encountering similar forensic identification, should pay attention to the critical influencing factor of age.

Author Contributions

Conceptualization, Y.Z., L.T.; methodology, Y.Z.; formal analysis, Y.Z.; writing—original draft preparation, Y.Z. and Q.M.; supervision, D.Z.; project administration, Y.C.; funding acquisition, D.Z. and Y.C. All authors have read and agreed to the published version of the manuscript.

Funding

This work was supported by the National Natural Science Foundation of China (82171872), Natural Science Foundation of Shanghai (21ZR1464600), Shanghai Key Laboratory of Forensic Medicine (21DZ2270800), Shanghai Forensic Service Platform (19DZ2290900), Central Research Institute Public Project (GY2020G-4 and GY2021G-5).

Institutional Review Board Statement

Not applicable.

Informed Consent Statement

Not applicable.

Data Availability Statement

The data presented in this study are available on request from the corresponding author.

Acknowledgments

The authors gratefully acknowledge the support from Bachelor Cuicui Rong in life.

Conflicts of Interest

The authors declare no conflict of interest.

Appendix A

Table A1. Review of material properties of lower limb long bones.
LocationsMaterial TypesNumber, Sex, Mean AgeLoading TypesReferences
Reilly (1974)Femur bodyEcn = 19, N/A, 53.11Compression test[22]
Zioupos (1998)Femur bodyEcn = 10, F, 55.1Compression test[44]
Donaldson (2011)Femur mid-upper endEcn = 27, M, 53.42Software[45]
Merlo (2020)Tibia upper endEcn = 10, M, 73.1 ± 10.9Compression test[46]
Ding (1997)Tibia lower endEs, ρsn = 40, F(30) M(10), 50.5Stretch test[47]
Dalzell (2009)Tibia bodyρc, ρsn = 132, 58 (M) 74 (F), 50.7(M) 49.7 (F)pQCT[48]
Thomas (2009)Tibia bodyρsn = 68, 33 (M) 35 (F), 69 (M) 68.5 (F)pQCT[49]
Hamandi (2021)Tibia bodyρsn = 313, 153 (M) 160 (F), 59 (M) 59 (F)Software[25]
where Ec is Young’s modulus of cortical bone, Es is Young’s modulus of spongy bone, ρc is the BMD of cortical bone, and ρs is the BMD of spongy bone. M is for male, F is for female. N/A is for not applicable.
Figure A1. Comparison of Young’s modulus and BMD of cortical bone in different locations of femur and tibia. The ground color dot in the figure represent the true distribution of each sample, and the linear bar segments are the result of our linear fitting.
Applsci 12 06911 g0a1
Table A2. Material properties of the long bones of the lower limbs of seven Chinese pedestrians.
BoneLocationsAge
20 YO30 YO40 YO50 YO60 YO70 YO80 YO
FemurFemoral headEc = 13.5 Gpa, Es = 0.082 Gpa/ρc = 1520 kg·m−3, ρs = 830 kg·m−3Ec = 13.2 Gpa, Es = 0.076 Gpa/ρc = 14 60 kg·m−3, ρs = 780 kg·m−3Ec = 12.5 Gpa, Es = 0.072 Gpa/ρc = 1440 kg·m−3, ρs = 750 kg·m−3Ec = 12.1 Gpa, Es = 0.067 Gpa/ρc = 1380 kg·m−3, ρs = 730 kg·m−3Ec = 11.7 Gpa, Es = 0.058 Gpa/ρc = 1330 kg·m−3, ρs = 720 kg·m−3Ec = 11.2 Gpa, Es = 0.055 Gpa/ρc = 1260 kg·m−3, ρs = 650 kg·m−3Ec = 10.7 Gpa, Es = 0.050 Gpa/ρc = 1230 kg·m−3, ρs = 590 kg·m−3
Femoral neck and rotorEc = 12.6 Gpa, Es = 0.079 Gpa/ρc = 1475 kg·m−3, ρs = 820 kg·m−3Ec= 11.9 Gpa, Es = 0.074 Gpa/ρc = 1420 kg·m−3, ρs = 765 kg·m−3Ec = 11.5 Gpa, Es = 0.070 Gpa/ρc = 1380 kg·m−3, ρs = 740 kg·m−3Ec = 10.8 Gpa, Es = 0.068 Gpa/ρc = 1330 kg·m−3, ρs = 715 kg·m− 3Ec = 10.4 Gpa, Es = 0.060 Gpa/ρc = 1290 kg·m−3, ρs = 710 kg·m−3Ec = 9.8 Gpa, Es = 0.056 Gpa/ρc = 1180 kg·m−3, ρs = 655 kg·m−3Ec = 9.3 Gpa, Es = 0.052 Gpa/ρc = 1120 kg·m−3, ρs = 595 kg·m−3
Femoral bodyEc = 17.8 Gpa, Es = 0.085 Gpa/ρc = 1850 kg·m−3, ρs = 850 kg·m−3Ec = 17.5 Gpa, Es = 0.079 Gpa/ρc = 1790 kg·m−3, ρs = 750 kg·m−3Ec = 17.0 Gpa, Es = 0.068 Gpa/ρc = 1740 kg·m−3, ρs = 735 kg·m−3Ec = 16.5 Gpa, Es = 0.070 Gpa/ρc = 1680 kg·m−3, ρs = 725 kg·m−3Ec = 16.3 Gpa, Es = 0.063 Gpa/ρc = 1650 kg·m−3, ρs = 720 kg·m−3Ec = 15.9 Gpa, Es = 0.060 Gpa/ρc = 1580 kg·m−3, ρs = 710 kg·m−3Ec = 15.2 Gpa, Es = 0.058 Gpa/ρc = 1480 kg·m−3, ρs = 650 kg·m−3
Femoral condyleEc = 12.9 Gpa, Es = 0.080 Gpa/ρc = 1500 kg·m−3, ρs = 800 kg·m−3Ec = 12.5 Gpa, Es = 0.068 Gpa/ρc = 1470 kg·m−3, ρs = 738 kg·m−3Ec = 12.0 Gpa, Es = 0.066 Gpa/ρc = 1450 kg·m−3, ρs = 725 kg·m−3Ec = 11.8 Gpa, Es = 0.063 Gpa/ρc = 1390 kg·m−3, ρs = 698 kg·m−3Ec = 10.9 Gpa, Es = 0.058 Gpa/ρc = 1280 kg·m−3, ρs = 690 kg·m−3Ec = 10.2 Gpa, Es = 0.060 Gpa/ρc=1200 kg·m−3, ρs = 685 kg·m−3Ec = 9.7 Gpa, Es = 0.053 Gpa/ρc=1150 kg·m−3, ρs = 600 kg·m−3
TibiaTibial upper endEc = 11.0Gpa, Es = 0.078 Gpa/ρc = 1520 kg·m−3, ρs = 800 kg·m−3Ec = 10.8 Gpa, Es = 0.076 Gpa/ρc = 1500 kg·m−3, ρs = 795 kg·m−3Ec = 10.5 Gpa, Es = 0.073 Gpa/ρc = 1460 kg·m−3, ρs = 786 kg·m−3Ec = 9.8 Gpa, Es = 0.072 Gpa/ρc = 1400 kg·m−3, ρs = 780 kg·m−3Ec = 9.6 Gpa, Es = 0.068 Gpa/ρc = 1380 kg·m−3, ρs = 760 kg·m−3Ec = 8.9 Gpa, Es = 0.065 Gpa/ρc = 1350 kg·m−3, ρs = 745 kg·m−3Ec = 8.2 Gpa, Es = 0.060 Gpa/ρc = 1320 kg·m−3, ρs = 730 kg·m−3
Tibial bodyEc = 14.0 Gpa, Es = 0.080 Gpa/ρc = 1780 kg·m−3, ρs = 830 kg·m−3Ec = 13.5 Gpa, Es = 0.080 Gpa/ρc = 1720 kg·m−3, ρs = 815 kg·m−3Ec = 13.0 Gpa, Es = 0.079 Gpa/ρc = 1650 kg·m−3, ρs=805 kg·m−3Ec = 12.6 Gpa, Es = 0.077 Gpa/ρc = 1600 kg·m−3, ρs = 800 kg·m−3Ec = 12.0 Gpa, Es = 0.074 Gpa/ρc = 1580 kg·m−3, ρs = 790 kg·m−3Ec = 11.6 Gpa, Es = 0.072 Gpa/ρc = 1560 kg·m−3, ρs = 775 kg·m−3Ec = 11.2 Gpa, Es = 0.070 Gpa/ρc = 1520 kg·m−3, ρs = 768 kg·m−3
Tibial lower endEc = 11.8 Gpa, Es = 0.079 Gpa/ρ c= 1580 kg·m−3, ρs = 815 kg·m−3Ec = 11.3 Gpa, Es = 0.076 Gpa/ρc = 1540 kg·m−3, ρs = 810 kg·m−3Ec = 10.8 Gpa, Es = 0.074 Gpa/ρc = 1520 kg·m−3, ρs = 800 kg·m−3Ec = 10.2 Gpa, Es = 0.072 Gpa/ρc = 1485 kg·m−3, ρs = 785 kg·m−3Ec = 9.8 Gpa, Es = 0.072 Gpa/ρc = 1460 kg·m−3, ρs = 770 kg·m−3Ec = 9.4 Gpa, Es = 0.070 Gpa/ρc = 1420 kg·m−3, ρs = 756 kg·m−3Ec = 9.0 Gpa, Es = 0.065 Gpa/ρc = 1385 kg·m−3, ρs = 740 kg·m−3
Figure A2. Bending moment of femur and tibia of pedestrians of seven ages at 30 km/h.
Applsci 12 06911 g0a2
Figure A3. Bending moment of femur and tibia of pedestrians of seven ages at 50 km/h.
Applsci 12 06911 g0a3
Figure A4. Bending moment of femur and tibia of pedestrians of seven ages at 60 km/h.
Applsci 12 06911 g0a4
Figure A5. Bending moment of femur and tibia of pedestrians of seven ages at 70 km/h.
Applsci 12 06911 g0a5
Figure A6. The peak Von mises stress of the femur and tibia of pedestrians of seven ages at 30/50/60/70 km/h.
Applsci 12 06911 g0a6

References

  1. World Health Organization. Global Status Report on Road Safety 2015. Inj. Prev. 2015, 15, 286. [Google Scholar]
  2. Knight, B. Transportation injuries. Kn. Forensic Pathol. 2004, 281–300. Available online: https://cir.nii.ac.jp/crid/1573668924774772096 (accessed on 8 June 2022).
  3. Liu, G.; Chen, S.; Zeng, Z.; Cui, H.; Fang, Y.; Gu, D.; Yin, Z.; Wang, Z. Risk factors for extremely serious road accidents: Results from national Road Accident Statistical Annual Report of China. PLoS ONE 2018, 13, e0201587. [Google Scholar] [CrossRef]
  4. Connelly, C.L.; Bucknall, V.; Jenkins, P.J.; Court-Brown, C.M.; Biant, L.C. Outcome at 12 to 22 years of 1502 tibial shaft fractures. Bone Jt. J. 2014, 96, 1370–1377. [Google Scholar] [CrossRef] [PubMed]
  5. Singh, R.; Singh, H.K.; Gupta, S.; Kumar, Y. Pattern, severity and circumtances of injuries sustained in road traffic accidents: A tertiary care hospital-based study. Indian J. Community Med. Off. Publ. Indian Assoc. Prev. Soc. Med. 2014, 39, 30. [Google Scholar] [CrossRef] [PubMed]
  6. Malm, S.; Krafft, M.; Kullgren, A.; Ydenius, A.; Tingvall, C. Risk of Permanent Medical Impairment (RPMI) in Road Traffic Accidents. Ann. Adv. Automot. Med. 2008, 52, 93–100. [Google Scholar]
  7. Karger, B.; Teige, K.; Fuchs, M.; Brinkmann, B. Was the pedestrian hit in an erect position before being run over? Forensic Sci. Int. 2001, 119, 217–220. [Google Scholar] [CrossRef]
  8. Nogayeva, S.; Gooch, J.; Frascione, N. The forensic investigation of vehicle–pedestrian collisions: A review. Sci. Justice 2021, 61, 112–118. [Google Scholar] [CrossRef]
  9. Rich, J.; Dean, D.E.; Powers, R.H. Forensic Medicine of the Lower Extremity; Springer: Berlin/Heidelberg, Germany, 2007. [Google Scholar]
  10. Li, Z.; Zou, D.; Liu, N.; Zhong, L.; Shao, Y.; Wan, L.; Huang, P.; Chen, Y. Finite element analysis of pedestrian lower limb fractures by direct force: The result of being run over or impact? Forensic Sci. Int. 2013, 229, 43–51. [Google Scholar] [CrossRef]
  11. Rowbotham, S.K.; Blau, S. Skeletal fractures resulting from fatal falls: A review of the literature. Forensic Sci. Int. 2016, 266, 582.e1–582.e15. [Google Scholar] [CrossRef]
  12. Cunha, E.; Pinheiro, J. Bone pathology and antemortem trauma. In Forensic Anthropology; Academic Press: Cambridge, MA, USA, 2016; Volume 177. [Google Scholar] [CrossRef]
  13. Cohen, H.; Kugel, C.; May, H.; Medlej, B.; Stein, D.; Slon, V.; Hershkovitz, I.; Brosh, T. The impact velocity and bone fracture pattern: Forensic perspective. Forensic Sci. Int. 2016, 266, 54–62. [Google Scholar] [CrossRef] [PubMed]
  14. Galloway, A.; Zephro, L. Skeletal trauma analysis of the lower extremity. In Forensic Medicine of the Lower Extremity; Humana Press: Totowa, NJ, USA, 2005; pp. 253–277. [Google Scholar] [CrossRef]
  15. Henary, B.Y.; Ivarsson, J.; Crandall, J.R. The influence of age on the morbidity and mortality of pedestrian victims. Traffic Inj. Prev. 2006, 7, 182–190. [Google Scholar] [CrossRef] [PubMed]
  16. Jingwen, H.; Rupp, J.D.; Reed, M.P. Focusing on Vulnerable Populations in Crashes: Recent Advances in Finite Element Human Models for Injury Biomechanics Research. J. Automot. Saf. Energy 2012, 3, 295. [Google Scholar] [CrossRef]
  17. Sun, S.-S.; Ma, H.-L.; Liu, C.-L.; Huang, C.-H.; Cheng, C.-K.; Wei, H.-W. Difference in femoral head and neck material properties between osteoarthritis and osteoporosis. Clin. Biomech. 2008, 23, S39–S47. [Google Scholar] [CrossRef] [PubMed]
  18. Mirzaali, M.J.; Schwiedrzik, J.J.; Thaiwichai, S.; Best, J.P.; Michler, J.; Zysset, P.K.; Wolfram, U. Mechanical properties of cortical bone and their relationships with age, gender, composition and microindentation properties in the elderly. Bone 2016, 93, 196–211. [Google Scholar] [CrossRef]
  19. Waseem, U. Effect of age on the elastic modulus of bone. J. Bioeng. Biomed. Sci. 2017, 7, 2. [Google Scholar] [CrossRef] [Green Version]
  20. Forman, J.L.; de Dios, E.; Symeonidis, I.; Duart, J.; Kerrigan, J.R.; Salzar, R.S.; Balasubramanian, S.; Segui-Gomez, M.; Kent, R.W. Fracture tolerance related to skeletal development and aging throughout life: 3-point bending of human femurs. In Proceedings of the IRCOBI Conference, Dublin, Ireland, 12–14 September 2012; pp. 529–539. [Google Scholar]
  21. Mather, B.S. The symmetry of the mechanical properties of the human femur. J. Surg. Res. 1967, 7, 222–225. [Google Scholar] [CrossRef]
  22. Reilly, D.T.; Burstein, A.H.; Frankel, V.H. The elastic modulus for bone. J. Biomech. 1974, 7, 271–275. [Google Scholar] [CrossRef]
  23. Krischak, G.D.; Augat, P.; Wachter, N.J.; Kinzl, L.; Claes, L.E. Predictive value of bone mineral density and Singh index for the in vitro mechanical properties of cancellous bone in the femoral head. Clin. Biomech. 1999, 14, 346–351. [Google Scholar] [CrossRef]
  24. Yamada, H. Strength of biological materials. J. Anat. 1970, 108, 582. [Google Scholar]
  25. Hamandi, F.; Tsatalis, J.T.; Goswami, T. Retrospective evaluation and framework development of bone anisotropic material behavior compared with elastic, elastic-plastic, and hyper-elastic properties. Bioengineering 2021, 9, 9. [Google Scholar] [CrossRef] [PubMed]
  26. Schoell, S.L.; Weaver, A.A.; Urban, J.E.; Jones, D.A.; Stitzel, J.D.; Hwang, E.; Reed, M.P.; Rupp, J.D. Development and validation of an older occupant finite element model of a mid-sized male for investigation of age-related injury risk. Stapp Car Crash J. 2015, 59, 359. [Google Scholar] [PubMed]
  27. Huang, J.; Long, Y.; Yan, Y.; Hu, L. Development and validation of an age-specific lower extremity finite element model for simulating pedestrian accidents. Appl. Bionics Biomech. 2018, 2018, 5906987. [Google Scholar] [CrossRef] [PubMed] [Green Version]
  28. Tang, J.; Zhou, Q.; Nie, B.; Hu, J. Obesity effects on pedestrian lower extremity injuries in vehicle-to-pedestrian impacts: A numerical investigation using human body models. Traffic Inj. Prev. 2020, 21, 569–574. [Google Scholar] [CrossRef] [PubMed]
  29. Chen, H.; Poulard, D.; Forman, J.; Crandall, J.; Panzer, M.B. Evaluation of geometrically personalized THUMS pedestrian model response against sedan–pedestrian PMHS impact test data. Traffic Inj. Prev. 2018, 19, 542–548. [Google Scholar] [CrossRef]
  30. Mo, F.; Li, F.; Behr, M.; Xiao, Z.; Zhang, G.; Du, X. A Lower Limb-Pelvis Finite Element Model with 3D Active Muscles. Ann. Biomed. Eng. 2017, 46, 86–96. [Google Scholar] [CrossRef]
  31. Mo, F.; Luo, D.; Tan, Z.; Shang, B.; Zhou, D. A Human Active Lower Limb Model for Chinese Pedestrian Safety Evaluation. J. Bionic Eng. 2021, 18, 872–886. [Google Scholar] [CrossRef]
  32. Cardot, J.; Masson, C.; Arnoux, P.J.; Brunet, C. Finite element analysis of cyclist lower limb response in car-bicycle accident. Int. J. Crashworthiness 2006, 11, 115–130. [Google Scholar] [CrossRef]
  33. Scattina, A.; Mo, F.; Masson, C.; Avalle, M.; Arnoux, P.J. Analysis of the influence of passenger vehicles front-end design on pedestrian lower extremity injuries by means of the LLMS model. Traffic Inj. Prev. 2018, 19, 535–541. [Google Scholar] [CrossRef]
  34. Mo, F.; Arnoux, P.J.; Avalle, M.; Scattina, A.; Semino, E.; Masson, C. Incidences of various passenger vehicle front-end designs on pedestrian lower limb injuries. Int. J. Crashworthiness 2015, 20, 337–347. [Google Scholar] [CrossRef]
  35. Penrose, J.; Holt, G.; Beaugonin, M.; Hose, D. Development of an accurate three-dimensional finite element knee model. Comput. Methods Biomech. Biomed. Eng. 2002, 5, 291–300. [Google Scholar] [CrossRef] [PubMed]
  36. Rho, J.-Y.; Hobatho, M.; Ashman, R. Relations of mechanical properties to density and CT numbers in human bone. Med. Eng. Phys. 1995, 17, 347–355. [Google Scholar] [CrossRef]
  37. Keyak, J.; Meagher, J.; Skinner, H.; Mote Jr, C. Automated three-dimensional finite element modelling of bone: A new method. J. Biomed. Eng. 1990, 12, 389–397. [Google Scholar] [CrossRef]
  38. Ciarelli, M.; Goldstein, S.; Kuhn, J.; Cody, D.; Brown, M. Evaluation of orthogonal mechanical properties and density of human trabecular bone from the major metaphyseal regions with materials testing and computed tomography. J. Orthop. Res. 1991, 9, 674–682. [Google Scholar] [CrossRef] [PubMed]
  39. Harp, J.H.; Aronson, J.; Hollis, M. Noninvasive determination of bone stiffness for distraction osteogenesis by quantitative computed tomography scans. Clin. Orthop. Relat. Res. 1994, 301, 42–48. [Google Scholar] [CrossRef]
  40. Hobatho, M.-C.; Rho, J.Y.; Ashman, R.B. Bone mechanical properties in vitro. Bone Res. Biomech. 1997, 40, 157. [Google Scholar] [CrossRef]
  41. Lengsfeld, M.; Schmitt, J.; Alter, P.; Kaminsky, J.; Leppek, R. Comparison of geometry-based and CT voxel-based finite element modelling and experimental validation. Med. Eng. Phys. 1998, 20, 515–522. [Google Scholar] [CrossRef]
  42. Klinich, K.D.; Schneider, L.W. Biomechanics of Pedestrian Injuries Related to Lower Extremity Injury Assessment tools: A Review of the Literature and Analysis of Pedestrian Crash Database; University of Michigan Transportation Research Institute: Ann Arbor, MI, USA, 2003. [Google Scholar]
  43. Van Ratingen, M.R. The euro ncap safety rating. In Karosseriebautage Hamburg 2017; Springer: Berlin/Heidelberg, Germany, 2017; pp. 11–20. [Google Scholar] [CrossRef]
  44. Zioupos, P.; Currey, J. Changes in the stiffness, strength, and toughness of human cortical bone with age. Bone 1998, 22, 57–66. [Google Scholar] [CrossRef]
  45. Donaldson, F.; Pankaj, P.; Cooper, D.; Thomas, C.; Clement, J.; Simpson, A. Relating age and micro-architecture with apparent-level elastic constants: A micro-finite element study of female cortical bone from the anterior femoral midshaft. Proc. Inst. Mech. Eng. Part H J. Eng. Med. 2011, 225, 585–596. [Google Scholar] [CrossRef]
  46. Merlo, K.; Aaronson, J.; Vaidya, R.; Rezaee, T.; Chalivendra, V.; Karim, L. In Vitro-Induced High Sugar Environments Deteriorate Human Cortical Bone Elastic Modulus and Fracture Toughness. J. Orthop. Res. 2020, 38, 972–983. [Google Scholar] [CrossRef]
  47. Ding, M.; Dalstra, M.; Danielsen, C.C.; Kabel, J.; Hvid, I.; Linde, F. Age variations in the properties of human tibial trabecular bone. J. Bone Jt. Surg. 1997, 79, 995–1002. [Google Scholar] [CrossRef]
  48. Dalzell, N.; Kaptoge, S.; Morris, N.; Berthier, A.; Koller, B.; Braak, L.; Van Rietbergen, B.; Reeve, J. Bone micro-architecture and determinants of strength in the radius and tibia: Age-related changes in a population-based study of normal adults measured with high-resolution pQCT. Osteoporos. Int. 2009, 20, 1683–1694. [Google Scholar] [CrossRef] [PubMed]
  49. Thomas, C.D.; Mayhew, P.M.; Power, J.; Poole, K.E.; Loveridge, N.; Clement, J.G.; Burgoyne, C.J.; Reeve, J. Femoral neck trabecular bone: Loss with aging and role in preventing fracture. J. Bone Miner. Res. Off. J. Am. Soc. Bone Miner. Res. 2009, 24, 1808–1818. [Google Scholar] [CrossRef] [Green Version]
  50. Niebuhr, T.; Junge, M.; Rosen, E. Pedestrian injury risk and the effect of age. Accid. Anal. Prev. 2016, 86, 121–128. [Google Scholar] [CrossRef] [PubMed]
  51. Klein, K.F.; Hu, J.; Reed, M.P.; Hoff, C.N.; Rupp, J.D. Development and validation of statistical models of femur geometry for use with parametric finite element models. Ann. Biomed. Eng. 2015, 43, 2503–2514. [Google Scholar] [CrossRef]
  52. Oikawa, S.; Matsui, Y.; Doi, T.; Sakurai, T. Relation between vehicle travel velocity and pedestrian injury risk in different age groups for the design of a pedestrian detection system. Safety Sci. 2016, 82, 361–367. [Google Scholar] [CrossRef]
  53. Keaveny, T.M.; Hoffmann, P.F.; Singh, M.; Palermo, L.; Bilezikian, J.P.; Greenspan, S.L.; Black, D.M. Femoral bone strength and its relation to cortical and trabecular changes after treatment with PTH, alendronate, and their combination as assessed by finite element analysis of quantitative CT scans. J. Bone Miner. Res. 2008, 23, 1974–1982. [Google Scholar] [CrossRef] [Green Version]
  54. Keyak, J.H.; Falkinstein, Y. Comparison of in situ and in vitro CT scan-based finite element model predictions of proximal femoral fracture load. Med. Eng. Phys. 2003, 25, 781–787. [Google Scholar] [CrossRef]
  55. Bredbenner, T.L.; Mason, R.L.; Havill, L.M.; Orwoll, E.S.; Nicolella, D.P.; Study, O.F.i.M. Fracture risk predictions based on statistical shape and density modeling of the proximal femur. J. Bone Miner. Res. 2014, 29, 2090–2100. [Google Scholar] [CrossRef]
  56. Edidin, A.; Taylor, D.; Bartel, D. Automatic assignment of bone moduli from CT data: A 3-D finite element study. Trans. Orthop. Res. Soc. 1991, 16, 491. [Google Scholar]
  57. Marom, S.A.; Linden, M.J. Computer aided stress analysis of long bones utilizing computed tomography. J. Biomech. 1990, 23, 399–404. [Google Scholar] [CrossRef]
  58. Sheng, W.; Ji, A.; Chen, C. Biomechanical research of the femur finite element model combined with different material assignment methods. In Proceedings of the MATEC Web of Conferences, Sibiu, Romania, 7–9 June 2017; p. 2022. [Google Scholar] [CrossRef] [Green Version]
  59. Yassine, R.A.; Elham, M.K.; Mustapha, S.; Hamade, R.F. A detailed methodology for FEM analysis of long bones from CT using Mimics. In Proceedings of the ASME International Mechanical Engineering Congress and Exposition, Tampa, FL, USA, 3–9 November 2017; p. V003T004A012. [Google Scholar] [CrossRef]
  60. Kluess, D.; Soodmand, E.; Lorenz, A.; Pahr, D.; Schwarze, M.; Cichon, R.; Varady, P.A.; Herrmann, S.; Buchmeier, B.; Schröder, C. A round-robin finite element analysis of human femur mechanics between seven participating laboratories with experimental validation. Comput. Methods Biomech. Biomed. Eng. 2019, 22, 1020–1031. [Google Scholar] [CrossRef] [PubMed]
  61. Iwamoto, M.; Miki, K.; Tanaka, E. Ankle skeletal injury predictions using anisotropic inelastic constitutive model of cortical bone taking into account damage evolution. Stapp Car Crash J. 2005, 49, 133–156. [Google Scholar] [CrossRef] [PubMed]
  62. Untaroiu, C.D.; Yue, N.; Shin, J. A finite element model of the lower limb for simulating automotive impacts. Ann. Biomed. Eng. 2013, 41, 513–526. [Google Scholar] [CrossRef]
Figure 1. HALL model (A) and the Chinese 50th percentile pedestrian model (B).
Applsci 12 06911 g001
Figure 2. Extraction and material assignment process for long bone geometric models. (A) Material assignment of the femur. (B) Material assignment of the tibia.
Applsci 12 06911 g002
Figure 3. Establishment of FE pedestrian-FCR collision model. (A) Two perspectives of pedestrian-FCR. (B) FCR and pedestrian standing posture are established and adjusted according to regulatory standards.
Applsci 12 06911 g003
Figure 4. Linear fitting of Young’s modulus (A) and bone mineral density (B) of long bone cortical/spongy bone (Adapted from [22,25,44,45,46,47,48,49]).
Applsci 12 06911 g004
Figure 5. The collision motion process of HALL model 50ms. (A) Overall collision process. (B) HALL model transparent collision process.
Applsci 12 06911 g005
Figure 6. Bending moment of femur and tibia of pedestrians of seven ages at 40 km/h.
Applsci 12 06911 g006
Figure 7. The peak Von mises stress of the femur and tibia of pedestrians of seven ages at 40 km/h.
Applsci 12 06911 g007
Figure 8. Comparison of the Von mises stress contours of the femur in seven ages at 40 km/h.
Applsci 12 06911 g008
Figure 9. Comparison of the Von mises stress contours of the tibia in seven ages at 40 km/h.
Applsci 12 06911 g009
Publisher’s Note: MDPI stays neutral with regard to jurisdictional claims in published maps and institutional affiliations.

