1. Introduction
The advantages of non-equilibrium plasmas at atmospheric pressure, such as high chemical reactivity [
1,
2] and low energy consumption [
3,
4], have ensured that such plasmas are now well established industrially and are steadily growing [
5,
6]. As a result, according to recent research trends [
6,
7,
8], a comprehensive characterization of non-equilibrium plasmas is increasingly important, especially in the environmental and health application fields [
2,
9,
10,
11,
12]. Non-equilibrium conditions in a plasma can be achieved in discharges driven by DC power supplies, but are commonly generated by a pulsed low-current high-voltage discharge [
1,
5,
6,
9], since the choice of the operating frequency as well as the shape of an excitation pulse makes the separate controllability of electron and heavy particle temperatures possible [
1,
13]. This enables a better adjustment of the plasma to the required application.
In general, the results of plasma treatments depend on the chemistry at the interface between the plasma and the treated object, which is governed by an interplay of the collision rates of energetic electrons and of ions with other particles or neutrals of the surrounding gas [
1,
14,
15]. Because electrons can absorb more energy from the external electric field due to their high mobility compared to other plasma constituents, plasma chemistry is defined by electron number density
and electron temperature
[
6,
16]. As a result, if the electron number density is high, the ionization and dissociation reactions are driven by inelastic electron collisions. Nevertheless, these reactions can also be governed by inelastic atom and molecule collisions, depending on the conditions and the plasma carrier gas used [
17,
18,
19]. Thus, the knowledge of the heavy particle temperature
is, in general, as important as the knowledge of the electron parameters, i.e.,
and
[
20]. The estimation of the quantities
,
and
allows the assessment of the chemical reactivity of a plasma and thus a better control over the occurring reactions [
6].
Laser scattering is one of several diagnostic methods to experimentally determine the plasma parameters,
,
and
. This diagnostic technique is neither limited by the assumption of equilibrium conditions [
21,
22], nor by the plasma composition, as both atomic and molecular plasmas can be investigated [
23,
24], nor by the operating pressure range [
25,
26]. Laser scattering not only provides a high spatial resolution [
27,
28], but also a high temporal resolution when the laser is synchronized with the pulse frequency of the power supply [
29].
In order to experimentally estimate the plasma parameters by means of laser scattering, the intensity of the scattered signal, which is proportional to both the concentration of scattering species and to the intensity of the incident laser radiation [
30], has to be high enough to be clearly detected by the diagnostic setup. The results also depend on the scattering angle, i.e., the angle between the wave vector of the incident radiation and the wave vector of the scattered radiation, as reported by Gregori et al. [
31]. Thus, laser scattering has its limitations. According to [
26,
27], the main detection-limiting factors are the inherent plasma radiation and the stray light, i.e., the light scattered by the surroundings of the measurement volume and not by the particles inside the volume. Thus, the lowest electron density that can be determined with a diagnostic setup consisting of a laser, a spectrograph and a camera is in the range of
[
27]. Usually, at such low number densities, a mask is placed at the exit of the spectrograph to block the laser wavelength so that the detection sensitivity of the camera can be increased. However, the use of a blocking mask requires an intermediate image plane and thus another optical image on the detector. Furthermore, the laser blocking mask has to be removed to calibrate the setup or to measure the temperature of heavy particles if Rayleigh scattering is used for this purpose. A detailed description of setups using a blocking mask can be found in [
21,
27]. To improve the stray light rejection, the spectral resolution of experimental setups is often increased by coupling multiple spectrographs in series. Double grating [
32] or even triple grating [
21,
28,
33] spectrographs are most commonly used. The latter are proven to be highly effective for electron densities below
and enable, due to the high spectral resolution, in most cases, a setup calibration or estimation of
without major modifications (both based on Raman scattering) [
21,
26,
27,
34].
Nonetheless, non-equilibrium plasmas can be also characterized with a simpler laser scattering setup. The wide dynamic range of modern detection devices should allow to detect both the Rayleigh and Thomson scattering signals with one and the same setting. Hence, the determination of plasma parameters should be possible, even without a laser blocking mask with an appropriate choice of components and under certain experimental conditions (discussed in the following). This would have the advantage that no physical change is made to the setup or the acquisition settings, thus reducing potential sources of error. In addition, a simple layout can be much more compact and mobile. Such a simple laser scattering setup working without a blocking mask is proposed in this paper.
In the next section, the theoretical considerations for a simplified scattering setup are discussed, followed by the description of the setup in
Section 3. In
Section 4, the proposed layout is applied to estimate the plasma parameters of a pulsed low-current high-voltage discharge operated at atmospheric pressure. A discussion of the results is presented in
Section 5, followed by a conclusion.
2. Theoretical Considerations
The incident laser light, an electromagnetic wave, interacts with charged plasma particles. During the short laser pulse, the duration of which is in the range of
according to the specification of the laser used [
35], the bound and free electrons are accelerated due to their small mass and high mobility, compared to other heavier species and follow the electric field of the incident wave. Thus, the electrons start to oscillate with the frequency of the incident radiation. This oscillation causes the electrons to emit electromagnetic radiation like an oscillating electrical dipole. Depending on the energy of the incident radiation, several interaction mechanisms can be distinguished. These can be mainly divided into those in which some energy is transferred to (or gained from) the interacting particle (called inelastic scattering, in which the emitted radiation has a slightly different wavelength than the incident radiation) and those in which the total kinetic energy is conserved (elastic scattering, in which the emitted and incident radiation have the same wavelength). Elastic scattering of electromagnetic waves in the visible range can be divided into Rayleigh (short RyS) and Thomson (ThS) scattering processes. In the RyS process, photons of the incident radiation are scattered by bound electrons in the atoms/molecules, compared to free plasma electrons in the ThS process. From the recorded ThS signal, the electron density and electron temperature can be derived. In the case of inelastic scattering, when energy is transferred between the incident radiation and plasma particles, the process is called Raman scattering. If longer wavelengths than the incident radiation are observed in the recorded signal, then energy is transferred to the interacting plasma particles, and the process is referred to as Stokes Raman scattering. If a shift to shorter wavelengths can be observed, the internal energy of the scattering particles is reduced and the process is referred to as anti-Stokes Raman scattering. Additionally, since Raman scattering occurs on molecular gases, rotational and vibrational lines can be detected in the scattered signal. Thus, when working with molecular gases, attention should be paid to the rotational Raman lines, which occur in the same wavelength range as the Thomson scattered signal and can therefore influence the evaluated results [
27]. A comprehensive description of the scattering processes can be found in the works of Evans and Katzenstein [
36] as well as Sheffield [
30] and Jackson [
37]. For more application-oriented descriptions, refer to [
26,
27,
38,
39].
Regardless of the scattering mechanism, the mean scattered power
over a spectral frequency range
is a function of the total spectral distribution of the radiation scattered by (free or bound) electrons
within the scattering volume
V and, since the scattering depends on the electric field strength of the incident radiation,
is also a function of incident power
. Furthermore, the spectral distribution function
depends on the scattering geometry, i.e., on the difference
between the wave vector of the incident radiation
and the wave vector of the scattered radiation
as well as the difference
between the angular frequencies of the incident (
) and scattered (
) radiation. The incident power
is distributed across an area
A, which defines the scattering volume
V, as shown in
Figure 1. This volume results also from the observation through solid angle
since only a part of the scattering signal can be registered from the chosen viewing direction. Concluding, for the mean scattered power, it can be written [
26,
40]
with
denoting the differential scattering cross section for the scattering mechanism being considered and
the density of the scattering particles. This scattering cross section can be understood as the probability that a light quantum of the incident radiation is scattered by a particle of the medium (i.e., the free and bound electrons) into the observation solid angle.
The variables
,
,
and
are specific for each scattering mechanism. In case of Thomson scattering, if incoherent scattering is assumed, the scattered signal is a sum of the uncorrelated contributions of each scattering particle and the spectral distribution function
can be described by a Gaussian function [
26]. Hence, it can be written as
with
and
where
denotes the incident laser wavelength,
the speed of light,
k the absolute value of the difference between the wave vector of the scattered radiation
and the wave vector of incident radiation
and
denotes the thermal electron velocity.
The spectral distribution function does not in general correspond exactly to the experimentally measured scattering signal. The registered signal at (for instance) the detector, an image intensified charge coupled device (ICCD) camera, depends not only on the spectral sensitivity of the imaging sensor, but also on the sensitivity of the experimental setup and on the spectrometer’s transfer function. Hence, for the measured signal
, it can be written
with
as the scattered light spectrum,
K as the detection sensitivity of the experimental setup and
denoting the transfer function of the setup. The detection sensitivity
K takes into account the spectral response of all setup components, i.e., the spectral sensitivity of the ICCD, the lenses, mirrors and spectrometer used. Since the spectral range of the scattering signal is usually smaller than
[
21,
34,
41], the sensitivity
K is assumed to be independent of the wavelength and furthermore to be constant within this range. Both parameters, the detection sensitivity
K and transfer function
, can be determined by measuring light scattered by a reference object (source) with known properties. Rayleigh scattering of pure nitrogen at room temperature and atmospheric pressure can be used for this purpose. Analogous to Equations (
2)–(
4), the main parameters determining the scattering spectrum are, in the case of the Rayleigh scattering mechanism, the temperature of heavy particles
and the heavy particle number density
, which for the above conditions can be obtained from the ideal gas law.
Since thermal equilibrium can be assumed for room temperature under atmospheric pressure conditions, the spectral line width of the Rayleigh scattered signal is in the range of picometers [
42]. However, the resolution of the used spectrometer usually cannot resolve linewidths in the picometer range (see
Section 3); hence, for the spectral distribution function of Rayleigh signal, a Dirac delta function can be assumed
According to the above discussion, the following relation can be written for the measured Rayleigh scattered signal by combining Equation (
1) with Equations (
5) and (
6),
or equivalently,
Assuming that the transfer function
is normalized to 1, the above equation can be solved for the detection sensitivity
K in the case of
and yields
Accordingly, the transfer function of the whole detection apparatus, which is mainly determined by the transfer function of the spectrometer, is given by
With both the detection sensitivity
K and transfer function
defined based on the Rayleigh scattering signal, the spectral distribution of the measured Thomson scattering signal
can be expressed similarly to Equation (
7) as
The substitution of Equation (
9) for
K yields
If the spectral width of the transfer function
is significantly smaller than the spectral width of the Thomson scattered spectrum
, then the convolution integral, which represents the spectral distribution of the measured signal
, is accurately reproduced by a Gaussian distribution function. Hence,
Thereafter, the electron temperature
can be determined from the characteristic width
of the measured signal fitted by a Gaussian curve. The electron density
, on the other hand, can be determined by rearranging the Equation (
12) to
The heavy particle temperature, on the other hand, is determined from the intensity ratio of the Rayleigh peaks of the cold gas and plasma measurements via the ideal gas law after the respective measurements have been corrected for stray light beforehand (discussed in detail in
Section 3). This is possible because the recorded Rayleigh scattered intensity is directly proportional to the particle density according to the Equation (
8).
According to the above considerations, the choice of the spectrograph is a key point for an accurate functioning of the proposed method. Its spectral resolution should be significantly smaller than the spectral width of the Thomson scattered signal, but low enough to satisfy the assumption of a Dirac delta function for the Rayleigh signal. These requirements are easily achievable with most of today’s instruments. Under these conditions, the setup can be calibrated with the Rayleigh signal. If then the electron number density of the measurement object is high enough so that a sufficient intensity of the Thomson signal can be detected and the stray light, i.e., the light scattered by the immediate vicinity of the measurement volume, is low, a measurement can be performed with constant acquisition settings.
Influence of Rotational Raman Scattering
As briefly mentioned in the beginning of this section, the spectral ranges of Thomson scattering and rotational Raman scattering signals overlap. Hence, the influence of the latter on the results should be evaluated. According to Narishige et al. [
32], an overlap occurs when the total density of the Raman scattering particles
is
times larger than electron density, since Raman scattering cross sections are about
times smaller than the Thomson scattering cross section at the used laser wavelength. If the spectral distribution of the measured Raman signal
is expressed similarly to Equation (
12), both
and
signals can be put into relation as they are calibrated with the Rayleigh scattering signal
. Since the Raman spectrum for a given plasma gas at a specific temperature of heavy particles can be calculated if the instrumental profile of the detection apparatus is known, as described in [
26], the influence of rotational Raman scattering can be estimated by comparing the experimentally measured signals of
and
with the calculated
signal. Such a comparison is presented in
Figure 2 for nitrogen, which is used in this work.
From the experimentally measured
and
signals, a heavy particle temperature of
was determined for a pulsed, low-current nitrogen discharge operated at atmospheric pressure (described in
Section 3.1). The
signal was then calculated for this temperature and compared with the experimentally measured signals. As can be seen in
Figure 2, the measured Thomson scattering signal is three orders of magnitude smaller than the measured Rayleigh signal, whereas the calculated rotational Raman spectrum is approximately two orders of magnitude smaller than the Thomson signal. Taking into account that the intensity of the
signal decreases with increasing
, while the spectral range becomes broader [
26], it can be assumed that the rotational Raman signal does not significantly influence the Thomson scattering signal and hence the determined plasma parameters for the experimental setup proposed in the next section.
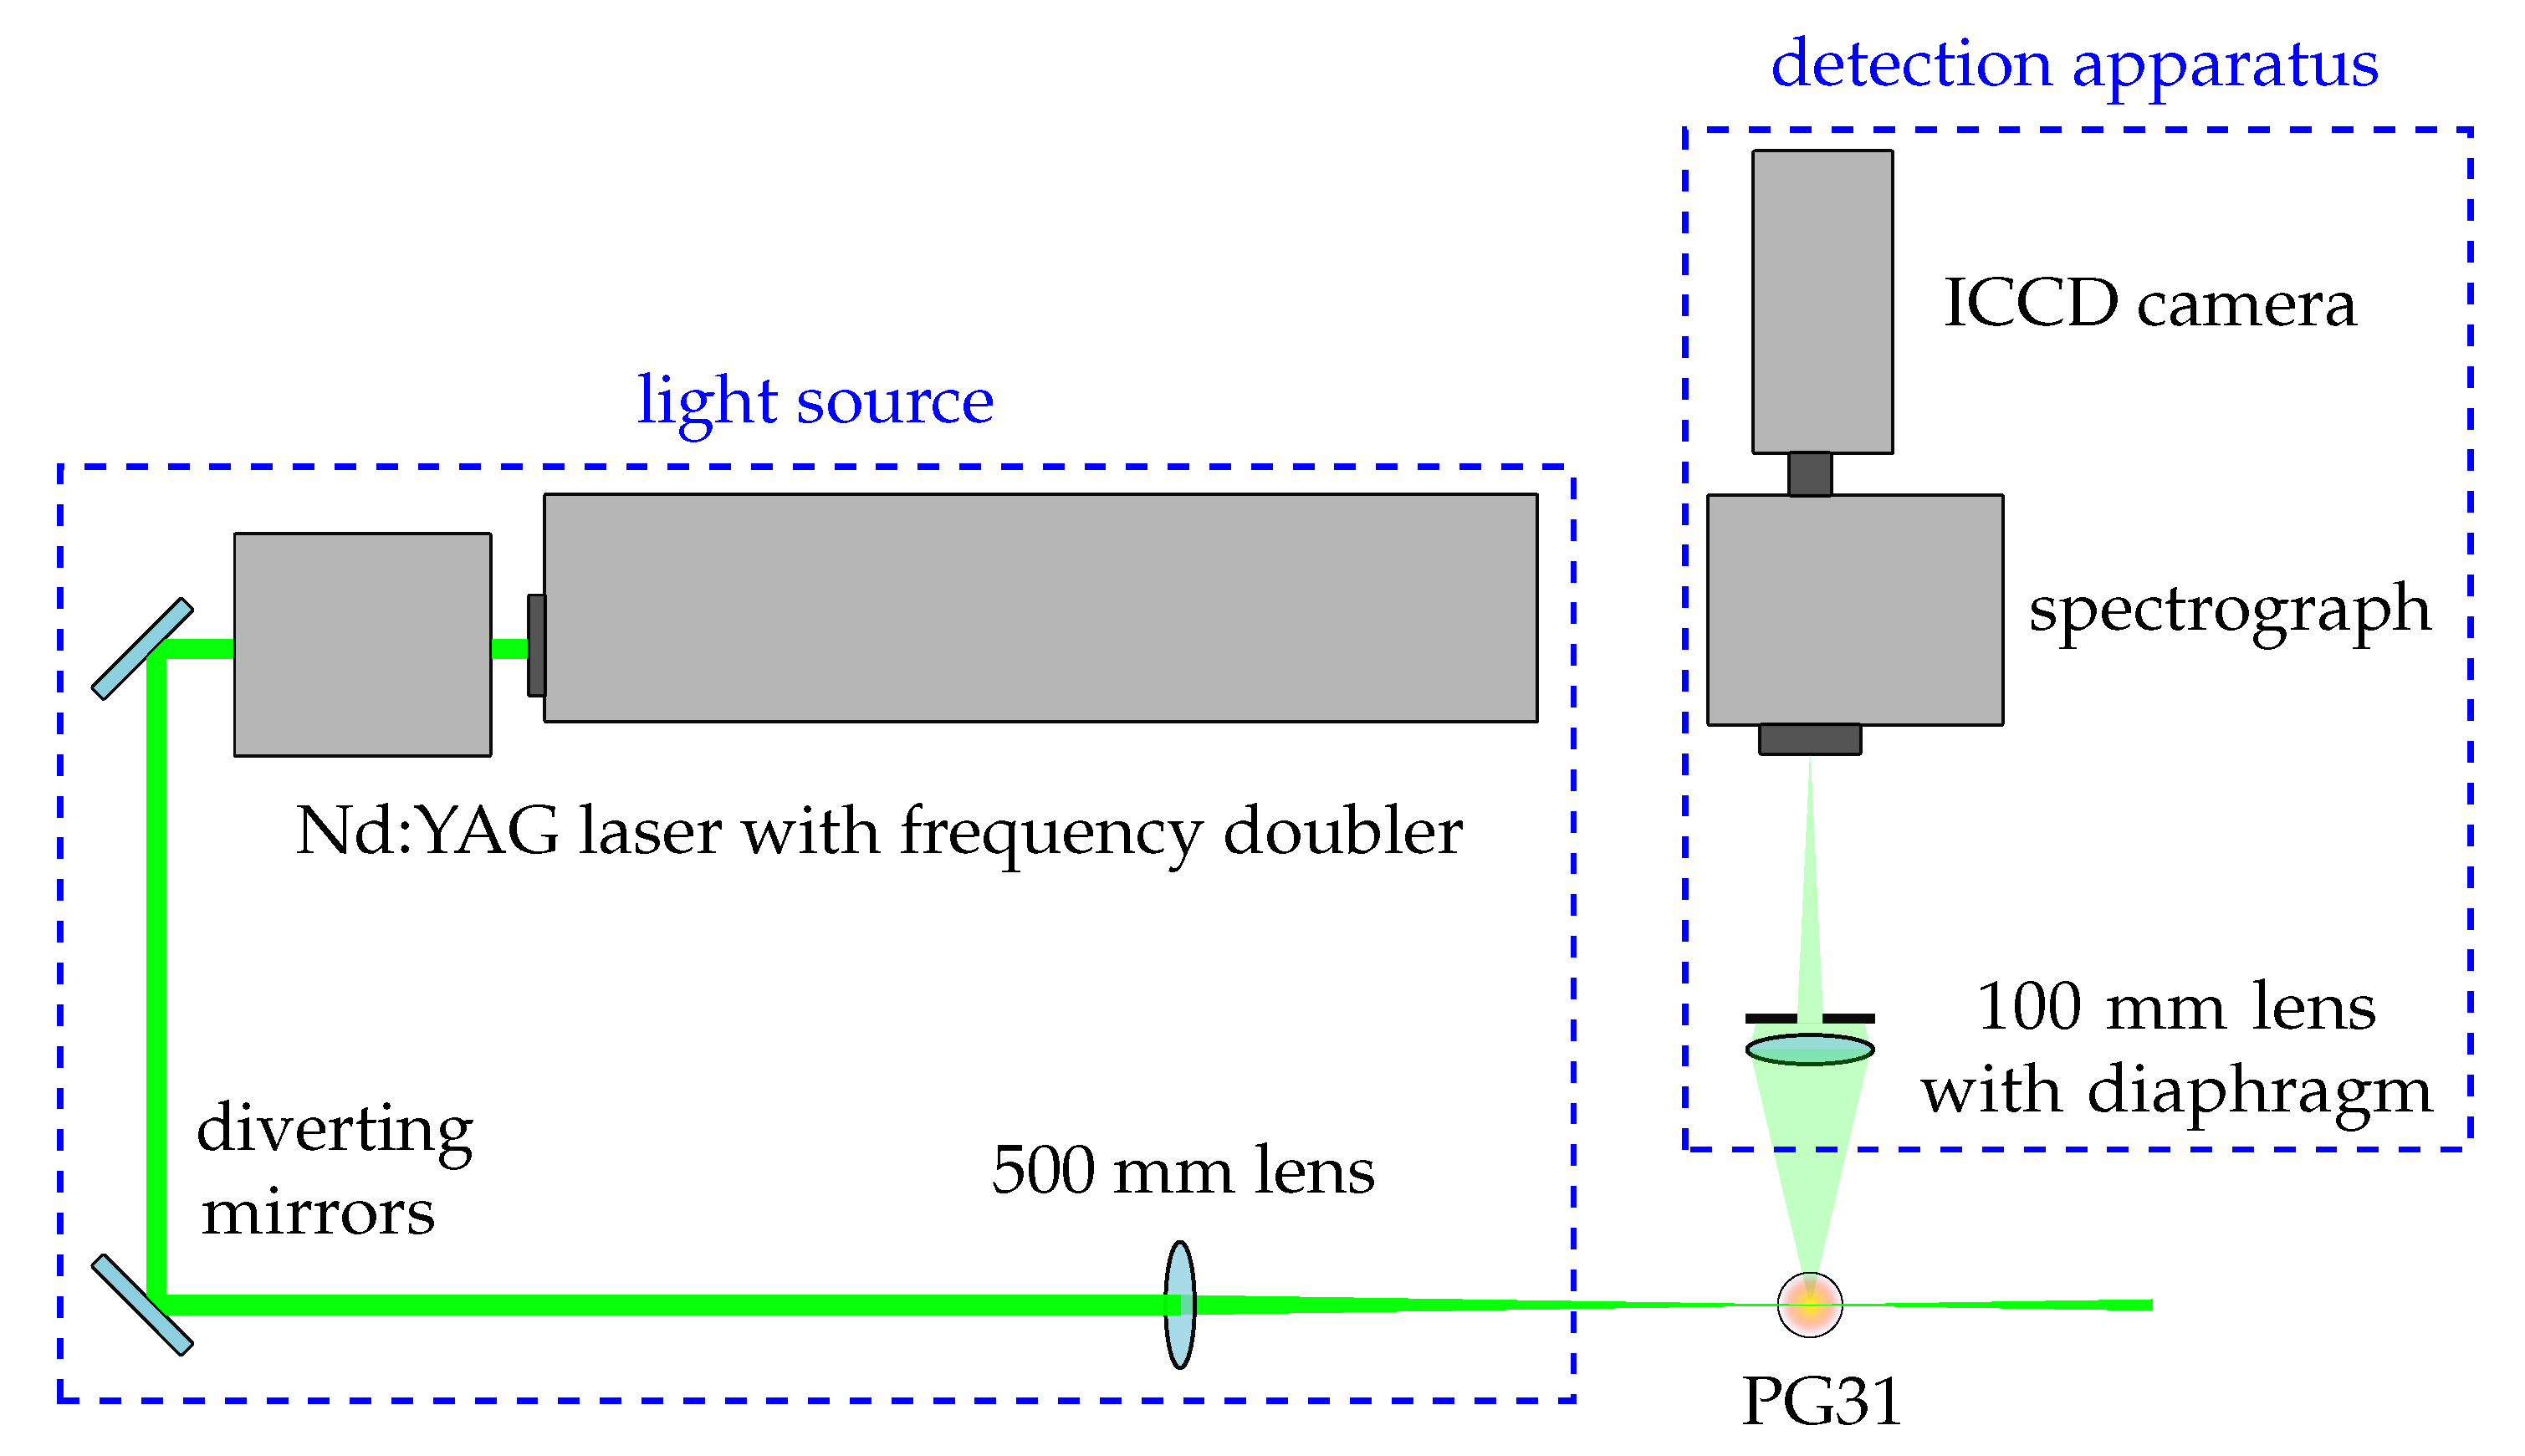
3. Experimental Setup
The implementation of the proposed method, similarly to other scattering techniques, requires the usage of a high power light source [
38]. In this work, a Nd:YAG pulse laser of type Surelite SL II-10 made by Continuum, Santa Clara, CA, USA, is used. Coupled with a frequency doubler of type SSP-2, also produced by Continuum, pulses with a central wavelength of
and a width of 4–6 ns are generated [
35]. As schematically presented in
Figure 3, the initial laser beam is diverted by
using two mirrors with a high laser damage threshold and a diameter of
and focused on the scattering volume using a planoconvex lens with a focal length of
and a diameter of
. This allows for a compact setup. To ensure the recording of the highest possible intensity of the scattered signal, the laser beam is polarized vertically and is perpendicular to the propagation direction of the scattered wave, while the scattering plane is chosen to be horizontal and also perpendicular to the beam polarization. Such “square” setups are recommended for plasmas with low electron densities [
43] and are most commonly used in experiments [
21,
26,
34]. A Fastie–Ebert spectrograph made by Garching Instrumente GmbH, Munich, Germany, with a focal length of
is chosen for the detection apparatus, coupled with an ICCD camera of type 4 Picos from Stanford Computer Optics, Berkeley, CA, USA, positioned in the image plane of the spectrometer. As shown in
Figure 3, the scattered beam is projected onto the horizontally oriented entrance slit by a planoconvex lens with a focal length of
coupled with a diaphragm to control the solid angle of the beam. The moderate focal length of the spectrograph combined with a diffraction grating of
operated in the first diffraction order yields an aperture of f/4. The image intensifier of the camera, a Gen II photo-cathode of type S20 with a single-stage microchannel plate and a P43 phosphor screen optically coupled via an internal, distortion-free f/0.8 lens to a CCD chip with a resolution of
px, offers a quantum efficiency of about
at a wavelength of
[
44]. Moreover, the ICCD camera is triggered externally so that it can be synchronized with the laser pulse and the discharge pulses. Additionally, the PG31 plasma generator is mounted on a motorized XYZ positioning unit, which simplifies adjustment and allows reproducible positioning during the experiments.
The setup depicted in
Figure 3 is operated in sampling mode, with the laser pulse and camera triggered at maximum amplitude of the current pulse. To synchronize the laser pulse frequency with the operating frequency of the power supply, a slightly modified triggering circuit from [
45] was used. The input of the pulse-delay generator DG645 from Stanford Research Systems, Sunnyvale, CA, USA, was set to block the incoming trigger edges for a period of
, thus ensuring the required laser pulse frequency of
. The gain voltage of the ICCD was set to
, resulting in a good signal-to-noise ratio without saturation of the most intense Rayleigh signal. Most of the stray light is caused by backward reflection of the laser along its direction of incidence. This can be reduced significantly by temporal discrimination if the reflection point is suitably far away from the scattering point, i.e., by selecting a sufficiently short exposure time of the detection apparatus [
21,
46,
47]. Hence, considering the laboratory conditions and the jitter due to external triggering (see
Section 3.1), an exposure time of
was set for the experiments. Both camera settings were kept constant for all following experiments. A spectral resolution of
was obtained for the detection apparatus with a neon spectral calibration lamp of type 6032 made by Oriel Instruments, Stratford, CT, USA, with the entrance slit width of the spectrograph set to 150 μm. The full width at half maximum of the instrumental profile for the above settings amounts hereby to
. Furthermore, the spatial resolution of the setup amounts to
. Taking into account the length of the focal point of the laser beam, i.e., the length of the measurement volume, the region of interest in the acquired images is expected to be
or less wide. Because the region of interest is small compared to the width of the whole image, several aberrations exhibited by the simple Fastie–Ebert design as well as the curved focal field [
48] are neglected.
Although precautions are taken to minimize stray light, it cannot be completely eliminated by temporal discrimination because the incident laser light is also scattered by objects or surfaces in direct vicinity of the measurement volume, such as the metallic surface of the nozzle tip. However, this stray light can be estimated by comparing the measured scattering intensity on nitrogen with an additional measurement of scattering on helium [
22,
26,
49]. Since the ground state of helium has one of the smallest scattering cross sections [
21,
50], an assumption is thus made under atmospheric conditions, that the detected intensity is only due to reflections from the surrounding objects. Thereafter, the measurement procedure consists of three steps. For better understanding, the average images resulting from each step are shown in
Figure 4. First, since the discharge is operated at atmospheric pressure, the stray light is evaluated by measurement of the scattered intensity on helium flowing through the generator (
Figure 4a). The discharge is switched off in this step. In the second step, a cold gas measurement is performed to obtain a calibration profile of the scattering setup (
Figure 4b). During this step, pure nitrogen flows through the generator without the plasma being ignited. Accordingly, the acquired images, at least 1500 for each measurement, contain a Rayleigh scattering signal as well as the stray light from the surfaces surrounding the measurement volume. Finally, a measurement is performed with the discharge switched on (
Figure 4c). The signal registered in this step consists of a Rayleigh scattering signal, a Thomson scattering signal and the stray light. All of the above measurements need to be pre-processed before evaluation of the plasma parameters. The invalid images, mainly due to Mie scatterers caused by dust and other particles in ambient air, are sorted out, and a mean image is calculated from the valid images. Before the evaluation, which is done pixel line by pixel line, the background intensity is subtracted from each selected pixel line of the respective average image to correct for any differences in the dark current of the ICCD camera. Thereafter, the selected pixel line of the average stray light image is subtracted from the corresponding pixel line of the other images. As a result, the pure Rayleigh scattered signal is obtained from the average cold gas image and a Thomson and Rayleigh scattered signal from the average plasma image. These two signals are subsequently used to determine the plasma properties, as theoretically described in
Section 2. A sample Thomson scattering signal extracted for a single pixel line is presented in
Figure 4d.
3.1. Test Object
A commercially available pulsed plasma system, using a comparable working principle to that of other systems on the market [
51,
52,
53,
54], is chosen to test the proposed scattering setup. The system consisting of a PG31 plasma generator and a PS2000 OEM power supply is produced by Relyon Plasma GmbH, Regensburg, Germany. Its main application fields are surface activation, decontamination or deposition of different materials [
53,
55,
56,
57,
58].
The PG31 generator has a conventional construction with a positively biased, finger-shaped non-refractory inner electrode and a copper alloy nozzle acting as cathode. Several nozzle geometries are available from the manufacturer—a conical shaped one of type A450 with an outlet diameter of
is used exclusively for the investigations. The generator is optimized for operation with molecular gases and gas flow rates between 35–60 standard liters per minute (short L/min) [
56]. Accordingly, pure nitrogen at a flow rate of 35 L/min is used in the following experiments, regulated externally by a mass flow controller of type 8626 produced by Bürkert GmbH & Co. KG, Ingelfingen, Germany. The effluent plasma jet operating at
can be seen in
Figure 5.
The discharge is driven by unipolar, triangular current pulses with variable amplitude of maximal
generated at the output of the PS2000 power supply. The power supply utilizes a single-phase full-bridge push-pull converter design with the rise and fall times of the triangular pulses fixed at 5 μs, regardless of the selected pulse frequency. The power supply can be controlled via a PC software and allows an adjustment of the output power between 70% and
, which corresponds to a current amplitude of
–
at the exit, whereas the pulse frequency can be varied between
and
in
steps. In the experiments, the power setting was set to
(i.e., current amplitude of
) and the operating frequency to
. The typical current and voltage traces for these settings are presented in
Figure 6.
4. Results
To test the proposed setup, the relevant plasma parameters of a pulsed low-current plasma jet were determined. Before the study was started, the radial position of the plasma generator was adjusted so that the incident laser beam passes exactly through the generator axis. Thereafter, the generator was positioned so that the incident laser beam passed under the nozzle outlet at a downstream axial distance
d of
, as marked in
Figure 5. A total of 8 measurements at that axial distance were made and subsequently evaluated.
The average radial distribution of the estimated parameters is presented in
Figure 7. It became apparent that for the chosen parameter set, electron parameters can be reliably estimated for a radial distance
r perpendicular to the jet axis of
. As depicted in
Figure 7, the estimated electron number density varies by about
between the jet axis and the outer fringes at radii above
, an increase of slightly more than
. It should be noted that the maximum value of
is reached about
outside the axis. Looking at the error bars, a deviation of
from the average
value is to be expected throughout the analyzed diameter. In contrast, no significant increase in the electron temperature with varying radius is observed. A mean
value of 41,000
is estimated with a similar deviation of about
. The temperature of heavy particles in turn shows a significant, Gaussian-like radial distribution with a maximum value of
lying at the jet axis and a negative gradient of ∼3000
toward larger distances from the axis. Additionally, an approximately
wide temperature plateau can be observed centered around the axis, as marked in
Figure 7. Analogous to other plasma parameters, the standard deviation of
also ranges about
, although a decrease with increasing radius can be observed. The increased standard deviation of
about the jet axis, as well as the asymmetric behavior (different error values for positive and negative
r-values), appear to be caused by a slight lateral movement of the discharge channel from one measurement to the other and are amplified by the averaging. The latter effect was also observed to some extent in the raw data for the electron parameters, in particular,
, but is much less pronounced than for
.
5. Discussion of the Results
To check the plausibility of the results shown in
Figure 7, they are compared in the following with reference values determined experimentally or by calculations for low-current discharges operated at atmospheric pressure, although some of the experimental setups in those references do not correspond to the experiment considered in this work. The most relevant references are summarized in
Table 1.
According to Reece Roth [
59], electron densities ranging between
and
and heavy particle temperatures below
can be expected for discharges driven by a constant current of less than
, which is in good agreement with the values estimated in this work. In comparison to that, the electron temperature reported in [
59] is significantly lower than that estimated in this work. It should be noted, however, that the operating frequency is quite different—the values presented in [
59] are determined for direct current (constant energy supply), while the generator studied in this work is pulsed at frequencies in the range of
. Therefore, the discrepancy may be correlated with the operating frequency of the discharge under study.
As presented by Kruger et al., a significantly higher electron temperature is required to achieve a similar electron density in pulsed operation as is the case for a discharge driven by direct current [
4]. This suggestion that the relatively high electron temperature is related to the pulsed nature of the discharge, is confirmed in further references, where pulsed discharges were studied [
60,
61,
62,
63]. Subsequently, Pai et al. determined an electron temperature of about 30,000
and an electron density value of about
for a discharge of nanosecond duration driven in air by
high voltage peaks pulsed at
[
61,
62]. For these working conditions, peak current values of
were measured, resulting in a rotational temperature of
, reached about
after a discharge took place. The heavy particle temperature was determined by fitting synthetic spectra to the SPS
-transition. Both the electron density and temperature on the other hand were estimated based on calculations of the discharge radius and collision frequency between electrons and heavy particles [
61]. Although the reported electron temperature is somewhat lower according to
Table 1, the values determined by Pai et al. concur well with the results estimated in this work.
Table 1.
Comparison of the scattering results with the most relevant reference values.
Table 1.
Comparison of the scattering results with the most relevant reference values.
| Ref. | This Work | [59] | [61,62] | [64] |
|---|
| Gas | | − | Air | |
| | DC | | DC |
| ∼1 (peak) | <50 | 30 (peak) | |
| ∼2 | <10 | | |
| 41,000 | <23,000 | 30,000 | − |
| 5900 | <5800 | 5300 | ∼6000 |
The higher
and
values observed in this work are correlated not only with the operating frequency, but probably also with the plasma gas used. Molecular gases, especially nitrogen, are capable of accumulating energy in vibrational, metastable or dissociated states over longer periods of time [
17,
18]. Reactions such as ionic recombination or metastable-induced dissociation (that can lead to the creation of secondary electrons), neutral interactions, and diffusion processes occur in nitrogen plasmas on timescales of hundreds of microseconds or even milliseconds [
1,
65,
66]. Hence, the high temperature and concentration of excited species within the discharge channel cannot be cleared fast enough by the gas flow when operating at sufficiently high pulse repetition rates [
67], where the recombination time scale and the inverse of the pulse frequency are similar to each other. At a pulse frequency in the range of
, the time period (∼20 μs) between successive energy pulses lies in the same order of magnitude as the recombination time of nitrogen species and therefore an appreciable deviation of electron parameters from the steady state achieved under direct current is to be expected.
Almost identical electron density as well as heavy particle temperature values compared to those estimated in this work, were reported in recent investigations of gliding arcs constricted by tubes, referred to as gliding arc plasmatron by Gröger et al. [
64] or tornado discharge by researchers collaborating with Gutsol and Fridman [
68]. A gliding arc is, in its simplest form, a discharge ignited in a transversal gas flow between two divergent electrodes. Due to the movement of the discharge along the electrodes caused by the gas flow, such discharge is often referred to as self-pulsating, even though it is driven with a direct current [
69,
70,
71]. As presented in
Table 1, Gröger et al. operated the plasmatron with nitrogen at a constant current of
[
64]. The rotational and vibrational temperatures of about
were estimated by synthetic spectra fitting after measuring of the SPS
- and FNS
-transitions of molecular nitrogen. Similar to [
61,
62], the authors also determined the reduced electric field based on spectroscopic measurements and used it to calculate the electron density with a collisional–radiative model of the discharge. The resulting
was estimated to be
[
64]. This value may be higher than reported by others for gliding arcs [
69,
70,
71], but according to the observations of Machala et al. [
72], the increase in electron density is most probably caused by the constriction of the discharge. Both
and
values given in [
64] are in good agreement with the ones determined in this work. Gröger et al. did not state any
values.
The plateau width of
observed in the radial distribution of
in
Figure 7 is considered to be the core diameter of the discharge channel. This assumption appears to be correct when the diameter is compared with other works. Pai et al. estimated a diameter of about
for the nanosecond pulsed discharge discussed above [
61]. This compares to the core diameter estimated by Gröger et al. of about
[
64]. According to radial temperature profiles given by Lebouvier et al., who modeled a low-current high-voltage DC plasma jet operated with a constant current in the range of
and an air flow rate of 25 L/min in [
73], the diameter of the discharge channel at the nozzle outlet is about
.
Apart from the references summarized in
Table 1, several research groups analyzed plasma systems comparable to the one studied here [
51,
53,
74,
75,
76,
77], though only few have determined the temperature of the effluent plasma jet using emission spectroscopy. Kubota et al. spectroscopically analyzed a comparable plasma system operated at a pulse frequency of
, with nitrogen flowing at 30 L/min [
74]. Based on the second positive
-transition, the rotational temperature was estimated to be about
inside the plasma generator and between
and
at nozzle exit. For the same plasma system, also pulsed at
but working with a compressed air gas flow rate of 76.6 L/min, Dowling et al. estimated a rotational temperature of about
at nozzle exit using the
-transition spectra of the second positive system of molecular nitrogen [
51]. If in a first approximation for this result a linear relationship between gas flow and temperature would be assumed, than a rotational temperature of approx.
at an air flow rate of 30 L/min could be expected. Both results agree well with the
values estimated in this work under the assumption that
.


