Article

Complex Band Structure of 2D Piezoelectric Local Resonant Phononic Crystal with Finite Out-Of Plane Extension

1
Mechanical and Electrical Engineering College, Hainan University, Haikou 570228, China
2
State Key Laboratory of Structural Analysis for Industrial Equipment, School of Naval Architecture, Faculty of Vehicle Engineering and Mechanics, Dalian University of Technology, Dalian 116024, China
*
Author to whom correspondence should be addressed.
Appl. Sci. 2022, 12(14), 7021; https://doi.org/10.3390/app12147021
Submission received: 15 June 2022 / Revised: 9 July 2022 / Accepted: 10 July 2022 / Published: 12 July 2022
(This article belongs to the Section Acoustics and Vibrations)

Abstract

:
In this study, a new type of 2D piezoelectric phononic crystal with a square hollow and convex structures is designed and established. A theoretical study of the piezoelectric phononic crystal is presented in this article to investigate the transmission properties of waves in terms of complex dispersion relations. Based on the finite discretization technique and plane wave expansion, the formula derivation of the real band structure is achieved as well as the complex band diagrams are obtained. The numerical results are presented to demonstrate the multiple broadband complete bandgaps produced by the designed piezoelectric phononic crystal and the propagation characteristics of the elastic waves for different directions. In addition, the transmission loss in the ΓX direction is calculated to verify the band structure. Finally, the effects of the thickness and the square hollow side length on the band structure are discussed.

1. Introduction

As a new type of artificial material, phononic crystal (PnC) possesses many properties that natural materials do not have, such as negative refraction property [1,2], defect state property [3,4,5,6], acoustic focusing property [7,8,9], and bandgap property [10,11,12,13]. The passband is the frequency range in which elastic waves can propagate, while the frequency range of elastic waves that cannot propagate through the phononic crystal is termed “stopband”. In addition, the passband and the stopband also represent the frequency range that allows and suppresses the vibration of the structure and the propagation of acoustic energy. Thus, this characteristic is known as the bandgap property [14,15]. As one of the unique properties of the phononic crystals, there are two main mechanisms for the formation of the bandgaps, which are the Bragg scattering mechanism [16,17] and the local resonance mechanism [18]. The periodicity of the structure is the major reason for the generation of the Bragg bandgaps, while the formation of the local resonance bandgaps is due to the resonance properties of a single scatter and the interaction of long-wave traveling waves in the substrate. For Bragg-type phononic crystals, to suppress elastic waves with longer wavelength, larger phononic crystals are required. This drawback not only limits the further development of phononic crystals but also produces considerable uncertainty in their practical application. The development of locally resonant phononic crystals resolves the limitation in Bragg phononic crystals due to the difference in the formation mechanism of the bandgaps, and the local resonance phononic crystals have a peculiar property of “the small size controlling the large wavelength” [18], which has attracted extensive attention from scientists.
Due to the importance of controlling wave transmission in phononic crystals, various methods are developed to satisfy different requirements in adjusting wave bandgaps. On the one hand, the tuning of the band structure of phononic crystals can be achieved based on their tunable geometry and material properties [19,20,21]. On the other hand, adding piezoelectric material to traditional phononic crystals is also an efficient way to obtain desirable bandgaps [22,23,24]. Piezoelectric materials have been widely used in piezoelectric transducers, microphones, and pressure sensors. The largest difference between piezoelectric materials and other materials is their positive piezoelectric effect and inverse piezoelectric effect, which can achieve the mutual conversion of electrical energy and mechanical energy.
Applying piezoelectric materials to phononic crystals allows the bandgaps to be adjusted without changing the intrinsic structure of the crystals [25,26,27]. A novel strategy was proposed by Ren et al. [28] to investigate the vibration bandgap and active tuning characteristics of laminated composite metamaterial beams. Liu et al. [29] studied the damping of resonators and derived the vibration transmissibility method (TM) for a finite electromechanical system based on the Timoshenko beam theory. To actively control the band structure in a system, Zhou et al. [30] periodically arranged piezoelectric shunt arrays on designed active beam resonators. Espo et al. [31] applied piezoelectric materials (PZT-5H) and an epoxy-resin periodic array to study the effects of different parameters on the bandgap widths and initial frequencies of a nano-beam. Considering the synchronous switch damping technology, Qureshi et al. [32] developed structural vibration control by using piezoelectric materials. Bacigalupo et al. [33] proposed a tunable period metamaterial coupled with local resonators and changed the values of the resistance and inductance to adjust the constitutive properties of piezoelectric materials.
Although researchers have broadened the application scenario and scope by incorporating piezoelectric materials into traditional phononic crystals, most studies are restricted to one-dimensional and planar two-dimensional phononic crystals. Therefore, in this study, a two-dimensional piezoelectric phononic crystal with thickness and a square hollow as well as convex structures is investigated and analyzed to obtain the wave transmission properties in terms of the dispersion relationships for the propagating and complex band structure. Moreover, the adjustable shape and geometrical parameters of the square hollow and convex structures in the piezoelectric phononic crystal can provide more possibilities for the generation of wide bandgaps and extend tunable space.
The layout of the article is as follows. After the introduction, a description of the schematic diagram of a 2D piezoelectric phononic crystal with thickness is given and the numerical formulations for carrying out the complex band diagram are derived. Section 3 presents numerical results, after which the effects of series and parallel circuits on the transmission loss of a finite-length piezoelectric phononic crystal are taken into account. The tunability of the band structure is illustrated through a parametric study, which is discussed in Section 4. Lastly, Section 5 outlines the conclusions.

2. Materials and Methods

2.1. Model Descriptions

The configuration of the proposed piezoelectric phononic crystal is shown in Figure 1a,b. Figure 1c is the schematic diagram of the first Brillouin Zone and the Irreducible Brillouin Zone (IBZ).
In Figure 1a, b2 is the length of the convex structures and the width is denoted as b1. x1 and x2 represent the side lengths of the square hollow and the internal hard material, respectively. The side length of the piezoelectric material is x3, and x4 represents the side length of the external hard material. The thickness of the piezoelectric phononic crystal is h in Figure 1b. The gray portion of the piezoelectric phononic crystal configuration is epoxy, the brown and blue parts represent iron and the piezoelectric material lead zirconate titanate (PZT-5H), respectively.
The piezoelectric phononic crystal has periodicity in the x-y plane. Thus, the band structure can be acquired by calculating the unit cell. As shown in Figure 1c, the area in the dotted box represents the first Brillouin Zone of the piezoelectric phononic crystal, while the blue portion is the IBZ. To draw the band structure, the wave vector k must be swept along the boundary of IBZ from point Γ(0, 0) to point X(π/l, 0) to point M(π/l, π/l) and go back to the point Γ(0, 0). The lattice constant of the piezoelectric phononic crystal is l = 2 b 1 + x 4 .

2.2. Analytical Approach

2.2.1. Constitutive Equations

As mentioned above, piezoelectric materials are favored by scientists due to their positive piezoelectric effect and inverse piezoelectric effect, which can be described by their constitutive equations [34]. Strain charge type and stress charge type are the two main forms of constitutive equations for piezoelectric materials. The constitutive equation used in this study is stress charge type. When the strain tensor Sj and the electric field intensity tensor En are taken as independent variables, the stress tensor Ti and the electric displacement tensor Dm are taken as dependent variables. Hence, the stress charge type piezoelectric constitutive equation can be given by:
T i = c i j E S j e i n E n D m = e m j S j + ε m n S E n
In which i and j represent 1, 2, 3, 4, 5, and 6, and m and n represent 1, 2, 3, and 4. c i j E is the elastic coefficient in a constant electric field and ε m n S is the dielectric constant under constant strain. e i n and e m j is the piezoelectric strain constant.

2.2.2. Band Structure Solution

To calculate the band structure of the piezoelectric phononic crystal with arbitrary cavities, it is necessary to discretize by using the finite element method. For the displacement of any point in the element [35]:
u = [ u x u y u z ] = N u u e ,
where Nu is the shape function matrix of the displacement. According to general knowledge of elasticity, the strain at any point in the unit can be defined by:
S = [ u x x u y y u z z u x y + u y x u x z + u z x u y z + u z y ] = [ x 0 0 0 y 0 0 0 z y x 0 z 0 x 0 z y ] [ u x u y u z ] = [ x 0 0 0 y 0 0 0 z y x 0 z 0 x 0 z y ] N u u e = B u u e ,
in the expression:
B u = [ x 0 0 0 y 0 0 0 z y x 0 z 0 x 0 z y ] N u .
For a piezoelectric material, there is a potential degree of freedom in addition to the three degrees of displacement at each node. It is assumed that the potential degree of freedom vector is:
φ e = [ φ 1 φ 2 φ 3 φ n φ 20 ] T .
In Equation (5), φn is the potential freedom of the nth node, so the potential at any point in the unit can be expressed as:
φ = N φ φ e ,
where Nφ is the shape function of the potential. It is understood from general knowledge of electrostatics that the expression of the electric field at any point in the unit can be written as:
E = [ E x E y E z ] = [ φ x φ y φ z ] = [ x y z ] N φ φ e = B φ φ e .
In Equation (7), there is:
B φ = [ x y z ] N φ ,
therefore, the kinetic energy of the unit can be represented by:
T e = V 1 1 2 ρ 1 u ˙ T u ˙ d V + V 2 1 2 ρ 2 u ˙ T u ˙ d V ,
where ρ 1 and ρ 2 represent the densities of non-piezoelectric and piezoelectric materials, while V1 and V2 represent the volumes of non-piezoelectric and piezoelectric materials.
The potential energy of the unit can be written as:
U e = V 1 1 2 S T T d V + V 2 1 2 S T T d V V 2 1 2 E D d V .
According to Hamilton’s principle, it can be seen that:
δ ( T e U e ) d t = 0 ,
then Equations (9) and (10) are brought into Equation (11) for variational calculations. Thus, the finite element equation of motion of the unit can be acquired:
M u u e u ¨ e + K u u e u e + K u φ e φ e = 0 ,
K φ u e u e + K φ φ e φ e = 0 .
In the above formula, M u u e and K u u e represent the mass matrix and the elastic stiffness matrix of the unit, respectively. K u φ e and K φ u e are the piezoelectric-elastic coupling stiffness matrices, and they are transposed to each other. The expression of each unit matrix is:
M u u e = V N u T ρ N u d V ,
K u u e = V B u T c B u d V ,
K u φ e = V B u T e B φ d V ,
K φ φ e = V B φ T ε B φ d V ,
where c is the elasticity coefficient matrix of the unit, e is the piezoelectric strain constant matrix, and ε is the dielectric constant matrix. By assembling the matrix using the number of each unit, the finite element equation of the piezoelectric phononic crystal can be obtained:
M u u u ¨ + K u u u + K u φ φ = 0 ,
K φ u u + K φ φ φ = 0 ,
where u is the nodal displacement vector of the finite element discrete system and φ represents the nodal potential vector. Muu and Kuu are the mass matrix and the elastic stiffness matrix of the finite discrete system. K and Kφu are the elastic coupling stiffness matrixes of the piezoelectric material as well as Kφφ is the electrical stiffness matrix of the piezoelectric material.
For the convenience of description, the proposed piezoelectric phononic crystal unit cell is simplified as a square lattice, as shown in Figure 2.
The Bloch Floquet conditions are applied on the boundary of the square lattice, which are l1, l2, l3, and l4. In addition, c1~c4 represent the four vertices of the square lattice.
Thus, Equations (18) and (19) could be rewritten as:
T u H M u u T u u ¯ ¨ + T u H K u u T u u ¯ + T u H Κ u φ T φ φ ¯ = 0 ,
T φ H K φ u T u u ¯ + T φ H K φ φ T φ φ ¯ = 0 ,
where
T u H M u u T u = M ¯ u u T u H K u u T u = K ¯ u u T u H K u φ Τ φ = K ¯ u φ . T φ H K φ u T u = K ¯ φ u T φ H K φ φ T φ = K ¯ φ φ
In Equation (22), T u H , T u , T φ H , and T φ represent Bloch Floque periodicity. By substituting Equation (22) to Equations (20) and (21), so Equations (20) and (21) can be reformulated:
M ¯ u u u ¯ ¨ + K ¯ u u u ¯ + K ¯ u φ φ ¯ = 0 ,
K ¯ φ u u ¯ + K ¯ φ φ φ ¯ = 0 ,
thus, Equation (24) can be expressed in the following form:
φ ¯ = K ¯ φ φ 1 K ¯ φ u u ¯ .
Combining Equation (23) and Equation (25) yields:
M ¯ u u u ¯ ¨ + Θ u ¯ = 0 ,
where
Θ = ( K ¯ u u K ¯ u φ K ¯ φ φ 1 K ¯ φ u ) .
Equation (26) represents a linear eigenvalue problem. By solving the equation, the real band structure of the proposed piezoelectric phononic crystal can be drawn.

2.2.3. Complex Wavenumber Derivation

Generally, we use the smallest non-zero imaginary wavenumber to evaluate the attenuation. The smallest imaginary part of the wavenumber is defined as the attenuation constant. Therefore, to predict the attenuation performance inside the stopband, the numerical formulations in the form of k(ω) need to be derived.
It is acknowledged that the electrical induction equation and the elastodynamic equation of the piezoelectric material can be described with the following [36]:
ρ 2 u i t 2 = T i j x j , D j x j = 0 ,
where ρ is the mass density and the stress charge type constitutive equation is reformulated:
T i j = C i j k l u l x k + e k i j φ x k D j = e j k l u l x k ε j k φ x k .
In Equation (29), ( i , j , k , l ) { 1 ; 2 ; 3 } are indexes for the three directions in space, x1 = x, x2 = y, x3 = z. For a harmonic solution, ux, uy, uz, and φ are:
u x = U x ( x , y , z ) e i ( k x x + k y y ω t ) u y = U y ( x , y , z ) e i ( k x x + k y y ω t ) u z = U z ( x , y , z ) e i ( k x x + k y y ω t ) φ = Φ ( x , y , z ) e i ( k x x + k y y ω t ) ,
where k and ω are the wave vector and the angular frequency, respectively. Due to the Bloch Floquet conditions:
U x ( x + l , y + l ) = U x ( x , y ) U y ( x + l , y + l ) = U y ( x , y ) U z ( x + l , y + l ) = U z ( x , y ) Φ ( x + l , y + l ) = Φ ( x , y ) .
The PDE module of the software Comsol Multiphysics is employed to establish the following polynomial equation, and the angular frequency ω is given to resolve the eigenvalue of the equation:
Λ 2 e a U + · ( C U α U ) + β · U + A U = 0 U = [ U x , U y , U z , Φ ] T = [ x , y , z ] ,
where the matrices A, C, ea, β, and α can be found in Appendix A. Furthermore, λ and shear modulus μ are defined as follows:
μ = E m 2 ( 1 + υ ) ,
λ = υ E m ( 1 + υ ) ( 1 2 υ ) .
In Equations (33) and (34), Em is Young’s modulus and υ is the Poisson’s ratio of the material.

2.3. Material and Geometric Parameters

The material and geometric parameters of the established piezoelectric phononic crystal are listed in Table 1 and Table 2, respectively. It should be noted that viscoelasticity is not included in the selected material properties as damping effects are not the main consideration in this paper.

3. Results and Discussion

3.1. Band Structure Analysis

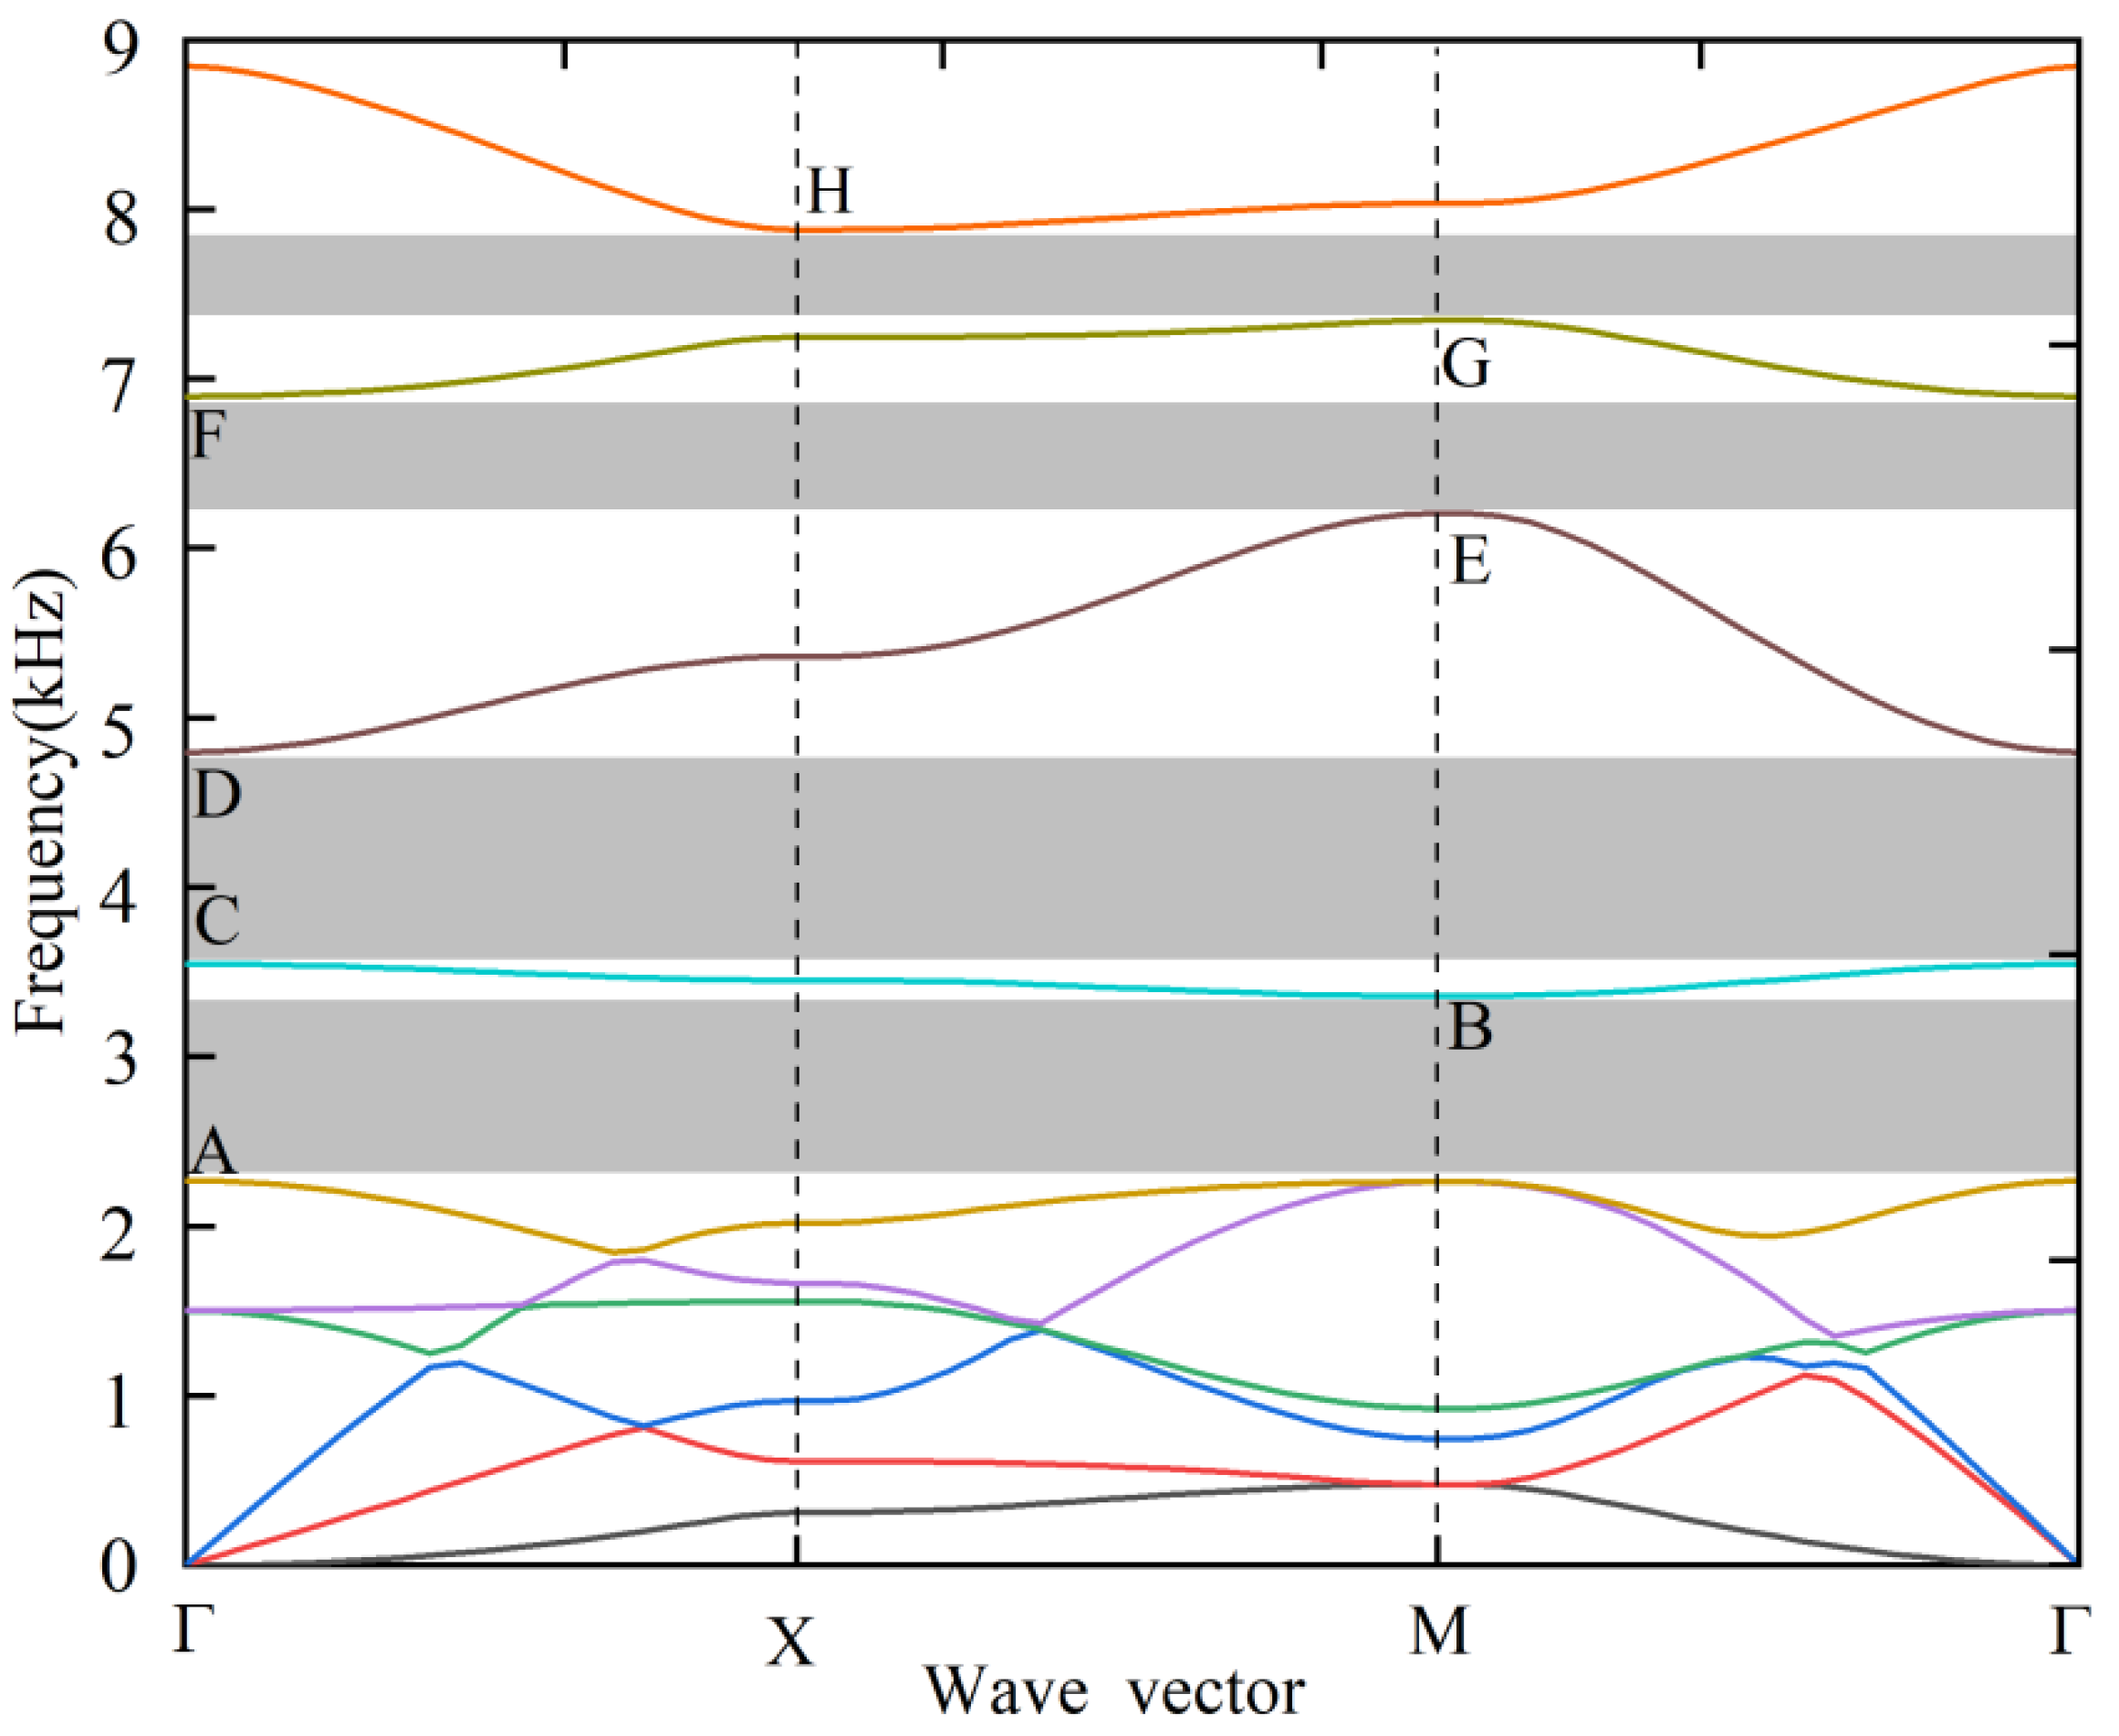
The band structure is shown in Figure 3. One can see that the proposed piezoelectric phononic crystal produces multiple broadband complete bandgaps.
The first bandgap is between the 6th band and the 7th band, whose range starts from 2268.89 Hz to 3356.36 Hz, and the width is 1087.47 Hz. Subsequently, the second bandgap with a width of 1247.74 Hz is created between the 7th and 8th bands, and its frequency range varies from 3547.67Hz to 4795.41 Hz. The widths of the third bandgap and the fourth bandgap are 690.33 Hz and 532.34 Hz, and these bandgaps are located between the 8th and 9th bands as well as between the 9th and 10th bands. Among the four bandgaps, the second bandgap is the widest, with a width of 1247.74 Hz, while the fourth bandgap is the narrowest, with a width of 532.34 Hz, which is only half the width of the second bandgap.
To understand the formation mechanism of the bandgaps, the vibration modes of the upper and lower boundaries of the bandgaps are explored. In Figure 3, the upper and lower boundaries of the bandgaps are marked with the letters A~H, and their frequencies are 2268.89 Hz, 3356.36 Hz, 3547.67 Hz, 4795.41 Hz, 6204.55 Hz, 6894.88 Hz, 7345.23 Hz, and 7877.57 Hz, respectively. The corresponding modes are displayed in Figure 4 and Figure 5.
The vibrations of the upper and lower boundaries of the first bandgap are mainly concentrated in the four corners of the cube. To be specific, for the lower boundary, the vibration is confined to the x-y plane, while the upper boundary vibrates up and down along the z-axis. The adjacent corners move in anti-phase along the z-axis, whereas the opposite corners vibrate in phase along the z-axis.
For the second bandgap, its lower boundary mode is similar to the upper boundary mode of the first bandgap. As shown in Figure 4d, the vibration of the upper boundary mainly occurs at convex structures and the adjacent convex structures are in anti-phase along the z-axis.
The modes of the third and fourth bandgap edges are presented in Figure 5. As indicated in Figure 5a, the connecting parts between the cube and the convex structures are the area where the vibration is most concentrated, resulting in obvious vibration deformation. The vibration of point Figure 5b is also concentrated at the four convex structures and they are all in phase along the z-axis.
The lower boundary vibration of the fourth bandgap appears at the square hollow and the four corners. As can be seen from Figure 5d, two convex structures in the x-axis direction vibrate up and down.
Figure 6 shows the iso-frequency curves that can illustrate the directionality of wave propagation in the piezoelectric phononic crystal. In the center of the figure, squares with lower frequencies have lower degrees of anisotropy. However, as the frequency of the iso-frequency curves gradually increases, their anisotropy becomes more obvious. Moreover, these squares show significant inconsistencies at the four corners and four edges, which means that the propagation of elastic waves in the piezoelectric phononic crystal is anisotropic. In addition, it is worth noting that the flow direction of the wave energy is the vector direction perpendicular to the contour line at each point [37].

3.2. Complex Band Structure

There are usually two forms of solutions used to obtain the band structure of phononic crystals: ω(k) and k(ω). In the form of ω(k), the wave vector k is known and the angular frequency ω is derived by solving the eigenvalues of the established characteristic equation. The drawback of the ω(k) form is that the wave vector k can only be a real number, so this form cannot accurately describe all the characteristics of the band structure of phononic crystals [38].
However, the k(ω) form does not have the above shortcoming, and the band structure of phononic crystals can also be determined by obtaining the wave vector k with a given angular frequency ω. Additionally, the dispersion relationship of the complex wave vector can be derived with the k(ω) form to analyze the attenuation characteristics of elastic waves in phononic crystals [39,40].
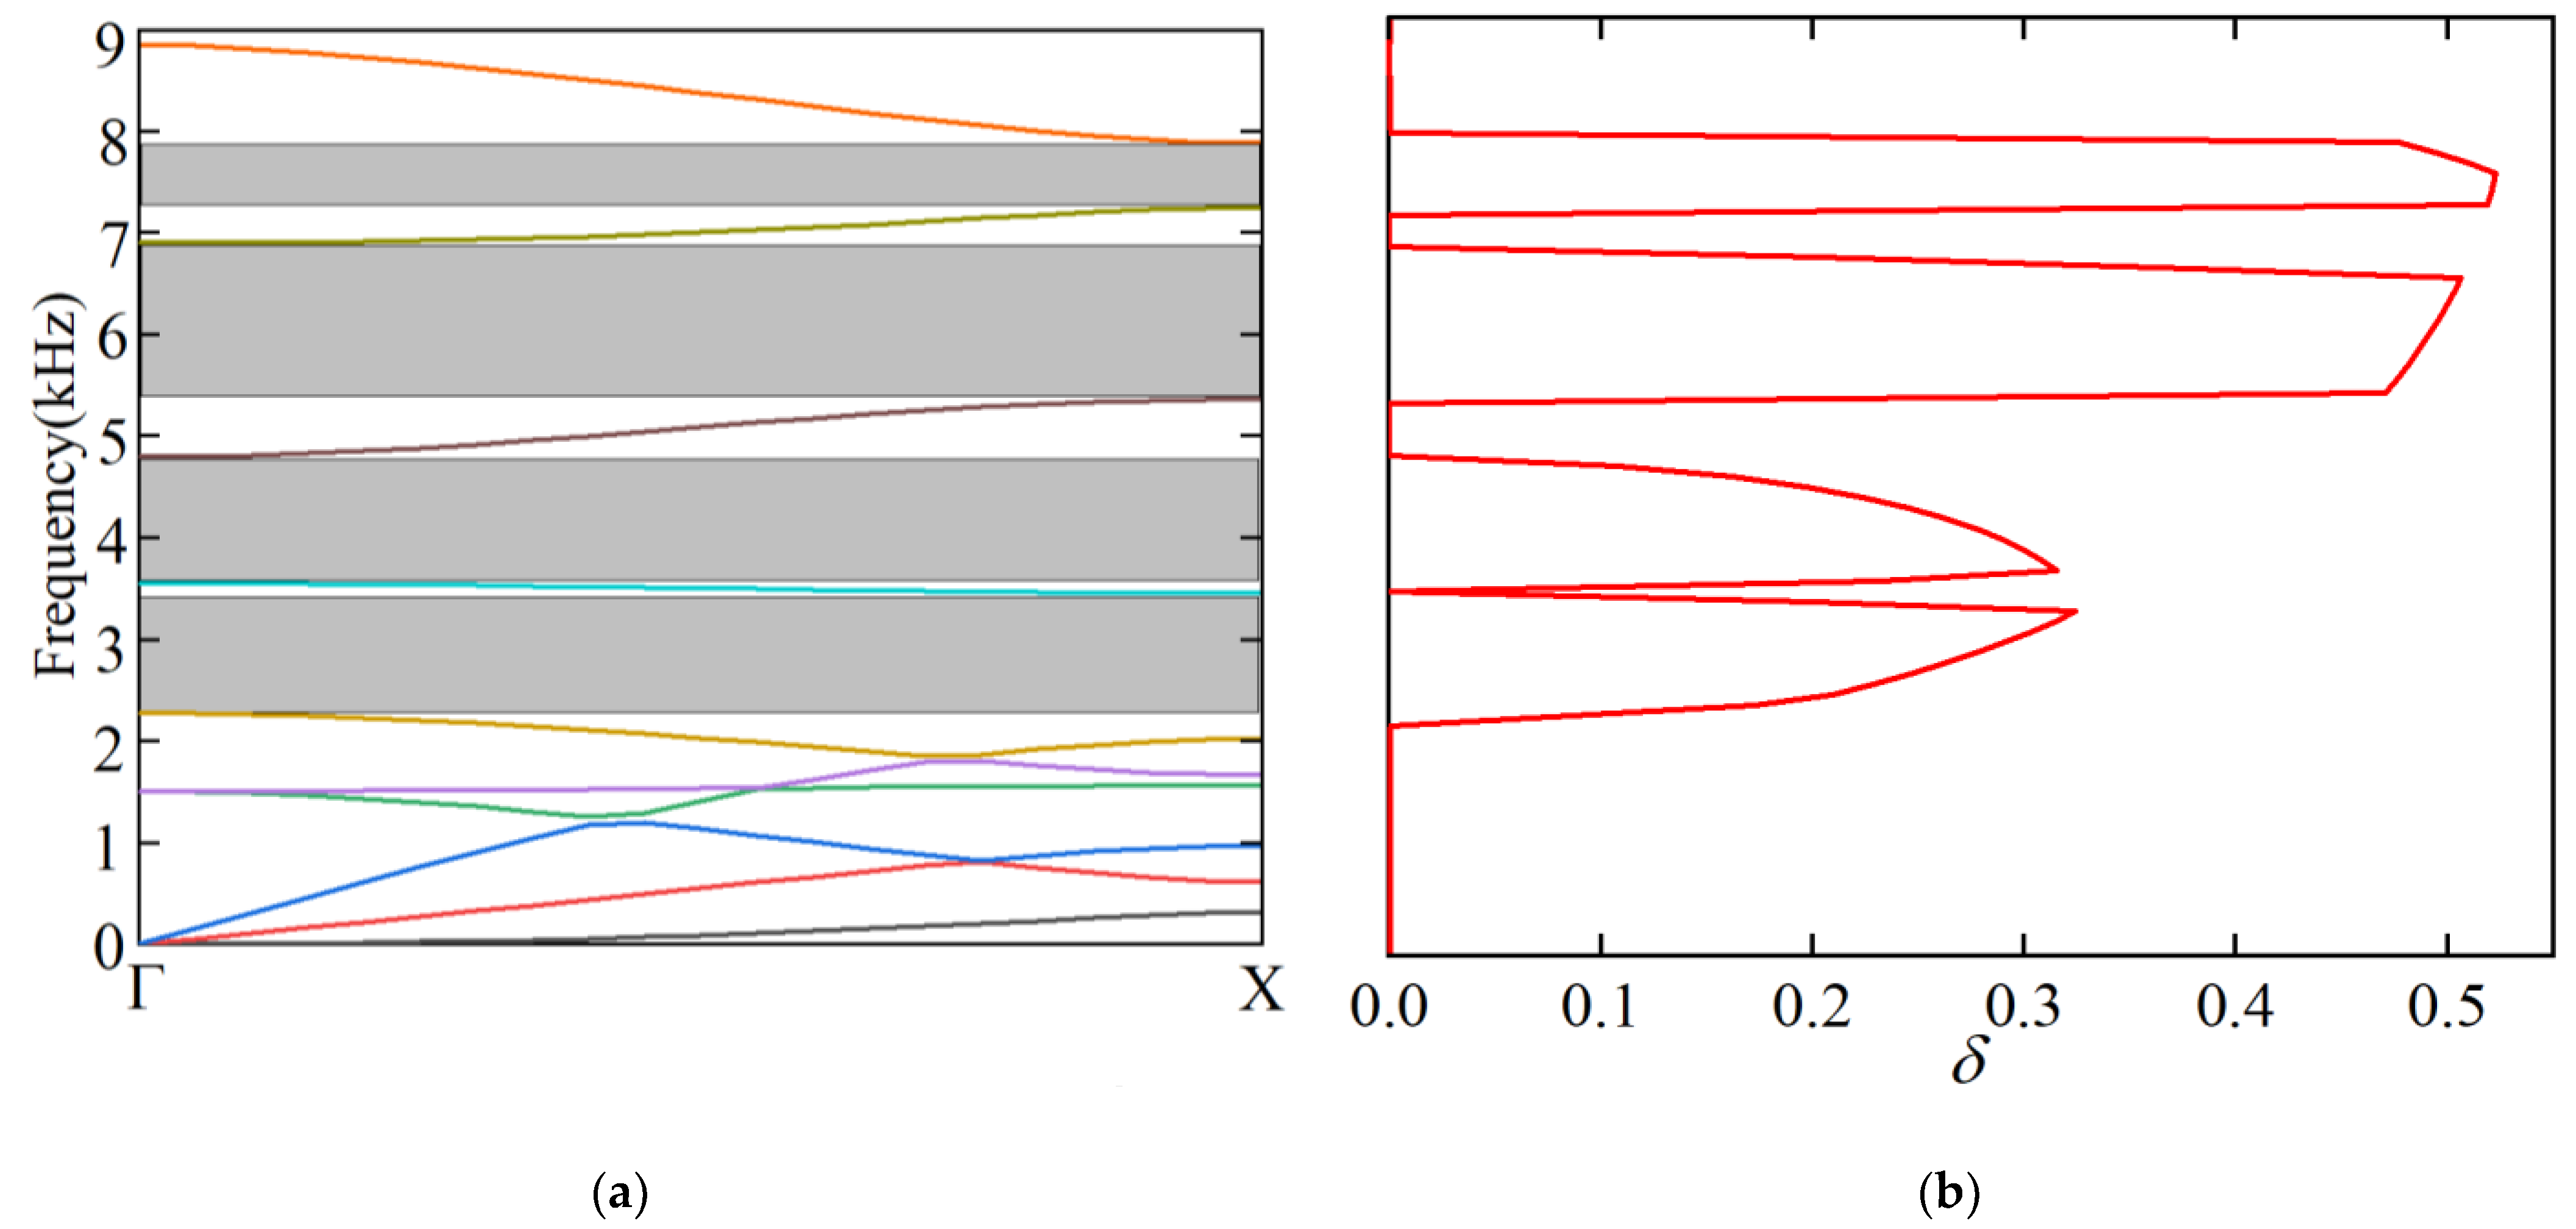
The wave vector dispersion relationship of the piezoelectric phononic crystal in the ΓX direction is shown in Figure 7. In the figure, the ordinate is the frequency, the abscissa ΓX in Figure 7a represents the wave vector, and δ in Figure 7b is described by the following equation:
δ = ( min ( | Im ( k x l ) | ) ) / ( 2 π ) .
From the comparison between Figure 7a,b, one can observe that the range of the four broad bandgaps in Figure 7a coincides perfectly with the amplitude attenuation interval in Figure 7b. In addition, compared with Figure 7a, the calculated results of the complex wave vector dispersion relation in Figure 7b can also reflect the attenuation intensities of the elastic waves in the bandgaps.
The attenuation levels of the elastic waves in the first bandgap and the second bandgap are basically the same. Furthermore, both their attenuation peaks appear near the 7th band. The third bandgap and the fourth bandgap both exhibit a strong inhibition effect on the propagation of the elastic waves in the piezoelectric phononic crystal. In the ΓX direction, the fourth bandgap has the largest attenuation capacity for the elastic waves, while the lowest attenuation intensity occurs at the second bandgap.
To investigate the effects of series and parallel circuits on the ΓX direction bandgaps of the designed piezoelectric phononic crystal, a finite length piezoelectric phononic crystal is established. It should be noted that the external circuit is coupled to the phononic crystal via the piezoelectric material PZT-5H, which is polarized along the z-axis.
The established 4 × 8 piezoelectric phononic crystal and employed external circuit are illustrated in Figure 8. In Figure 8a, with the displacement as the variable, a unit force in the negative direction along the z-axis is applied as the excitation, which is indicated by the green arrow on the left while the displacement picking point is represented by the red arrow on the right. The reason why the pick point is not selected at the boundary of the piezoelectric phononic crystal is mainly to avoid the influence of the finite boundary on the accuracy of the displacement measurement. Moreover, a periodic boundary condition is adopted in the y-direction of the finite length piezoelectric phononic crystal to observe the wave transmission loss from ΓX direction.
For the employed external circuit in Figure 8b, a resistor, inductor and capacitor are related in series to form a series circuit, and the left end of the resistor is coupled to the piezoelectric material while the right end of the capacitor is connected to ground. Similarly, the resistor, inductor, and capacitor are organized in parallel to constitute a parallel circuit, and one end of the parallel circuit is coupled to the piezoelectric material as the other end is connected to ground. It is worth noting that the circuits are applied on each unit cell, respectively. In addition, the value of the adopted resistor, inductor, and capacitor is 10 Ω, 1 H, and 1 C, respectively.
The transfer loss calculation formula is as follows:
T L = 20 × log 10 ( x o u t x i n ) ,
where xin and xout represent the displacement of the phononic crystal at the excitation point and the displacement at the picking point, respectively.
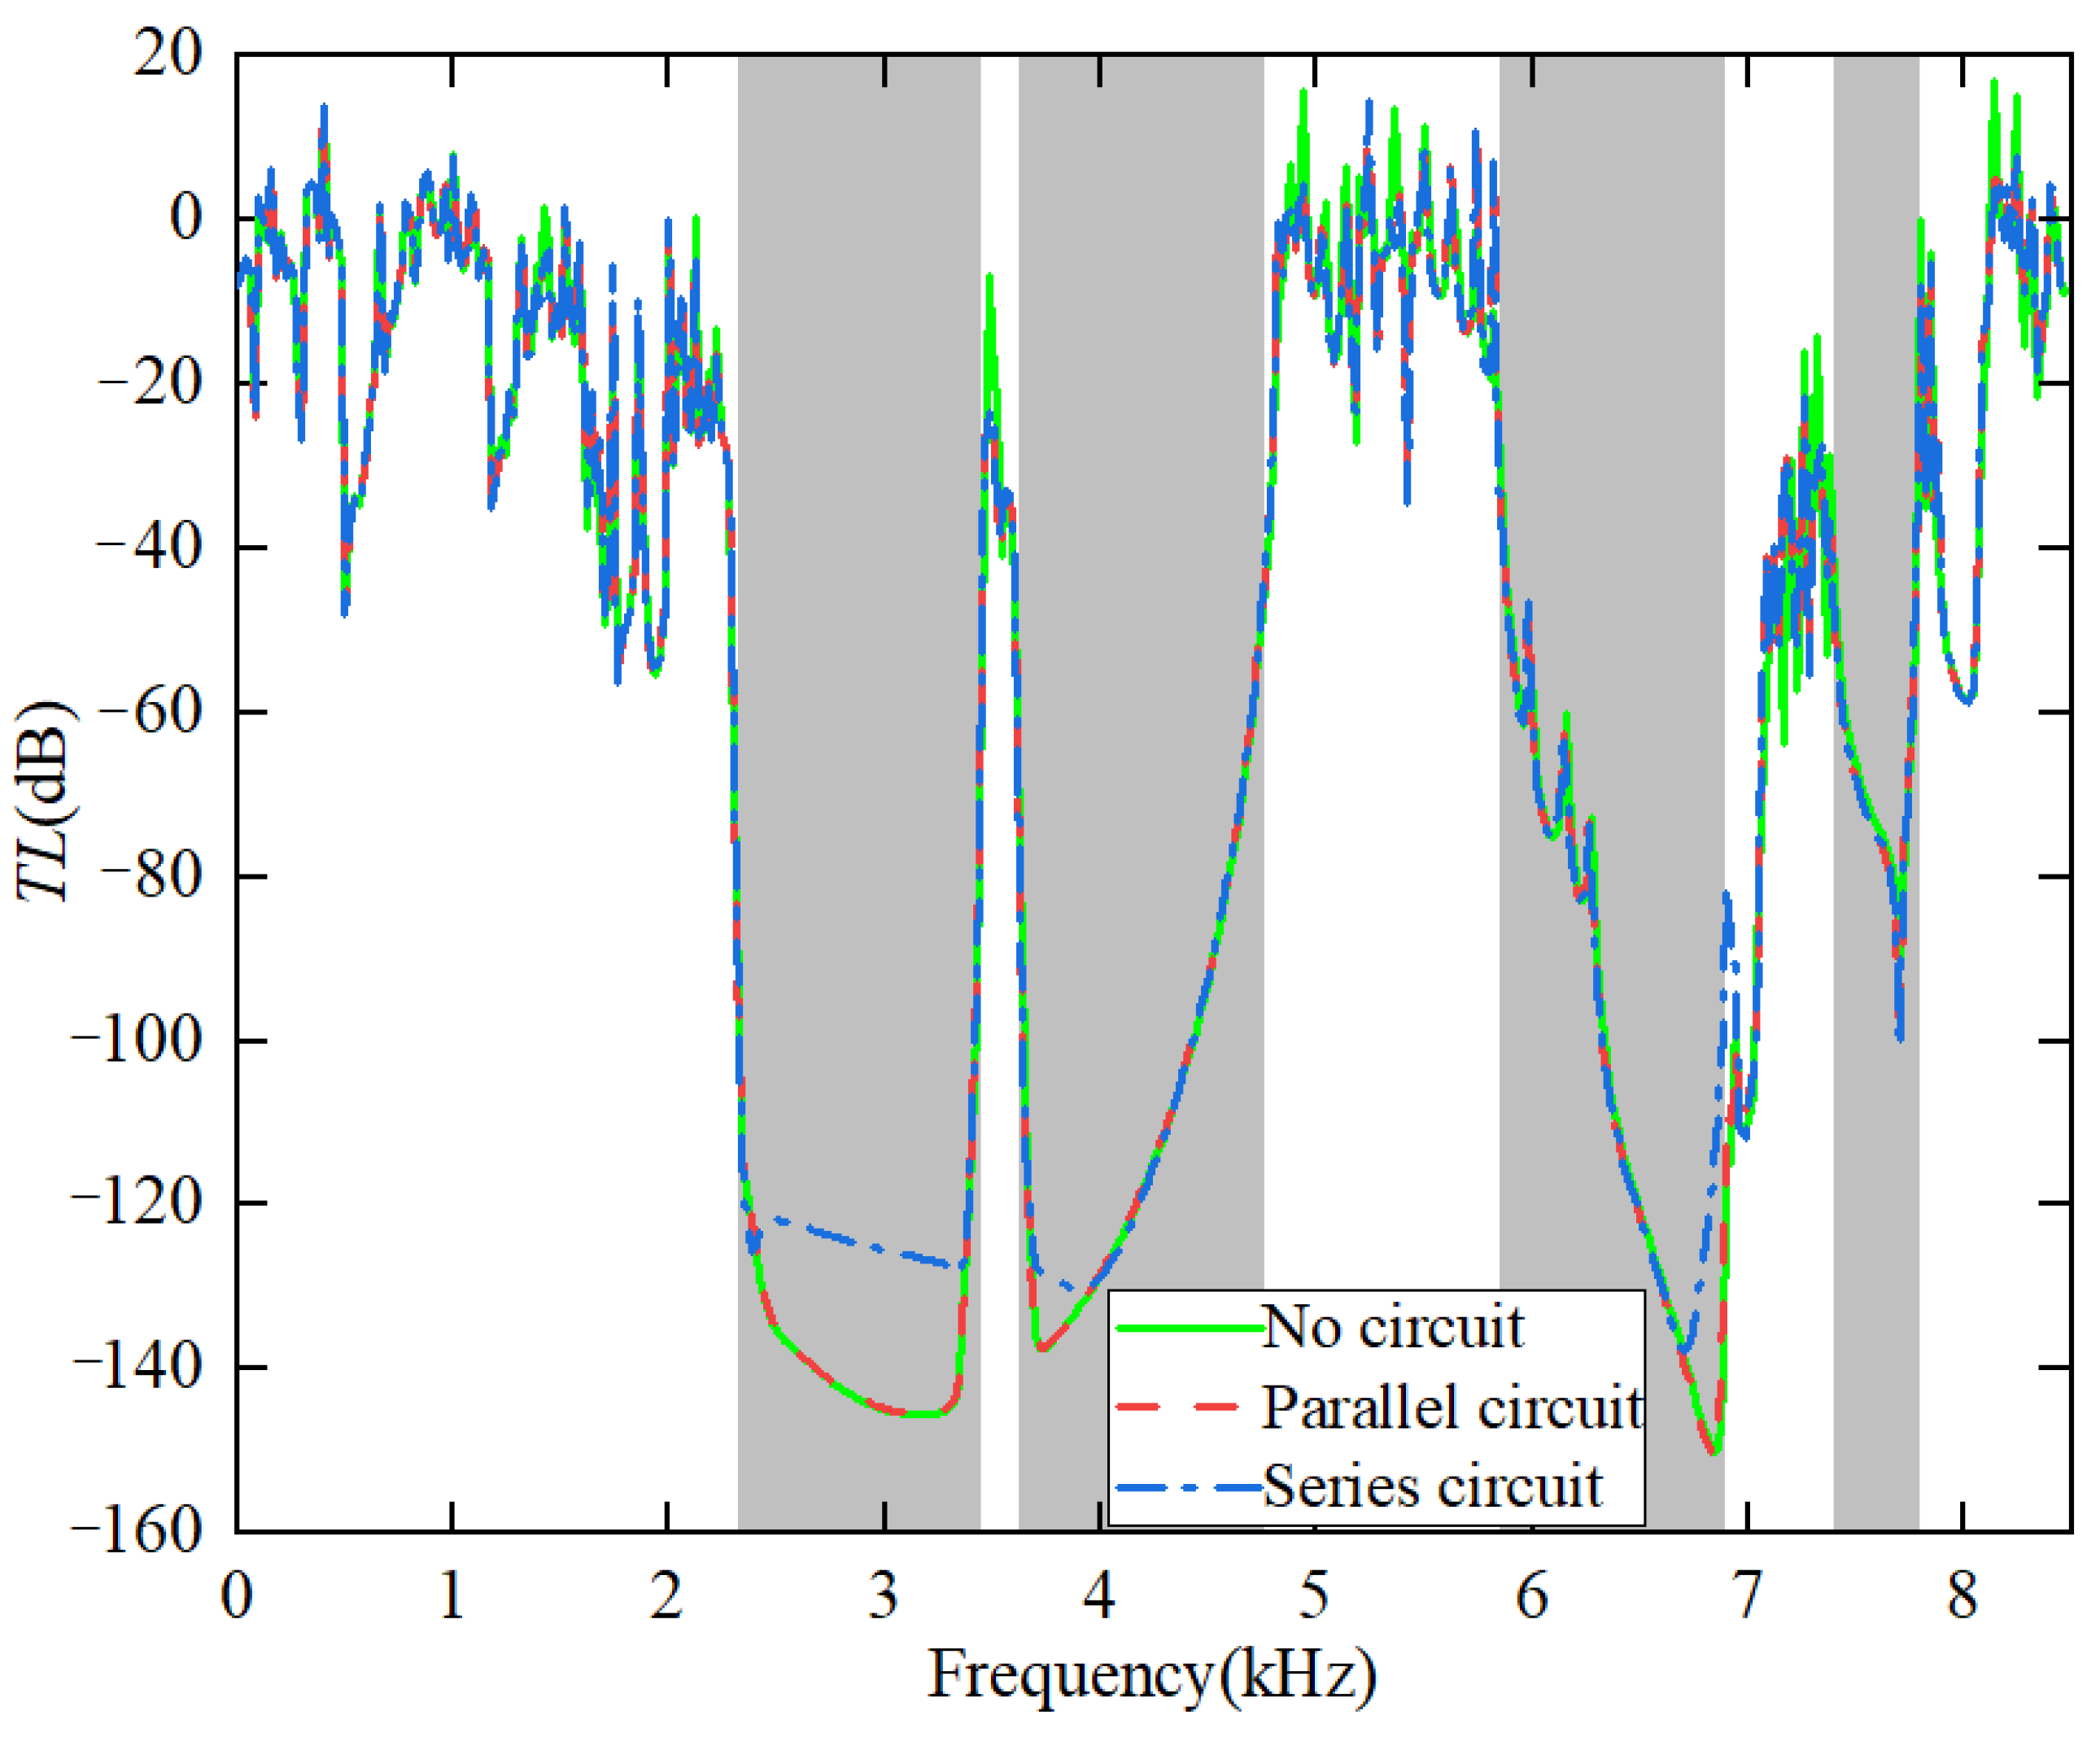
As can be seen from the transmission loss results in Figure 9, whether there is an external circuit or not, within the range of frequency from 0 to 8.5 kHz, there are four attenuation regions of transmission loss, and the frequency range of these attenuation regions is consistent with the frequency range of the bandgaps in Figure 7. Coupling an external series circuit with the finite length piezoelectric phononic crystal reduces the attenuation level of the first three-bandgaps, resulting in their transmission loss curves shifting upward, as shown by the blue dotted line in the figure. Although the decay strength of the transmission losses varies with the structure of the circuit, the attenuation regions in which the bandgaps are located hardly change. Furthermore, whether there is an external circuit or the structure of the external circuit is changed, the width and the attenuation intensity of the fourth bandgap are not affected.
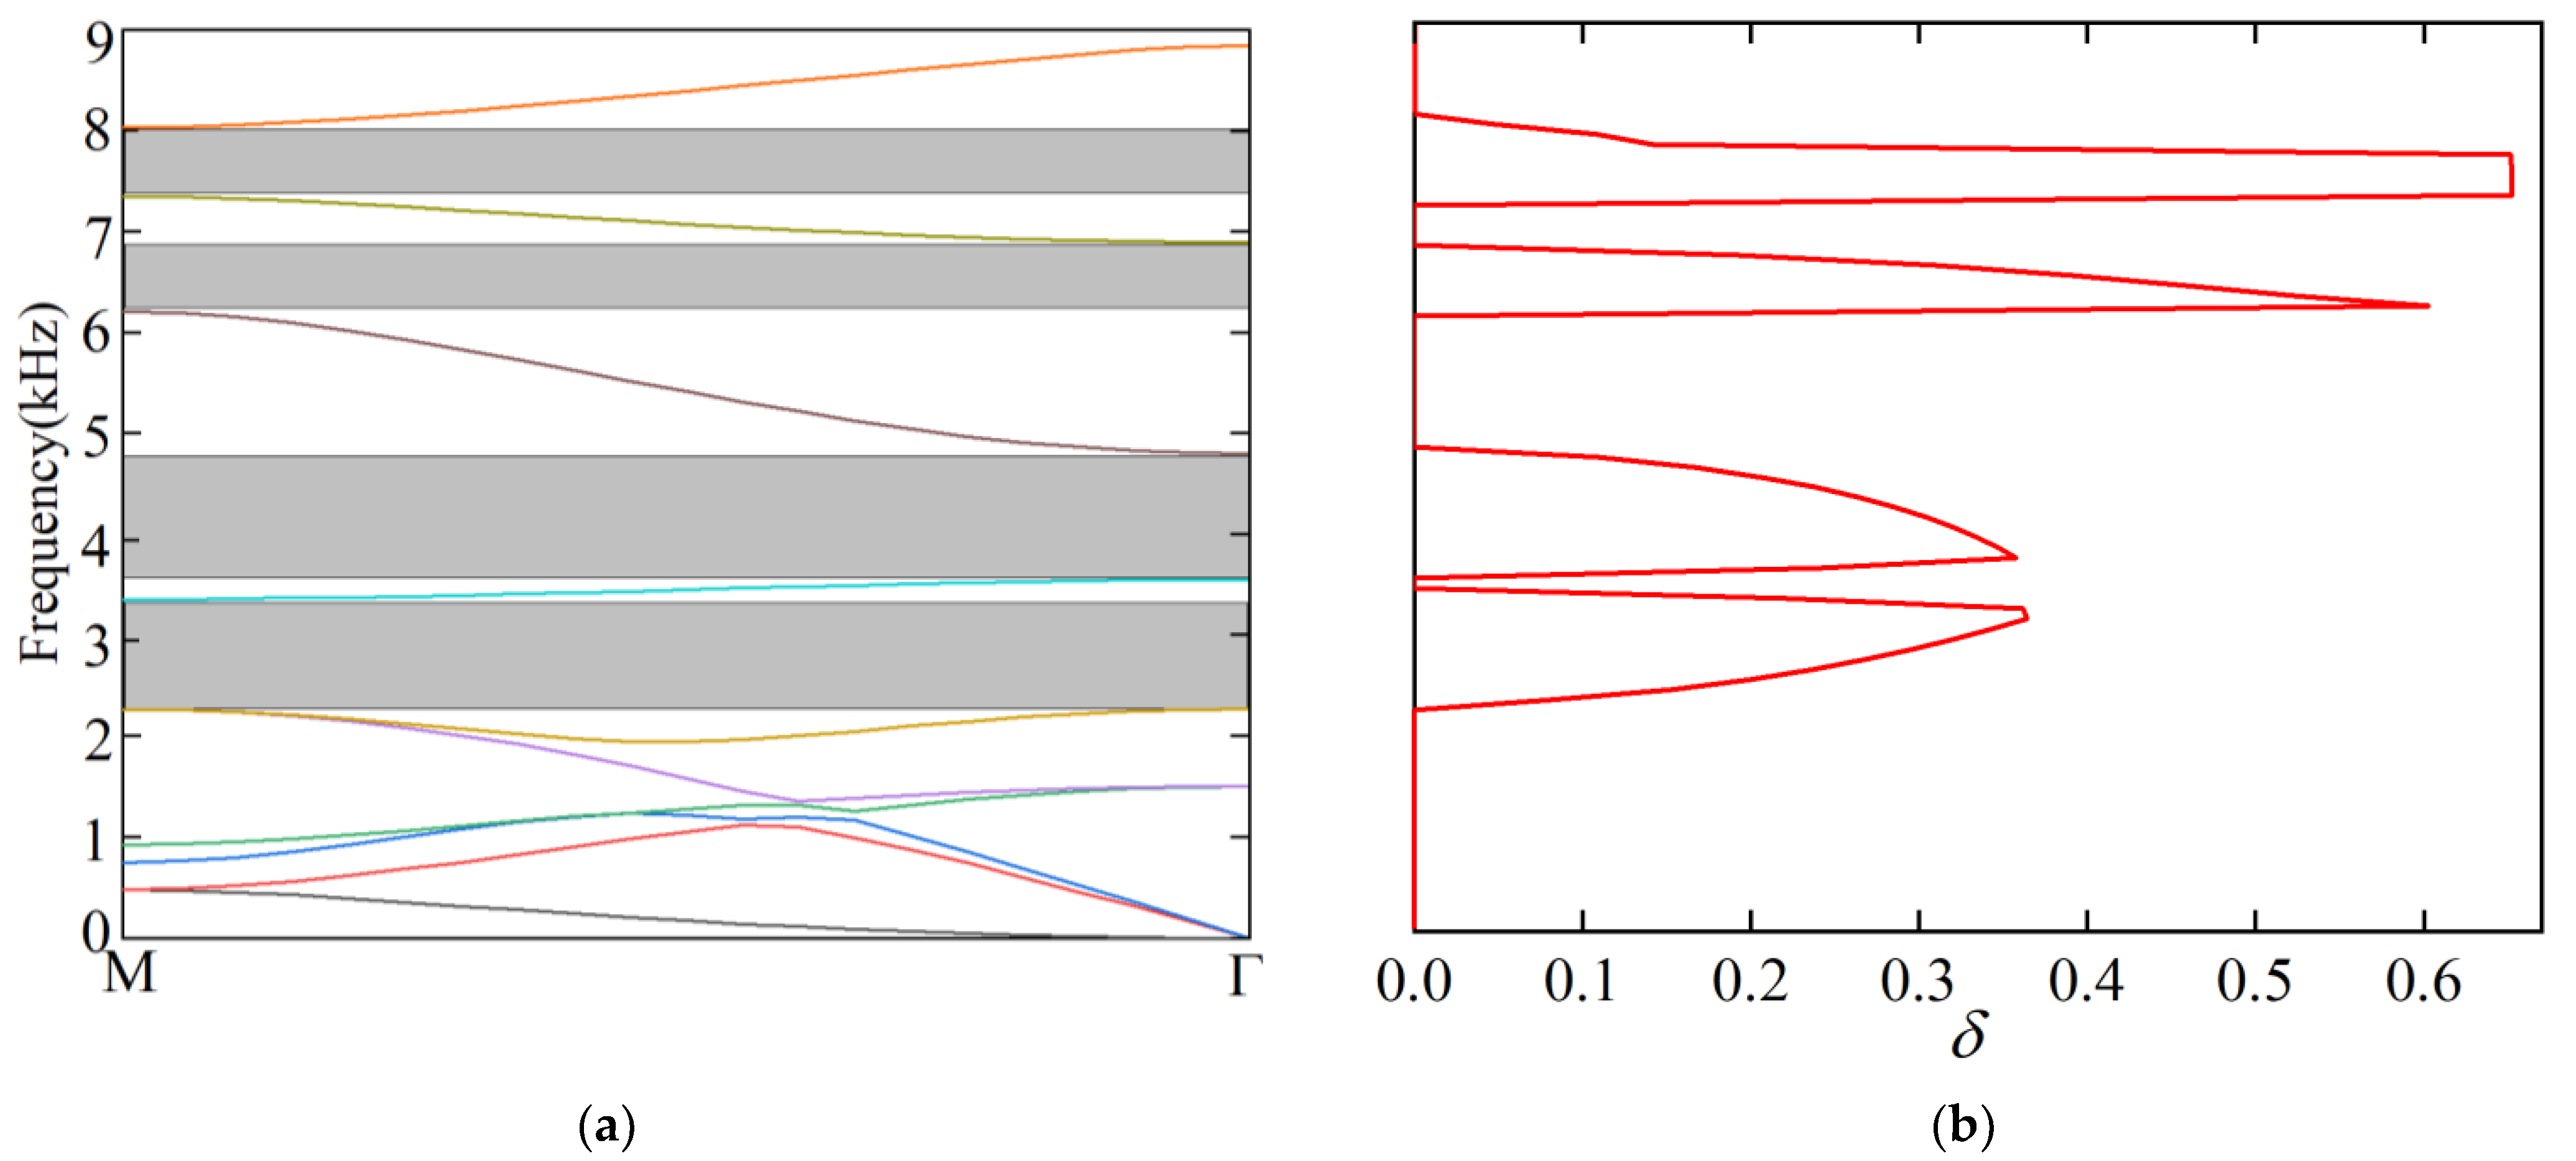
Figure 10a,b show the band structure and attenuation constant in the MΓ direction. The properties of the first bandgap and the second bandgap in Figure 10b are the same as those in Figure 7b. Compared with the first bandgap and the second bandgap, the third bandgap has a stronger attenuation capacity, especially near the lower boundary. Among the four bandgaps, the fourth bandgap has the strongest attenuation ability for the elastic waves, whereas the second bandgap has the weakest decay level.
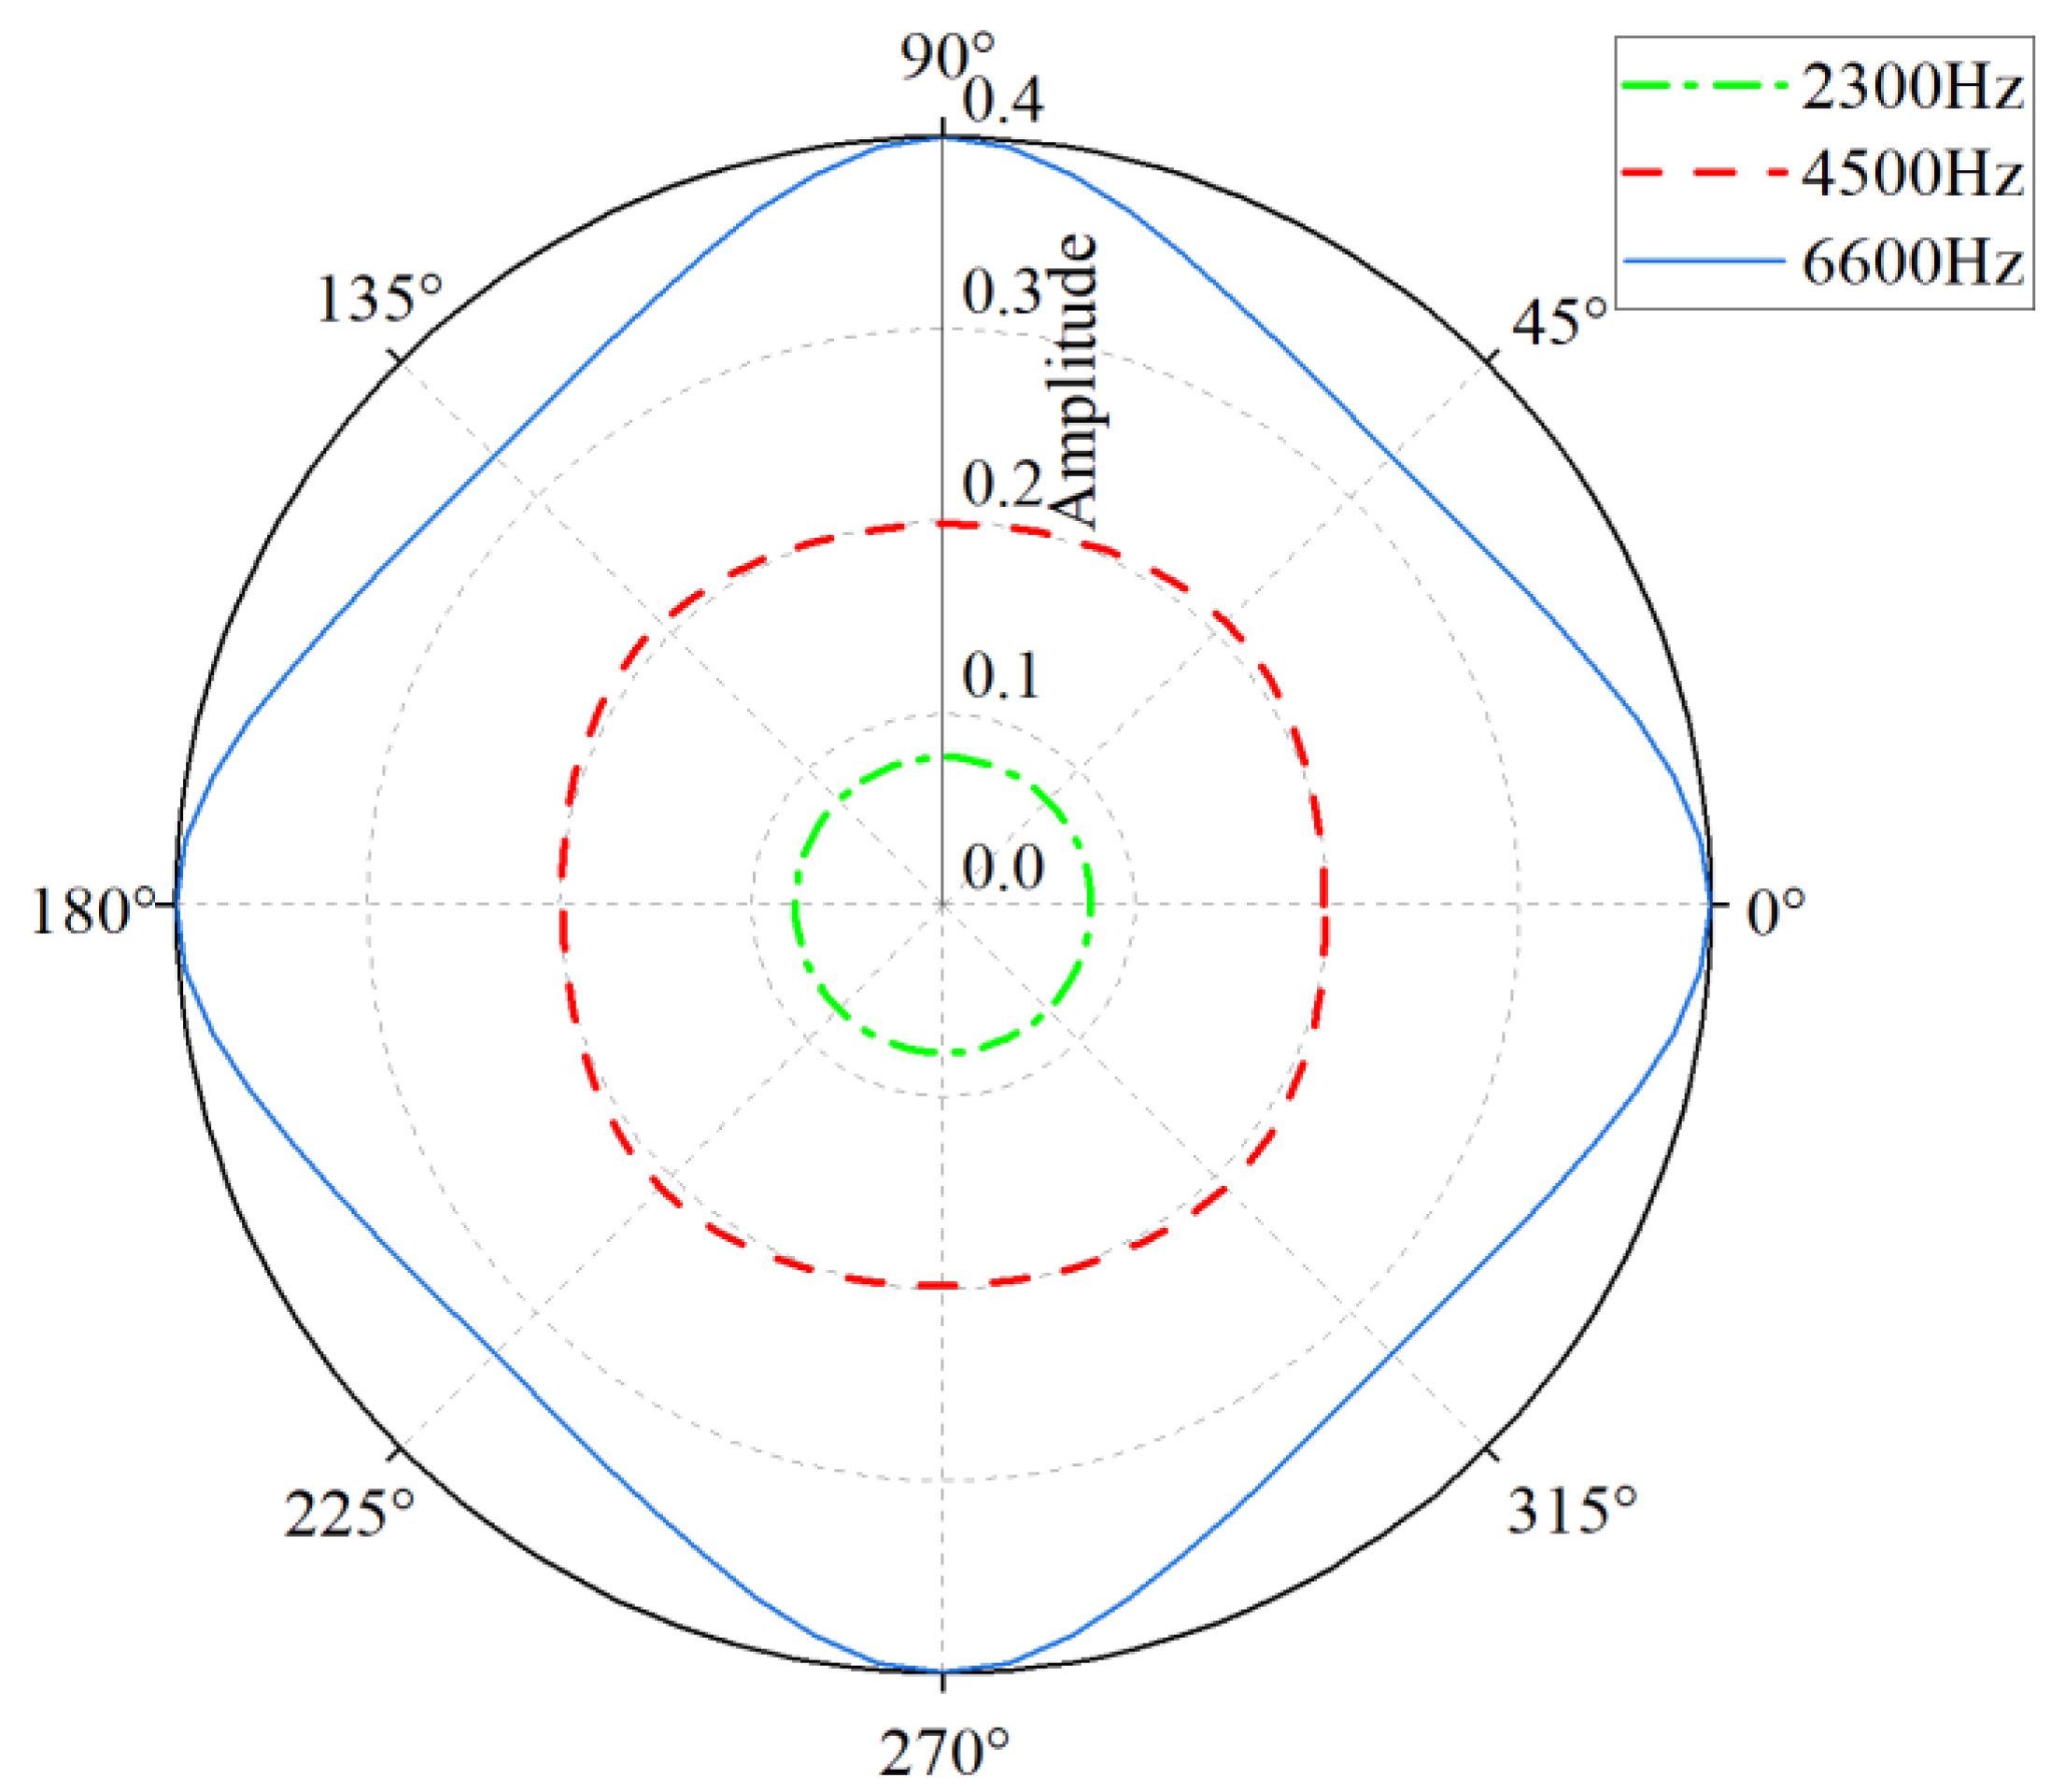
To understand the propagation characteristics of the elastic waves in different directions for the proposed piezoelectric phononic crystal, the attenuation amplitude at different frequencies is calculated. There are three curves in Figure 11 that represent the attenuation curves of 2.3 kHz, 4.5 kHz, and 6.6 kHz, and the sweep range is 0–360°. Since 360° coincides with 0°, it is not specifically marked in the figure and the values from the inner layer to the outer layer (0.0–0.4) represent the attenuation amplitude of the curves.
The attenuation curve at 2.3 kHz is a circle and the attenuation amplitude is approximately 0.08, indicating that the attenuation level in any direction is similar at this frequency. The decaying curve at 4.5 kHz is an ellipse with the value of 0.2. The attenuation curve at 6.6 kHz is a square, with the maximum value of 0.39 at 0°, 90°, 180°, and 270° while the minimum value of 0.33 at 45°, 135°, 225°, and 315°, showing the obvious directivity at the four angles and four edges.
It can be found that the attenuation intensity varies with the angle, which indicates the anisotropy of the attenuation. Additionally, as the frequency increases, the level of anisotropy exhibited by the piezoelectric phononic crystal becomes more apparent.

4. Parametric Analysis

Parametric analysis helps obtain bandgaps with lower frequencies and larger widths in piezoelectric phononic crystal design. Hence, the subsequent research is carried out based on the two aspects of the thickness and the square hollow side length.

4.1. Effects of the Unit Cell Thickness

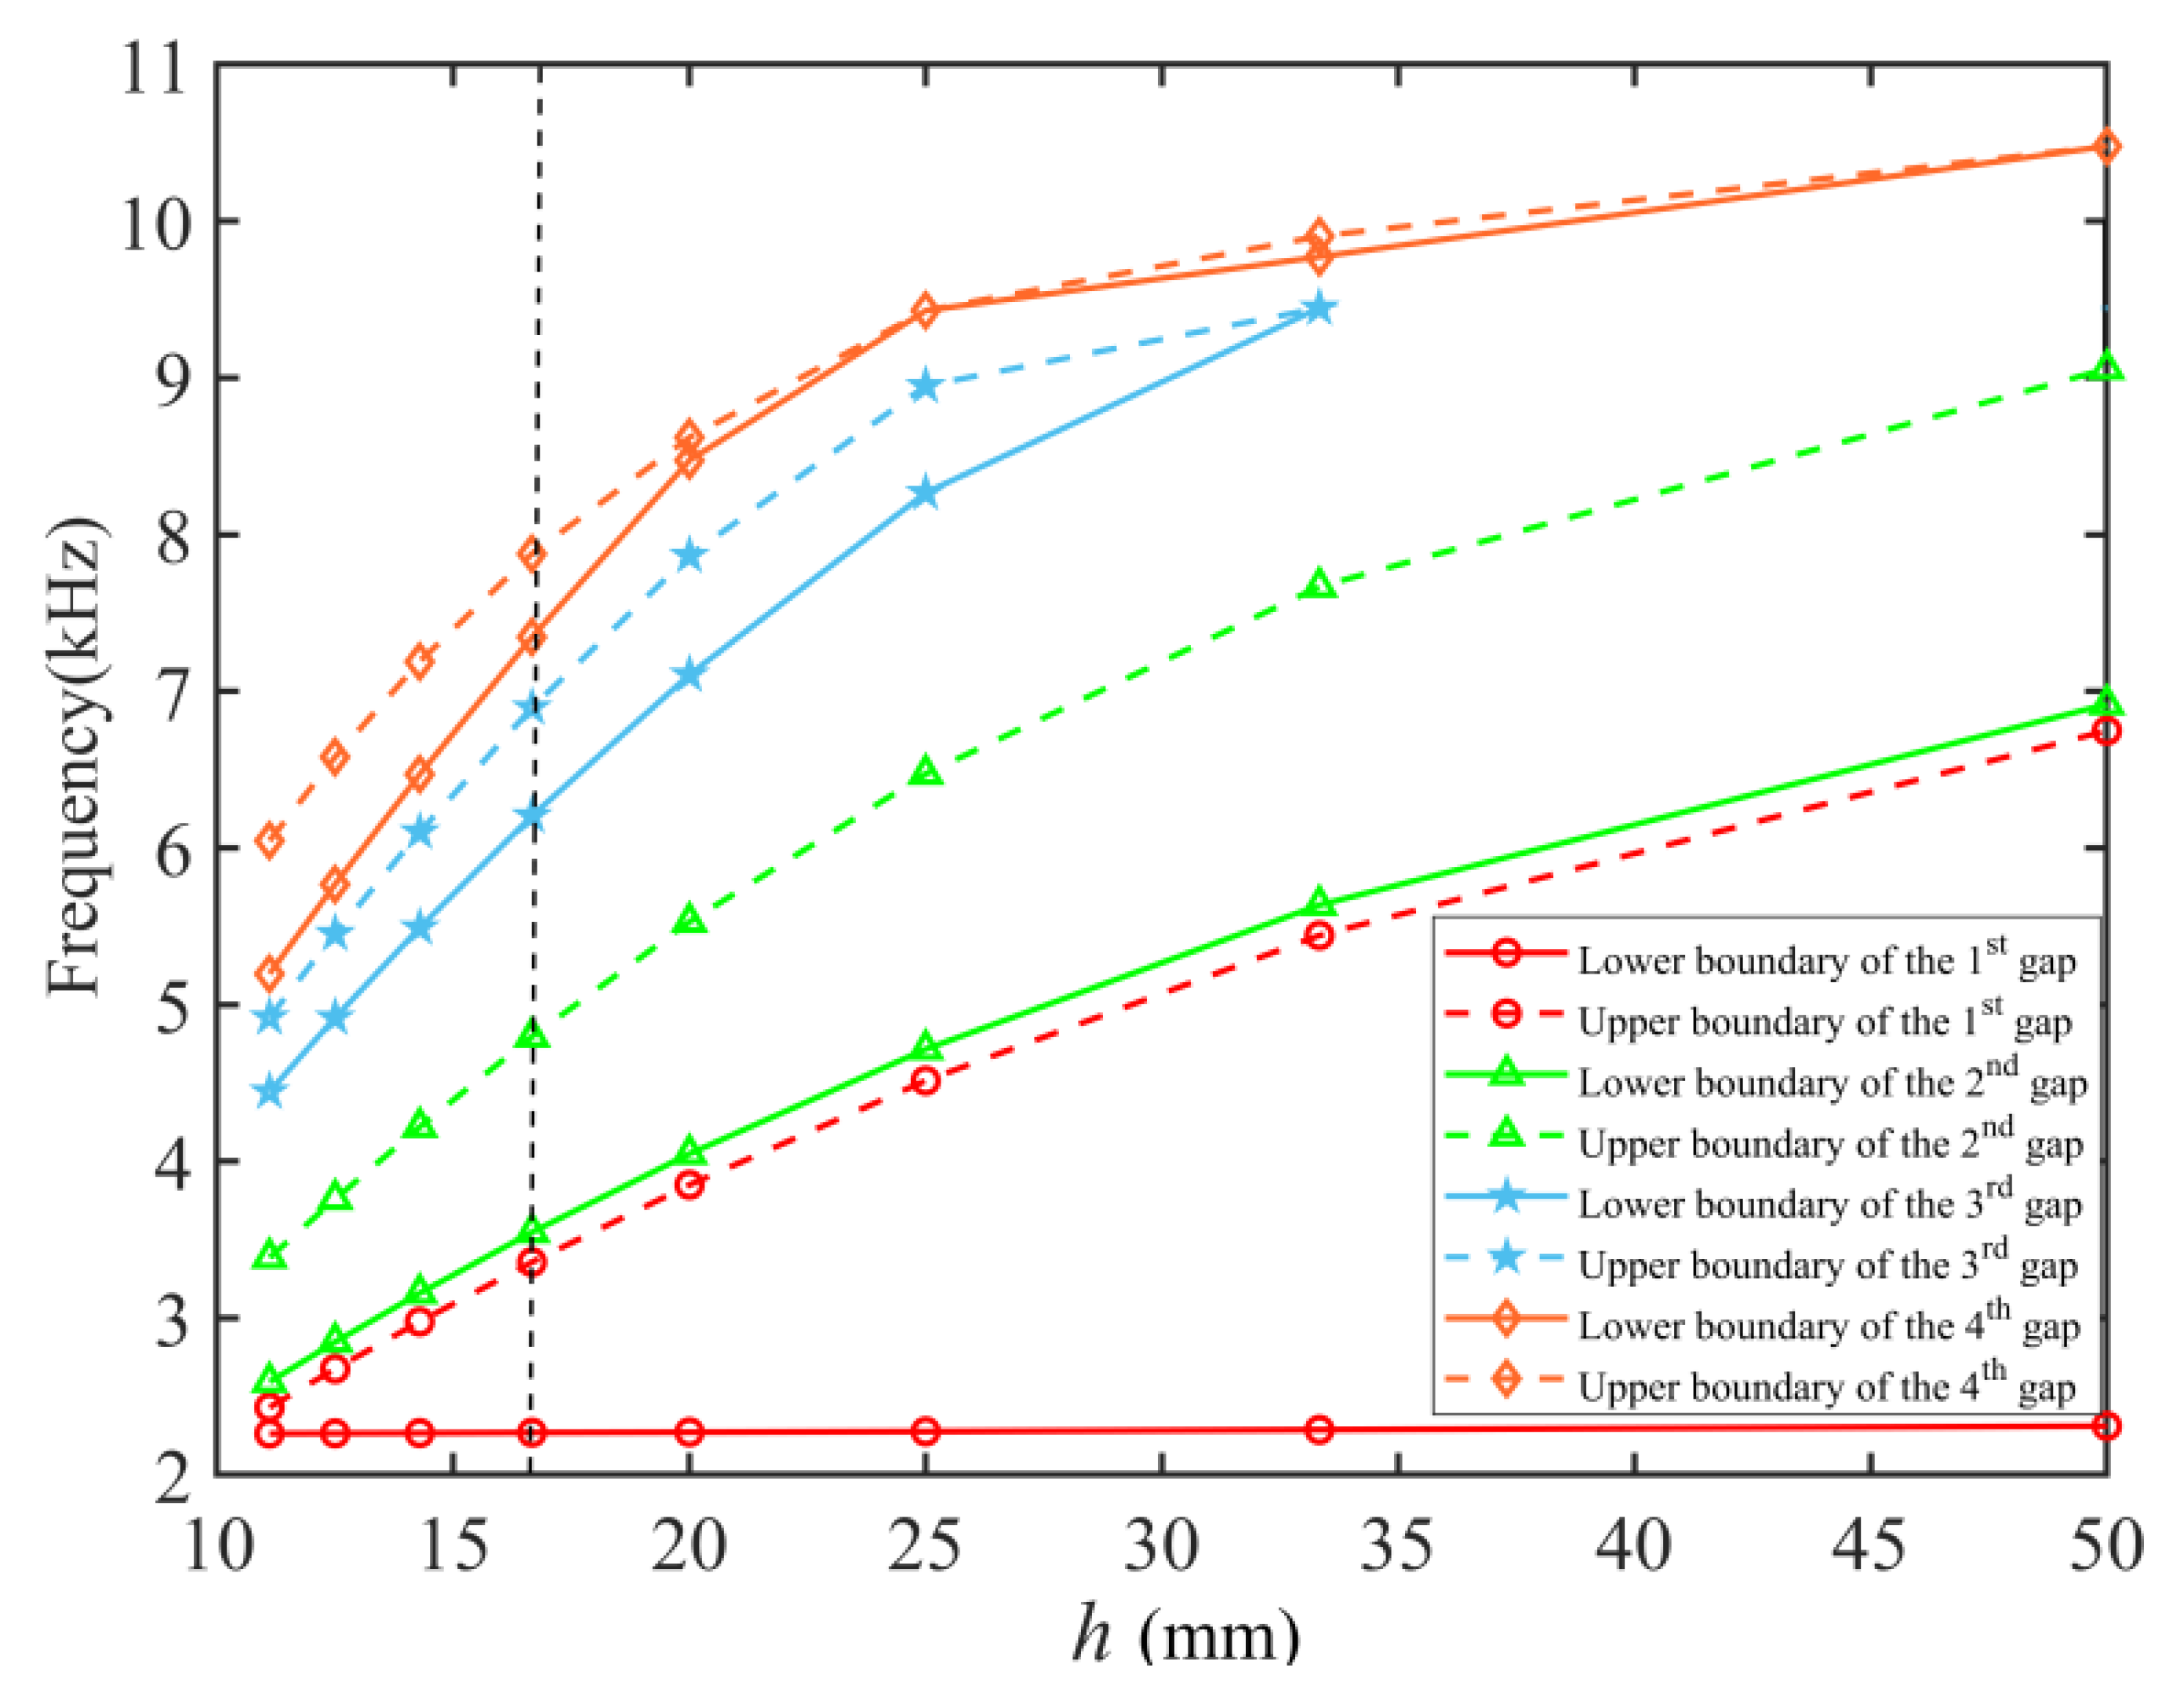
The results for the piezoelectric phononic crystal band structure changing with the thickness h are presented in Figure 12. The default thickness parameter set in the results and discussion section is 16.67 mm, which is shown by the black dotted line in Figure 12. Four bandgaps appear at the position of the black dotted line, which is completely consistent with the numerical calculation results presented in Figure 3.
With the increase of the thickness of the piezoelectric phononic crystal, the lower boundary of the first gap basically does not change, whereas its upper boundary gradually rises, increasing the width of the first bandgap. For the second bandgap, the upper and lower boundaries rise with the increase of the thickness, but the upper boundary rises faster than the lower boundary, leading to the continuous increase of the bandgap width.
Similar to the second bandgap, the upper and lower boundaries of the third bandgap also climb with the increase of the thickness, but their growth speed is the same, so the width of the third bandgap does not change very much. However, when the thickness increases to 25 mm, the rising speed of the upper boundary slows down, but the rising speed of the lower boundary remains the same, which eventually leads to the complete disappearance of the third bandgap. The variation of the fourth bandgap with the thickness is only slightly different from that of the third bandgap. To be precise, when the thickness is 33.33 mm, the fourth bandgap is opened again, but it steadily disappears as the thickness further increases.

4.2. Effects of the Unit Cell Square Hollow Size

The square hollow size is also one of the significant factors affecting the bandgap properties of the designed piezoelectric phononic crystal. Therefore, this subsection describes the analysis of these effects on the characteristics of multi-bandgaps caused by the change of the square hollow side length, and the results are exhibited in Table 3. It can be seen from Table 3 that four bandgaps are generated when the square hollow side length increases from 10 mm to 50 mm.
To better describe the relationship between the change of the square hollow side length and the bandgaps, the bandgap frequency and bandgap width of the piezoelectric phononic crystal are considered simultaneously. Therefore, the transformation is carried out with the following formula:
α r = β r γ r ,
where αr is the relative bandwidth of the bandgaps, βr and γr are defined by the following equations:
β r = g h g l ,
γ r = g h + g l 2 .
In Equations (38) and (39), g h and g l represent the upper and lower boundaries of the multi-bandgaps, respectively.
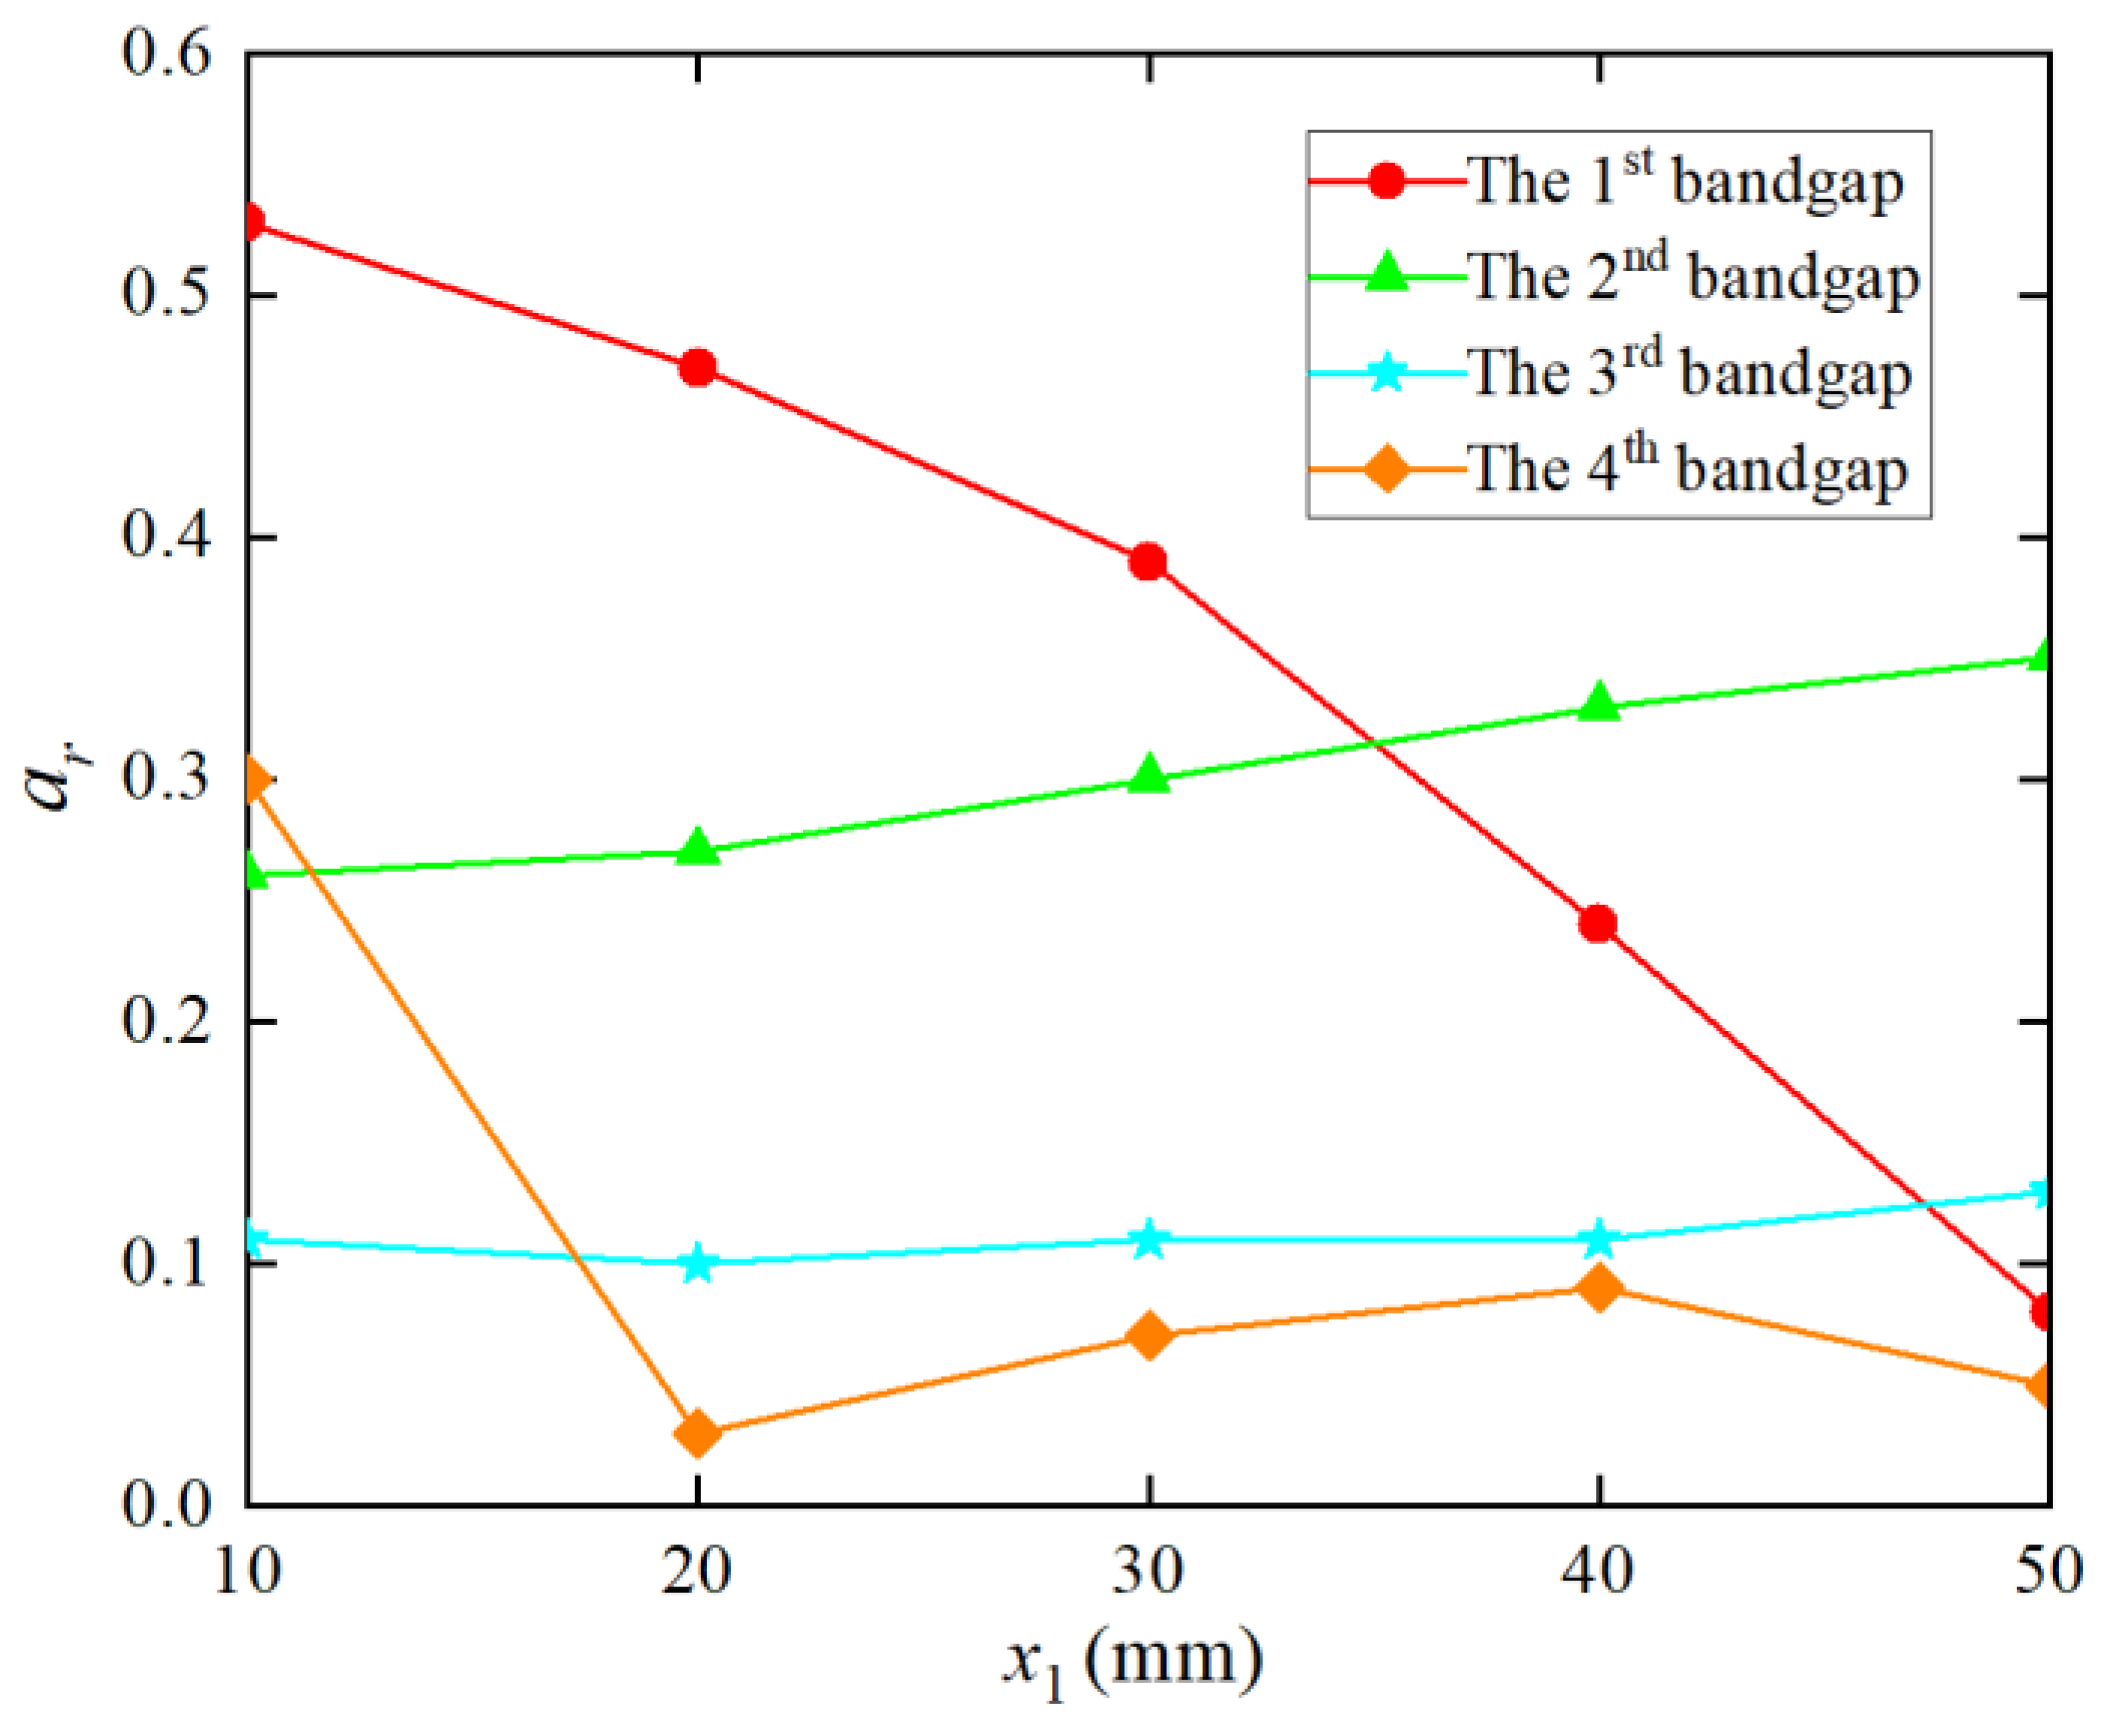
As indicated in Figure 13, the properties of each bandgap vary uniquely as the side length of the square hollow increases. The first bandgap gradually declines with the increase of x1 and the maximum value is 0.53, while the minimum value of the first bandgap is 0.08. The second bandgap shows an entirely opposite trend to the first bandgap. The minimum value for the second bandgap is 0.26, whereas the maximum value is 0.35.
The variation trend of the third bandgap is different from those of the first two bandgaps. Specifically, with the gradually increase of x1, αr changes slightly around 0.1. For the fourth bandgap, when x1 is 10 mm, the maximum value is achieved, which is 0.3, and the minimum value of αr is 0.03 when x1 increases to 20 mm.
In summary, more attention should be paid to the first and second bandgaps, because they are more valuable than the other bandgaps. Specifically, the frequency ranges of the first and second bandgaps should be lower and wider. To achieve the above results, it is necessary to increase the thickness of the piezoelectric phononic crystal, and the side length of the square hollow should be as small as possible.

5. Conclusions

In this study, a new type of 2D piezoelectric phononic crystal with thickness and a square hollow as well as convex structures was designed and established. First, a theoretical analysis was introduced to illustrate the dispersion relationship of the designed piezoelectric phononic crystal. Subsequently, the band structure diagram was drawn, which demonstrated that the multi-order broadband complete bandgaps were generated. The widest bandgap was as high as 1247.74 Hz, while the narrowest bandgap was 532.34 Hz. To gain a clearer understanding of the formation of the bandgaps, the vibration modes of the upper and lower boundaries of each bandgap were analyzed and the iso-frequency curves were computed to illustrate the anisotropy of elastic waves propagating through the piezoelectric phononic crystal.
Further, by comparing the band structure with the elastic waves attenuation constant curves in the ΓX and MΓ directions, the frequencies of the bandgaps were found to be consistent with the attenuation regions and the attenuation level of each bandgap is able to possess unique characteristics. The fourth bandgap had the strongest ability to suppress elastic waves, whereas the second bandgap was the weakest. Furthermore, the transmission loss curve showed that the series circuit configuration reduced the decaying performance of the elastic waves, and the attenuation range of the bandgaps did not vary with the different external circuits. It is worth noting that piezoelectric material is added to the established phononic crystal as matrix material, which makes it possible to alter the intrinsic property of phononic crystal through the external circuit, and can lay the foundation for the active control of solid piezoelectric phononic crystal.
Finally, the factors (thickness and square hollow side length) affecting the bandgaps of the piezoelectric phononic crystal were discussed. The findings indicated that to obtain a lower and wider stopband, the thickness of the piezoelectric phononic crystal should be increased while decreasing the side length of the square hollow. The presented study and the numerical model could be beneficial for enriching the scope of piezoelectric phononic crystals in vibration isolation and promoting their practical applications.

Author Contributions

Conceptualization, Z.M. and J.L.; data curation, Z.M.; formal analysis, Z.M.; funding acquisition, J.L.; investigation, J.L.; methodology, Z.M. and J.L.; project administration, Q.M.; resources, S.L.; supervision, J.L.; validation, Z.M., J.L. and S.L.; visualization, Q.M.; writing—original draft, Z.M.; writing—review and editing, J.L. All authors have read and agreed to the published version of the manuscript.

Funding

This research was funded by the Natural Science Foundation of Hainan Province (grant numbers 122MS004 and 2019RC068), and the National Natural Science Foundation of China (grant number 51909050).

Institutional Review Board Statement

Not applicable.

Informed Consent Statement

Not applicable.

Data Availability Statement

Not applicable.

Conflicts of Interest

The authors declare no conflict of interest.

Appendix A

The matrices involved in the PDE module for piezoelectric part are:
A = [ ρ ω 2 0 0 0 0 ρ ω 2 0 0 0 0 ρ ω 2 0 0 0 0 0 ]
e a = [ ( C 11 cos ( θ ) 2 + C 66 sin ( θ ) 2 + 2 C 16 sin ( θ ) cos ( θ ) ) ( C 16 cos ( θ ) 2 + C 26 sin ( θ ) 2 + C 12 sin ( θ ) cos ( θ ) + C 66 sin ( θ ) cos ( θ ) ) ( C 16 cos ( θ ) 2 + C 26 sin ( θ ) 2 + C 12 sin ( θ ) cos ( θ ) + C 66 sin ( θ ) cos ( θ ) ) ( C 66 cos ( θ ) 2 + C 22 sin ( θ ) 2 + 2 C 26 cos ( θ ) sin ( θ ) ) 0 0 0 0 0 0 0 0 ( C 55 cos ( θ ) 2 + C 44 sin ( θ ) 2 + 2 C 45 sin ( θ ) cos ( θ ) ) ( e 15 cos ( θ ) 2 + e 24 sin ( θ ) 2 ) ( e 15 cos ( θ ) 2 + e 24 sin ( θ ) 2 ) ε 11 cos ( θ ) 2 + ε 22 sin ( θ ) 2 ]
C = [ [ C 11 C 16 0 C 16 C 66 0 0 0 C 55 ] [ C 16 C 12 0 C 66 C 26 0 0 0 C 45 ] [ 0 0 C 13 0 0 C 36 C 55 C 45 0 ] [ 0 0 e 31 0 0 0 e 15 0 0 ] [ C 16 C 66 0 C 12 C 26 0 0 0 C 45 ] [ C 66 C 26 0 C 26 C 22 0 0 0 C 44 ] [ 0 0 C 36 0 0 C 23 C 45 C 44 0 ] [ 0 0 0 0 0 e 32 0 e 24 0 ] [ 0 0 C 55 0 0 C 45 C 13 C 36 0 ] [ 0 0 C 45 0 0 C 44 C 36 C 23 0 ] [ C 55 C 45 0 C 45 C 44 0 0 0 C 33 ] [ e 15 0 0 0 e 24 0 0 0 e 33 ] [ 0 0 e 15 0 0 0 e 31 0 0 ] [ 0 0 0 0 0 e 24 0 e 32 0 ] [ e 15 0 0 0 e 24 0 0 0 e 33 ] [ ε 11 0 0 0 ε 22 0 0 0 ε 33 ] ]
β = [ [ C 11 Λ cos ( θ ) C 16 Λ sin ( θ ) C 66 Λ sin ( θ ) C 16 Λ cos ( θ ) 0 ] [ C 16 Λ cos ( θ ) C 66 Λ sin ( θ ) C 26 Λ sin ( θ ) C 12 Λ cos ( θ ) 0 ] [ 0 0 C 13 Λ cos ( θ ) C 36 Λ sin ( θ ) ] [ 0 0 e 31 Λ cos ( θ ) ] [ C 16 Λ cos ( θ ) C 12 Λ sin ( θ ) C 26 Λ sin ( θ ) C 66 Λ cos ( θ ) 0 ] [ C 66 Λ cos ( θ ) C 26 Λ sin ( θ ) C 22 Λ sin ( θ ) C 26 Λ cos ( θ ) 0 ] [ 0 0 C 23 Λ sin ( θ ) C 36 Λ cos ( θ ) ] [ 0 0 e 32 Λ sin ( θ ) ] [ 0 0 C 55 Λ cos ( θ ) C 45 Λ sin ( θ ) ] [ 0 0 C 44 Λ sin ( θ ) C 45 Λ cos ( θ ) ] [ C 55 Λ cos ( θ ) C 45 Λ sin ( θ ) C 44 Λ sin ( θ ) C 45 Λ cos ( θ ) 0 ] [ e 15 Λ cos ( θ ) e 24 Λ sin ( θ ) 0 ] [ 0 0 e 15 Λ cos ( θ ) ] [ 0 0 e 24 Λ sin ( θ ) ] [ e 15 Λ cos ( θ ) e 24 Λ sin ( θ ) 0 ] [ ε 11 Λ cos ( θ ) ε 22 Λ sin ( θ ) 0 ] ]
where Λ = i k .
α = [ [ C 11 Λ cos ( θ ) + C 16 Λ sin ( θ ) C 66 Λ sin ( θ ) + C 16 Λ cos ( θ ) 0 ] [ C 16 Λ cos ( θ ) + C 12 Λ sin ( θ ) C 26 Λ sin ( θ ) + C 66 Λ cos ( θ ) 0 ] [ 0 0 C 45 Λ sin ( θ ) + C 55 Λ cos ( θ ) ] [ 0 0 e 15 Λ cos ( θ ) ] [ C 16 Λ cos ( θ ) + C 66 Λ sin ( θ ) C 26 Λ sin ( θ ) + C 12 Λ cos ( θ ) 0 ] [ C 66 Λ cos ( θ ) + C 26 Λ sin ( θ ) C 22 Λ sin ( θ ) + C 26 Λ cos ( θ ) 0 ] [ 0 0 C 44 Λ sin ( θ ) + C 45 Λ cos ( θ ) ] [ 0 0 e 24 Λ sin ( θ ) ] [ 0 0 C 13 Λ cos ( θ ) + C 36 Λ sin ( θ ) ] [ 0 0 C 23 Λ sin ( θ ) + C 36 Λ cos ( θ ) ] [ C 55 Λ cos ( θ ) + C 45 Λ sin ( θ ) C 44 Λ sin ( θ ) + C 45 Λ cos ( θ ) 0 ] [ e 15 Λ cos ( θ ) e 24 Λ sin ( θ ) 0 ] [ 0 0 e 31 Λ cos ( θ ) ] [ 0 0 e 32 Λ sin ( θ ) ] [ e 15 Λ cos ( θ ) e 24 Λ sin ( θ ) 0 ] [ ε 11 Λ cos ( θ ) ε 22 Λ sin ( θ ) 0 ] ]
The matrices involved in PDE module for the non-piezoelectric parts are:
A = [ ρ ω 2 0 0 0 0 ρ ω 2 0 0 0 0 ρ ω 2 0 0 0 0 1 ]
e a = [ ( λ + 2 μ ) cos ( θ ) 2 μ sin ( θ ) 2 ( λ + μ ) cos ( θ ) sin ( θ ) 0 0 ( λ + μ ) cos ( θ ) sin ( θ ) ( λ + 2 μ ) sin ( θ ) 2 μ cos ( θ ) 2 0 0 0 0 μ 0 0 0 0 0 ]
C = [ [ λ + 2 μ 0 0 0 μ 0 0 0 μ ] [ 0 λ 0 μ 0 0 0 0 0 ] [ 0 0 λ 0 0 0 μ 0 0 ] 0 [ 0 μ 0 λ 0 0 0 0 0 ] [ μ 0 0 0 λ + 2 μ 0 0 0 μ ] [ 0 0 0 0 0 λ 0 μ 0 ] 0 [ 0 0 μ 0 0 0 λ 0 0 ] [ 0 0 0 0 0 μ 0 λ 0 ] [ μ 0 0 0 μ 0 0 0 λ + 2 μ ] 0 0 0 0 0 ]
β = [ [ ( λ + 2 μ ) Λ cos ( θ ) μ Λ sin ( θ ) 0 ] [ μ Λ sin ( θ ) λ Λ cos ( θ ) 0 ] [ 0 0 λ Λ cos ( θ ) ] [ 0 0 0 ] [ λ Λ sin ( θ ) μ Λ cos ( θ ) 0 ] [ μ Λ cos ( θ ) ( λ + 2 μ ) Λ sin ( θ ) 0 ] [ 0 0 λ Λ sin ( θ ) ] [ 0 0 0 ] [ 0 0 μ Λ cos ( θ ) ] [ 0 0 μ Λ sin ( θ ) ] [ μ Λ cos ( θ ) μ Λ sin ( θ ) 0 ] [ 0 0 0 ] [ 0 0 0 ] [ 0 0 0 ] [ 0 0 0 ] [ 0 0 0 ] ]
α = [ [ ( λ + 2 μ ) Λ cos ( θ ) μ Λ sin ( θ ) 0 ] [ λ Λ sin ( θ ) μ Λ cos ( θ ) 0 ] [ 0 0 μ Λ cos ( θ ) ] [ 0 0 0 ] [ μ Λ sin ( θ ) λ Λ cos ( θ ) 0 ] [ μ Λ cos ( θ ) ( λ + 2 μ ) Λ sin ( θ ) 0 ] [ 0 0 μ Λ sin ( θ ) ] [ 0 0 0 ] [ 0 0 λ Λ cos ( θ ) ] [ 0 0 λ Λ sin ( θ ) ] [ μ Λ cos ( θ ) μ Λ sin ( θ ) 0 ] [ 0 0 0 ] [ 0 0 0 ] [ 0 0 0 ] [ 0 0 0 ] [ 0 0 0 ] ]

References

  1. Li, J.; Liu, Z.; Qiu, C. Negative Refraction Imaging of Acoustic Waves by a Two-Dimensional Three-Component Phononic Crystal. Phys. Rev. B 2006, 73, 054302. [Google Scholar] [CrossRef]
  2. Feng, L.; Liu, X.-P.; Chen, Y.-B. Negative Refraction of Acoustic Waves in Two-Dimensional Sonic Crystals. Phys. Rev. B 2005, 72, 033108. [Google Scholar] [CrossRef]
  3. Sigalas, M.M. Defect States of Acoustic Waves in a Two-Dimensional Lattice of Solid Cylinders. J. Appl. Phys. 1998, 84, 3026–3030. [Google Scholar] [CrossRef]
  4. Kafesaki, M.; Sigalas, M.M.; García, N. Wave Guides in Two-Dimensional Elastic Wave Band-Gap Materials. Phys. B Condens. Matter 2001, 296, 190–194. [Google Scholar] [CrossRef]
  5. Wu, F.; Hou, Z.; Liu, Z.; Liu, Y. Point Defect States in Two-Dimensional Phononic Crystals. Phys. Lett. A 2001, 292, 198–202. [Google Scholar] [CrossRef]
  6. Torres, M.; Montero de Espinosa, F.R.; García-Pablos, D.; García, N. Sonic Band Gaps in Finite Elastic Media: Surface States and Localization Phenomena in Linear and Point Defects. Phys. Rev. Lett. 1999, 82, 3054–3057. [Google Scholar] [CrossRef]
  7. Qiu, C.; Zhang, X.; Liu, Z. Far-Field Imaging of Acoustic Waves by a Two-Dimensional Sonic Crystal. Phys. Rev. B 2005, 71, 054302. [Google Scholar] [CrossRef]
  8. Gupta, B.C.; Ye, Z. Theoretical Analysis of the Focusing of Acoustic Waves by Two-Dimensional Sonic Crystals. Phys. Rev. E 2003, 67, 036603. [Google Scholar] [CrossRef] [Green Version]
  9. Cervera, F.; Sanchis, L.; Sánchez-Pérez, J.V.; Martínez-Sala, R.; Rubio, C.; Meseguer, F.; López, C.; Caballero, D.; Sánchez-Dehesa, J. Refractive Acoustic Devices for Airborne Sound. Phys. Rev. Lett. 2001, 88, 023902. [Google Scholar] [CrossRef]
  10. García-Pablos, D.; Sigalas, M.; Montero de Espinosa, F.R.; Torres, M.; Kafesaki, M.; García, N. Theory and Experiments on Elastic Band Gaps. Phys. Rev. Lett. 2000, 84, 4349–4352. [Google Scholar] [CrossRef] [Green Version]
  11. Sigalas, M.; Economou, E.N. Band Structure of Elastic Waves in Two Dimensional Systems. Solid State Commun. 1993, 86, 141–143. [Google Scholar] [CrossRef]
  12. Zhang, X.; Liu, Z.; Liu, Y.; Wu, F. Elastic Wave Band Gaps for Three-Dimensional Phononic Crystals with Two Structural Units. Phys. Lett. A 2003, 313, 455–460. [Google Scholar] [CrossRef]
  13. Cheng, Y.; Xu, J.Y.; Liu, X.J. Broad Forbidden Bands in Parallel-Coupled Locally Resonant Ultrasonic Metamaterials. Appl. Phys. Lett. 2008, 92, 051913. [Google Scholar] [CrossRef]
  14. Heckl, M.A. Coupled waves on a periodically supported timoshenko beam. J. Sound Vib. 2002, 252, 849–882. [Google Scholar] [CrossRef]
  15. Mangaraju, V.; Sonti, V.R. Wave Attenuation in Periodic Three-Layered Beams: Analytical and FEM Study. J. Sound Vib. 2004, 276, 541–570. [Google Scholar] [CrossRef]
  16. Sigalas, M.M.; Economou, E.N. Elastic and Acoustic Wave Band Structure. J. Sound Vib. 1992, 158, 377–382. [Google Scholar] [CrossRef]
  17. Kushwaha, M.S.; Halevi, P.; Dobrzynski, L.; Djafari-Rouhani, B. Acoustic Band Structure of Periodic Elastic Composites. Phys. Rev. Lett. 1993, 71, 2022–2025. [Google Scholar] [CrossRef]
  18. Liu, Z.; Zhang, X.; Mao, Y.; Zhu, Y.Y.; Yang, Z.; Chan, C.T.; Sheng, P. Locally Resonant Sonic Materials. Science 2000, 289, 1734–1736. [Google Scholar] [CrossRef]
  19. Berjamin, H.; De Pascalis, R. Acoustoelastic Analysis of Soft Viscoelastic Solids with Application to Pre-Stressed Phononic Crystals. Int. J. Solids Struct. 2022, 241, 111529. [Google Scholar] [CrossRef]
  20. Lucklum, R.; Mukhin, N.; Djafari Rouhani, B.; Pennec, Y. Phononic Crystal Sensors: A New Class of Resonant Sensors—Chances and Challenges for the Determination of Liquid Properties. Front. Mech. Eng. 2021, 7, 705194. [Google Scholar] [CrossRef]
  21. Miao, L.; Li, C.; Lei, L.; Fang, H.; Liang, X. A New Periodic Structure Composite Material with Quasi-Phononic Crystals. Phys. Lett. A 2020, 384, 126594. [Google Scholar] [CrossRef]
  22. Thorp, O.; Ruzzene, M.; Baz, A. Attenuation and Localization of Wave Propagation in Rods with Periodic Shunted Piezoelectric Patches. Smart Mater. Struct. 2001, 10, 979–989. [Google Scholar] [CrossRef]
  23. Kim, Y.; Baz, A.M. Active Control of a Two-Dimensional Periodic Structure. In Proceedings of the Smart Structures and Materials 2004: Damping and Isolation, San Diego, CA, USA, 29 July 2004; Volume 5386, pp. 329–339. [Google Scholar]
  24. Hsu, J.-C. Switchable Frequency Gaps in Piezoelectric Phononic Crystal Slabs. Jpn. J. Appl. Phys. 2012, 51, 07GA04. [Google Scholar] [CrossRef]
  25. Ruzzene, M.; Baz, A. Active Control of Wave Propagation in Periodic Fluid-Loaded Shells. Smart Mater. Struct. 2001, 10, 893–906. [Google Scholar] [CrossRef]
  26. Gripp, J.A.B.; Rade, D.A. Vibration and Noise Control Using Shunted Piezoelectric Transducers: A Review. Mech. Syst. Signal Processing 2018, 112, 359–383. [Google Scholar] [CrossRef]
  27. Gozum, M.M.; Aghakhani, A.; Basdogan, I. An Investigation of the Electromechanical Coupling and Broadband Shunt Damping in Composite Plates with Integrated Piezo-Patches. J. Intell. Mater. Syst. Struct. 2019, 30, 3008–3024. [Google Scholar] [CrossRef]
  28. Ren, T.; Liu, C.; Li, F.; Zhang, C. Active Tuning of the Vibration Band Gap Characteristics of Periodic Laminated Composite Metamaterial Beams. J. Intell. Mater. Syst. Struct. 2020, 31, 843–859. [Google Scholar] [CrossRef]
  29. Liu, P.; Zuo, S.; Wu, X.; Sun, L.; Zhang, Q. Study on the Vibration Attenuation Property of One Finite and Hybrid Piezoelectric Phononic Crystal Beam. Eur. J. Mech. A/Solids 2020, 84, 104017. [Google Scholar] [CrossRef]
  30. Zhou, W.; Muhammad; Chen, W.; Chen, Z.; Lim, C.W. Actively Controllable Flexural Wave Band Gaps in Beam-Type Acoustic Metamaterials with Shunted Piezoelectric Patches. Eur. J. Mech. A/Solids 2019, 77, 103807. [Google Scholar] [CrossRef]
  31. Espo, M.; Abolbashari, M.H.; Hosseini, S.M. Band Structure Analysis of Wave Propagation in Piezoelectric Nano-Metamaterials as Periodic Nano-Beams Considering the Small Scale and Surface Effects. Acta Mech. 2020, 231, 2877–2893. [Google Scholar] [CrossRef]
  32. Qureshi, E.M.; Shen, X.; Chen, J. Piezoelectric Shunt Damping by Synchronized Switching on Negative Capacitance and Adaptive Voltage Sources. Int. J. Aeronaut. Space Sci. 2014, 15, 396–411. [Google Scholar] [CrossRef] [Green Version]
  33. Bacigalupo, A.; De Bellis, M.L.; Misseroni, D. Design of Tunable Acoustic Metamaterials with Periodic Piezoelectric Microstructure. Extrem. Mech. Lett. 2020, 40, 100977. [Google Scholar] [CrossRef]
  34. Zhang, H. Study on Sound Insulation Properties of Piezoelectric Shunt Acoustic Metamaterial. Ph.D. Thesis, National University of Defense Technology, Changsha, China, 2016. [Google Scholar]
  35. Petyt, M. Introduction to Finite Element Vibration Analysis. J. Sound Vib. 2010, 242, 103–124. [Google Scholar] [CrossRef]
  36. Dieulesaint, E. Elastic Waves in Solids I. Springer Berl. 2000, 4, 673–684. [Google Scholar] [CrossRef]
  37. Narisetti, R.K.; Ruzzene, M.; Leamy, M.J. A Perturbation Approach for Analyzing Dispersion and Group Velocities in Two-Dimensional Nonlinear Periodic Lattices. J. Vib. Acoust. 2011, 133, 061020. [Google Scholar] [CrossRef]
  38. Scarpa, F.L.; Ruzzene, M.; Soranna, F. Wave Beaming Effects in Bidimensional Cellular Structures. In Proceedings of the Smart Structures and Materials 2002: Damping and Isolation, San Diego, CA, USA, 18–20 March 2002; Volume 4697, pp. 63–77. [Google Scholar]
  39. Li, J.; Yang, P.; Ma, Q.; Xia, M. Complex Band Structure and Attenuation Performance of a Viscoelastic Phononic Crystal with Finite Out-of-Plane Extension. Acta Mech. 2021, 232, 2933–2954. [Google Scholar] [CrossRef]
  40. Bonhomme, J.; Oudich, M.; Segura Chavez, P.A.; Bellaredj, M.L.F.; Bryche, J.-F.; Beyssen, D.; Charette, P.G.; Sarry, F. Numerical Characterization of Love Waves Dispersion in Viscoelastic Guiding-Layer under Viscous Fluid. J. Appl. Phys. 2020, 128, 154502. [Google Scholar] [CrossRef]
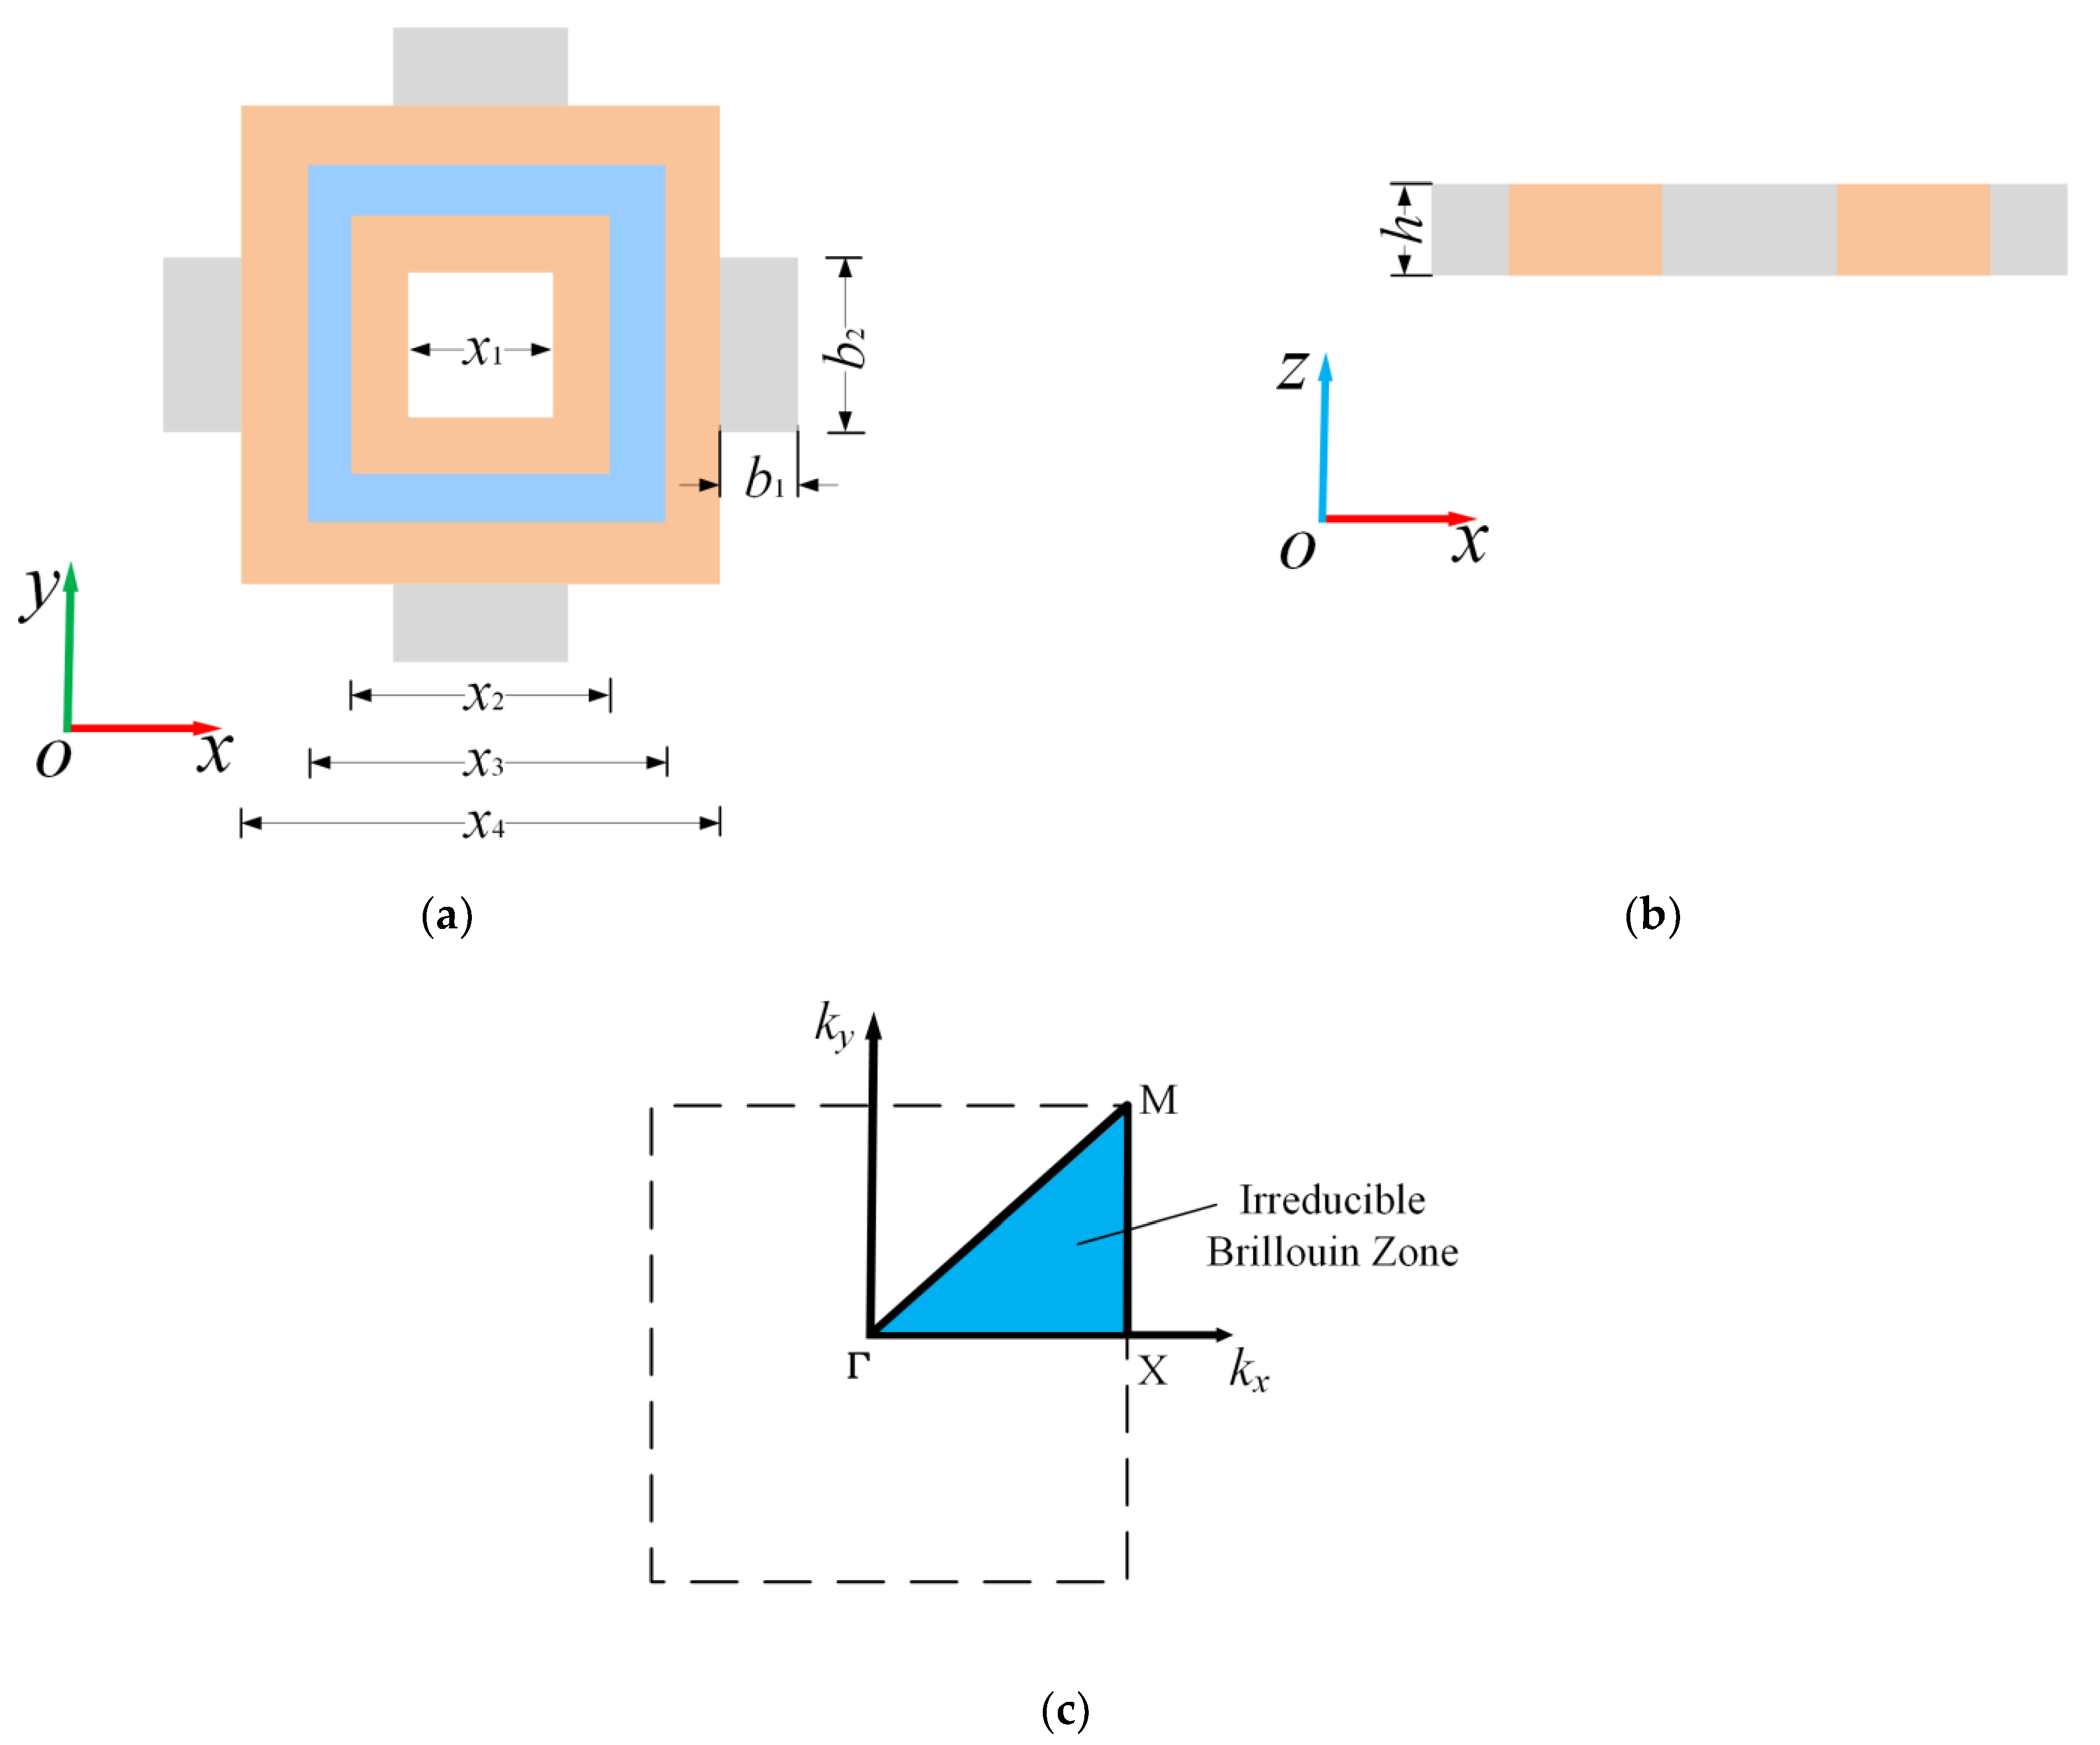
Figure 1. Piezoelectric phononic crystal configuration: (a) x-y plane projection; (b) x-z plane projection; (c) The first Brillouin Zone and the Irreducible Brillouin Zone.
Applsci 12 07021 g001
Figure 2. The classifications of nodes when using Bloch Floquet conditions.
Applsci 12 07021 g002
Figure 3. Band structure of the proposed piezoelectric phononic crystal.
Applsci 12 07021 g003
Figure 4. Vibration modes of the first and second bandgap edges: (a) Point A; (b) Point B; (c) Point C; (d) Point D.
Applsci 12 07021 g004
Figure 5. Vibration modes of the third and fourth bandgap edges: (a) Point E; (b) Point F; (c) Point G; (d) Point H.
Applsci 12 07021 g005
Figure 6. Iso-frequency curves of the proposed piezoelectric phononic crystal.
Applsci 12 07021 g006
Figure 7. (a) Band structure in the ΓX direction; (b) Attenuation constant in the ΓX direction.
Applsci 12 07021 g007
Figure 8. (a) Finite length piezoelectric phononic crystal; (b) The employed external circuit.
Applsci 12 07021 g008
Figure 9. Transmission loss of the finite length piezoelectric phononic crystal.
Applsci 12 07021 g009
Figure 10. (a) Band structure in the MΓ direction; (b) Attenuation constant in the MΓ direction.
Applsci 12 07021 g010
Figure 11. The directionality of elastic wave attenuation.
Applsci 12 07021 g011
Figure 12. Effects of thickness on the upper and lower boundaries of each bandgap.
Applsci 12 07021 g012
Figure 13. Influences of square hollow side length on the relative bandwidth.
Applsci 12 07021 g013
Table 1. Material constants of the elastic and piezoelectric components.
Material ParametersPiezoelectric MaterialElastic Materials
PZT-5HIronEpoxy
ρ (kg/m3)750078701200
Em (Pa)-200 × 1092.8 × 109
υ-0.290.39
C11 (GPa)127.205--
C12 (GPa)80.212--
C13 (GPa)84.670--
C22 (GPa)127.205--
C23 (GPa)84.670--
C33 (GPa)117.436--
C44 (GPa)22.989--
C55 (GPa)22.989--
C66 (GPa)23.474--
e15 (C/m2)17.035--
e24 (C/m2)17.035--
e31 (C/m2)−6.623--
e32 (C/m2)−6.623--
e33 (C/m2)23.240--
ε11 (F/m)1.509 × 10−8--
ε22 (F/m)1.509 × 10−8--
ε33 (F/m)1.269 × 10−8--
Table 2. Geometric characteristics of the established piezoelectric phononic crystal.
ParametersDescriptionsValue
b1 (mm)The width of the convex structures20
b2 (mm)The length of the convex structures40
x1 (mm)The side length of the square hollow30
x2 (mm)The side length of the internal hard material56
x3 (mm)The side length of the piezoelectric material80
x4 (mm)The side length of the outer hard material100
h (mm)The thickness of the phononic crystal16.67
Table 3. Multiple bandgaps with different values of the square hollow side length x1.
x1 (mm)1st Gap2nd Gap3rd Gap4th Gap
10[2260.10, 3886.33][4066.74, 5283.68][6775.12, 7554.94][11091.72, 15008.91]
20[2261.77, 3667.03][3850.89, 5077.89][6522.89, 7234.90][7686.61, 7947.03]
30[2268.89, 3356.36][3547.67, 4795.41][6204.55, 6894.88][7345.23, 7877.57]
40[2345.95, 2992.60][3196.86, 4456.71][5852.81, 6560.45][7046.26, 7718.97]
50[2457.48, 2649.43][2870.53, 4077.25][5465.80, 6213.06][8238.10, 8676.57]
Publisher’s Note: MDPI stays neutral with regard to jurisdictional claims in published maps and institutional affiliations.