Article

Would Forest Regrowth Compensate for Climate Change in the Amazon Basin?

by
Nafiseh Haghtalab
1,*,
Nathan Moore
2,* and
Pouyan Nejadhashemi
3
1
Department of Geography and Anthropology, Kennesaw State University, Kennesaw, GA 30144, USA
2
Department of Geography, Environment and Spatial Sciences, Michigan State University, East Lansing, MI 48824, USA
3
Department of Biosystems and Agricultural Engineering, Michigan State University, East Lansing, MI 48824, USA
*
Authors to whom correspondence should be addressed.
Appl. Sci. 2022, 12(14), 7052; https://doi.org/10.3390/app12147052
Submission received: 13 June 2022 / Revised: 10 July 2022 / Accepted: 11 July 2022 / Published: 13 July 2022
(This article belongs to the Special Issue Advancing Complexity Research in Earth Sciences and Geography)

Abstract

:
Following potential reforestation in the Amazon Basin, changes in the biophysical characteristics of the land surface may affect the fluxes of heat and moisture behavior. This research examines the impacts of potential tropical reforestation on surface energy and moisture budgets, including precipitation and temperature. The study is novel in that while most studies look at the opposite driver (deforestation), this one examines the impact of potential forest rehabilitation on atmospheric behavior using WRF.V3.9 (weather research and forecast model). We found that forest rehabilitation across the Amazon Basin can make the atmosphere cooler with more moisture and latent heat (LH), especially during May-November. For instance, the mean seasonal temperature decreased significantly by about 1.2 °C, indicating the cooling effects of reforestation. Also, the seasonal precipitation increased by 5 mm/day in reforested areas. By reforestation, the mean monthly LH also increased as much as 50 W m−2 in August in certain areas, while available moisture to the atmosphere increased by 27%, indicating possible causal mechanisms between increased LH and precipitation and emphasizing the mechanisms that were identified between the onset of the wet season and forest cover. Therefore, it is likely that forest regrowth across the basin leads to, if not reverses regional climate change, at least slowing down the rate of changes in the climate.

1. Introduction

The land surface plays an important role in global energy, the hydrologic cycle, and carbon balance. Land cover change (LCC) directly alters surface-absorbed solar radiation, longwave radiation, and atmospheric turbulence. These alterations lead to changes in fluxes of momentum, heat, and water vapor through the mediation of albedo, evapotranspiration (ET), roughness, and CO2 [1,2]. Land cover changes through atmospheric feedback can have a striking impact on the local, regional, and even global mean climate as well as climatic extremes and variability [3].
While 25 to 35% of Amazon precipitation is related to regional moisture recycling [4], during the rainy season, moist air from the basin travels along the Andes and provides precipitation over the La Plata basin too [5,6] through tele-connection processes. Therefore, any changes to land surface biophysical characteristics, even at the local scale, may alter the climate over the entire basin.
LCC in the Amazon basin has been studied to be one of the driving forces for climate change [7,8]. It affects the energy, carbon and water balance, and land-atmosphere interactions. It alters evapotranspiration and the hydrologic cycle more broadly which further affects Amazon rainforest stability [9], primarily through a reduction in moisture recycling [10,11]. Such changes have been investigated across the Amazon basin using global and regional climate models: notably, via complete deforestation scenarios e.g., [12,13,14,15,16] or scenarios ranging from low to extreme conversion of forest e.g., [17,18].
The conversion of forest to cropland in the Amazon Basin has resulted in a decrease in precipitation (P) [15], a decrease in ET [19,20], an increase in temperature (T) [18], and also indirectly intensifies fire occurrence [21]. Due to deforestation, the onset of the rainy season has also delayed 11 days, on average, over the last thirty years across the highly deforested areas in the state of Rondonia, Brazil [19]. In addition, the length of the dry season has been increased by one month in some areas [22,23,24,25,26] and drought conditions have also been exacerbated as a result of deforestation [27,28,29].
The spatial scale of LCC from local to regional to global is very important in land-atmosphere interaction analysis [30,31]. The most recent deforestation in the Amazon basin occurred at small-scale patches (less than 1 ha) during 2008–2014 [27]. In addition, the temporal scale of analysis is also important in understanding the magnitude and amplitude of the effects. For instance, Ref. [28] found that the impact of land surface variability on climate is more apparent at monthly timescales than at other timescales. Ref. [29] analyzed the interactions between clouds, rains, and the underlying land surface through biosphere processes in southwestern Rondônia, Brazil. They found that land-atmosphere interactions are higher during the dry season (May–November) than the wet season (December-April). They also hypothesized more complex interactions between cloudiness, moisture transport, and fluxes during the wet season.
When considering the effects of LCC at the basin scale, the land-atmosphere interaction is more intense [22]. For instance, Ref. [30] used IPCC CMIP3 models and found an increase in the annual mean temperature between 0.1 and 3.8 °C and a decrease in the annual precipitation of about 10–30% which could lead to changes in seasonality. Also, Ref. [11] argued that upon reaching 40% reduction in Amazon forest cover, wet and dry season rainfall totals may reduce by 12% and 21%, respectively. However, the magnitude and the location of rainfall changes is uncertain [31,32].
Ref. [14] also used a GCM to capture the climate response to Amazon deforestation. They found that the sensitivity of climate to LCC depends on the initial tree cover and type of irrigation. Using satellite observations to assess crop responses to drought in the basin, Refs. [33,34] found that due to reduced cloud cover, droughts induce a “greening-up” although other researchers have rejected this hypothesis, e.g., [35,36,37]. According to Ref. [35], analysis and model simulations of the impacts of Amazon deforestation over the past 40 years showed that more than 90% of studies agree on the sign of change which is a reduction in rainfall. But the amplitude, magnitude, and predictability are inconsistent since they highly depend on the spatio-temporal scale of analysis [15,36,37,38,39,40,41,42,43].
Even if the regional impacts of deforestation on precipitation patterns have been studied intensively e.g., [8,21,28,44,45,46,47], the reverse effects are still unclear. Therefore, in this study, we aim to examine the extent to which potential Amazon Forest regrowth may influence fluxes, precipitation, and temperature patterns during both wet (December–April) and dry seasons (May–November). We should note that wet and dry seasons are not consistent across the domain, but these timespans are a practical compromise for analysis.
Thus, in this research, we examined the sensitivity and magnitude of changes to the surface energy budget, including precipitation, due to potential new growth forests across the Amazon Basin (Figure 1). Our prescribed reforestation scenario using the Weather Research and Forecasting model (WRF)V3.9 is designed to answer the following questions: (a) How might forest regrowth contribute to changes in fluxes, temperature, and precipitation amounts across the basin at monthly and seasonal timescales; (b) what are the spatio-temporal patterns of changes; and (c) Do any tele-connected processes develop due to forest rehabilitation?

2. Materials and Methods

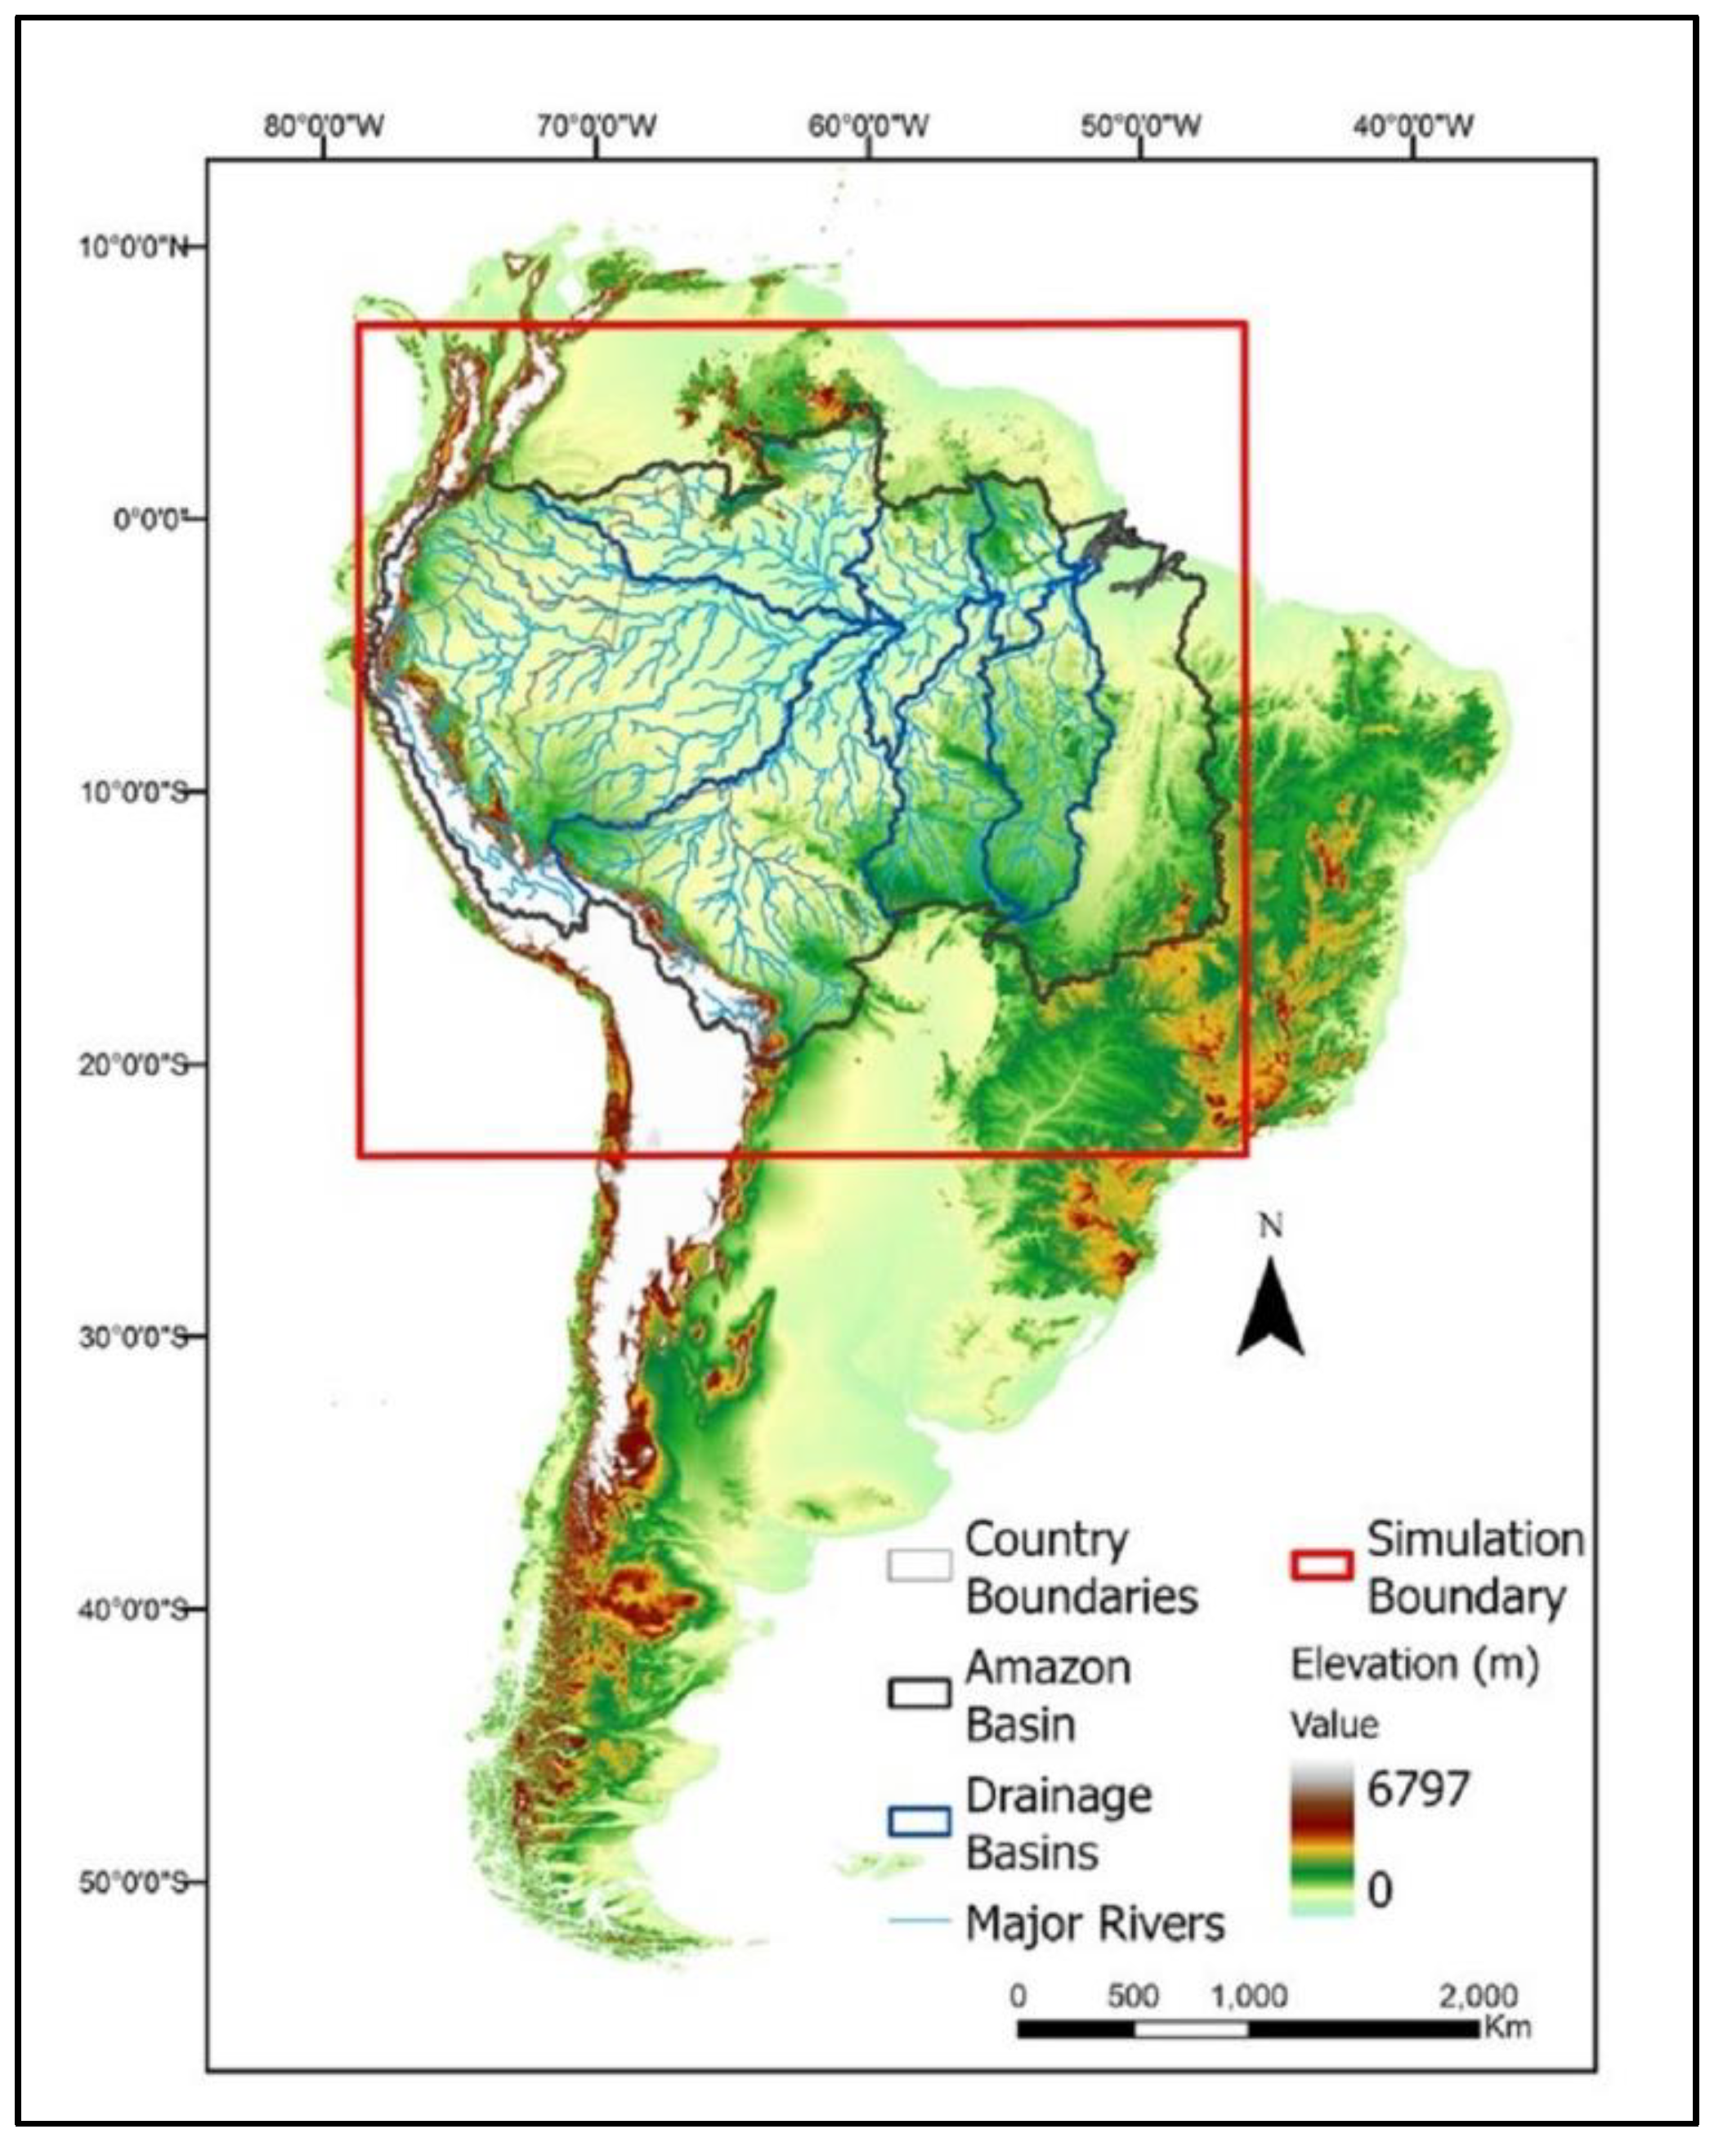
2.1. Study Area and Simulation Domain

Figure 1 shows the topography of the Amazon Basin along with our simulation boundary. The Amazon Basin extends through Brazil, Peru, Colombia, Ecuador, and Bolivia covering about 6 million km2. The rainiest part of the basin is located on the eastern edge of the Andes Cordillera [48,49]. The Amazon Basin contains more than 20% of the world’s fresh water and is a hot-spot for ecosystem diversity. The forest biomass holds an estimated 100 billion tons of carbon [50].
The basin’s climate varies from continuously rainy in the northwest to long dry seasons in the east and south [51,52], where more conversion to agriculture has occurred. This is referred to as the “Arc of Deforestation”. The basin’s climate is controlled by atmosphere-ocean-land coupling as well as moisture recycling through evapotranspiration [53]. The El Nino Southern Oscillation (ENSO) decreases the Amazon River flow on the eastern side of the basin during El Nino years [54] while, during La Nina years, flooding increases [55]. The Southern American Monsoon System brings rainfall to the southern portion of the basin with the maximum rainfall during DJF (December-January-February) [56]. During JJA (June-July-August) the South American Convergence Zone (SACZ) contributes to the precipitation variability across the south of the Basin [57]. During MAM (March-April-May), rainfall is dominated by the Intertropical Convergence Zone (ITCZ), which is highly variable [58].

2.2. Data

We forced WRF with ESA 2009 land cover data which was reclassified based on US Geological Survey land cover classes to match the WRF settings and mosaicked to account for differences in resolution. The land cover was kept constant over the simulation years; this is a prescribed simulation, so we needed to control for annual land cover variations from our analysis. We choose 2009 to be consistent with our boundary layer data starting in 2009. For vertical boundary conditions, ERA_Interim with 80 km spatial resolution and 60 vertical levels, and 6-hourly temporal resolution for 2009, 2013, and 2014 were used to force the model. These years are among the most recent ENSO-neutral years and the data was more homogenous in terms of extreme events and outliers than other neutral years.
Due to the lack of adequate and robust observational information on precipitation and temperature that poses great difficulties in validating our climate model outputs, we used Tropical Rainfall Measuring Mission (TRMM) with a 0.25° spatial resolution and MODIS Land-Surface Temperature with a 1 km spatial resolution to validate the simulated temperature. All data were resampled based on the model output resolution.

2.3. WRF Model Setup

WRF.3.9 (ARW) is a three-dimensional, non-hydrostatic climate model that is widely used for atmospheric research. Simulations were initialized at 00:00 UTC and the first 15 days were considered spin-up and were removed from the analysis. Early trials using longer spin-up proved to be computationally expensive and unlikely to significantly affect the sensitivity tests. The horizontal grid spacing was 16 km, with 38 levels of vertical levels up to 1000 m. The thickness of the lowest atmospheric layer is about 50 m on smooth topography. At this resolution, cumulus parameterization is necessary to resolve convection, clouds, and precipitation properly [59]. Table 1 summarizes WRF parameterizations that were used in this study. SSTs (sea surface temperature) came from ERA data to be time-consistent with the vertical boundary conditions.
To quantify the model performance, we calculated the root-mean-square error (RMSE) and the systematic error (percent bias; PBias) on the areal basin mean of daily data. We also mapped the differences between the model outputs and observations at monthly and seasonal timescales to estimate model performance and examine the errors spatially. We resampled our observations based on the simulation outputs to eliminate spatial resolution discrepancies in our data and comparison.

2.4. Land Cover Change Scenario

The last 50 years have witnessed a rapid conversion of forest to pasture and soy agriculture, driven by new road building. For deforested areas, this has brought reduced soil moisture, higher SH, seasonally bare soils, higher albedos, and lowered zero-plane displacement heights. Figure 2 shows maps of current and reforested land cover that was used in this study to analyze the sensitivity of the atmosphere to deforestation across the Amazon Basin. In this study, only conversion from cropland to forest has been considered; cropped cerrado was not changed. Every grid cell which was primarily cropland has been replaced by mature evergreen rainforest (although this is complex in the southeastern domain). This conversion is dominant along the arc of deforestation and on the main stem of the Amazon River.

3. Results and Discussion

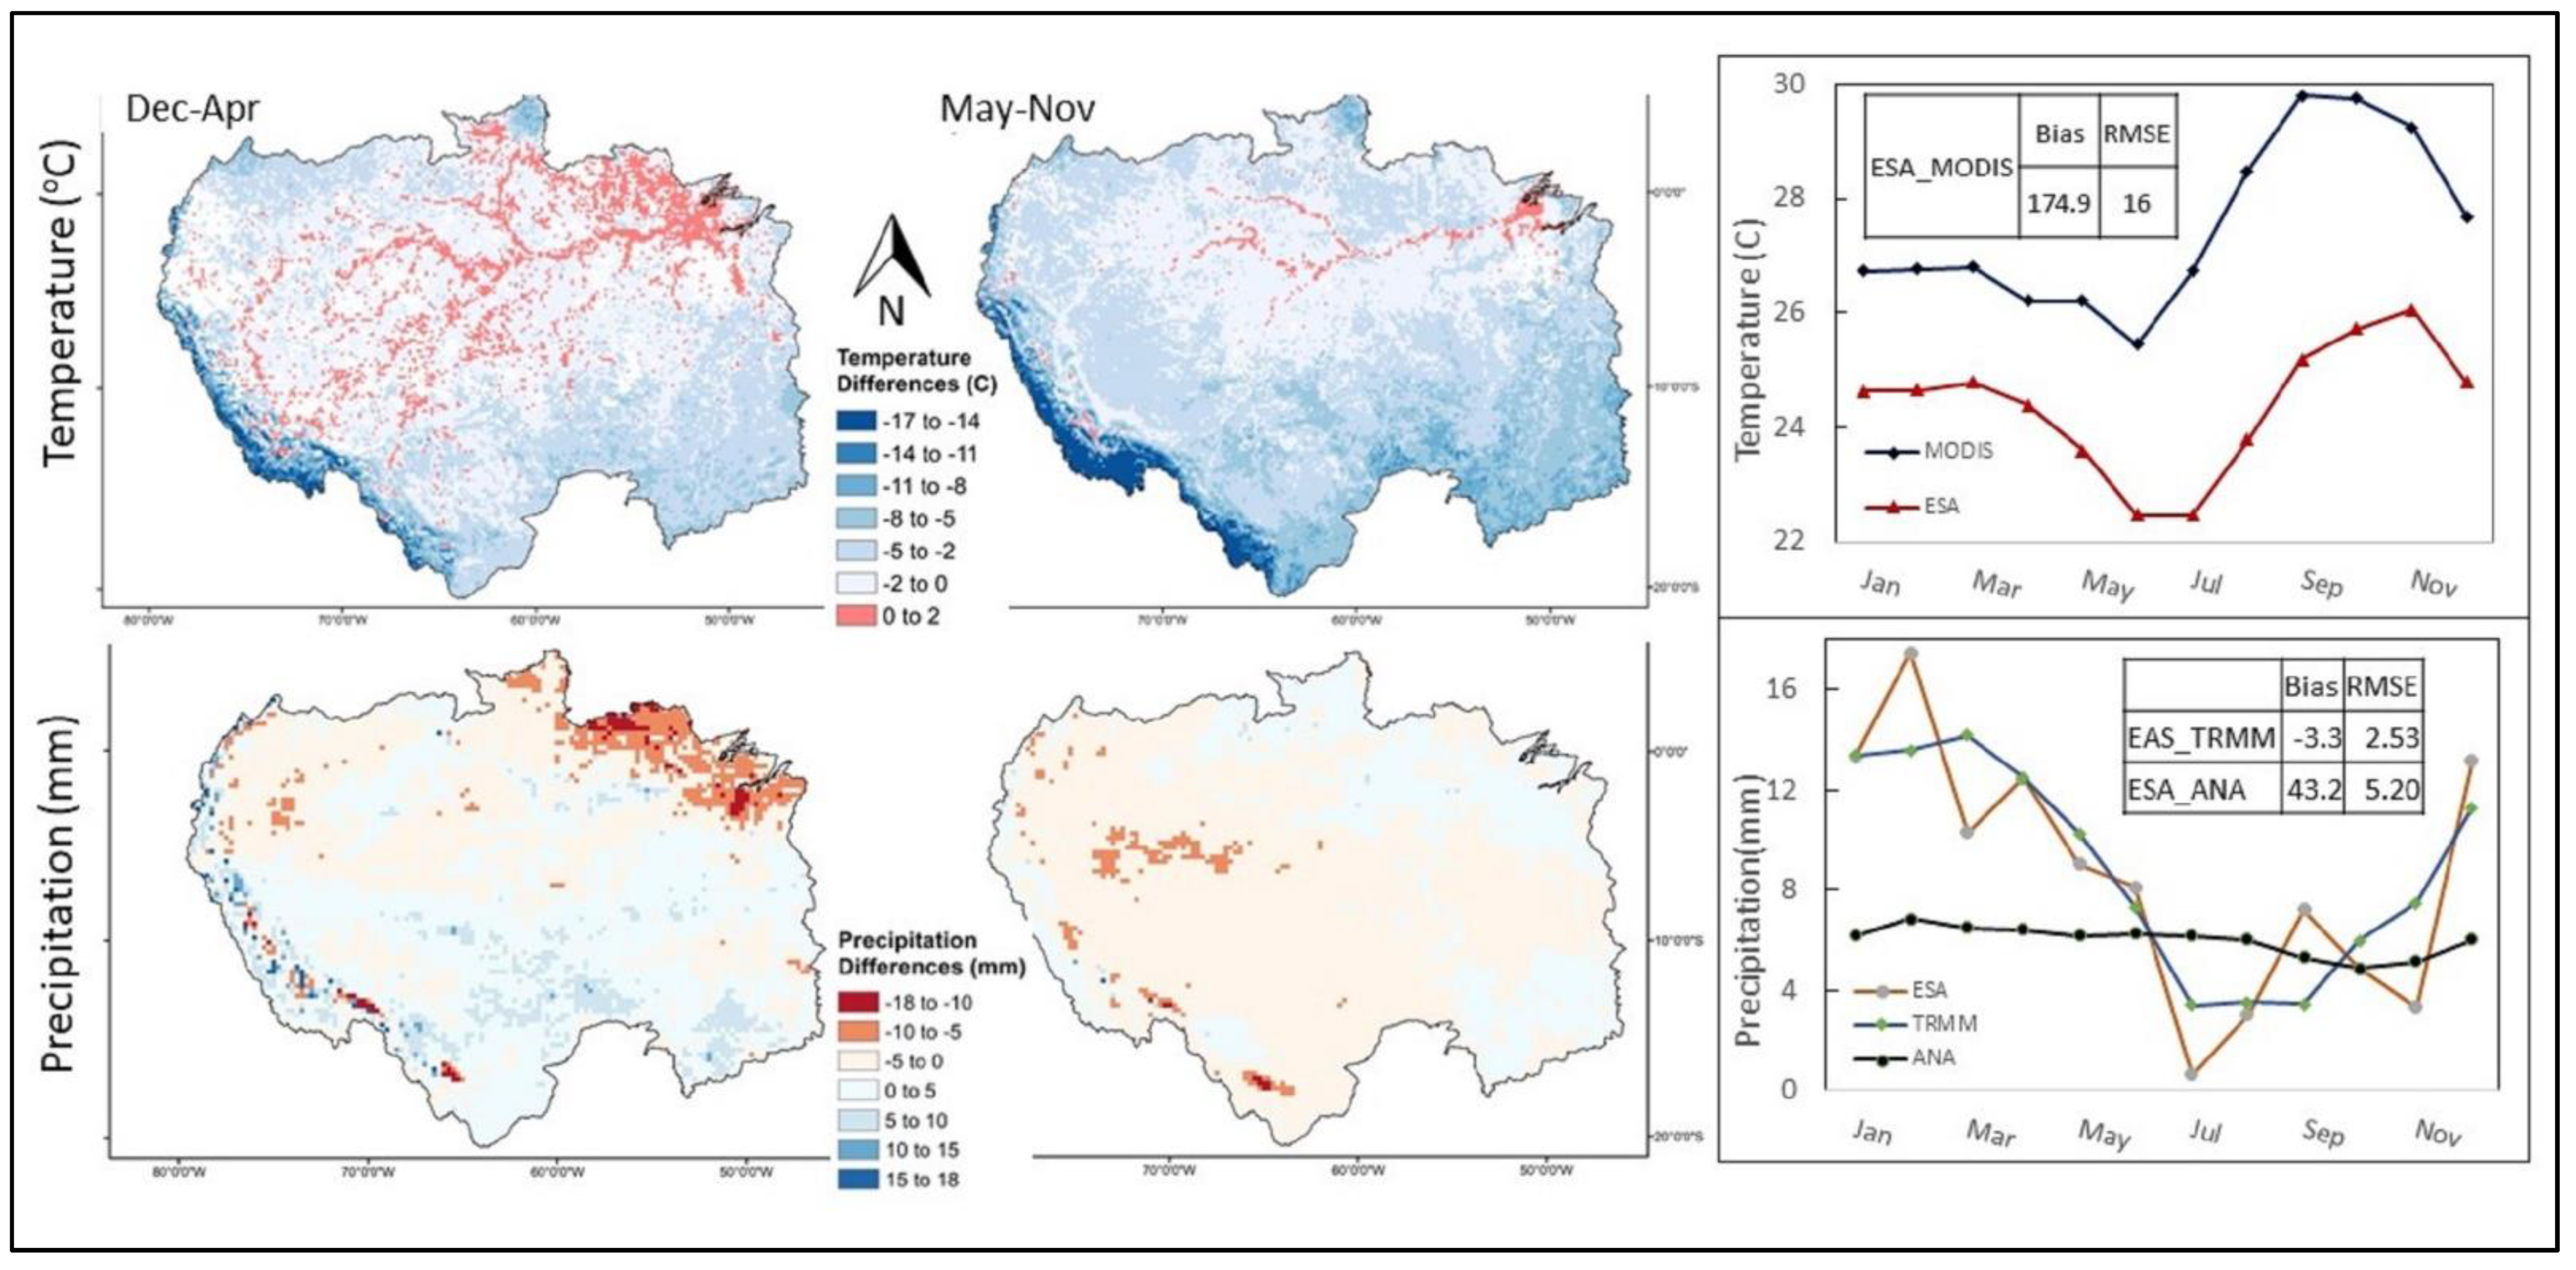
3.1. Model Validation

Figure 3 shows RMSE and Pbias errors for both precipitation and temperature. We validated the simulated precipitation against Brazilian Federal hydro-meteorological network (ANA) rain gauge measurements and TRMM reanalysis precipitation data and compared basin-wide averages. As stated before, due to high levels of missing values in ANA data, we removed them from our analysis. They are shown in this image only to highlight the shortcomings of some ANA data.
Looking at temperature, the model performed very well with deviations at most 2 degrees centigrade cooler than the observations for most of the basin. Only at high altitudes over complex terrain on the edges did the model underestimate the temperature by up to −17 °C. This error is consistent with WRF’s well-known cold bias at high altitudes [60]. Also, along water bodies, the model simulated up to 2 degrees warmer than observations. Our model performed well in simulating the precipitation, too. Due to complex interactions between cloudiness, the land surface, and precipitation in the Amazon Basin [61] during the wet season (December–April), the model overestimates precipitation for the arc of deforestation by up to 5 mm/day compared to the observations. In terms of basin average, the temperature is simulated with the same spatial pattern as MODIS temperature but 1 °C cooler. Simulated precipitation shows broadly the same pattern as TRMM precipitation. The RMSE and Bias are reported in Figure 3 which are minimal and acceptable.

3.2. Sensitivity of Fluxes and Precipitation to Land Cover Change across the Basin
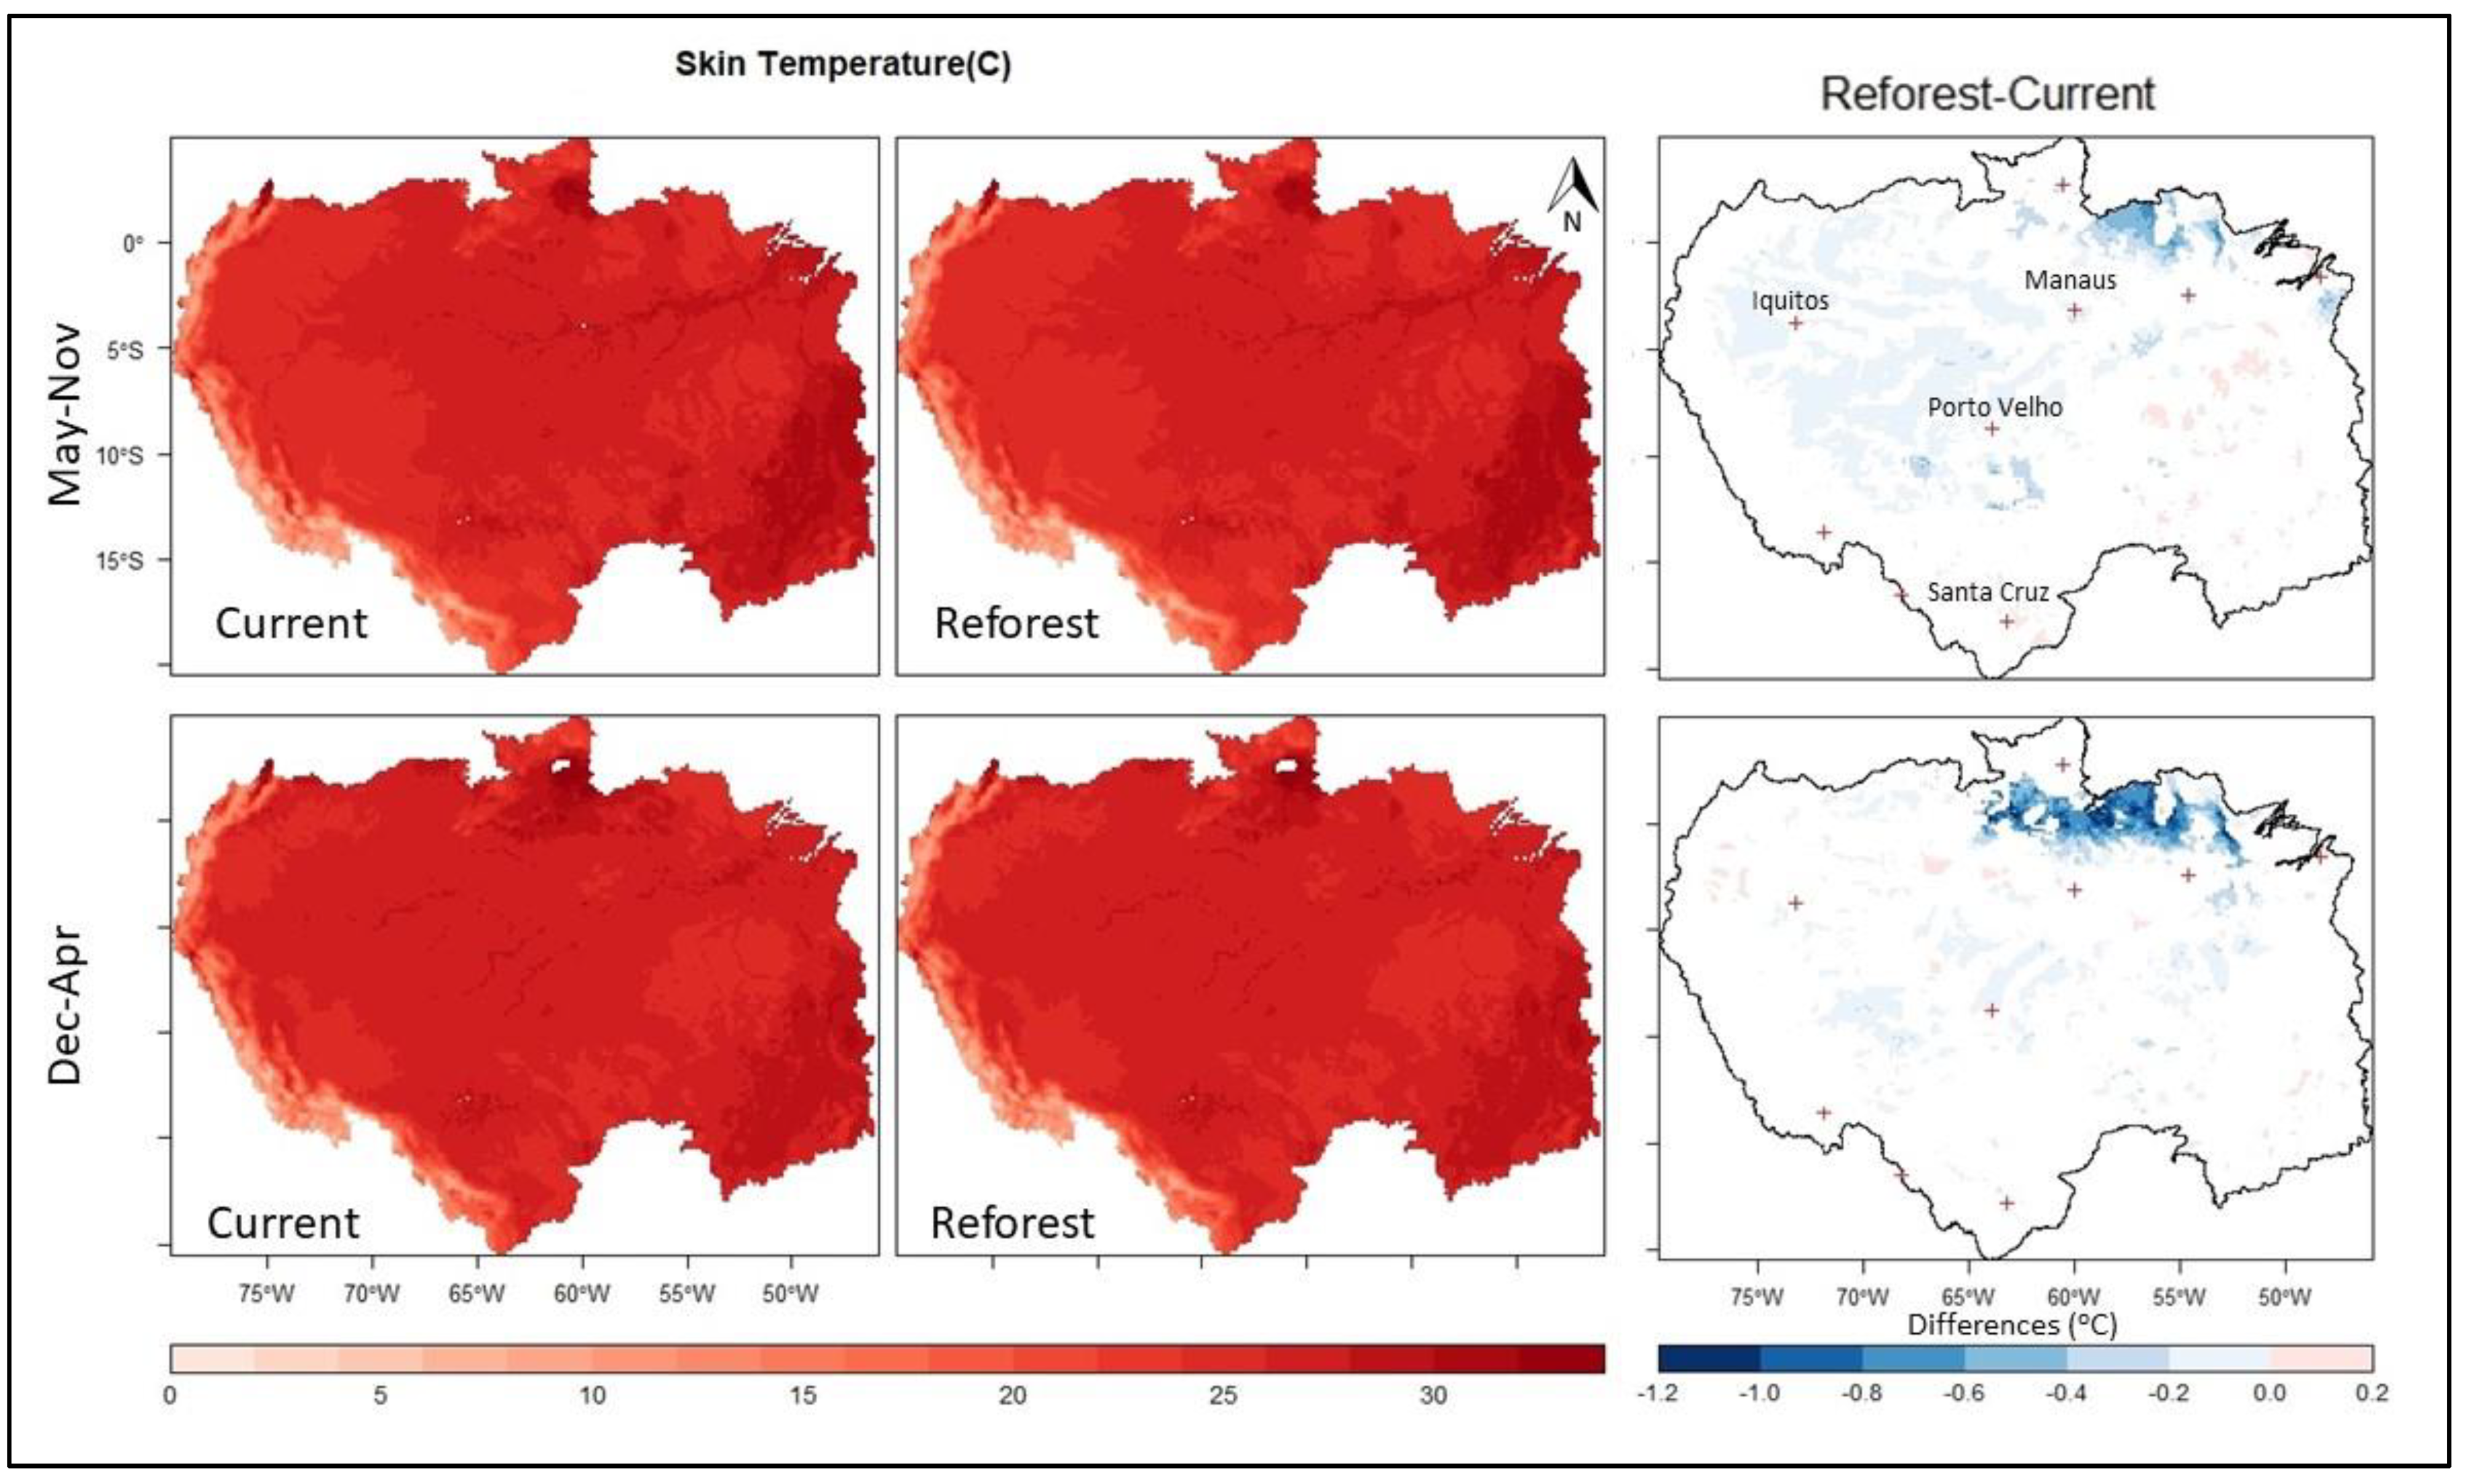
The results that are shown here are averaged across the three years of simulation. To assess the impacts of regrowth on fluxes and precipitation, we applied a Student t-test for each season spatial time series at each grid point (over space and time). In this test, the null statistical hypothesis is that the reforested and current population had the same mean [44]. Each grid point that could reject the null hypothesis at a 95% significance level is considered to have experienced a significant impact from the reforestation process. Although we used ENSO-neutral years, there exists interannual variability across the three years, and both positive and negative changes resulted from the model in response to reforestation.

3.2.1. Heat Flux

Figure 4 and Figure 5 show the effects of LCC on LH and sensible heat (SH) (only significant changes are shown here). According to Figure 4, the LH has increased by 30 Wm−2 during May–November and by 15 Wm−2 during December–April despite some extreme increases in the north side of the region. We found no pronounced negative changes in the domain-averaged mean SH across the region with reforestation. As the land surface has a complex relationship with the atmosphere, SH did not show significant sensitivity to changes in the land surface biophysical characteristics at a seasonal scale. There is only the northeast area of the basin which shows a significant decreasing trend for SH with reforestation. This decrease is the highest in December–April which is geographically consistent with the highest increase in LH during the same time period.
Next, we looked at monthly changes. For regions with added tree cover, the LH has increased by 20, 50, and 30 Wm−2 in July, August, and September, respectively. SH shows a decrease of 10 Wm−2 in August and September at the same location. These months are in the dry season, therefore, an increase in the LH can provide more moisture to the environment if other criteria are met. By adding more vegetation cover through reforestation or forest rehabilitation, the transpiration rate and surface roughness increased leading to an increase in the LH and a decrease in SH. Since July has the highest LAI in the basin and it decreases toward the end of the year, we found the highest influence of LCC on exchanges of both SH and LH starting in July.
The effects of LCC on the temperature are spatially different in May–November and December–April. Reforestation decreased the surface temperature by about 1.2 °C in the northeast part of the basin and about 0.2 °C on the west side of the basin (Figure 6), far from the reforested areas. The increased ET drives a significant increase in the cloud cover that gets advected westward. The cooling effect of reforestation is clearer on a monthly scale, especially in Aug and Sept by about 2 °C. This finding is consistent with Ref. [38] who found 2 °C warmer air temperatures as a result of deforestation, as well as Ref. [18] who found 0.3 °C warmer surface temperatures due to deforestation of the Xingu region along the arc of deforestation.

3.2.2. Moisture Flux and Precipitation

Our results showed that reforestation significantly increased the domain-averaged available moisture to the atmosphere (QFX) (Figure 7), mostly during May–November, by 27%. The maximum increase in moisture flux occurred in August and September, about 0.03 g m−2 s−1, especially in the arc of deforestation which has had significant widespread deforestation. However, other heavily deforested areas of the basin (along the rivers in the centroid of the basin, and near Iquitos) did not exhibit significant changes in moisture flux. These regions receive much more rainfall and have virtually no dry season. The QFX value of 0.01 g m−2 s−1 in the difference panel of Figure 7 converts to approximately 25 mm/month of precipitation, which is at the upper end of the RMSE that was measured by global ET products [62].
Simulated precipitation data showed that the mean seasonal precipitation increased with forest regrowth by 5 mm/day (Figure 8). During May–November, these changes are spatially located on the west side of the region where the moisture gets transferred making more cloud fractions indicating the tele-connection impacts of reforestation on precipitation, as discussed in Ref. [63]. According to Ref. [19] precipitation is produced by both large and small-scale forcings, including thunderstorms and the development of deep convection at a larger scale and through shallow convection at a local scale. During December–April across the basin, Rossby waves can propagate northward and produce precipitation. Squall lines originating on the northeast coast of South America transport moisture and precipitation west toward the Andes. At larger scales, although the positioning and strength of the ITCZ control different precipitation regimes in the region, El Nino can affect the Walker-type circulations and can thus affect the spatial distribution of rainfall [64,65]. Therefore, the amount of rainfall is likely more dependent on synoptic-scale forcings such as the ITCZ and Walker-type cells and less on localized reforestations. Reforestation provides moisture, but larger processes typically initiate rainfall.
Thus, following potential reforestation in the Amazon Basin, changes in the biophysical characteristics of the land surface can affect the fluxes of heat and moisture behavior. As such, forest rehabilitation across the Amazon Basin can make the atmosphere cooler with more moisture and LH, especially during May–November. In addition, some laterally translated features suggest that land cover creates perturbations that get advected elsewhere, and large patterns also exist that suggest continent/synoptic-scale processes are being modified as a result of deforestation. This suggests complex interactions between climate and LCC that we will explore in future work.

4. Conclusions

This paper examines the regional-scale impacts of potential reforestation on the energy and moisture budgets and precipitation across the Amazon Basin. Through the analysis of changes in regional moisture and heat fluxes, we presented results from regional simulations showing that the land surface and atmosphere are interacting tightly across the basin. We found several principal outcomes. First, the effects of reforestation on the atmosphere were more evident during May–November than December-April. Second, spatial patterns of the changes in fluxes due to reforestation were consistent with the pattern of LCC, with minimal tele-connected impacts. Third, the effects of forest regrowth on the atmosphere were more evident on a monthly time scale. For instance, although at the seasonal scale, the changes in SH were minimal, at the monthly scale, it simulated a decrease by 10 W m−2. Forest regrowth enhances LH in the region due to an increase in the transpiration rate and surface roughness. In addition, the highest LAI in July highlights the highest influence of LCC on exchanges of both SH and LH starting in July.
Fourth, the mean seasonal temperature decreased by up to 1.2 °C, which is consistent with several studies, e.g., [18,46,66]. This decrease in temperature is more obvious in the northeastern side of the basin during December–April. Fifth, reforestation also increased the mean monthly LH by as much as 50 W m−2 in August in certain areas, while available moisture to the atmosphere increased by 27%. Other studies found equivalent scale results but due to deforestation e.g., [18,49,67]. Sixth, seasonal precipitation increased by 5 mm/day in reforested areas in both May-Nov and Dec-Apr, illustrating the causal mechanisms between increased LH and precipitation and emphasizing the mechanisms identified between wet season start and forest cover [68,69]. Precipitation also increased in the western side of the region, where is constantly wet, by forest regrowth. This indicates tele-connected influence of vegetation recovery on the atmosphere behavior.
Our results show that by altering the land surface biophysical characteristics—in this case, reforestation—temperature, LH and SH fluxes, moisture at the surface, and precipitation are strongly modified. With a higher proportion of LH, PBL cools down, increases its humidity, and becomes shallower. This further affects the transfer of moisture and energy from the surface to the boundary layer, even influencing transfer to the free atmosphere. Although unavailable, parameters for young moist forests would improve these simulations further. Due to tele-connection mechanisms, changing the exchange of energy and moisture balance between the PBL and the free atmosphere influences tropical convection, impacting the intensity of high-level tropical outflow and providing a mechanism that could affect the extratropics [70]. Consequently, changes in the surface fluxes of energy and moisture due to LCC causes impacts beyond the areas of disturbances. Thus, it would be reasonable if deforestation forces disturbances in the general circulation, including the Hadley and Walker-type circulations; the mechanisms for these disturbances are illustrated in Ref. [67].
Future work needs to focus on identifying the coupling strength of land cover changes to atmospheric processes to identify areas where rainfall is most sensitive to changes in the land surface and examining the extent to which changes in the regional scale can alter the circumstances at the larger scale. Also, different time scales from hourly to daily to monthly evaluations should be considered to distinguish the sensitivity of time-sensitive processes such as cloud formation and convection, which determine the amount and timing of precipitation to reforestation.

Author Contributions

Conceptualization, N.H.; methodology, N.H., N.M. and P.N.; software, N.H.; validation, N.H.; formal analysis, N.H. and N.M.; investigation, N.H., N.M. and P.N.; resources, N.H. and N.M.; data curation, N.H. and N.M.; writing—original draft preparation, N.H.; writing—review and editing, N.H., N.M. and P.N.; visualization, N.H., N.M. and P.N.; supervision, N.H., N.M. and P.N.; project administration, N.M.; funding acquisition, N.M. All authors have read and agreed to the published version of the manuscript.

Funding

This research was funded by NSF INFEWS/T3, grant number 1639115 and Partial support also came from the Department of Geography, Environment, and Spatial Sciences at Michigan State University.

Institutional Review Board Statement

Not applicable.

Informed Consent Statement

Not applicable.

Data Availability Statement

The data that support the funding of this study were acquired from different resources. TRMM reanalysis data are openly available at https://disc.gsfc.nasa.gov/information?keywords=precipitation&page=1&project=TRMM, accessed on 1 February 2020, MODIS temperature data are openly available at https://lpdaac.usgs.gov/products/mod11a1v006/, accessed on 1 February 2020, and ESA land cover data are openly available at http://www.esa-landcover-cci.org/?q=node/164, accessed on 1 February 2020, ERA-Interim boundary data were acquired from NCAR’s Cheyenne repository which is available upon NCAR’s permission. ANA observations data were received from collaborators in Brazil and can be available upon their permission. The simulated data can be available upon reasonable request by the co-corresponding author (NH).

Acknowledgments

We would like to acknowledge high-performance computing support from Cheyenne (DOI:10.5065/D6RX99HX) provided by NCAR’s Computational and Information Systems Laboratory, sponsored by the National Science Foundation. Any opinions, findings, conclusions, or recommendations expressed in this material are those of the authors and do not necessarily reflect the views of the NSF.

Conflicts of Interest

The authors declare no conflict of interest.

References

  1. Pielke, R.A.; Pitman, A.; Niyogi, D.; Mahmood, R.; McAlpine, C.; Hossain, F.; Goldewijk, K.K.; Nair, U.; Betts, R.; Fall, S.; et al. Land Use/Land Cover Changes and Climate: Modeling Analysis and Observational Evidence. Wiley. Interdiscip. Rev. Clim. Chang. 2011, 2, 828–850. [Google Scholar] [CrossRef]
  2. Alkama, R.; Cescatti, A. Climate Change: Biophysical Climate Impacts of Recent Changes in Global Forest Cover. Science 2016, 351, 600–604. [Google Scholar] [CrossRef] [PubMed] [Green Version]
  3. Malhi, Y.; Aragao, L.E.O.C.; Galbraith, D.; Huntingford, C.; Fisher, R.; Zelazowski, P.; Sitch, S.; McSweeney, C.; Meir, P. Hipoacusia Tubotimp’Anica. Concepto Fisiopatol’Ogico. Proc. Natl. Acad. Sci. USA 2008, 106, 20610–20615. [Google Scholar] [CrossRef] [PubMed] [Green Version]
  4. Dirmeyer, P.A.; Schlosser, C.A.; Brubaker, K.L. Precipitation, Recycling, and Land Memory: An Integrated Analysis. J. Hydrometeorol. 2009, 10, 278–288. [Google Scholar] [CrossRef]
  5. Alejandro Martinez, J.; Dominguez, F. Sources of Atmospheric Moisture for the La Plata River Basin. J. Clim. 2014, 27, 6737–6753. [Google Scholar] [CrossRef]
  6. Arraut, J.M.; Satyamurty, P. Precipitation and Water Vapor Transport in the Southern Hemisphere with Emphasis on the South American Region. J. Appl. Meteorol. Climatol. 2009, 48, 1902–1912. [Google Scholar] [CrossRef]
  7. Aragão, L.E.O.C.; Anderson, L.O.; Fonseca, M.G.; Rosan, T.M.; Vedovato, L.B.; Wagner, F.H.; Silva, C.V.J.; Silva Junior, C.H.L.; Arai, E.; Aguiar, A.P.; et al. 21st Century Drought-Related Fires Counteract the Decline of Amazon Deforestation Carbon Emissions. Nat. Commun. 2018, 9, 536. [Google Scholar] [CrossRef]
  8. Sampaio, G.; Nobre, C.; Costa, M.H.; Satyamurty, P.; Soares-Filho, B.S.; Cardoso, M. Regional Climate Change over Eastern Amazonia Caused by Pasture and Soybean Cropland Expansion. Geophys. Res. Lett. 2007, 34, 17709. [Google Scholar] [CrossRef] [Green Version]
  9. Marengo, J.A.; Nobre, C.A.; Tomasella, J.; Cardoso, M.F.; Oyama, M.D. Hydro-Climate and Ecological Behaviour of the Drought of Amazonia in 2005. Philos. Trans. R. Soc. Lond. B Biol. Sci. 2008, 363, 1773–1778. [Google Scholar] [CrossRef] [Green Version]
  10. Betts, R.A.; Cox, P.M.; Collins, M.; Harris, P.P.; Huntingford, C.; Jones, C.D. The Role of Ecosystem-Atmosphere Interactions in Simulated Amazonian Precipitation Decrease and Forest Dieback under Global Climate Warming. Theor. Appl. Climatol. 2004, 78, 157–175. [Google Scholar] [CrossRef]
  11. Spracklen, D.V.; Arnold, S.R.; Taylor, C.M. Observations of Increased Tropical Rainfall Preceded by Air Passage over Forests. Nature 2012, 489, 282–285. [Google Scholar] [CrossRef] [PubMed]
  12. Zhang, K.; de Almeida Castanho, A.D.; Galbraith, D.R.; Moghim, S.; Levine, N.M.; Bras, R.L.; Coe, M.T.; Costa, M.H.; Malhi, Y.; Longo, M.; et al. The Fate of Amazonian Ecosystems over the Coming Century Arising from Changes in Climate, Atmospheric CO2, and Land Use. Glob. Chang. Biol. 2015, 21, 2569–2587. [Google Scholar] [CrossRef] [PubMed]
  13. Lawrence, D.; Vandecar, K. Effects of Tropical Deforestation on Climate and Agriculture. Nat. Clim. Chang. 2014, 5, 27–36. [Google Scholar] [CrossRef]
  14. Marengo, J.A.; Espinoza, J.C. Extreme Seasonal Droughts and Floods in Amazonia: Causes, Trends and Impacts. Int. J. Climatol. 2016, 36, 1033–1050. [Google Scholar] [CrossRef]
  15. Chambers, J.Q.; Artaxo, P. Deforestation Size Influences Rainfall. Nat. Clim. Chang. 2017, 7, 175–176. [Google Scholar] [CrossRef]
  16. Sampaio, G.; Borma, L.S.; Cardoso, M.; Alves, L.M.; von Randow, C.; Rodriguez, D.A.; Nobre, C.A.; Alexandre, F.F. Assessing the Possible Impacts of a 4 °C or Higher Warming in Amazonia. In Climate Change Risks in Brazil; Springer: Cham, Switzerland, 2019; pp. 201–218. [Google Scholar] [CrossRef]
  17. Meehl, G.A.; Washington, W.M.; Collins, W.D.; Arblaster, J.M.; Hu, A.; Buja, L.E.; Strand, W.G.; Teng, H. How Much More Global Warming and Sea Level Rise? Science 2005, 307, 1769–1772. [Google Scholar] [CrossRef] [Green Version]
  18. Badger, A.M.; Dirmeyer, P.A. Climate Response to Amazon Forest Replacement by Heterogeneous Crop Cover. Hydrol. Earth Syst. Sci. 2015, 19, 4547–4557. [Google Scholar] [CrossRef] [Green Version]
  19. Oliveira, P.T.S.; Nearing, M.A.; Moran, M.S.; Goodrich, D.C.; Wendland, E.; Gupta, H. V Trends in Water Balance Components across the Brazilian Cerrado. Water Resour. Res. 2014, 50, 7100–7114. [Google Scholar] [CrossRef] [Green Version]
  20. Spera, S.A.; Galford, G.L.; Coe, M.T.; Macedo, M.N.; Mustard, J.F. Land-Use Change Affects Water Recycling in Brazil’s Last Agricultural Frontier. Glob. Chang. Biol. 2016, 22, 3405–3413. [Google Scholar] [CrossRef]
  21. da Silva, R.R.; Werth, D.; Avissar, R. Regional Impacts of Future Land-Cover Changes on the Amazon Basin Wet-Season Climate. J. Clim. 2008, 21, 1153–1170. [Google Scholar] [CrossRef]
  22. Silvério, D.V.; Brando, P.M.; Macedo, M.N.; Beck, P.S.A.; Bustamante, M.; Coe, M.T. Agricultural Expansion Dominates Climate Changes in Southeastern Amazonia: The Overlooked Non-GHG Forcing. Environ. Res. Lett. 2015, 10, 104015. [Google Scholar] [CrossRef]
  23. Aragão, L.E.O.C.; Malhi, Y.; Barbier, N.; Lima, A.; Shimabukuro, Y.; Anderson, L.; Saatchi, S. Interactions between Rainfall, Deforestation and Fires during Recent Years in the Brazilian Amazonia. Philos. Trans. R. Soc. B Biol. Sci. 2008, 363, 1779–1785. [Google Scholar] [CrossRef] [PubMed]
  24. Butt, N.; De Oliveira, P.A.; Costa, M.H. Evidence That Deforestation Affects the Onset of the Rainy Season in Rondonia, Brazil. J. Geophys. Res. Atmos. 2011, 116, 2–9. [Google Scholar] [CrossRef]
  25. Costa, M.H.; Pires, G.F. Effects of Amazon and Central Brazil Deforestation Scenarios on the Duration of the Dry Season in the Arc of Deforestation. Int. J. Climatol. 2010, 30, 1970–1979. [Google Scholar] [CrossRef]
  26. Marengo, J.A.; Souza, C.M.; Thonicke, K.; Burton, C.; Halladay, K.; Betts, R.A.; Alves, L.M.; Soares, W.R. Changes in Climate and Land Use Over the Amazon Region: Current and Future Variability and Trends. Front. Earth Sci. 2018, 6, 228. [Google Scholar] [CrossRef]
  27. Knox, R.; Bisht, G.; Wang, J.; Bras, R.; Knox, R.; Bisht, G.; Wang, J.; Bras, R. Precipitation Variability over the Forest-to-Nonforest Transition in Southwestern Amazonia. J. Clim. 2011, 24, 2368–2377. [Google Scholar] [CrossRef] [Green Version]
  28. Bagley, J.E.; Desai, A.R.; Harding, K.J.; Snyder, P.K.; Foley, J.A. Drought and Deforestation: Has Land Cover Change Influenced Recent Precipitation Extremes in the Amazon? J. Clim. 2014, 27, 345–361. [Google Scholar] [CrossRef]
  29. Alves, L.M.; Marengo, J.A.; Fu, R.; Bombardi, R.J. Sensitivity of Amazon Regional Climate to Deforestation. Am. J. Clim. Chang. 2017, 06, 75–98. [Google Scholar] [CrossRef] [Green Version]
  30. D’almeida, C.; Vörösmarty, C.J.; Hurtt, G.C.; Marengo, J.A.; Dingman, S.L.; Keim, B.D. The Effects of Deforestation on the Hydrological Cycle in Amazonia: A Review on Scale and Resolution. Int. J. Climatol. 2007, 27, 633–647. [Google Scholar] [CrossRef]
  31. Pitman, A.J.; Lorenz, R. Scale Dependence of the Simulated Impact of Amazonian Deforestation on Regional Climate. Environ. Res. Lett. 2016, 11, 094025. [Google Scholar] [CrossRef] [Green Version]
  32. Kalamandeen, M.; Gloor, E.; Mitchard, E.; Quincey, D.; Ziv, G.; Spracklen, D.; Spracklen, B.; Adami, M.; Aragaõ, L.E.O.C.; Galbraith, D. Pervasive Rise of Small-Scale Deforestation in Amazonia. Sci. Rep. 2018, 8, 1600. [Google Scholar] [CrossRef] [PubMed] [Green Version]
  33. Huete, A.R.; Didan, K.; Shimabukuro, Y.E.; Ratana, P.; Saleska, S.R.; Hutyra, L.R.; Yang, W.; Nemani, R.R.; Myneni, R. Amazon Rainforests Green-up with Sunlight in Dry Season. Geophys. Res. Lett. 2006, 33, L06405. [Google Scholar] [CrossRef] [Green Version]
  34. Saleska, S.R.; Didan, K.; Huete, A.R.; da Rocha, H.R. Amazon Forests Green-Up during 2005 Drought. Science 2007, 318, 612. [Google Scholar] [CrossRef] [PubMed] [Green Version]
  35. Magrin, G.O.; Marengo, J.A.; Boulanger, J.-P.; Buckeridge, M.S.; Castellanos, E.; Alfaro, E.; Anthelme, F.; Barton, J.; Becker, N.; Bertrand, A.; et al. Central and South America Coordinating Lead Authors: Lead Authors: Contributing Authors: Review Editors: To the Fifth Assessment Report of the Intergovernmental Panel on Climate Change. In Contribution of Working Group II to the Fifth Assessment Report of the Intergovernmental Panel on Climate Change; Cambridge University Press: Cambridge, UK; New York, NY, USA, 2014; pp. 1499–1566. [Google Scholar]
  36. Dirmeyer, P.A. An Evaluation of the Strength of Land–Atmosphere Coupling. J. Hydrometeorol. 2002, 2, 329–344. [Google Scholar] [CrossRef]
  37. Silva Dias, M.A.F.F.; Rutledge, S.; Kabat, P.; Silva Dias, P.L.; Nobre, C.; Fisch, G.; Dolman, A.J.; Zipser, E.; Garstang, M.; Manzi, A.O.; et al. Cloud and Rain Processes in a Biosphere-Atmosphere Interaction Context in the Amazon Region. J. Geophys. Res. D Atmos. 2002, 107, 8072. [Google Scholar] [CrossRef] [Green Version]
  38. Joetzjer, E.; Douville, H.; Delire, C.; Ciais, P. Present-Day and Future Amazonian Precipitation in Global Climate Models: CMIP5 versus CMIP3. Clim. Dyn. 2013, 41, 2921–2936. [Google Scholar] [CrossRef]
  39. Brando, P.M.; Goetz, S.J.; Baccini, A.; Nepstad, D.C.; Beck, P.S.A.; Christman, M.C. Seasonal and Interannual Variability of Climate and Vegetation Indices across the Amazon. Proc. Natl. Acad. Sci. USA 2010, 107, 14685–14690. [Google Scholar] [CrossRef] [Green Version]
  40. Xu, L.; Samanta, A.; Costa, M.H.; Ganguly, S.; Nemani, R.R.; Myneni, R.B. Widespread Decline in Greenness of Amazonian Vegetation Due to the 2010 Drought. Geophys. Res. Lett. 2011, 38, L07402. [Google Scholar] [CrossRef] [Green Version]
  41. Spracklen, D.V.; Garcia-Carreras, L. The Impact of Amazonian Deforestation on Amazon Basin Rainfall. Geophys. Res. Lett. 2015, 42, 9546–9552. [Google Scholar] [CrossRef] [Green Version]
  42. Lejeune, Q.; Davin, E.L.; Guillod, B.P.; Seneviratne, S.I. Influence of Amazonian Deforestation on the Future Evolution of Regional Surface Fluxes, Circulation, Surface Temperature and Precipitation. Clim. Dyn. 2015, 44, 2769–2786. [Google Scholar] [CrossRef] [Green Version]
  43. Lima, L.S.; Coe, M.T.; Soares Filho, B.S.; Cuadra, S.V.; Dias, L.C.P.; Costa, M.H.; Lima, L.S.; Rodrigues, H.O. Feedbacks between Deforestation, Climate, and Hydrology in the Southwestern Amazon: Implications for the Provision of Ecosystem Services. Landsc. Ecol. 2014, 29, 261–274. [Google Scholar] [CrossRef] [Green Version]
  44. Nobre, P.; Malagutti, M.; Urbano, D.F.; De Almeida, R.A.F.; Giarolla, E. Amazon Deforestation and Climate Change in a Coupled Model Simulation. J. Clim. 2009, 22, 5686–5697. [Google Scholar] [CrossRef]
  45. Lean, J.; Warrilow, D.A. Simulation of the Regional Climatic Impact of Amazon Deforestation. Nature 1989, 342, 411–413. [Google Scholar] [CrossRef]
  46. Nobre, C.A.; Sellers, P.J.; Shukla, J. Amazonian Deforestation and Regional Climate Change. J. Clim. 1991, 4, 957–988. [Google Scholar] [CrossRef] [Green Version]
  47. Werth, D.; Avissar, R. The Local and Global Effects of Amazon Deforestation. J. Geophys. Res. 2002, 107, 8087. [Google Scholar] [CrossRef] [Green Version]
  48. Moore, N.; Arima, E.; Walker, R.; Ramos da Silva, R. Uncertainty and the Changing Hydroclimatology of the Amazon. Geophys. Res. Lett. 2007, 34, L14707. [Google Scholar] [CrossRef]
  49. Hasler, N.; Werth, D.; Avissar, R. Effects of Tropical Deforestation on Global Hydroclimate: A Multimodel Ensemble Analysis. J. Clim. 2009, 22, 1124–1141. [Google Scholar] [CrossRef]
  50. Walker, R.; Moore, N.J.; Arima, E.; Perz, S.; Simmons, C.; Caldas, M.; Vergara, D.; Bohrer, C. Protecting the Amazon with Protected Areas. Proc. Natl. Acad. Sci. USA 2009, 106, 10582–10586. [Google Scholar] [CrossRef] [Green Version]
  51. Medvigy, D.; Walko, R.L.; Avissar, R.; Medvigy, D.; Walko, R.L.; Avissar, R. Effects of Deforestation on Spatiotemporal Distributions of Precipitation in South America. J. Clim. 2011, 24, 2147–2163. [Google Scholar] [CrossRef]
  52. Espinoza, J.C.; Chavez, S.; Ronchail, J.; Junquas, C.; Takahashi, K.; Lavado, W. Rainfall Hotspots over the Southern Tropical Andes: Spatial Distribution, Rainfall Intensity, and Relations with Large-Scale Atmospheric Circulation. Water Resour. Res. 2015, 51, 3459–3475. [Google Scholar] [CrossRef]
  53. Paccini, L.; Espinoza, J.C.; Ronchail, J.; Segura, H. Intra-Seasonal Rainfall Variability in the Amazon Basin Related to Large-Scale Circulation Patterns: A Focus on Western Amazon–Andes Transition Region. Int. J. Climatol. 2018, 38, 2386–2399. [Google Scholar] [CrossRef]
  54. Saatchi, S.S.; Houghton, R.A.; Dos Santos Alvalá, R.C.; Soares, J.V.; Yu, Y. Distribution of Aboveground Live Biomass in the Amazon Basin. Glob. Chang. Biol. 2007, 13, 816–837. [Google Scholar] [CrossRef]
  55. Sombroek, W. Spatial and Temporal Patterns of Amazon Rainfall. AMBIO A J. Hum. Environ. 2001, 30, 388–396. [Google Scholar] [CrossRef]
  56. Davidson, E.A.; de Araújo, A.C.; Artaxo, P.; Balch, J.K.; Brown, I.F.; Bustamante, M.M.C.; Coe, M.T.; DeFries, R.S.; Keller, M.; Longo, M.; et al. The Amazon Basin in Transition. Nature 2012, 481, 321–328. [Google Scholar] [CrossRef] [PubMed]
  57. Angelini, I.M.; Garstang, M.; Davis, R.E.; Hayden, B.; Fitzjarrald, D.R.; Legates, D.R.; Greco, S.; Macko, S.; Connors, V. On the Coupling between Vegetation and the Atmosphere. Theor. Appl. Climatol. 2011, 105, 243–261. [Google Scholar] [CrossRef]
  58. Marengo, J.A. Interdecadal Variability and Trends of Rainfall across the Amazon Basin. Theor. Appl. Climatol. 2004, 78, 79–96. [Google Scholar] [CrossRef]
  59. Coe, M.T.; Costa, M.H.; Botta, A.; Birkett, C. Long-Term Simulations of Discharge and Floods in the Amazon Basin. J. Geophys. Res. 2002, 107, 8044. [Google Scholar] [CrossRef] [Green Version]
  60. Vera, C.; Silvestri, G.; Liebmann, B.; González, P. Climate Change Scenarios for Seasonal Precipitation in South America from IPCC-AR4 Models. Geophys. Res. Lett. 2006, 33, 13707. [Google Scholar] [CrossRef] [Green Version]
  61. Carvalho, L.M.V.; Jones, C.; Liebmann, B.; Carvalho, L.M.V.; Jones, C.; Liebmann, B. The South Atlantic Convergence Zone: Intensity, Form, Persistence, and Relationships with Intraseasonal to Interannual Activity and Extreme Rainfall. J. Clim. 2004, 17, 88–108. [Google Scholar] [CrossRef] [Green Version]
  62. Fu, R.; Dickinson, R.E.; Chen, M.; Wang, H.; Fu, R.; Dickinson, R.E.; Chen, M.; Wang, H. How Do Tropical Sea Surface Temperatures Influence the Seasonal Distribution of Precipitation in the Equatorial Amazon? J. Clim. 2001, 14, 4003–4026. [Google Scholar] [CrossRef] [Green Version]
  63. Réveillet, M.; MacDonell, S.; Gascoin, S.; Kinnard, C.; Lhermitte, S.; Schaffer, N. Impact of Forcing on Sublimation Simulations for a High Mountain Catchment in the Semiarid Andes. Cryosph. 2020, 14, 147–163. [Google Scholar] [CrossRef] [Green Version]
  64. Paca, V.H.d.M.; Espinoza-Dávalos, G.E.; Hessels, T.M.; Moreira, D.M.; Comair, G.F.; Bastiaanssen, W.G.M. The Spatial Variability of Actual Evapotranspiration across the Amazon River Basin Based on Remote Sensing Products Validated with Flux Towers. Ecol. Process. 2019, 8, 6. [Google Scholar] [CrossRef] [Green Version]
  65. Souza, E.P.; Rennó, N.O.; Dias, M.A.F.S.; Souza, E.P.; Rennó, N.O.; Dias, M.A.F.S. Convective Circulations Induced by Surface Heterogeneities. J. Atmos. Sci. 2000, 57, 2915–2922. [Google Scholar] [CrossRef]
  66. Snyder, P.K.; Delire, C.; Foley, J.A. Evaluating the Influence of Different Vegetation Biomes on the Global Climate. Clim. Dyn. 2004, 23, 279–302. [Google Scholar] [CrossRef]
  67. Zhang, H.; Henderson-Sellers, A.; McGuffie, K. Impacts of Tropical Deforestation. Part II: The Role of Large-Scale Dynamics. J. Clim. 1996, 9, 2498–2521. [Google Scholar] [CrossRef] [Green Version]
  68. Haghtalab, N.; Moore, N.; Heerspink, B.P.; Hyndman, D.W. Evaluating Spatial Patterns in Precipitation Trends across the Amazon Basin Driven by Land Cover and Global Scale Forcings. Theor. Appl. Climatol. 2020, 140, 411–427. [Google Scholar] [CrossRef]
  69. Myneni, R.B.; Yang, W.; Nemani, R.R.; Huete, A.R.; Dickinson, R.E.; Knyazikhin, Y.; Didan, K.; Fu, R.; Negrón Juárez, R.I.; Saatchi, S.S.; et al. Large Seasonal Swings in Leaf Area of Amazon Rainforests. Proc. Natl. Acad. Sci. USA 2007, 104, 4820–4823. [Google Scholar] [CrossRef] [Green Version]
  70. Richey, J.E.; Nobre, C.; Deser, C. Amazon River Discharge and Climate Variability: 1903 to 1985. Science 1989, 246, 101–103. [Google Scholar] [CrossRef]
Figure 1. Geographic location of the Amazon Basin. The red box indicates our simulation boundary.
Applsci 12 07052 g001
Figure 2. ESA land covers that were used in the simulation. In the Reforest map, all croplands are replaced by evergreen broadleaf forests. The highlighted areas on the difference map (right image) indicate reforested regions.
Applsci 12 07052 g002
Figure 3. Difference maps between the simulated precipitation and simulated temperature, forced with reforested and current LCC on the left. On the right, the mean monthly temperature and precipitation (averaged over the basin) from observation and model output, along with the errors in the inset boxes.
Applsci 12 07052 g003
Figure 4. Simulated LH, forced with current and reforested land cover on the left. On the right, the difference between the two simulated LHs at a 95% significance level. Plus signs indicate major cities.
Applsci 12 07052 g004
Figure 5. Simulated SH, forced with current and reforested land cover on the left. On the right, the difference between the two simulated SHs at a 95% significance level. Plus signs indicate major cities.
Applsci 12 07052 g005
Figure 6. Simulated temperature, forced with current and reforested land cover on the left. On the right, the difference between the two simulated temperatures is at a 95% significance level. Plus signs indicate major cities.
Applsci 12 07052 g006
Figure 7. Simulated QFX, forced with current and reforested land cover on the left. On the right, the difference between the two simulated QFXs is at a 95% significance level. Plus signs indicate major cities.
Applsci 12 07052 g007
Figure 8. Simulated precipitation, forced with current and reforested land cover on the left. On the right, the difference between the two simulated precipitations is at a 95% significance level. Plus signs indicate major cities.
Applsci 12 07052 g008
Table 1. WRF parameterizations.
ParameterScheme Option
Longwave radiation schemeRapid Radiative Transfer Model
Shortwave radiationDudhia scheme
Surface layerFifth-generation Pennsylvania State University–National Center for Atmospheric Research Mesoscale Model (MM5) scheme.
Cumulus schemeKain–Fritsch
Mp_physicsWSM6 Hong and Lim
LSMNOAH
PBLYonsei University scheme
Publisher’s Note: MDPI stays neutral with regard to jurisdictional claims in published maps and institutional affiliations.

