Abstract
Pollen allergies are seasonal epidemic diseases that are accompanied by high incidence rates, especially in Beijing, China. With the development of deep learning, key progress has been made in the task of automatic pollen grain classification, which could replace the time-consuming and laborious manual identification process using a microscope. In China, few pioneering works have made significant progress in automatic pollen grain classification. Therefore, we first constructed a multi-class and large-scale pollen grain dataset for the Beijing area in preparation for the task of pollen classification. Then, a deblurring pipeline was designed to enhance the quality of the pollen grain images selectively. Moreover, as pollen grains vary greatly in size and shape, we proposed an easy-to-implement and efficient multi-scale deep learning architecture. Our experimental results showed that our architecture achieved a 97.7% accuracy, based on the Resnet-50 backbone network, which proved that the proposed method could be applied successfully to the automatic identification of pollen grains in Beijing.
1. Introduction
Allergic diseases are common and are found in clinical practice [1]. They are listed as one of the three major diseases that need to be prevented and controlled in the 21st century by the World Health Organization. Pollen allergens are one of the main causes and affect up to 30% of the population in industrialized countries [2]. Certain quantities of plant pollen allergens in the air can induce a series of allergic diseases, such as allergic rhinitis, bronchial asthma and dermatitis. These allergic diseases that are caused by plant pollen are also called hay fever. With the intensified urbanization of human society and the expansion of planting areas, the levels of pollen allergens have also increased. This has made pollen allergies become seasonal epidemic diseases that are accompanied by high incidence rates. In the United States, pollen allergies affect approximately 5% of the population and as much as 15% of the population in some regions. In Europe, they affect 20% of the population and it has been estimated that 30% of the population could be affected in the next 20 years [3]. In China, the incidence rate of pollen allergies is generally 0.5% to 1%, but it reaches 5% in high incidence areas [4]. This percentage has been increasing over recent years as well. Nearly 30% of allergic rhinitis cases in China are caused by pollen allergens. In Beijing, hay fever patients account for about 1/3 of all respiratory allergy patients.
Effective pollen prediction can prompt hay fever patients to take positive countermeasures. Therefore, it is of great practical significance to identify and count the main allergenic pollen grains in the air. According to our survey, few pioneering works have made significant progress in this topic in China at present. As an international metropolis, the urban population in Beijing has shown an upward trend in pollen allergy incidence rate over recent years. As a result, the proportion of the population with pollen allergies is much higher than that in other cities. Considering this fact, we constructed an allergenic pollen dataset of pollen that is mainly found in the Beijing area and explored the automatic classification and identification of the allergenic pollen grains.
As pollen grains vary greatly in size and shape, the identification of their morphological structures is a complex task [5]. Traditional pollen identification methods are generally realized by manually observing the surface characteristics of the pollen grains. In the manual identification process, experts need to possess the relevant knowledge and practical experience in pollen morphology. This process takes considerable amounts of time and resources, which limits research progress [6]. To solve these drawbacks, the automatic classification of pollen images has attracted more and more attention by utilizing computer vision and pattern recognition [7].
There are two main types of methods for the classification of pollen images that are based on computer vision: the traditional methods of manually extracting features and deep learning-based methods. The traditional methods rely on manually extracting features such as color, texture, shape and other features. The commonly used descriptors for texture features include the gray-level co-occurrence matrix (GLCM) [8], local binary patterns (LBPs) [9], log-Gabor filters (LGFs) [10] and discrete Tchebichef moments (DTMs) [11]. In [12], Marcos et al. artificially combined these four texture features and their classification accuracy reached 94.83% using a specific pollen dataset. In order to integrate richer pollen information, some studies have combined shape and texture features for pollen grain classification [7,13,14,15]. For example, Tello-Mijares et al. [14] utilized geometric descriptors, first-order texture statistics and second-order GLCM-based texture statistics, which were obtained from the L*a*b* color space. Their accuracy result could reach 95.6% using a 12-class pollen dataset.
Although the methods that use manual feature extraction have received a great amount of attention, their classification performance can be affected by many factors, such as image quality and descriptor selection. Due to the success of convolutional neural networks (CNNs) in the field of computer vision, pollen image classification methods that are based on deep learning have gradually become mainstream. In [16], Daood et al. proposed an automatic feature learning network for pollen image classification using fine-tuned transfer learning. They achieved an accuracy rate of 94% using a 30-class pollen dataset. In [17], André et al. studied two methods for training CNNs using a large-scale pollen image dataset: random initialization and fine-tuned feature learning. Their results showed that the process of fine-tuning a pre-trained CNN achieved an accuracy of 96.24%, which was much higher than that of the random initialization method. In [18], Gallardo-Caballero et al. focused on the three-dimensional visual information of pollen grains. Their process of analyzing each sample was recorded in MJPEG video format in order to make use of the 3D information that was presented by several focal planes. They used a training set of 251 videos and their detection results achieved scores of 98.54% for recall and 99.75% for precision.
However, these deep learning methods can only perform transfer learning using CNNs. Therefore, they do not focus on the characteristics of pollen images. The shape characteristics of different pollen grains vary greatly, which results in the resolutions of pollen grain images spanning a large range. In [19], Sevillano et al. studied the influence of pollen image size and proposed a pre-processing algorithm. Their pre-processing algorithm cropped the pollen grains from the original images while keeping a minimum amount of padding around them and maintaining their size, so that all of the images could be reframed into 227 × 227 images. However, some pollen grains were too small, which resulted in low image resolutions and unclear details. The algorithm in [19] was ineffective for improving the quality of pollen grain images. These unfavorable factors affect the accuracy of image classification. Therefore, it is not sufficient to train a self-collected pollen image dataset directly using a pre-trained CNN with a single normalized resolution.
To solve the above limitations, we studied an automatic classification method for allergenic pollen grains in the Beijing area. The proposed work produced the following main contributions:
- The construction of a multi-class and large-scale dataset of pollen grain images under a light microscope, which is the first large-scale dataset of pollen images from the Beijing area;
- The proposal of a deblurring pipeline for super-resolution reconstruction based on a GAN, which effectively improved the quality of the images by reconstructing the semantic information of the pollen images;
- The proposal of an easy-to-implement and efficient multi-scale deep learning architecture with a multi-branch network for pollen image classification so that images in different resolution ranges could be trained using the corresponding branches, which significantly improved the classification performance.
This paper is organized as follows. In Section 2, we review several previous related works about pollen datasets and introduce the main current automatic classification methods. In Section 3, we describe the specific process for the construction of the large-scale dataset of pollen images from the Beijing area. Then, the super-resolution reconstruction module that enhances the quality of blurred pollen images is proposed. Next, a multi-scale classification method is introduced for the automatic classification of the proposed dataset. The experimental results and ablation study are shown in Section 4 and we present our conclusions and directions for future research in Section 5.
2. Related Works
Most of the existing works about the automatic detection/classification of pollen grains have been implemented and evaluated using self-collected datasets. All of these public datasets are sourced from abroad, such as Duller’s pollen dataset [20], POLEN23E [21], Pollen13K [22] and Pollen73S [23]. Duller’s dataset consists of seven categories of pollen images, with a total of 630 grayscale images with a size of 25 × 25. The resolution of the raw pollen images is 768 × 576 pixels and the images were acquired using a charge-coupled device (CCD) camera. Orlov et al. [24] introduced a multi-purpose image classifier named WND-CHARM, which achieved an accuracy of 96% using this dataset. The POLEN23E dataset contains images from the Brazilian savannah, with 23 different categories and 35 color images of different sizes in each category. The authors proposed a classification algorithm that combined three feature extractors and four machine learning techniques. By fine-tuning the proposed algorithm, they achieved an accuracy rate of more than 64% for a large number of categories and limited feature selection. The Pollen13K dataset is a large-scale pollen image dataset consisting of over 13,000 images that are split into four categories. The authors proposed a pipeline to detect and extract objects from a set of microscope images, which could effectively reduce the amount of manual work that was required. By utilizing the traditional machine learning and deep learning algorithms, the highest F1-score reached 0.87. The Pollen73S dataset is a public annotated image dataset consisting of 2523 images from 73 pollen categories. The advantages of this dataset lie in its large category coverage and its diverse range of pollen grains, which can effectively guide computer vision to solve palynological problems. The authors utilized convolutional neural networks (CNNs) to conduct pollen image classification and the highest accuracy rate reached 95.7%. In Table 1, we summarize the details of the four datasets that were described in this section and compare them to our proposed dataset.

Table 1.
The comparison between the proposed dataset and the main datasets that are used for the pollen image classification task.
3. Materials and Methods
3.1. Dataset
Over recent years, deep learning has enabled significant progress to be made in the fields of image classification [25,26,27,28] and feature learning [29,30,31,32]. One of the key drivers of the success of deep learning is the availability of large amounts of annotated data. Indeed, the amount of training data has a great impact on the performance of deep learning processes, which encourages the development of large-scale datasets in different scientific fields [33]. Due to regional variations in plant species, there are a great number of differences in the types and shapes of pollen grains from different regions. Therefore, the collection of pollen grains from specific areas is of key significance for pollen forecasting in those areas.
Section 2 introduces several open-access datasets of pollen grains from different areas. However, the categories of pollen in these datasets do not cover all of the categories that exist in Beijing, China. From a survey of plants in Beijing, the main airborne allergenic pollens were found to include a total of eight taxa: Pinaceae, Cupressaceae, Salicaceae (including Salix and Populus), Moraceae, Artemisia, Compositae, Chenopodiaceae and Poaceae. These taxa cover about 90% of all pollen grains in the Beijing area. Out of these eight taxa, Cupressaceae, Salicaceae (including Salix and Populus) and Pinaceae are the main pollen contributors in spring, while Moraceae, Compositae and Chenopodiaceae are the main pollen contributors in autumn. However, there is not a large-scale, high-quality and adaptable dataset of pollen from Beijing, which limits the automatic classification and prediction of pollen in the Beijing area. Therefore, we constructed a dataset of pollen grains that were collected in the Beijing area for the automatic classification task.
The Beijing Meteorological Service Center collected pollen from 12 administrative regions in Beijing using glass slides that were coated with Vaseline. After treatment with basic fuchsin, the pollen grains on the slides became pink. Then, the slides were scanned using a NanoZoomer Digital Pathology Slide Scanner (NDP). Using a 40× objective lens, we obtained pollen scan images in NDPI format and each image was approximately 100,000 × 50,000 pixels. We called the obtained images pollen scanning images.
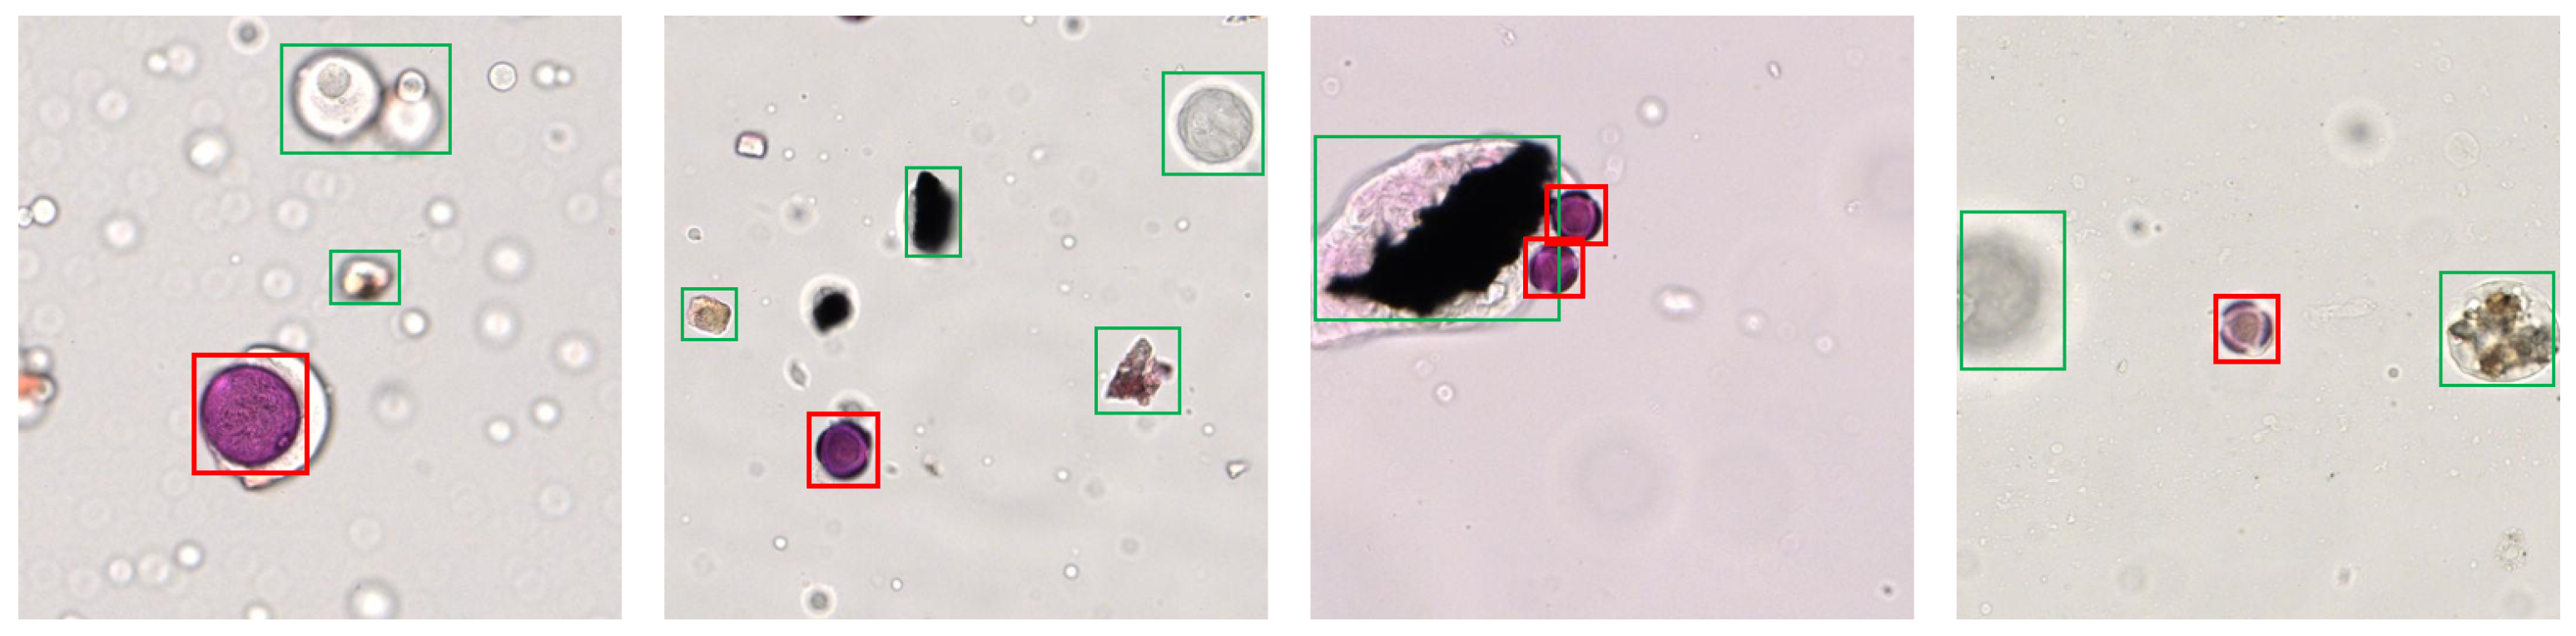
The obtained scanning images not only contained irregularly distributed pollen grains, but also significant background noise (i.e., debris, dust, fungal spores and air bubbles). By adding the special stain to the slides, the pollen grains were stained pink in general, while the background noise was not, as shown in Figure 1. Therefore, the color extraction method [33] could be used to extract single pollen grains, which replaced the traditional manual localization and labeling process. Due to the large size of the pollen scanning images, it was inconvenient to use the color extraction method. Thus, each pollen scanning image needed to be cropped into several rectangular images with a size of 512 × 512 pixels. The subsequent image processing pipeline was performed on these rectangular images. The collection pipeline of our pollen grain dataset could be divided into two steps: pre-processing and labeling. The specific operation details are described in the following subsections.
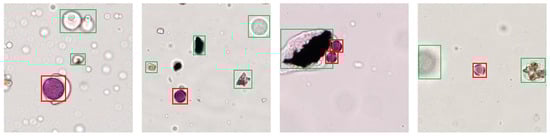
Figure 1.
Several images (with a size of 512 × 512) that were cropped from pollen scanning images. The pollen grains are marked in red and background noise is marked in green (i.e., air bubbles, debris and dust).
3.1.1. Pre-Processing
Generally, experienced palynologists are required to manually locate and label pollen grains in pollen scanning images. This process is often time-consuming and labor-intensive. Therefore, the pre-processing pipeline adopted the color extraction method from [33] to reduce the required resources. However, the difference between [33] and this study was that operations such as contour highlights were not required in our pipeline as the pollen scanning images were more obviously stained. Thus, we optimized the pre-processing pipeline on the basis of the method in [33].
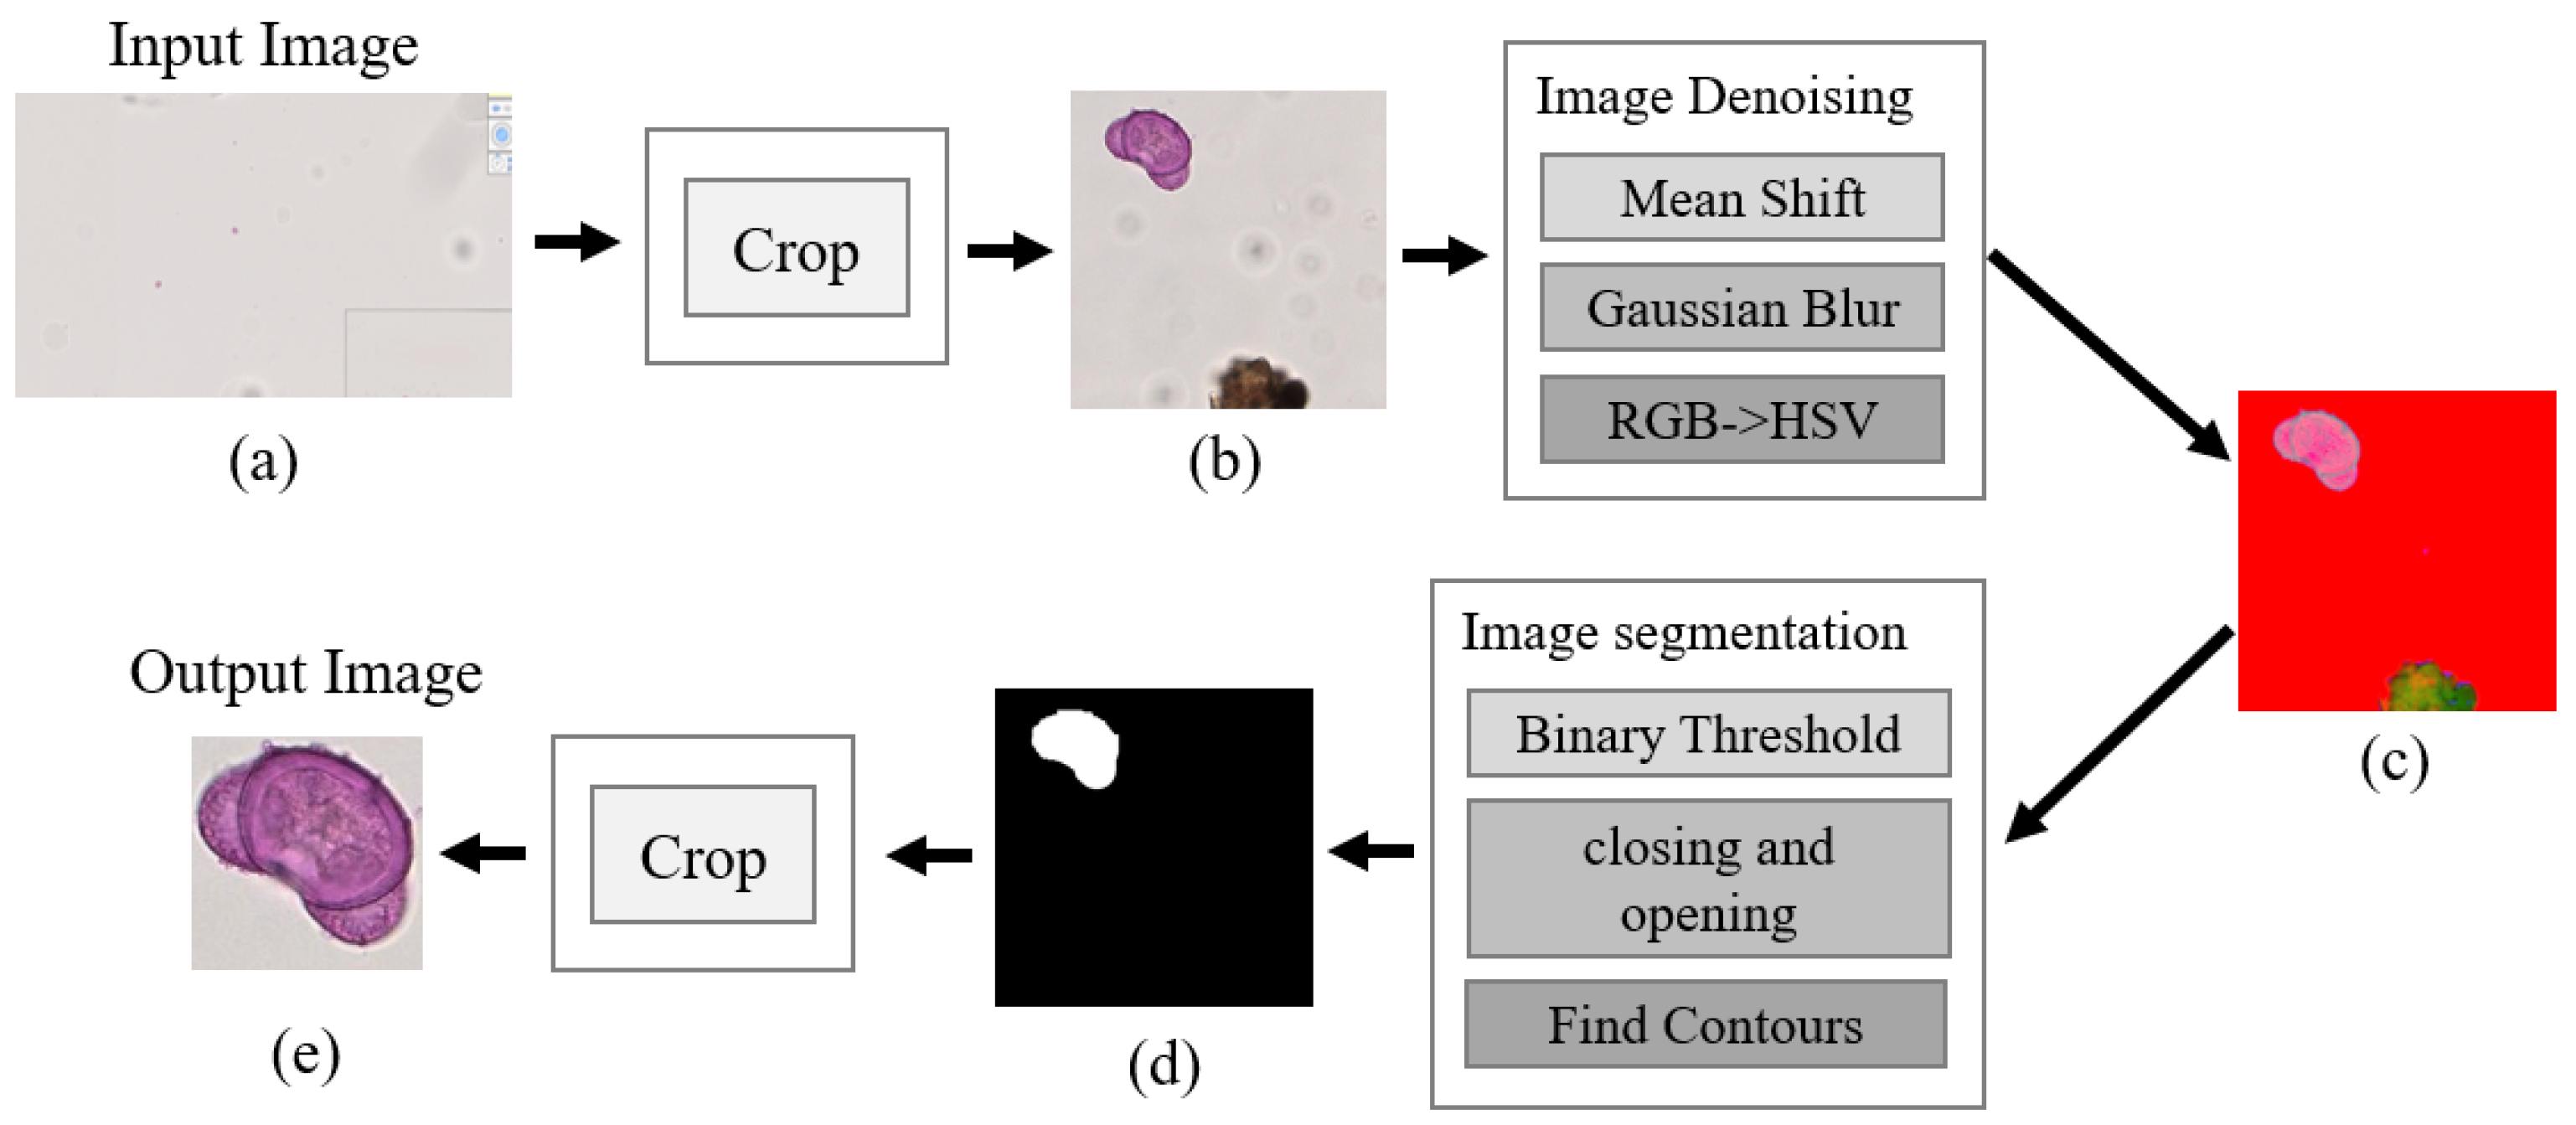
The inputs of the pre-processing pipeline were the rectangular images that were cropped from the pollen scanning images. The specific pre-processing procedure could be divided into the following three steps. Firstly, image denoising. We utilized a mean shift algorithm to smooth the microscopic images and then Gaussian blur was used to denoise the images. Next, the RGB images were converted into HSV images. Secondly, image segmentation. The images could be binarized using the designed pre-set HSV color interval. Then, we performed closing and opening operations on the binary images to obtain mask binary images. Therefore, all of the pollen grains were white and the background was black. As a result, the segmentation contours of the pollen grains were obtained. Thirdly, image cropping. Based on the segmentation contour coordinates of the pollen grains, we cropped the rectangular images into single pollen grain images. The sizes of these images ranged from 30 to 260 pixels. Figure 2 shows the improved color extraction process.

Figure 2.
The overall pipeline for pre-processing: (a) the input pollen scanning image; (b) the rectangular image after cropping; (c) the resulting image after denoising and the conversion of the color space from RGB to HSV; (d) the mask that was generated by the segment operators; (e) the output image that was cropped from the rectangular image.
3.1.2. Labeling
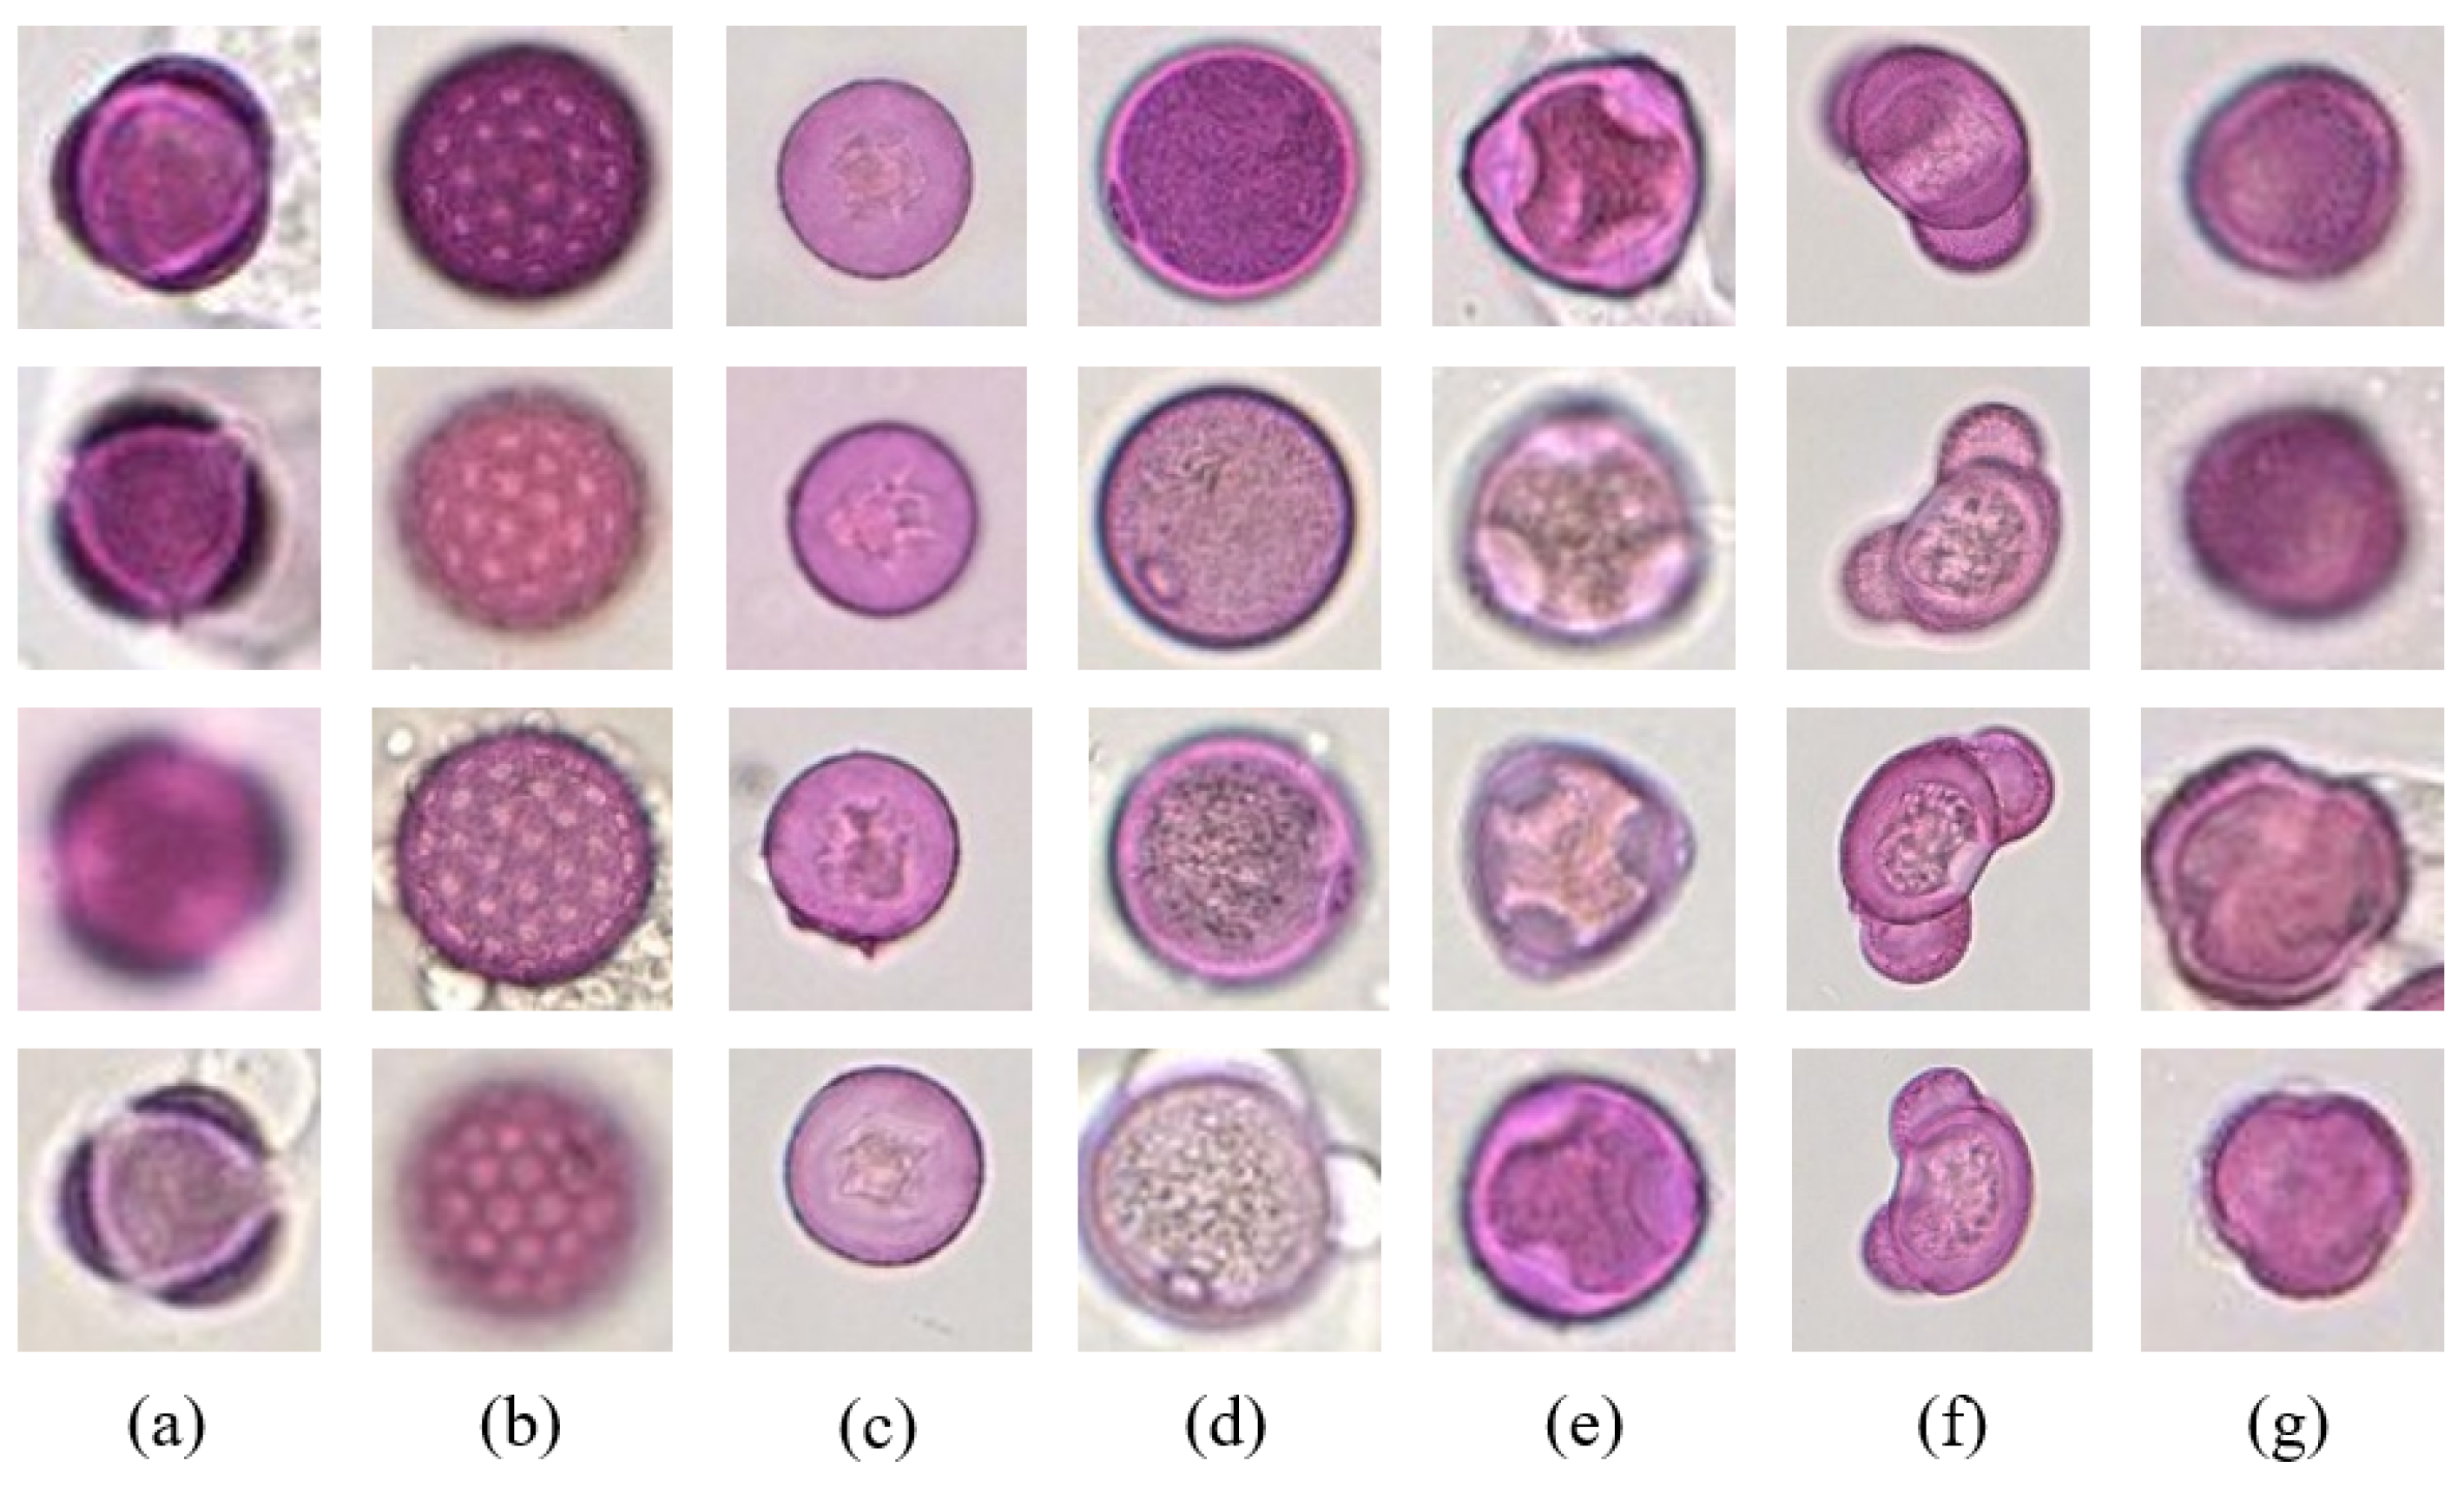
Labels are essential in supervised learning. To ensure the validity of the labels, all of the pollen grains were labeled by experienced palynologists. The total number of labeled samples was 4389, which consisted of seven different categories: Artemisia, Chenopodiaceae, Cupressaceae, Poaceae, Moraceae, Pinaceae and Salix. Figure 3 shows several example pollen grain images.
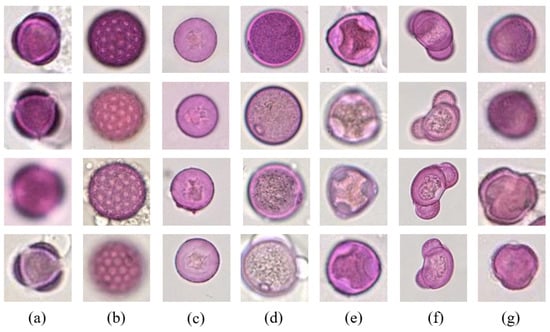
Figure 3.
Several example pollen grain images: (a) Artemisia; (b) Chenopodiaceae; (c) Cupressaceae; (d) Poaceae; (e) Moraceae; (f) Pinaceae; (g) Salix.
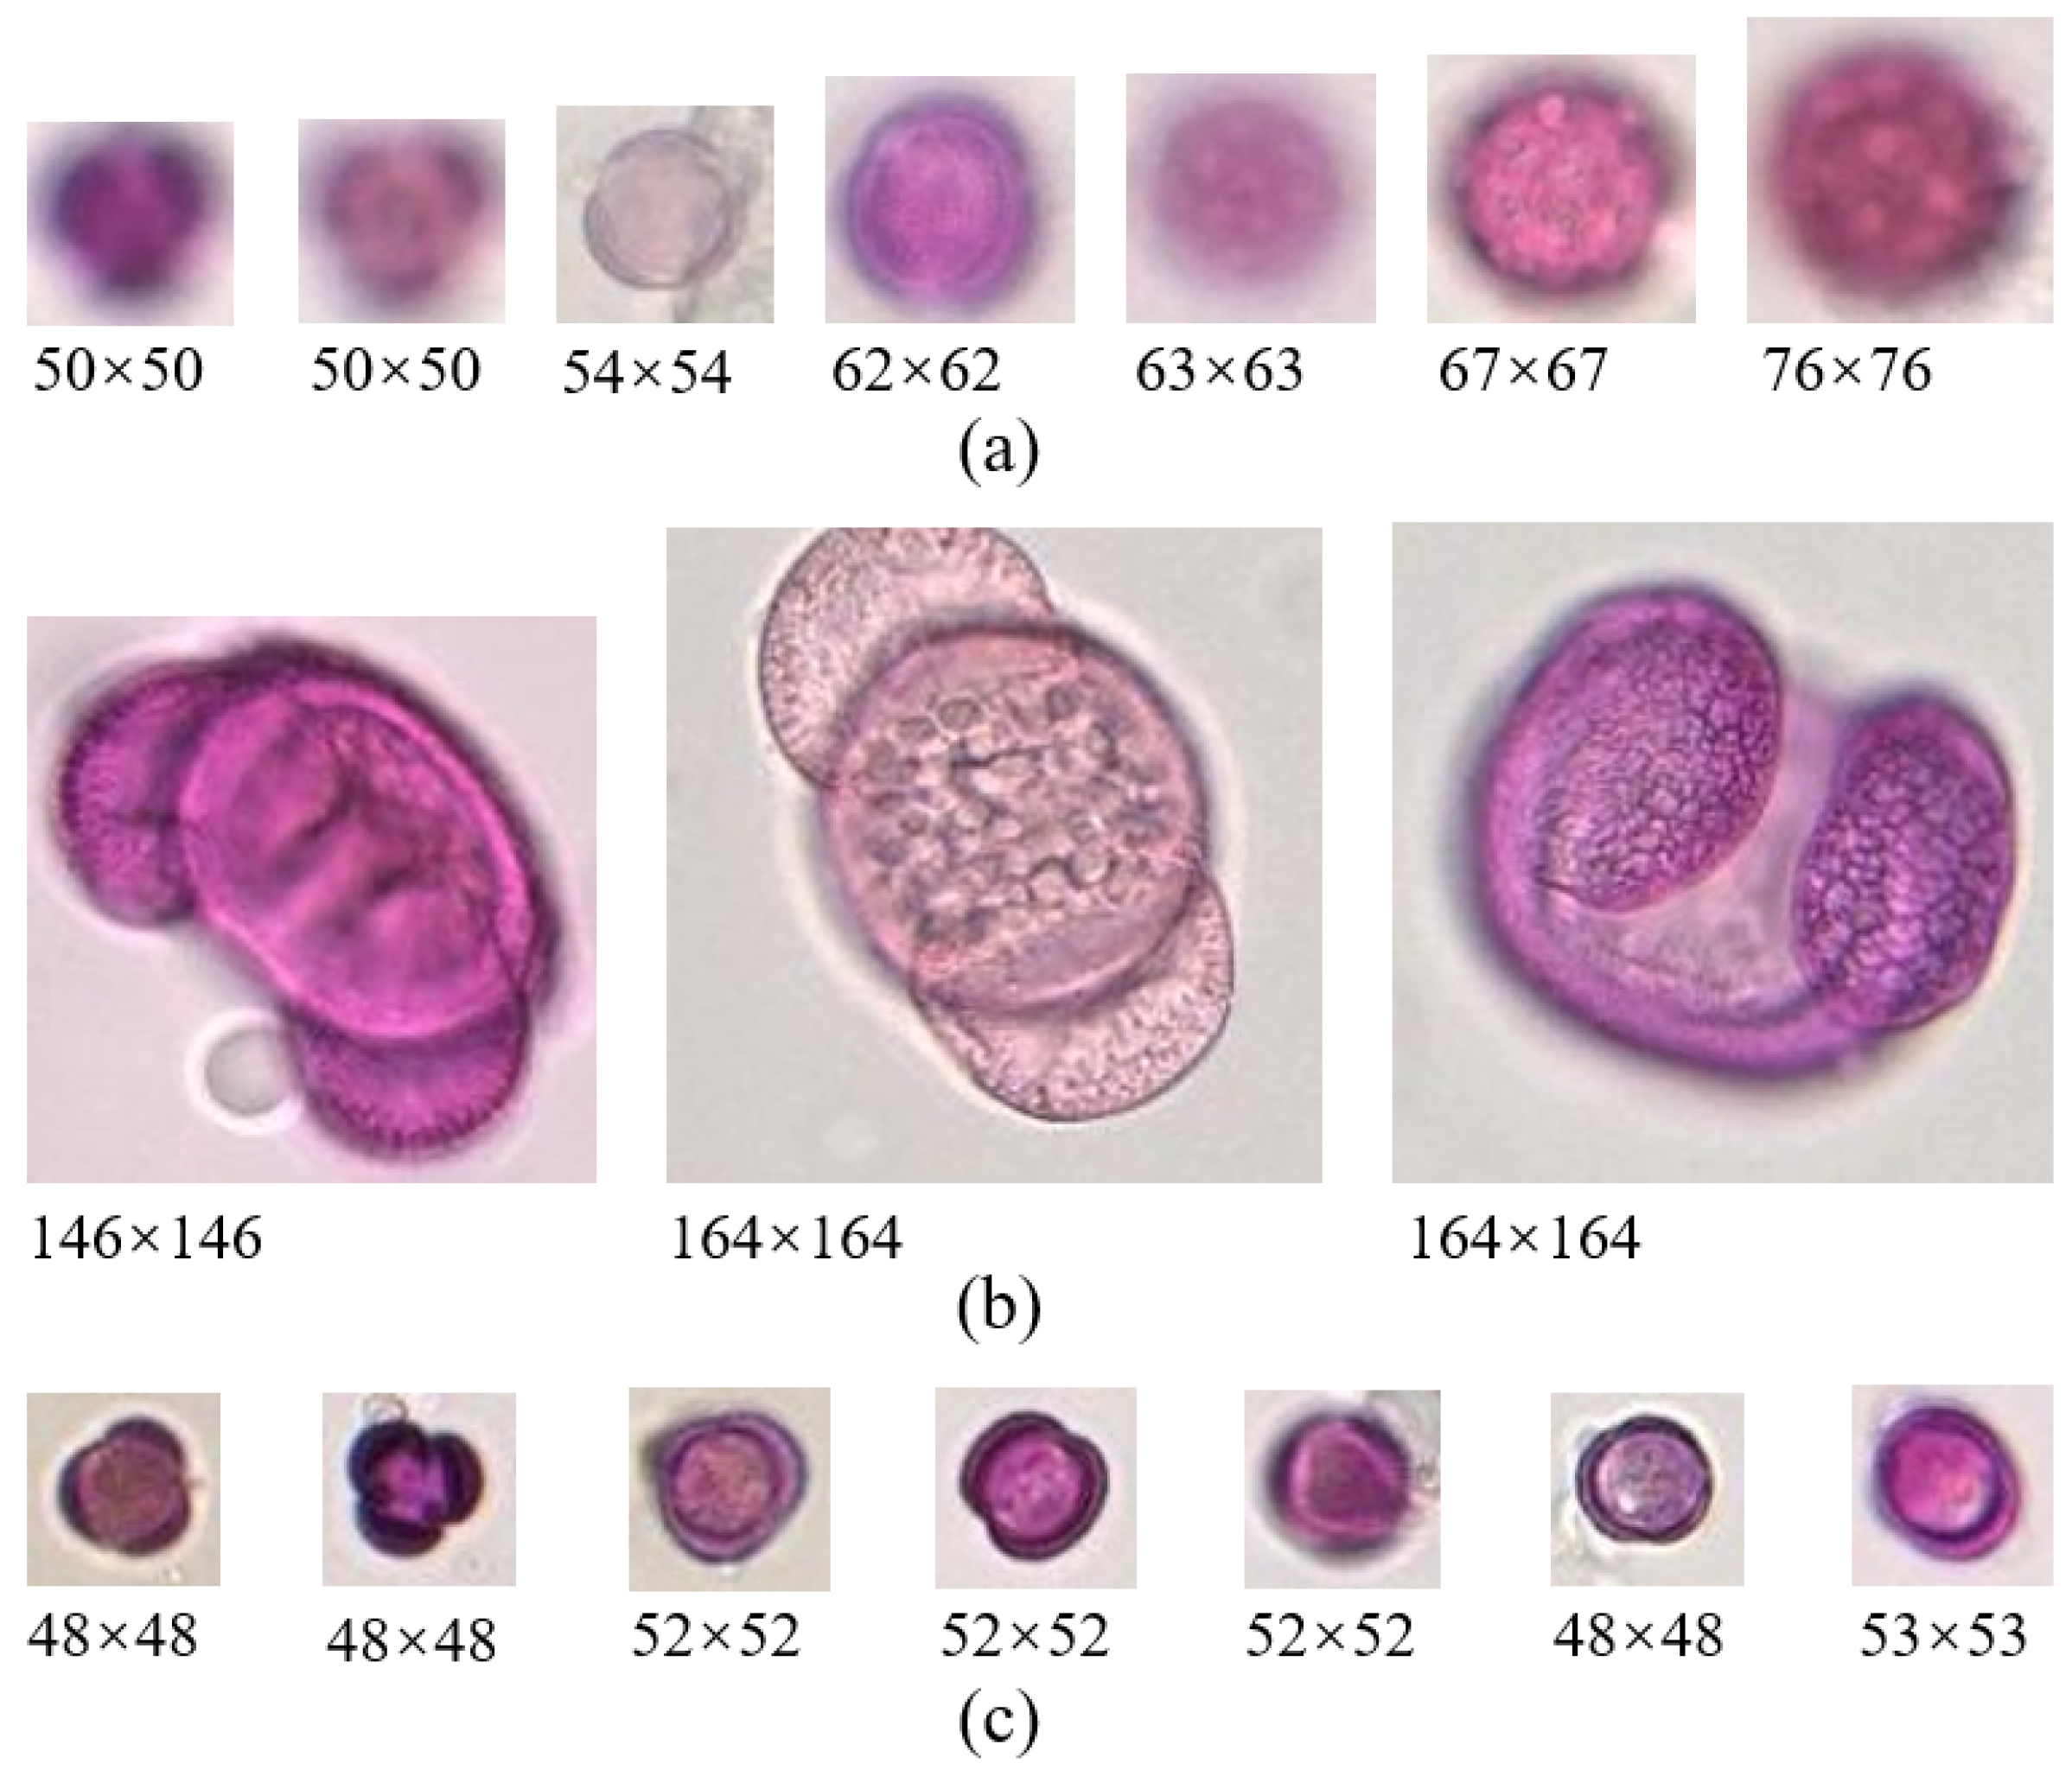
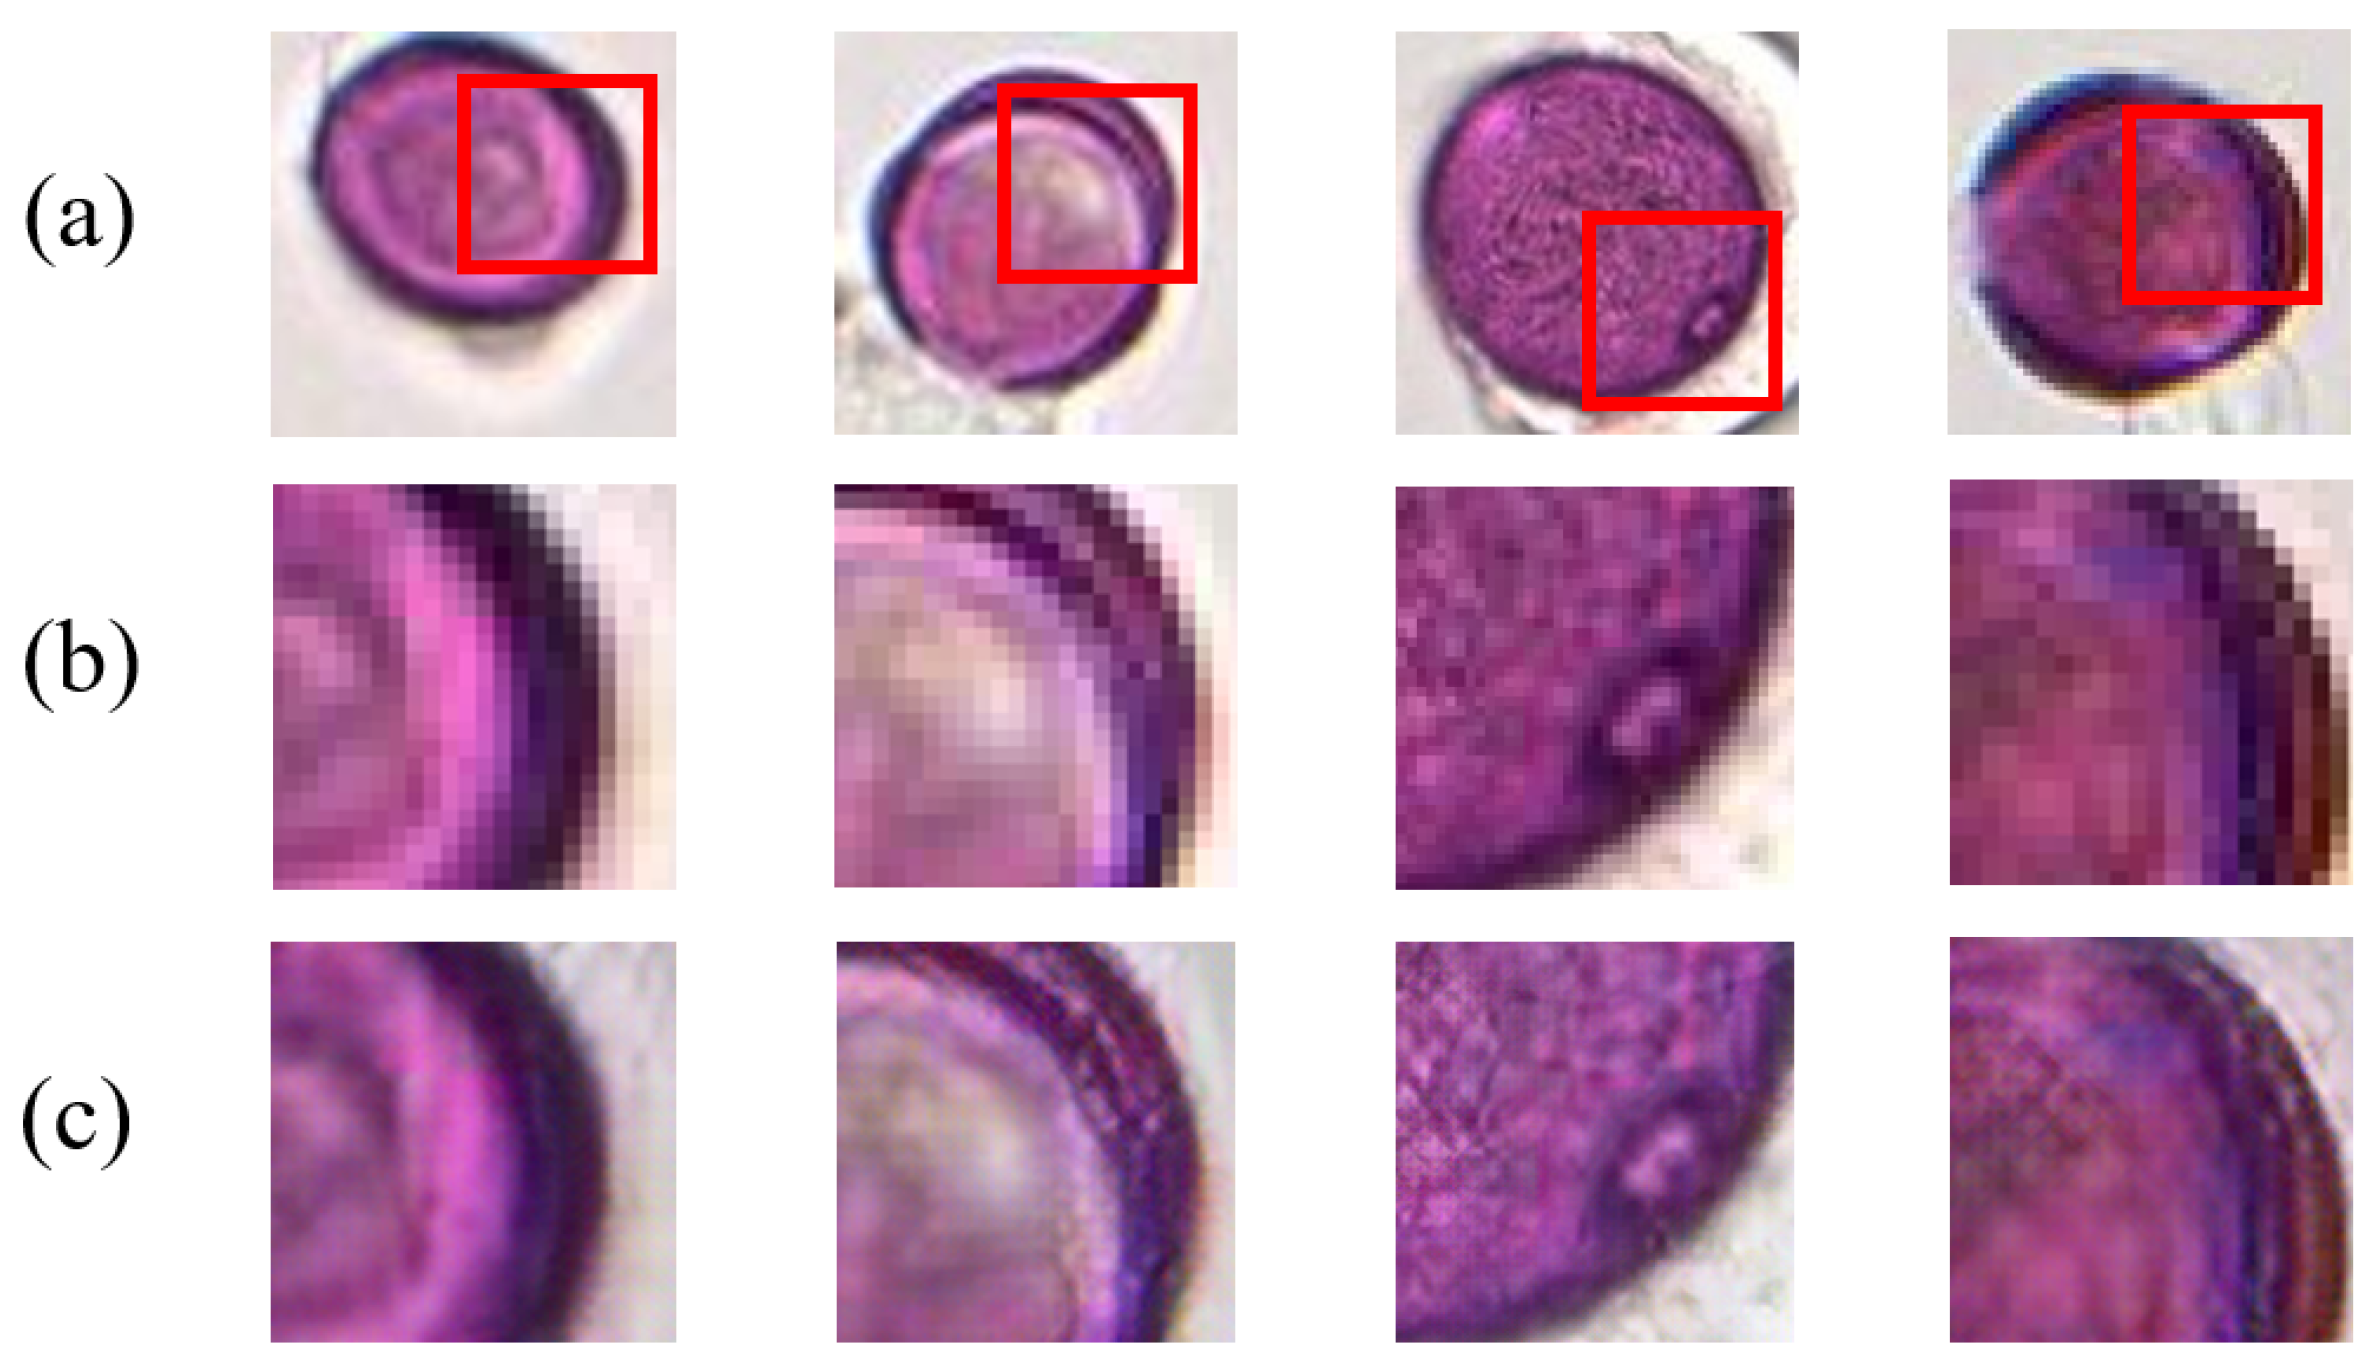
After the above series of operations, we constructed a dataset of pollen grains from the Beijing area, which could enable future studies on the identification and prediction of pollen allergens. Table 2 lists the main details of our dataset. From this table, it can be seen that the size of the pollen grains varied greatly; for example, the maximum image resolution of Pinaceae was 253 × 253, which was nearly three times the maximum image resolution of Artemisia. Due to the small size of some pollen grains and the limitations of the scanning machine, it was difficult to acquire high-resolution single pollen images and resulted in images with unclear details of the pollen grains (as shown in Figure 4a). In addition, the size of the pollen grains in different categories were quite different, which led to great variations in the resolutions of images from different categories. Figure 4b,c list several images of Pinaceae and Artemisia grains.
Table 2.
The information of different categories in the original dataset, including resolution range, number of samples and median resolution.
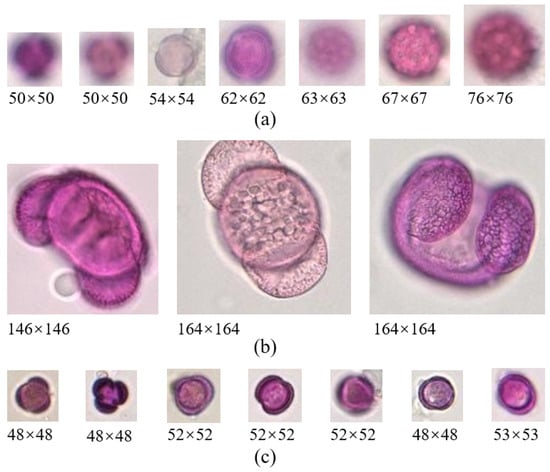
Figure 4.
Several example pollen grain images: (a) pollen grain images with unclear details; (b) Pinaceae pollen grains; (c) Artemisia pollen grains.
3.2. Deblurring Pipeline
Considering the complexity of the obtained dataset, we designed a data deblurring pipeline for the dataset, which consisted of two steps: (1) adding a resolution selector, which aimed to pick out the samples that needed to be enhanced; (2) deblurring using the super-resolution reconstruction method, which aimed to recover more semantic details. The specific operations are shown in Figure 5.
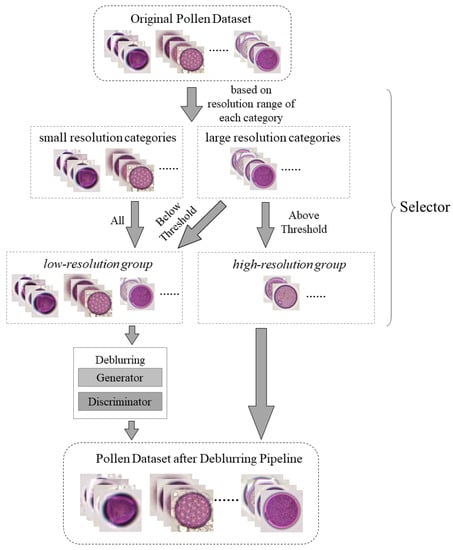
Figure 5.
The overall pipeline of the deblurring process.
3.2.1. Selector
The purpose of the selector was to divide the samples in the dataset into a low-resolution group and a high-resolution group. The resolution ranges for the different categories are shown in Table 2. It can be seen that the resolution of the Artemisia, Chenopodiaceae, Moraceae and Salix images was relatively small. So, all images in these four categories were added into the low-resolution group. For the Cupressaceae, Poaceae and Pinaceae grains, the images had a larger resolution. Since the classification task requires the dataset to have a consistent resolution range, we set a resolution threshold for these three categories. The threshold for the dataset in our paper was set as the median resolution of each category. The images with a resolution that exceeded the threshold were directly added to the high-resolution group and the others were added to the low-resolution group. In the low-resolution group, the images were subjected to image enhancement via the following pipeline.
3.2.2. Deblurring
The process of deblurring was achieved using high-resolution reconstruction. For the images in the low-resolution group, the features that were extracted by the neural network were particularly ambiguous, which was not conductive to subsequent classification. Thus, we utilized the super-resolution reconstruction framework SRGAN [34], with a scaling factor of 4, to generate high-quality images. Table 3 lists the resolution ranges of the categories in the dataset after deblurring.
Table 3.
The resolution ranges of the categories in the dataset after the deblurring process.
In the existing classification method that is based on deep learning, bilinear interpolation is a common means for enhancing images with different resolutions. Thus, we compared the deblurring effects of bilinear interpolation and SRGAN. Figure 6 shows several low-resolution images and their deblurred counterparts. From the figure, it can be seen that the images that were processed using the deblurring pipeline were obviously clearer than those that were processed using bilinear interpolation.
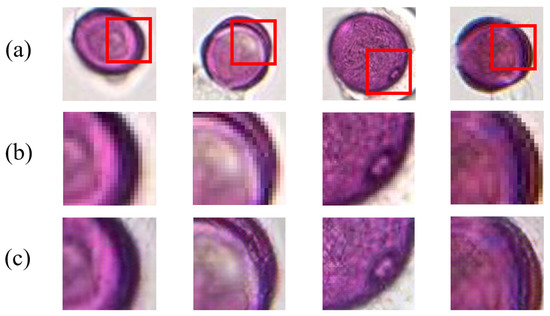
Figure 6.
Several low-resolution images and their deblurred counterparts: (a) the original images; (b) the deblurred images using bilinear interpolation; (c) the deblurred images using our deblurring pipeline.
3.3. Multi-Scale Classifier
In the previous works about pollen classification, classifiers that were based on CNN architectures were needed to normalize the resolutions of the input images [35,36,37]. However, the resolutions of the obtained images after deblurring still varied greatly in this study, as shown in Table 3. The operation for normalized resolutions could lead to serious image distortion and affect the classification performance. Inspired by multi-scale features, such as image pyramids [38], scale-space representations [39] and coarse-to-fine approaches [40], we adopted the idea of multi-scale resolution to develop an easy-to-implement and efficient pollen image classification architecture.
The proposed architecture was achieved using a multi-branch network structure, with each branch receiving images with different resolution scales as their input. By fusing the loss functions of the different branches, we could train the whole architecture end to end. Considering that different pollen datasets have different resolution ranges, our model could also provide a network structure with scalable branches. Therefore, the proposed architecture could be extended to different pollen grain datasets, which would be a significant improvement compared to the existing classification methods for single-resolution images.
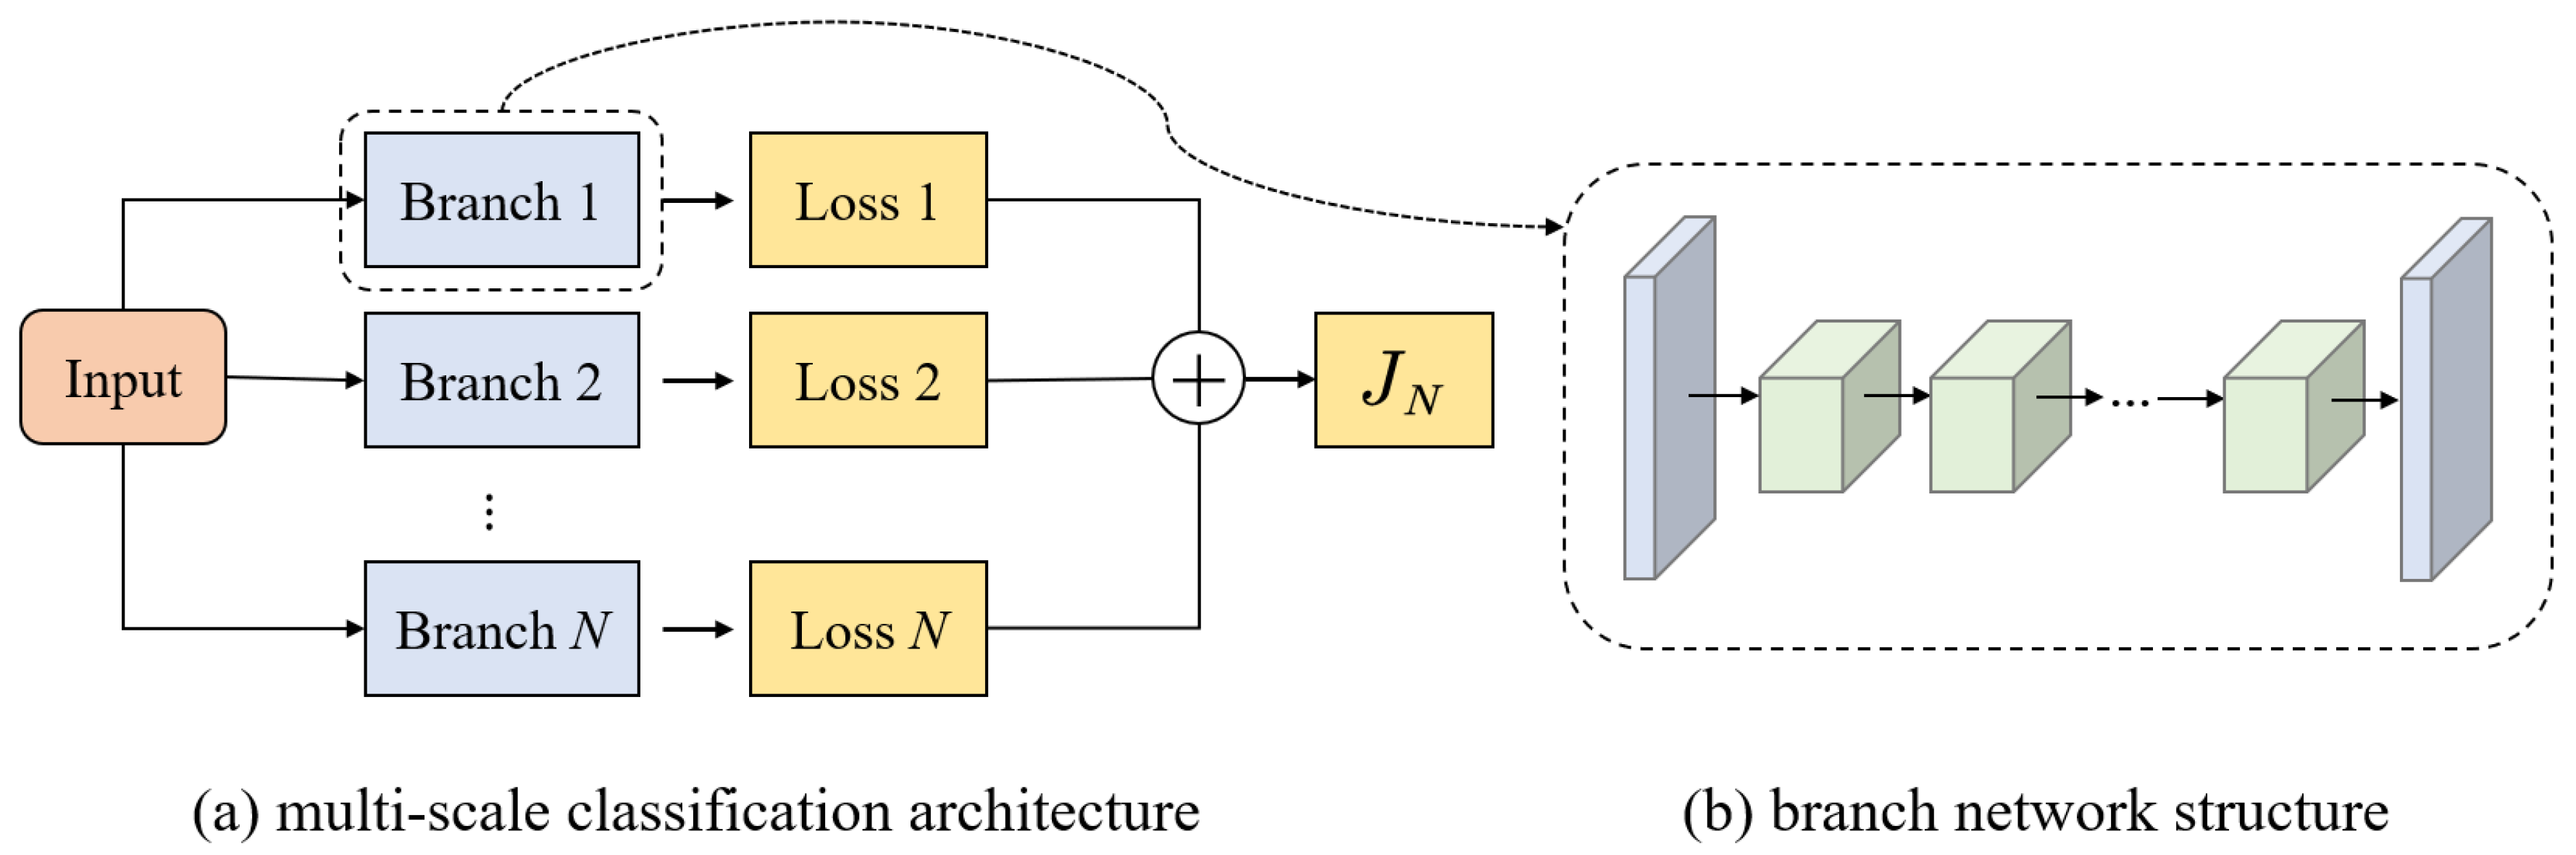
The framework of the proposed architecture is shown in Figure 7. According to the resolution ranges of the pollen grain images, the input images were divided into N parts, which corresponded to N branches in the architecture. Each branch took images that were normalized to a uniform resolution as their input. The overall loss was calculated by combining the loss functions of all of the branches. Then, the model could be trained using the backbone network to obtain the parameters that minimizes the overall loss function.
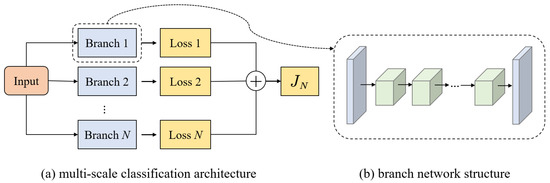
Figure 7.
Our proposed multi-scale classification architecture for easy-to-implement and efficient pollen classification: (a) the multi-scale classification architecture, which combined several branch networks (the multi-scale architecture included N branches and the loss function of each branch was combined for training); (b) the branch network structure, in which each branch separately trained the backbone network according to the resolution range.
By assuming that was the predicted value of the n-th branch, we obtained:
where j represents the j-th sample and represents the n-th branch of the j-th sample. The loss function of the n-th branch could be computed using the cross-entropy of M samples:
where and represent the vectors of the true labels and the predicted values of the M samples, respectively.
The overall loss function of the whole model could be obtained using:
where represents a coefficient with the value of 0 or 1. When training the n-th branch, this coefficient was assigned a value of 1, while the k coefficient of other branches was 0.
4. Experiments
In the experiments, we utilized the pre-trained VGGNet [36] and ResNet [37] architectures that were trained using the 2012 ImageNet for the transfer learning. In [17], the authors tested ResNet with different numbers of layers, from 18 to 152, and found that the accuracy did not improve with an increase in the number of layers. Thus, we adopted VGG-19 and Resnet-50 as the backbone networks for the experiments. The accuracy and F1-score were used as the metrics to measure the performance of the different classification methods with 5-fold cross-validation. In each fold, we chose 80% of the images from each category for training and 20% for testing.
For the parameter settings, the learning rate was set to 0.001, the batch size was 64 and the number of epochs was 1000. Adagrad [41] was used as the optimizer and the model performance for the testing set was evaluated every 10 epochs. To avoid overfitting [42], we introduced an early stop function to stop training when the performance of the model was no longer improving. The model performance was evaluated using the testing set every five epochs. The training process stopped when the accuracy of the testing set did not increase within 50 epochs.
4.1. Results and Analysis
In this section, we first present the performance results of the proposed multi-scale classifier. The number of branches was set to two. Following the selector addition and deblurring processes, the samples were transferred to the corresponding branch network, according to their resolution. The backbone networks of the two branches were the same. The resolution ranges of the two branches were 0–280 and 281–650. Their normalized resolutions were then set to 224 × 224 and 448 × 448, respectively. Table 4 shows the number of samples in the different categories of these two branches. Since the number of samples in the different categories of our dataset was imbalanced, we used the undersample approach to solve this problem. Specifically, the number of Artemisia samples in Branch 1, Chenopodiaceae samples in Branch 2 and Cupressaceae samples in Branch 2 were relatively large. In order to eliminate the impact of this data imbalance on the classifier, we randomly picked 400 Artemisia samples for Branch 1 and 300 Chenopodiaceae and Cupressaceae samples for Branch 2 (see Table 4).
Table 4.
The experimental statistics of each branch.
We used five metrics to evaluate the performance of the multi-scale classifier with the VGG-19 and Resnet-50 backbones: precision, recall (or true positive rate, TPR), specificity (or true negative rate, TNR), F1-score and accuracy. Out of these metrics, F1-score and accuracy were selected as the primary criteria. In the proposed multi-scale classifier, we adopted a selector to pick out the images with low resolutions and then transfer them to the deblurring process. The whole process was named “Multi-Scale + Selector + Deblur”. The classification results for the VGG-19 and Resnet-50 backbones are shown in Table 5 and Table 6, respectively. The classification results include the precision, recall, specificity and F1-score for each pollen category, the average F1-score and the total accuracy. From the tables, it can be seen that the total accuracy of the multi-scale classifier was 0.977 with the Resnet-50 backbone. It also yielded an average F1-score of 0.966 using our proposed dataset. Meanwhile, the multi-scale classifier with the VGG-19 backbone achieved a total accuracy of 0.968 and an average F1-score of 0.949.
Table 5.
The classification results for the multi-scale classifier with the VGG-19 backbone.
Table 6.
The classification results for the multi-scale classifier with the Resnet-50 backbone.
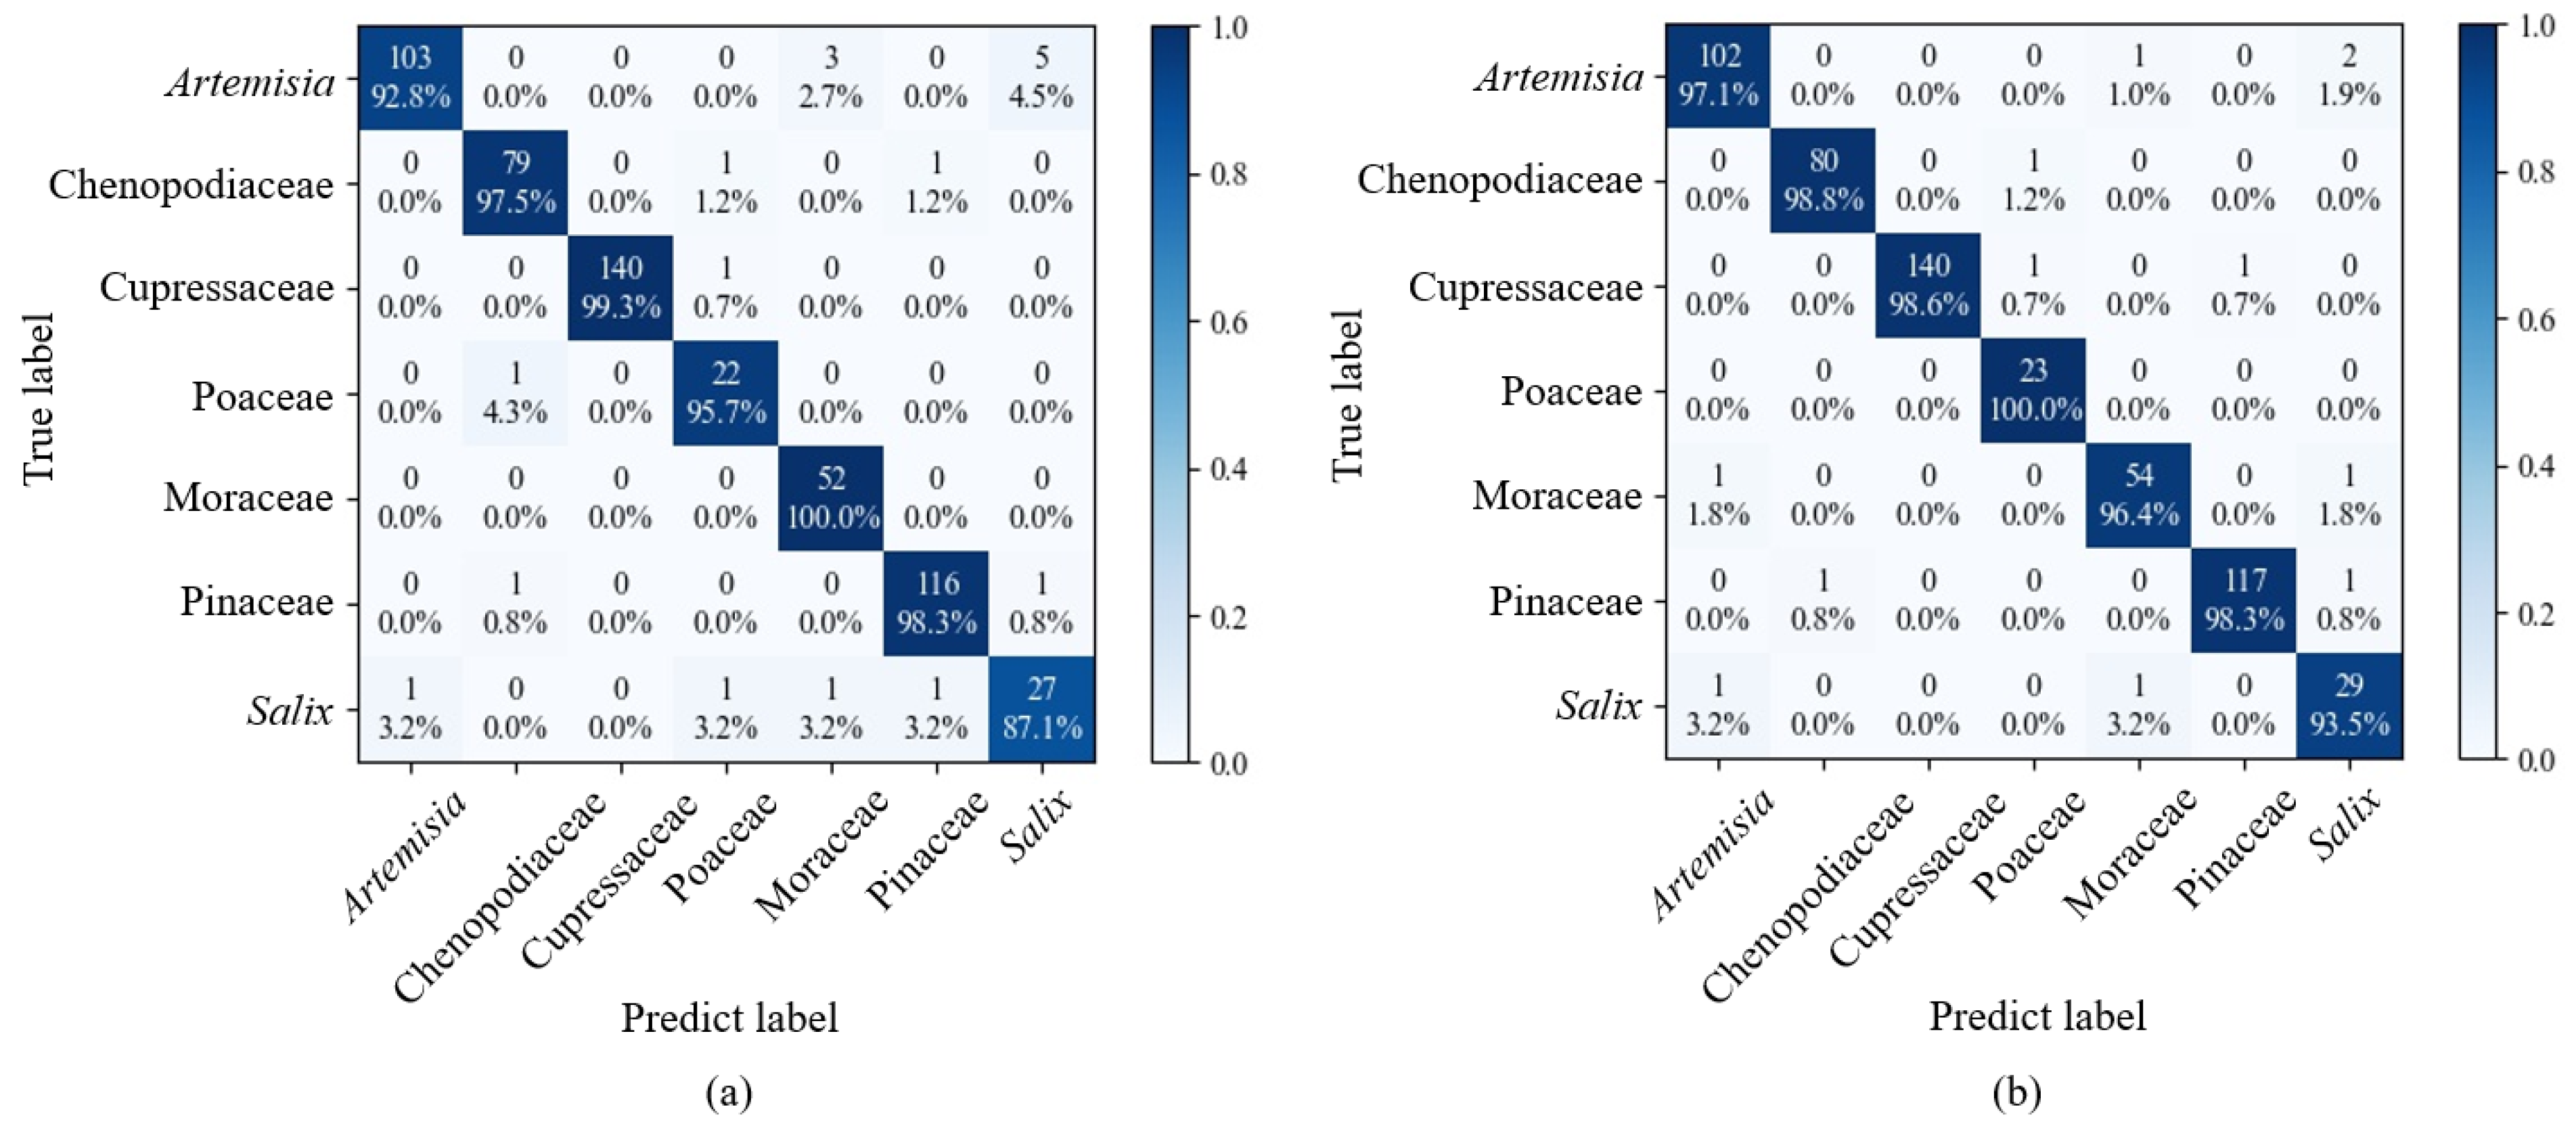
Figure 8 shows the confusion matrices of the proposed method, based on the VGG-19 and Resnet-50 backbones. It can be seen that the performance of the Resnet-50 backbone in each category was better overall than the performance of the VGG-19 backbone.
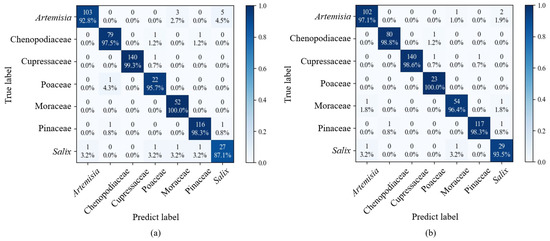
Figure 8.
The confusion matrices for the “Multi-Scale + Selector + Deblur” process with the VGG-19 and Resnet-50 backbones: (a) the confusion matrix of the multi-scale classifier with the VGG-19 backbone; (b) the confusion matrix of the multi-scale classifier with the Resnet-50 backbone. The lighter blue colors represent lower values and darker blue colors represent higher values. The columns represent the true pollen labels while the rows represent the predicted labels that were classified by the multi-scale classifier.
4.2. Ablation Study
In this paper, we mainly used our deblurring pipeline and multi-scale classifier for the automatic pollen grain classification task. In order to demonstrate the effectiveness of each aspect clearly, we conducted ablation experiments to illustrate the contributions of each process.
To verify the effectiveness of the deblurring pipeline, we tested the classification performance of the deblurring pipeline using single-scale classifiers. Results were recorded for the “Single-Scale” and “Single-Scale + Deblur” processes. “Single-Scale” means that a single-scale classifier was used, which was based on the VGG-19 or ResNet-50 backbones, and “Single-Scale + Deblur” represents the single-scale classifier being used with the deblurring pipeline. The image resolutions of the results from the two processes are shown in Figure 9a,b. Thus, we set the normalized resolution to 112 × 112 for the "Single-Scale” process. For “Single-Scale + Deblur”, all of the images in our proposed dataset were deblurred using SRGAN and the normalized resolution was set to 448 × 448.
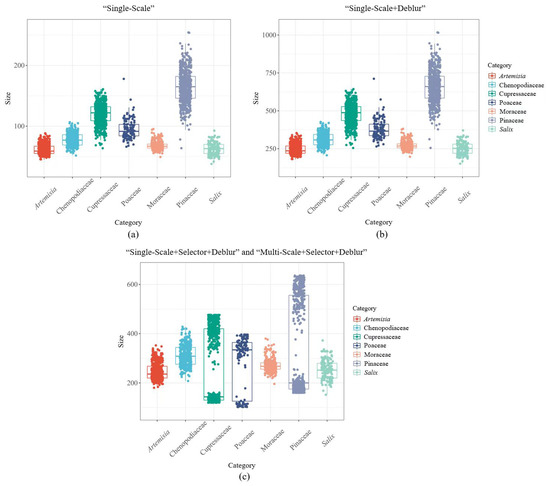
Figure 9.
The boxplots of the image size/resolution of the samples in the seven categories of the ablation experiments: (a) “Single-Scale”; (b) “Single-Scale + Deblur”; (c) “Single-Scale + Selector + Deblur” and “Multi-Scale + Selector + Deblur”.
To verify the effectiveness of our multi-scale classifier, we compared the results from the “Single-Scale + Selector + Deblur” and “Multi-Scale + Selector + Deblur” processes. The normalized resolution was set to 336 × 336 for the single-scale classifier, while the settings for the multi-scale classifier were those that were introduced in Section 4.1. All of the samples in our proposed dataset were processed using our selector addition and deblurring pipeline, the resolution range of which is shown in Figure 9c. It can be seen that the image resolutions in Figure 9a were concentrated under 100 × 100 and that the image resolutions in Figure 9b were concentrated under 400 × 400. Meanwhile, the resolution distribution of samples in the two classifiers was consistent. However, the resolution distribution in Figure 9c could be divided into two resolution ranges, with each range covering the samples of all of the pollen categories, which was more suitable for training the multi-scale classifier. The samples in Figure 9c not only had a higher image quality but could also ensure the feature learning of all of the categories in each branch.
Table 7 shows the classification results from the four cases, with the two groups of ablation experiments for each of the VGG-19 and Resnet-50 backbones. In the first group of ablation experiments, it was obvious that the accuracy and F1-score of the “Single-Scale + Deblur” process was higher than that of the “Single-Scale” process. The “Single-Scale + Deblur” process with the Resnet-50 backbone achieved an accuracy of 0.962 and an F1-score of 0.941, which proved that using SRGAN to deblur images was effective for improving the classification performance. Secondly, the performance of the multi-scale classifier was generally better than that of the single-scale classifier. The highest accuracy was 0.977, which was achieved using the two-branch multi-scale classifier with the Resnet-50 backbone. The F1-score for this process was 0.966, which proved that the multi-scale classification structure was effective for improving the performance of pollen image classification.
Table 7.
The classification results from the four cases: the two groups of ablation experiments for each of the VGG-19 and Resnet-50 backbones.
5. Conclusions and Future Works
In this paper, we constructed a large-scale, high-quality pollen image dataset for the automatic pollen grain classification task in the Beijing area. We utilized the color extraction method to locate pollen grains in scanning images, which reduced the required human resources. Moreover, we designed a deblurring pipeline to enhance the image quality by learning semantic features. We also proposed an easy-to-implement and efficient multi-scale classifier because of the large resolution range of the training dataset. We also investigated the performance of our classifier for the pollen grain classification task and proved its excellent performance. The proposed work could be of great significance for pollen grain classification research in the Beijing area and could have important enlightening significance in the quest to improve the image quality and classification performance of self-collected pollen grain datasets.
In future studies, we aim to extend the number of categories and samples in our dataset for Beijing area. In the process of image cropping during the data pre-processing, we could not ensure that a pollen grain would not be split between two or more images, so we plan to use object detection algorithms to locate the pollen grains in the scanning images to reduce the loss of pollen samples during pre-processing. In terms of experiments, we aim to introduce weighted averages to improve the elimination of data imbalances. We also hope to improve the training efficiency of the classifier by reducing the parameters of the classifier model.
Author Contributions
Conceptualization, X.C. and F.J.; methodology, X.C. and F.J.; software, X.C.; validation, X.C.; formal analysis, X.C. and F.J.; investigation, X.C.; resources, F.J.; data curation, X.C.; writing—original draft preparation, X.C.; writing—review and editing, F.J.; visualization, X.C.; supervision, F.J.; project administration, F.J.; funding acquisition, F.J. All authors have read and agreed to the published version of the manuscript.
Funding
This research was supported by the Beijing Municipal Science and Technology Project (grant number: Z191100009119013) and the International Research Cooperation Seed Fund from the Beijing University of Technology (grant number: 2021B05).
Institutional Review Board Statement
Not applicable.
Informed Consent Statement
Not applicable.
Data Availability Statement
Not applicable.
Conflicts of Interest
The authors declare no conflict of interest.
References
- Liu, Z.; Bai, Y.; Ji, K.; Liu, X.; Cai, C.; Yu, H.; Li, M.; Bao, Y.; Lian, Y.; Gao, B. Detection of Dermatophagoides farinae in the dust of air conditioning filters. Int. Arch. Allergy Immunol. 2007, 144, 85–90. [Google Scholar] [CrossRef]
- Pablos, I.; Wildner, S.; Asam, C.; Wallner, M.; Gadermaier, G. Pollen Allergens for Molecular Diagnosis. Curr. Allergy Asthma Rep. 2016, 16, 31. [Google Scholar] [CrossRef] [PubMed] [Green Version]
- D’amato, G.; Spieksma, F.T.M.; Liccardi, G.; Jäger, S.; Russo, M.; Kontou-Fili, K.; Nikkels, H.; Wüthrich, B.; Bonini, S. Pollen-related allergy in Europe. Allergy 1998, 53, 567–578. [Google Scholar] [CrossRef] [PubMed]
- Yang, Q.L.; Ouyang, T.; Yan, H.; Yang, J.; Li, L.; Xia, X.H. Research Progress of Pollen Allergy. Chin. Agric. Sci. Bull. 2015, 31, 163–167. [Google Scholar]
- Arias, D.G.; Cirne, M.V.M.; Chire, J.E.; Pedrini, H. Classification of pollen grain images based on an ensemble of classifiers. In Proceedings of the 2017 16th IEEE International Conference on Machine Learning and Applications (ICMLA), Cancun, Mexico, 18–21 December 2017; IEEE: Piscataway, NJ, USA, 2017; pp. 234–240. [Google Scholar]
- Travieso, C.M.; Briceño, J.C.; Ticay-Rivas, J.R.; Alonso, J.B. Pollen classification based on contour features. In Proceedings of the 2011 15th IEEE International Conference on Intelligent Engineering Systems, Poprad, Slovakia, 23–25 June 2011; IEEE: Piscataway, NJ, USA, 2011; pp. 17–21. [Google Scholar]
- Redondo, R.; Bueno, G.; Chung, F.; Nava, R.; Marcos, J.V.; Cristóbal, G.; Rodríguez, T.; Gonzalez-Porto, A.; Pardo, C.; Déniz, O.; et al. Pollen segmentation and feature evaluation for automatic classification in bright-field microscopy. Comput. Electron. Agric. 2015, 110, 56–69. [Google Scholar] [CrossRef] [Green Version]
- Haralick, R.M.; Shanmugam, K.; Dinstein, I.H. Textural features for image classification. IEEE Trans. Syst. Man, Cybern. 1973, SMC-3, 610–621. [Google Scholar] [CrossRef] [Green Version]
- Ojala, T.; Pietikainen, M.; Harwood, D. Performance evaluation of texture measures with classification based on Kullback discrimination of distributions. In Proceedings of the 12th International Conference on Pattern Recognition, Jerusalem, Israel, 9–13 October 1994; IEEE: Piscataway, NJ, USA, 1994; Volume 1, pp. 582–585. [Google Scholar]
- Field, D.J. Relations between the statistics of natural images and the response properties of cortical cells. J. Opt. Soc. Am. A 1987, 4, 2379–2394. [Google Scholar] [CrossRef] [PubMed] [Green Version]
- Mukundan, R.; Ong, S.; Lee, P.A. Image analysis by Tchebichef moments. IEEE Trans. Image Process. 2001, 10, 1357–1364. [Google Scholar] [CrossRef]
- Marcos, J.V.; Nava, R.; Cristóbal, G.; Redondo, R.; Escalante-Ramírez, B.; Bueno, G.; Déniz, Ó.; González-Porto, A.; Pardo, C.; Chung, F.; et al. Automated pollen identification using microscopic imaging and texture analysis. Micron 2015, 68, 36–46. [Google Scholar] [CrossRef] [Green Version]
- Allen, G.; Hodgson, R.; Marsland, S.; Flenley, J. Machine vision for automated optical recognition and classification of pollen grains or other singulated microscopic objects. In Proceedings of the 2008 15th International Conference on Mechatronics and Machine Vision in Practice, Auckland, New Zealand, NJ, USA, 2–4 December 2008; IEEE: Piscataway, NJ, USA, 2008; pp. 221–226. [Google Scholar]
- Tello-Mijares, S.; Flores, F. A novel method for the separation of overlapping pollen species for automated detection and classification. Comput. Math. Methods Med. 2016, 2016, 5689346. [Google Scholar] [CrossRef] [Green Version]
- del Pozo-Banos, M.; Ticay-Rivas, J.R.; Alonso, J.B.; Travieso, C.M. Features extraction techniques for pollen grain classification. Neurocomputing 2015, 150, 377–391. [Google Scholar] [CrossRef]
- Daood, A.; Ribeiro, E.; Bush, M. Pollen grain recognition using deep learning. In Proceedings of the International Symposium on Visual Computing, Las Vegas, NV, USA, 12–14 December 2016; Springer: Berlin/Heidelberg, Germany, 2016; pp. 321–330. [Google Scholar]
- de Geus, A.R.; Barcelos, C.A.; Batista, M.A.; da Silva, S.F. Large-scale pollen recognition with deep learning. In Proceedings of the 2019 27th European Signal Processing Conference (EUSIPCO), A Coruna, Spain, 2–6 September 2019; IEEE: Piscataway, NJ, USA, 2019; pp. 1–5. [Google Scholar]
- Gallardo-Caballero, R.; García-Orellana, C.J.; García-Manso, A.; González-Velasco, H.M.; Tormo-Molina, R.; Macías-Macías, M. Precise pollen grain detection in bright field microscopy using deep learning techniques. Sensors 2019, 19, 3583. [Google Scholar] [CrossRef] [PubMed] [Green Version]
- Sevillano, V.; Holt, K.; Aznarte, J.L. Precise automatic classification of 46 different pollen types with convolutional neural networks. PLoS ONE 2020, 15, e0229751. [Google Scholar] [CrossRef] [PubMed]
- Duller, A.; Guller, G.; France, I.; Lamb, H. A pollen image database for evaluation of automated identification systems. Quat. Newsl. 1999, 4–9. [Google Scholar]
- Goncalves, A.B.; Souza, J.S.; Silva, G.G.d.; Cereda, M.P.; Pott, A.; Naka, M.H.; Pistori, H. Feature extraction and machine learning for the classification of Brazilian Savannah pollen grains. PLoS ONE 2016, 11, e0157044. [Google Scholar]
- Battiato, S.; Ortis, A.; Trenta, F.; Ascari, L.; Politi, M.; Siniscalco, C. Pollen13k: A large scale microscope pollen grain image dataset. In Proceedings of the 2020 IEEE International Conference on Image Processing (ICIP), Abu Dhabi, United Arab Emirates, 25–28 October 2020; IEEE: Piscataway, NJ, USA, 2020; pp. 2456–2460. [Google Scholar]
- Astolfi, G.; Goncalves, A.B.; Menezes, G.V.; Borges, F.S.B.; Astolfi, A.C.M.N.; Matsubara, E.T.; Alvarez, M.; Pistori, H. POLLEN73S: An image dataset for pollen grains classification. Ecol. Inform. 2020, 60, 101165. [Google Scholar] [CrossRef]
- Orlov, N.; Shamir, L.; Macura, T.; Johnston, J.; Eckley, D.M.; Goldberg, I.G. WND-CHARM: Multi-purpose image classification using compound image transforms. Pattern Recognit. Lett. 2008, 29, 1684–1693. [Google Scholar] [CrossRef] [PubMed] [Green Version]
- Szegedy, C.; Ioffe, S.; Vanhoucke, V.; Alemi, A.A. Inception-v4, inception-resnet and the impact of residual connections on learning. In Proceedings of the Thirty-First AAAI Conference on Artificial Intelligence, San Francisco, CA, USA, 4–9 February 2017. [Google Scholar]
- Sun, Y.; Xue, B.; Zhang, M.; Yen, G.G.; Lv, J. Automatically designing CNN architectures using the genetic algorithm for image classification. IEEE Trans. Cybern. 2020, 50, 3840–3854. [Google Scholar] [CrossRef] [Green Version]
- Huang, G.; Liu, Z.; Van Der Maaten, L.; Weinberger, K.Q. Densely connected convolutional networks. In Proceedings of the IEEE Conference on Computer Vision and Pattern Recognition, Honolulu, HI, USA, 21–26 July 2017; pp. 4700–4708. [Google Scholar]
- Chen, Z.M.; Wei, X.S.; Wang, P.; Guo, Y. Multi-label image recognition with graph convolutional networks. In Proceedings of the IEEE/CVF Conference on Computer Vision and Pattern Recognition, Long Beach, CA, USA, 15–20 June 2019; pp. 5177–5186. [Google Scholar]
- Park, S.J.; Son, H.; Cho, S.; Hong, K.S.; Lee, S. Srfeat: Single image super-resolution with feature discrimination. In Proceedings of the European Conference on Computer Vision (ECCV), Munich, Germany, 8–14 September 2018; pp. 439–455. [Google Scholar]
- Yao, X.; Wu, Q.; Zhang, P.; Bao, F. Weighted Adaptive Image Super-Resolution Scheme Based on Local Fractal Feature and Image Roughness. IEEE Trans. Multimed. 2020, 23, 1426–1441. [Google Scholar] [CrossRef]
- Liu, B.; Chen, J. A super resolution algorithm based on attention mechanism and srgan network. IEEE Access 2021, 9, 139138–139145. [Google Scholar] [CrossRef]
- Pei, Y.; Huang, Y.; Zou, Q.; Zhang, X.; Wang, S. Effects of Image Degradation and Degradation Removal to CNN-Based Image Classification. IEEE Trans. Pattern Anal. Mach. Intell. 2021, 43, 1239–1253. [Google Scholar] [CrossRef]
- Battiato, S.; Ortis, A.; Trenta, F.; Ascari, L.; Politi, M.; Siniscalco, C. Detection and classification of pollen grain microscope images. In Proceedings of the IEEE/CVF Conference on Computer Vision and Pattern Recognition Workshops, Seattle, WA, USA, 14–19 June 2020; pp. 980–981. [Google Scholar]
- Ledig, C.; Theis, L.; Huszár, F.; Caballero, J.; Cunningham, A.; Acosta, A.; Aitken, A.; Tejani, A.; Totz, J.; Wang, Z.; et al. Photo-realistic single image super-resolution using a generative adversarial network. In Proceedings of the IEEE Conference on Computer Vision and Pattern Recognition, Honolulu, HI, USA, 21–26 July 2017; pp. 4681–4690. [Google Scholar]
- Krizhevsky, A.; Sutskever, I.; Hinton, G.E. Imagenet classification with deep convolutional neural networks. Adv. Neural Inf. Process. Syst. 2012, 1, 1097–1105. [Google Scholar] [CrossRef]
- Simonyan, K.; Zisserman, A. Very deep convolutional networks for large-scale image recognition. arXiv 2014, arXiv:1409.1556. [Google Scholar]
- He, K.; Zhang, X.; Ren, S.; Sun, J. Deep residual learning for image recognition. In Proceedings of the IEEE Conference on Computer Vision and Pattern Recognition, Las Vegas, NV, USA, 27–30 June 2016; pp. 770–778. [Google Scholar]
- Adelson, E.H.; Anderson, C.H.; Bergen, J.R.; Burt, P.J.; Ogden, J.M. Pyramid methods in image processing. RCA Eng. 1984, 29, 33–41. [Google Scholar]
- Perona, P.; Malik, J. Scale-space and edge detection using anisotropic diffusion. IEEE Trans. Pattern Anal. Mach. Intell. 1990, 12, 629–639. [Google Scholar] [CrossRef] [Green Version]
- Pedersoli, M.; Vedaldi, A.; Gonzalez, J.; Roca, X. A coarse-to-fine approach for fast deformable object detection. Pattern Recognit. 2015, 48, 1844–1853. [Google Scholar] [CrossRef]
- Duchi, J.; Hazan, E.; Singer, Y. Adaptive subgradient methods for online learning and stochastic optimization. J. Mach. Learn. Res. 2011, 12, 2121–2159. [Google Scholar]
- Srivastava, N.; Hinton, G.; Krizhevsky, A.; Sutskever, I.; Salakhutdinov, R. Dropout: A simple way to prevent neural networks from overfitting. J. Mach. Learn. Res. 2014, 15, 1929–1958. [Google Scholar]


Publisher’s Note: MDPI stays neutral with regard to jurisdictional claims in published maps and institutional affiliations. |
© 2022 by the authors. Licensee MDPI, Basel, Switzerland. This article is an open access article distributed under the terms and conditions of the Creative Commons Attribution (CC BY) license (https://creativecommons.org/licenses/by/4.0/).