Article

An Innovative Process Design Model for Machined Surface Error Distribution Consistency in High-Efficiency Milling

Key Laboratory of Advanced Manufacturing and Intelligent Technology, Ministry of Education, Harbin University of Science and Technology, Harbin 150080, China
*
Author to whom correspondence should be addressed.
Appl. Sci. 2022, 12(14), 7199; https://doi.org/10.3390/app12147199
Submission received: 27 June 2022 / Revised: 12 July 2022 / Accepted: 13 July 2022 / Published: 17 July 2022
(This article belongs to the Section Mechanical Engineering)

Abstract

:

Featured Application

Authors are encouraged to provide a concise description of the specific application or a potential application of the work. This section is not mandatory.

Abstract

In the process of high-efficiency milling, due to the impact of plunge caused by the intermittent cutting of the milling cutter, there is a high frequency and small vibration between the milling cutter and the workpiece. In this paper, we construct a transient cutting model for high-efficiency milling tools under the action of vibration, and analyze the factors influencing the consistency of the machined surface error and its distribution. The design variables for the consistency of error distribution of high-efficiency milling are obtained, the significance analysis of the influencing factors is carried out using the central composite experimental design and the response surface method, the interaction between the influencing factors is studied, the evaluation index of the consistency of error distribution of milling is proposed, and the process design method for the consistency of error distribution of the machined surface is proposed and validated. The results of the verification experiments show that, compared with the original process scheme, the two maximum errors corresponding to the new process scheme are on average 61.3% smaller than those of the old process scheme, and the consistency of the machined surface error distribution of the new process scheme is significantly improved compared with the old process scheme.

1. Introduction

High-efficiency milling cutters are widely used in the high-quality machining of key components in high-end manufacturing fields such as aerospace and medical devices, which require high efficiency and high precision [1,2]. Affected by factors such as the cutting force excitations in the milling process—impacts and vibrations caused by the cutter tooth cutting into the workpiece—the milling cutter can easily deviate from the initial design position, resulting in changes in the relative positional relationship between the cutter and the workpiece at all times. The consequence is that the consistency of the error distribution of the machined surface is reduced, and the overall machining quality of parts is difficult to guarantee. Therefore, it is of great importance to study the influencing factors and laws of machined surface error and its distribution consistency for high-efficiency and high-precision milling process design, and for improving the surface quality consistency of large parts [3,4,5].
In the formation process of the machined surface, affected by the intermittent cutting of the milling cutter, there is an obvious indigenous impact between the cutter tooth and the workpiece, which makes the cutter tooth generate high-frequency and small-amplitude vibrations relative to the workpiece, directly leading to the change in the instantaneous positional relationship between the cutter tooth and the workpiece and, thus, leading to changes in the machined surface’s morphology [6,7,8]. The above results make it difficult to accurately control the consistency of the machined surface error distribution under the conditions of milling cutter tooth wear and inconsistent initial installation error of multiple cutter teeth [9,10,11]. Therefore, clarifying the influencing mechanisms of milling vibration and cutter tooth installation error on the consistency of milling error distribution, and revealing the interaction of these factors in the process of milling error distribution consistency, are crucial to realizing the process design and accurate control of high-efficiency and high-quality milling.
Domestic and foreign scholars have made many contributions to the modeling of milling machining error distribution and the analysis of its influencing factors. Zhang M. et al. conducted a comprehensive experiment on the surface integrity of Ti-6Al-4V rotary ultrasonic elliptical end-milling under different vibration amplitudes and cutting speeds. It was found that the changing trend of surface integrity under different vibration amplitudes and cutting speeds was the opposite. A surface integrity control method was proposed [12]. Wang C. et al. proposed a reliability sensitivity analysis method for corner-milling precision considering the uncertainty of cutting parameters in the milling process [13]. Deng C. et al. established a reliability model to predict flutter vibration based on reliability analysis of the milling system [14]. Zhao Xiong et al. built a milling stability model based on the principle of regenerative effects, and proposed an adaptive optimization method for milling parameters driven by real-time vibration data [15]. Based on variance analysis, Aslan A. et al. studied the influence of cutting parameters and tool geometry on process variables, and conducted multiple optimizations based on RSM, proving that vibration, flank wear, and cutting force were correlated [16]. Salur E. et al. prepared metal matrix composites by hot-pressing using different production parameters. Drilling experiments were carried out on a computer numerically controlled vertical machining center without cutting fluid. Analysis of variance (ANOVA) was performed to determine the effects of production parameters on the thrust and surface roughness of metal matrix composites drilled at different feed rates [17]. Pimenov D. Y et al. discussed online trends in modern methods for monitoring tool conditions during different machining operations. A sensor system for monitoring tool wear was developed using sensors and artificial intelligence [18]. Kuntoğlu M. et al. carried out a review of the open literature on the current state of research on information data chains and sensors, etc., making an important contribution to the research on error minimization and productivity maximization [19]. The above methods have important guiding relevance for the design methods of the machined surface error response characteristics and error distribution consistency. However, existing process methods only aim at the overall level of error, so there are also deficiencies in the response characteristics of machined surface error to influencing factors, and the consistency of machining error distribution is not taken into account.
In this work, a formation of machined surface error was analyzed, and the variation in machining error along the feed and cutting depth direction on the machined surface was studied using the error calculation model. By analyzing the interaction between cutter tooth error and milling vibration in the formation of the machined surface, the influencing factors of machined surface error were clarified by the variance analysis model. The response surface methodology model of the various characteristics of machined surface position error and shape error was developed using response surface methodology, and its accuracy was verified. The 3D response surface of design variables on machined surface error was developed using the Design-Expert response surface analysis program, and the influences of interactions between design variables on the machined surface error were studied. The consistency evaluation model of machined surface error distribution was proposed. Finally, the process design model for machined surface error distribution consistency was proposed and validated by experiments.

2. Calculation Model of the Machined Surface Error under Vibration

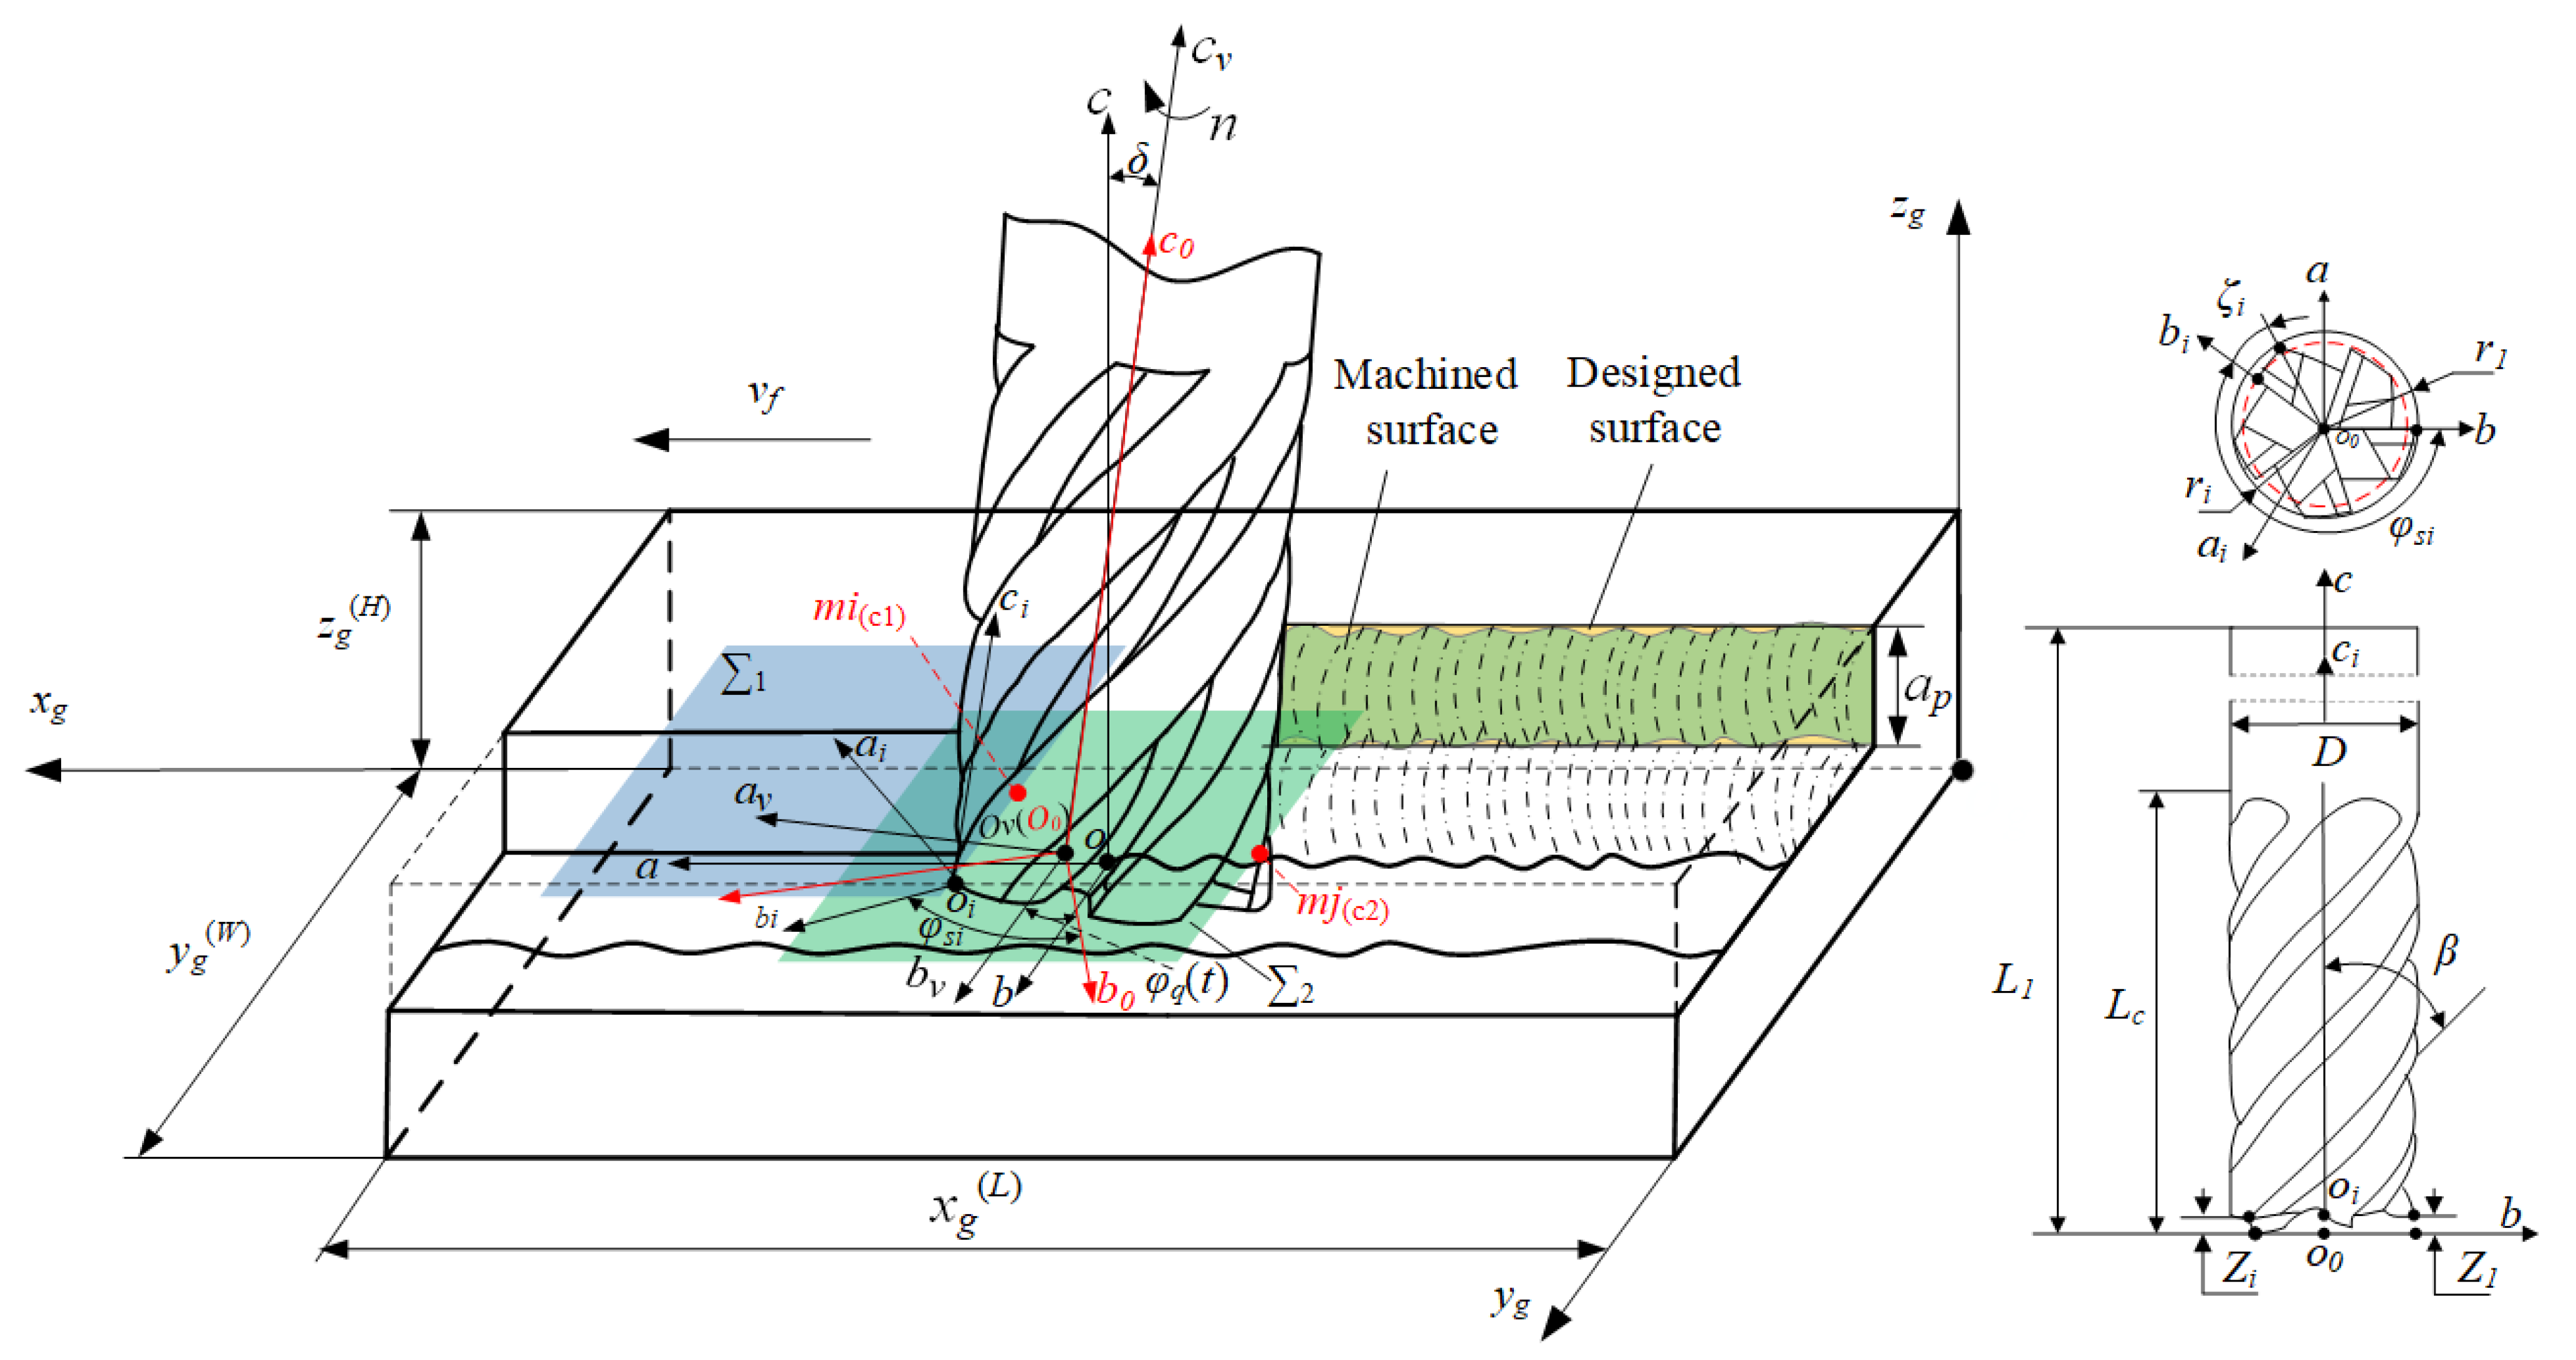
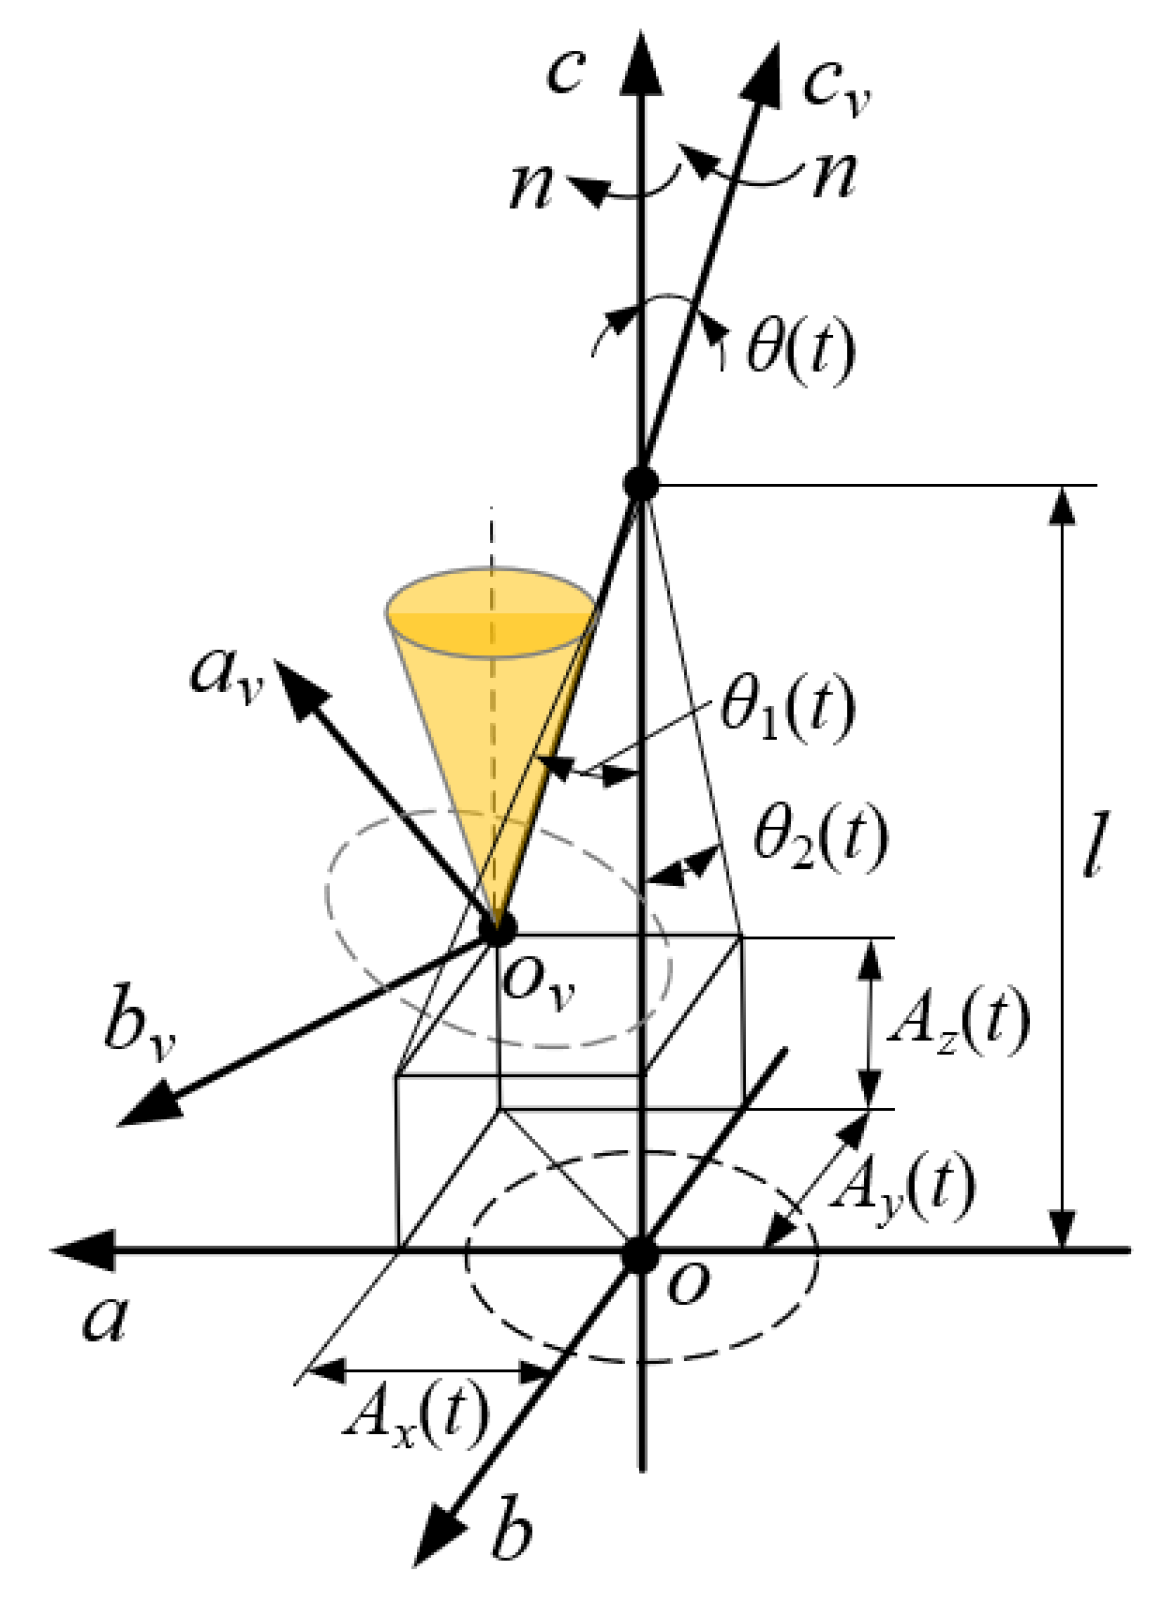
2.1. Cutting Trajectory of the Milling Cutter under Vibration

High-frequency, intermittent cutting loads and inconsistent distribution of initial installation errors in the milling process result in high-frequency, small-amplitude vibrations between the milling cutter and the workpiece. The vibration during the milling process causes an overall offset in the attitude of the milling cutter and the cutter teeth, and the offset distance and direction are closely related to the parameters of the milling vibration amplitude and vibration direction, which cause a change in the contact angle and contact area between the cutter teeth and the workpiece, thus affecting the formation of the machined surface. Therefore, to determine the influence of vibration on the processing surface morphology, surface errors, and their distribution consistency, the instantaneous cutting attitude geometric model of a high-efficiency milling cutter was constructed, as shown in Figure 1. The corresponding variables in the graph are explained in Table 1.
Based on the positional relationship between the milling cutter teeth and the workpiece in Figure 1, the positional coordinate conversion relationship between any point of the cutting edge of the milling cutter teeth and any point on the workpiece can be constructed to provide the basis for solving the trajectory of any point on the milling cutter teeth, as shown in Equation (1):
x g y g z g 1 T = A 3 A 2 T 3 T 2 A 1 T 1 a i   b i   c i     1 T
where A1, A2, and A3 are translation matrices, and T1, T2, and T3 are rotation matrices, as shown in Equations (2)–(4):
A 1 = 1 0 0 0 0 1 0 0 0 0 1 Z i 0 0 0 1 ,   A 2 = 1 0 0 A x ( t ) 0 1 0 A y ( t ) 0 0 1 A z ( t ) 0 0 0 1 ,   A 3 = 1 0 0 v f t x g 0 1 0 y g W + r 1 a e 0 0 1 z g H a p 0 0 0 1
T 1 = cos φ s i - sin φ s i 0 0 sin φ s i cos φ s i 0 0 0 0 1 0 0 0 0 1 ,   T 2 = cos φ q ( t ) - sin φ q ( t ) 0 0 sin φ q ( t ) cos φ q ( t ) 0 0 0 0 1 0 0 0 0 1
T 3 = cos θ 2 ( t ) sin θ 1 ( t ) sin θ 2 ( t ) cos θ 1 ( t ) sin θ 2 ( t ) 0 - sin θ 2 ( t ) sin θ 1 ( t ) cos θ 2 ( t ) cos θ 1 ( t ) cos θ 2 ( t ) 0 0 sin θ 1 ( t ) cos θ 1 ( t ) 0 0 0 0 1  
According to the cutter structure and instantaneous cutting behavior, combined with the cutter radius ri corresponding to each cutter tooth and the position angle corresponding to the cutting, the cutting trajectory of any cutter tip of the cutter can be obtained. After the three-dimensional coordinate transformation, the trajectory in the workpiece coordinate system can be obtained. Further considering the overall offset of the cutter tooth position caused by the vibration in the milling process, the cutter tooth positional offset model under the action of vibration can be constructed, as shown in Figure 2.
Where l is the overhang of the milling cutter, while θ1(t) and θ2(t) are the projection angles of the attitude angle θ on the aoc and boc surfaces, respectively, which are calculated as shown in Equation (5):
θ 1 ( t ) = arctan ( A y ( t ) l A z ( t ) ) ,   θ 2 ( t ) = arctan ( A x ( t ) l A z ( t ) )
In Equation (6), at time t, the angle φq(t) between the structure coordinate system of the milling cutter and the cutting coordinate system with milling vibration can be expressed as follows:
φ g 0 = arcsin ( r g a e ) / r g + π / 2
φ q t = φ g ( 0 ) + φ s g + 2 π n t φ g ( 0 ) + φ s g + 2 π n t 2 π 2 π
The milling cutter tooth cutting edge equation is shown in Equation (8):
S i ( x g , y g , z g ) = x g ( t ) y g ( t ) z g ( t ) 1 = ψ i r i sin ζ i r i cos ζ i ( ζ i / 360 ) 2 π r i cot β 1 r i = r max Δ r i , ζ i 0 °
where ψi = A3A2T3T2A1T1. ζi is the hysteresis angle of any point of the cutting edge with respect to the tool tip point, and β is the projection angle of the cutting edge in the z-direction.
The change in the contact angle of the milling cutter teeth caused by the above vibration and the equation of the cutting edge of the cutter teeth can be brought into Equation (1) to obtain the cutting edge trajectory of the milling cutter teeth under vibration conditions.

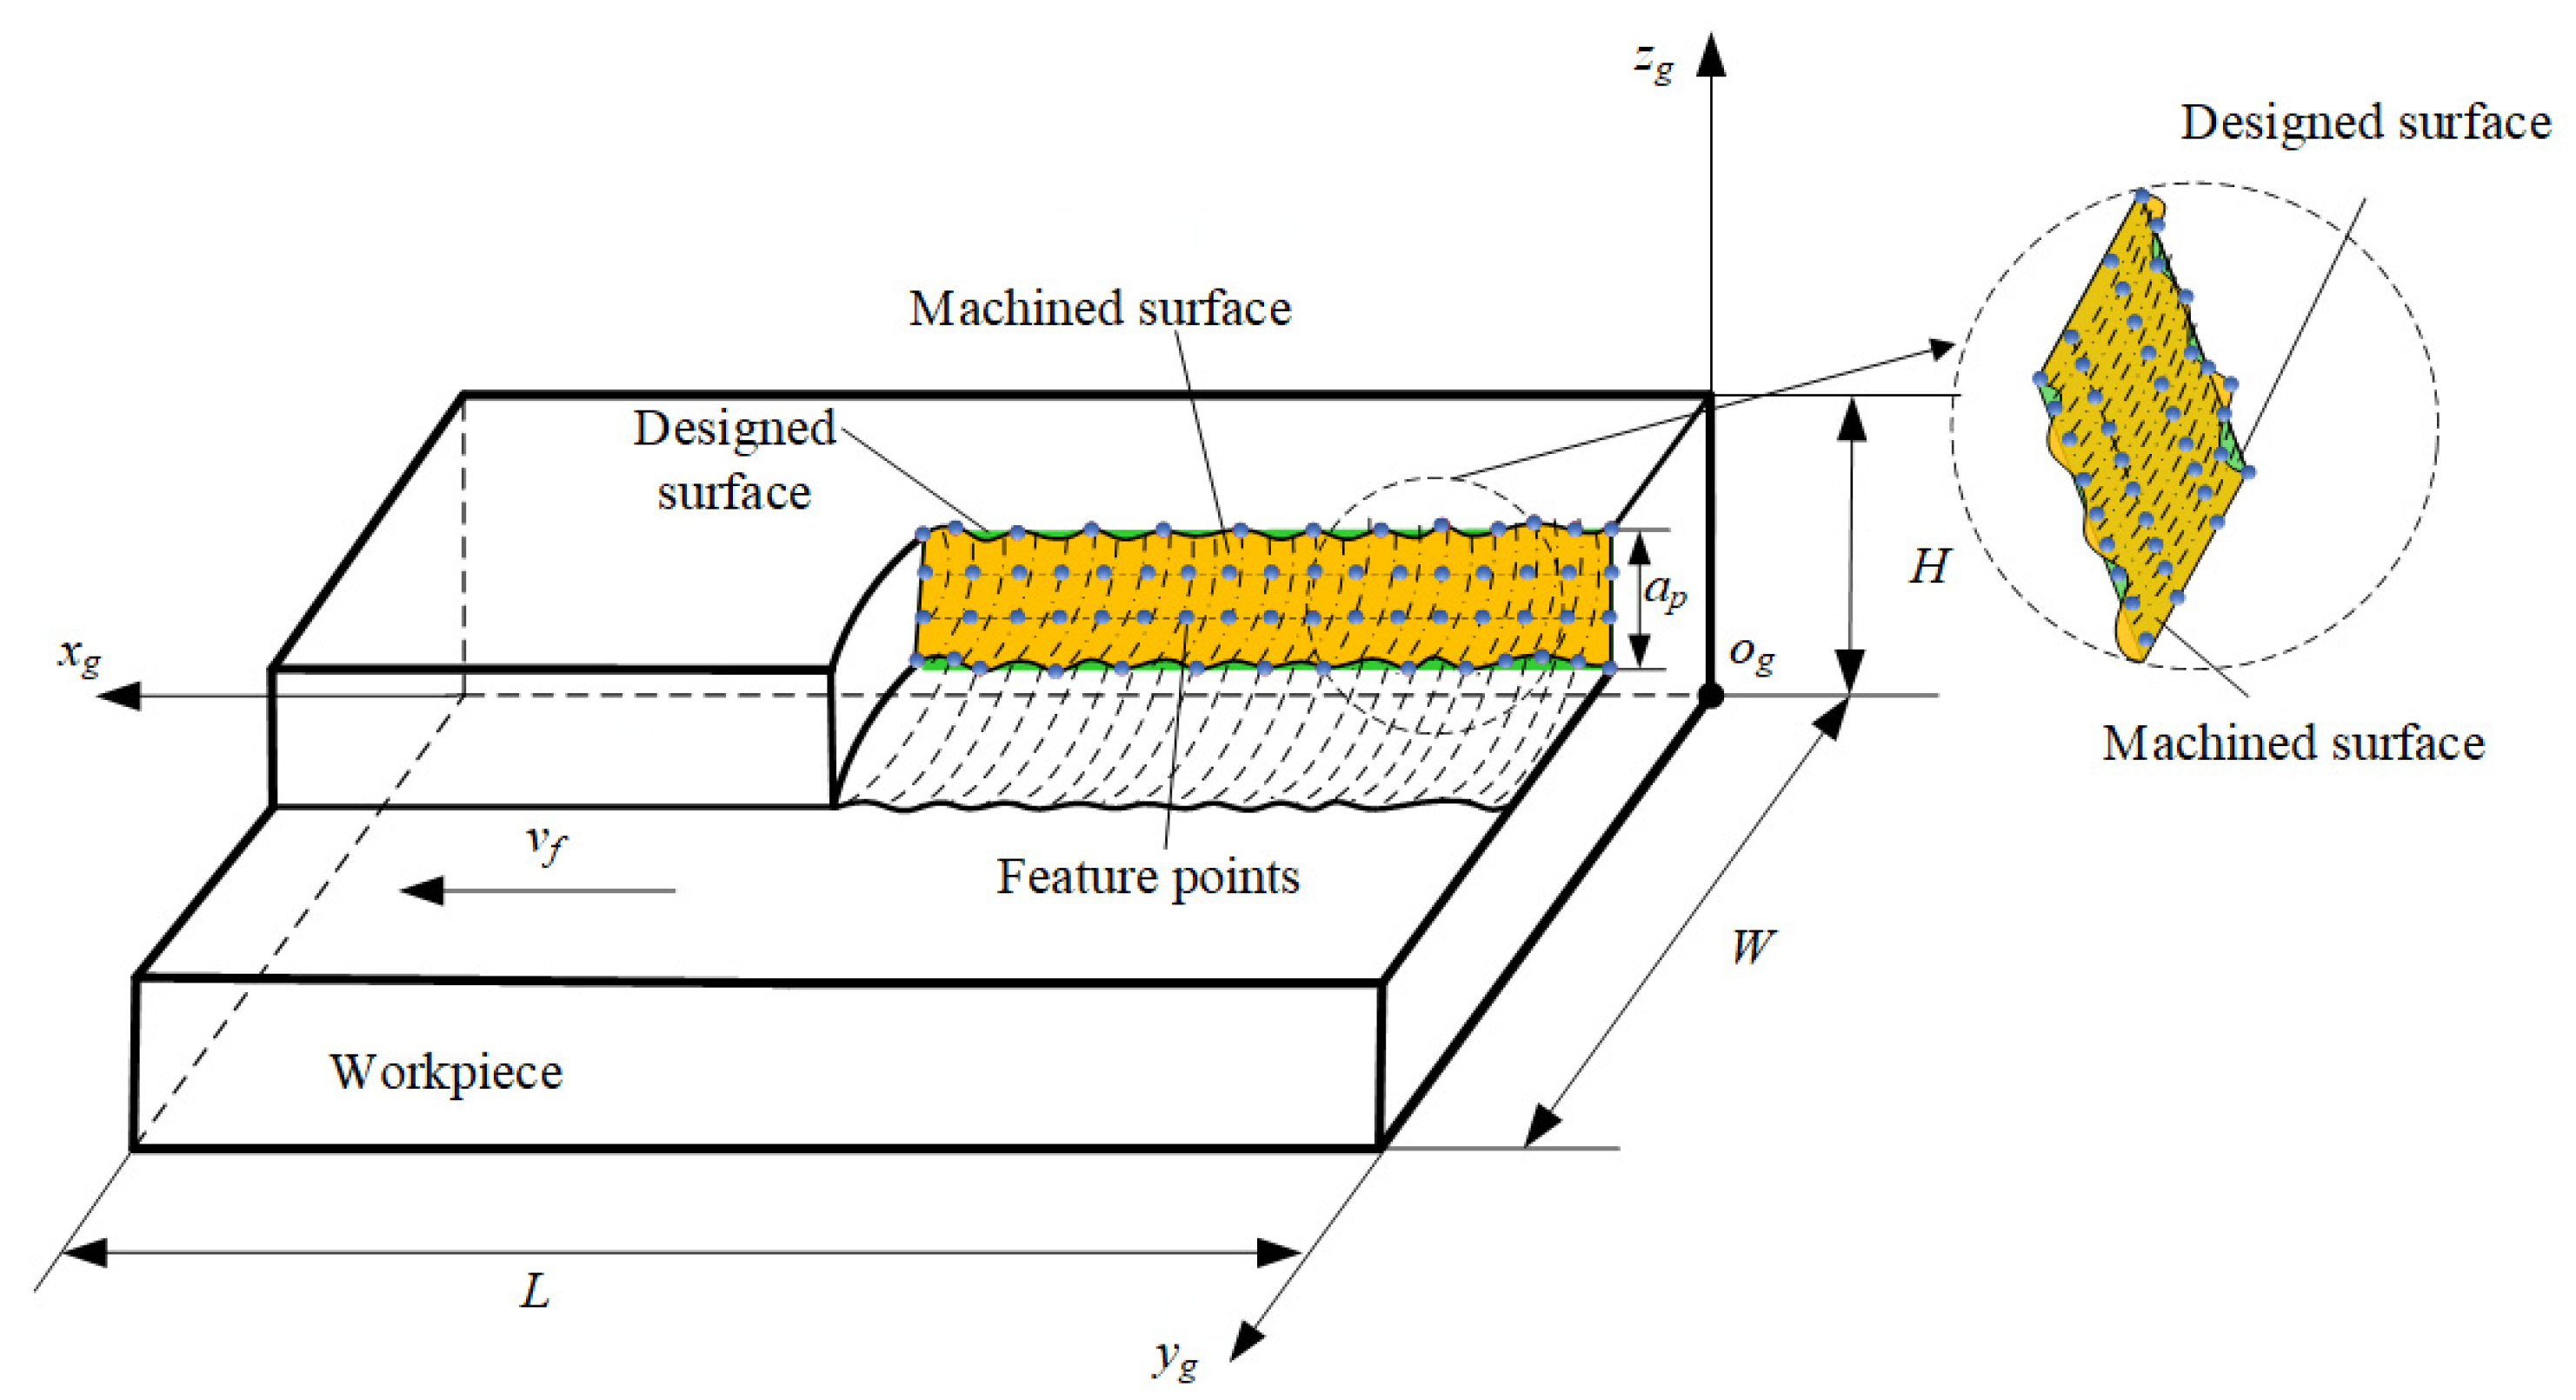
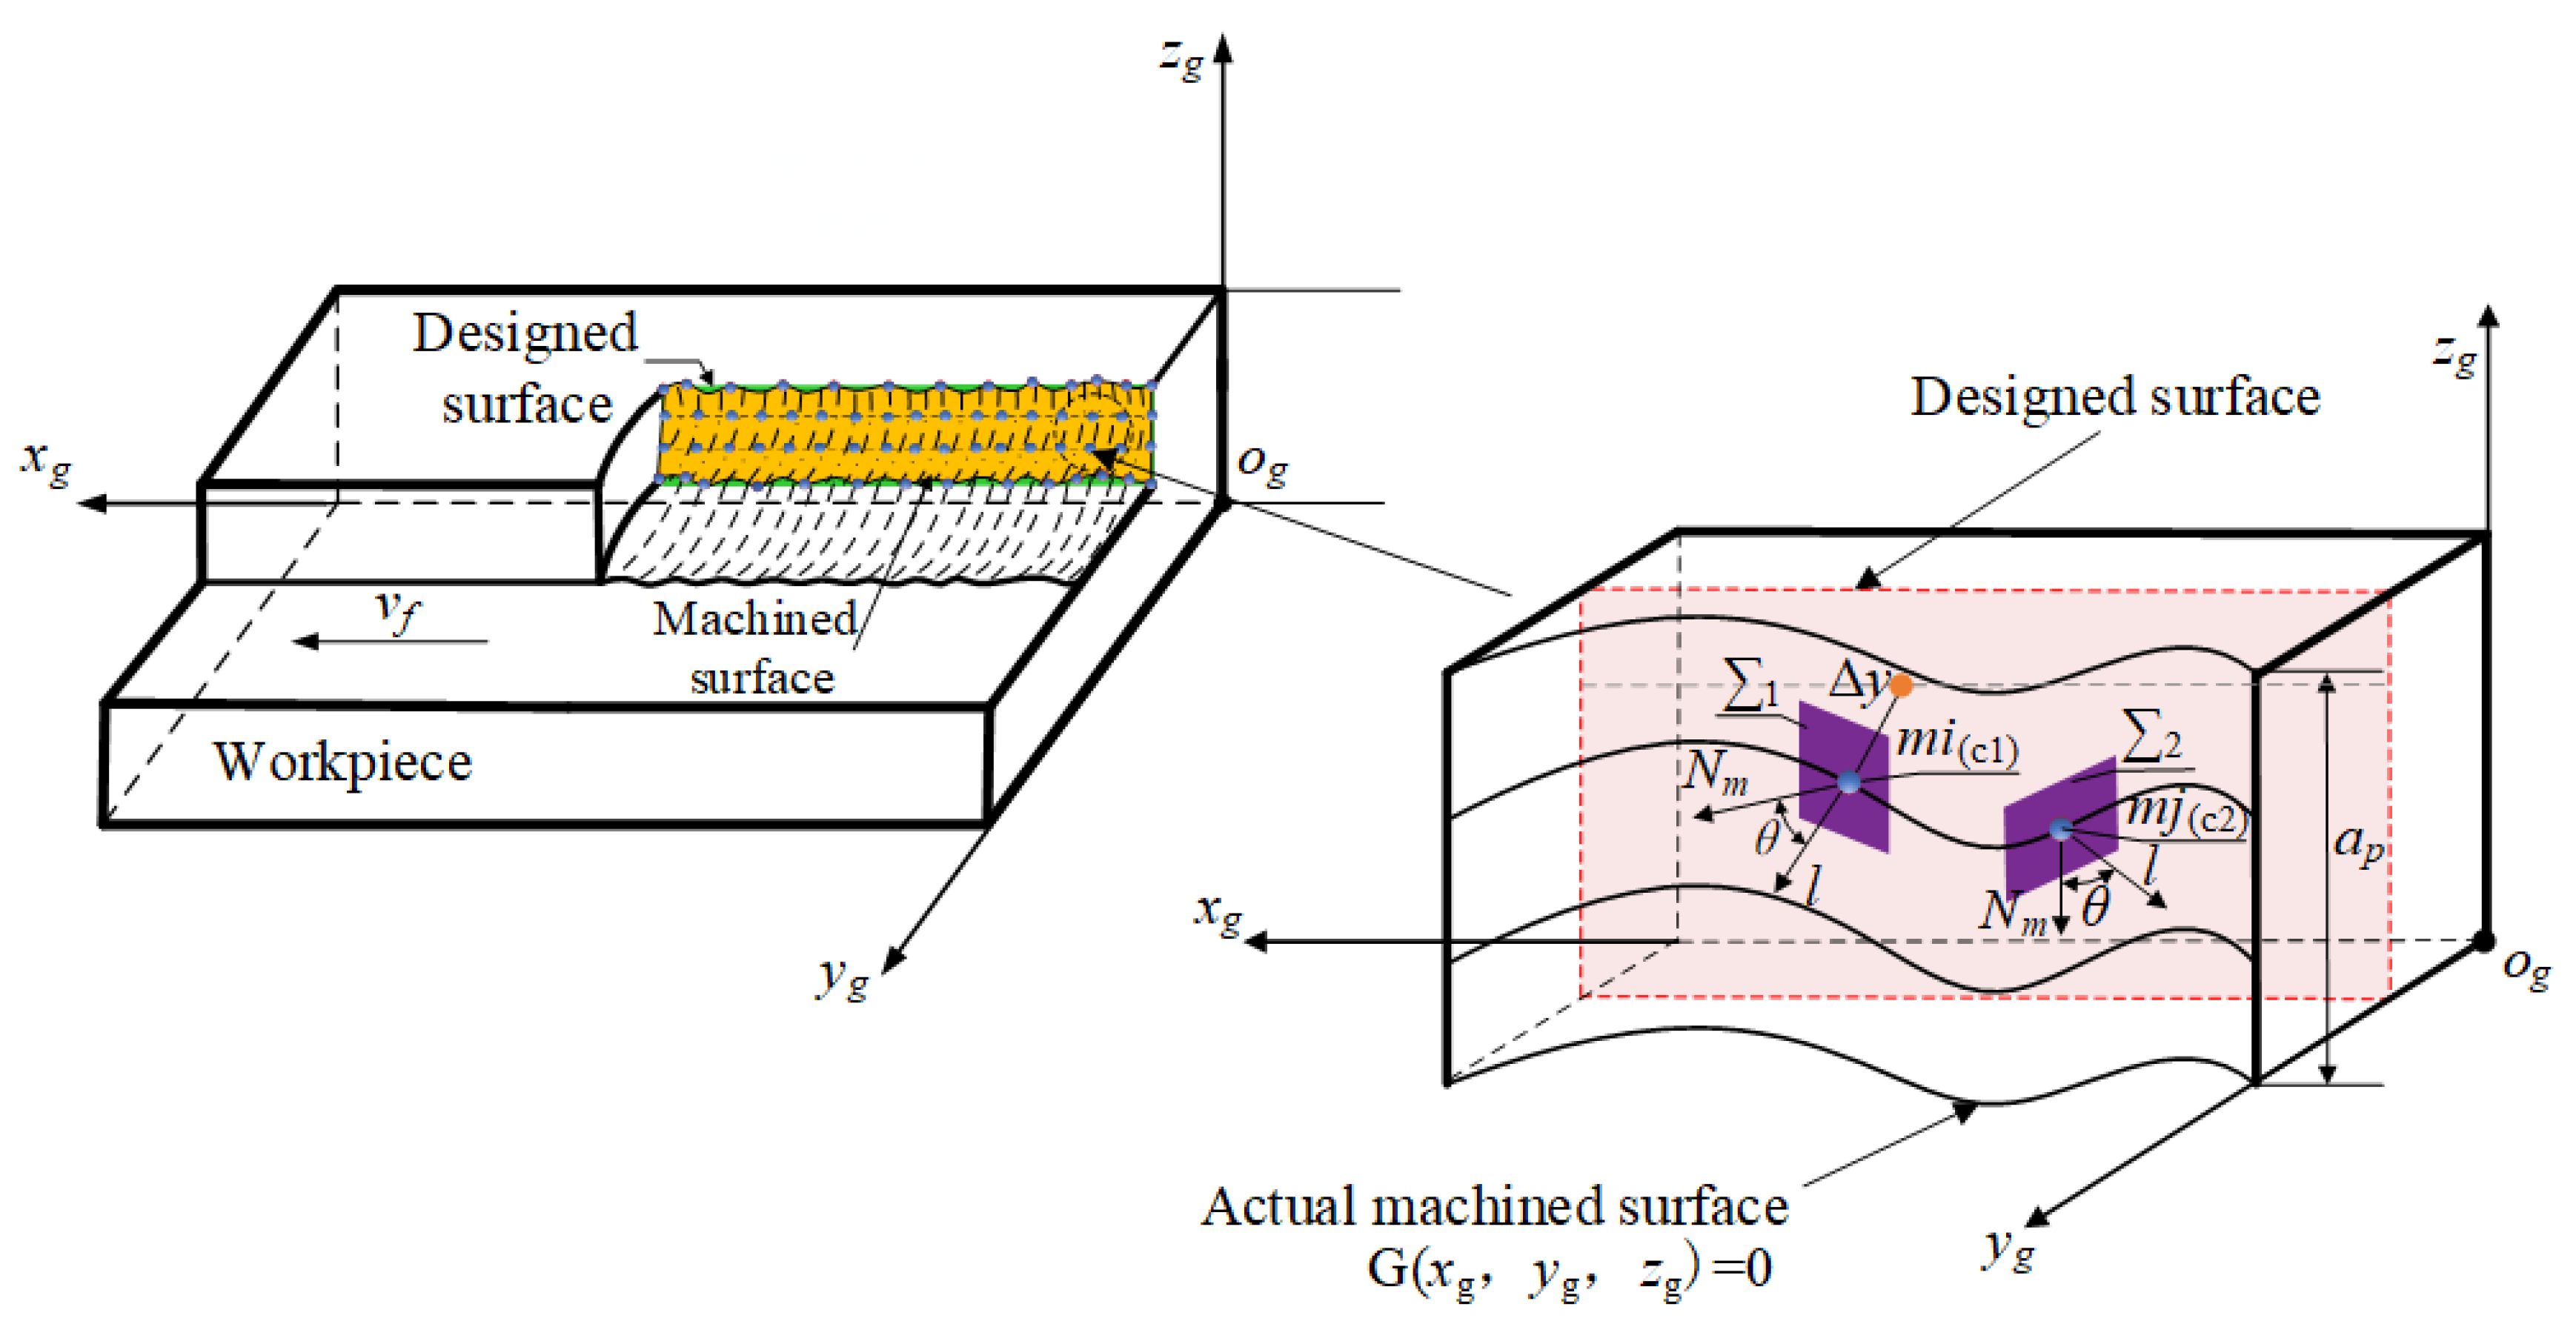
2.2. Calculation Model of the Machined Surface Error under Vibration

The shape of the machined surface during high-efficiency milling is a visual representation of the cutting edge trajectory of the cutter teeth, where the offset of the tooth position caused by milling vibration causes the machined surface to deviate from the ideal design plane. The above results, under the influence of the momentary variation in milling vibration, eventually lead to a variable state of machined surface error distribution under long-term cutting conditions, as shown in Figure 3.
The equation for the milled surface under the action of vibration is assumed to be as follows:
G x g ( t ) ,   y g ( t ) ,   z g ( t ) = 0
where
x g t = x Δ t + v f t - Δ t + A Δ x y g t = a e t + A Δ y z g t = a p t + A Δ z
Δ t = z q ( H a p ) tan β / v f
where xΔt is the position of the first tooth cutting into the workpiece along the direction of feed speed at t0, ae(t) is the position of the cutter tooth along the cutting width, ap(t) is the position of the cutter tooth along the cutting depth direction, and AΔx, AΔy, and AΔz are the vibration offsets caused by the machined surface feature points along the feed speed direction, cutting width, and depth of the cut, respectively.
For any of the feature points in Figure 3, there are errors in position and angle compared to the ideal design plane; among them, the positional errors are the amount of variation of the feature point on the actual machined surface and the ideal reference planes, while the angular errors are the deviation of the normal vector of the plane where the feature point is located from the normal vector of the reference planes. We constructed a solution model for machined surface positional errors and angular errors, as shown in Figure 4.
In Figure 4, mi(c1) and mj(c2) are any two non-overlapping location points on the machined surface; l is the normal vector at the location of the surface where mi(c1) is located; Δy is the positional error between the ideal point and the actual point; θ is the angular error of the machined surface, where θ is the acute angle formed by the normal vector of the surface at the selected point and the normal vector of the reference plane; Nm is the normal vector of the reference planes where the feature point is located; and ∑1 and ∑2 are the tangent planes at the respective position points.
According to the positional relationship in Figure 4, the machined surface positional and angular errors can be obtained from Equations (12) and (13), respectively:
Δ y t = y g t - y g 0
θ = arccos N l N l
Bringing Equation (9) into Equations (12) and (13):
Δ y = G y g t y g 0
θ = arccos G ( x g , y g , z g ) x g , G ( x g , y g , z g ) y g , G ( x g , y g , z g ) z g l G ( x g , y g , z g ) x g , G ( x g , y g , z g ) y g , G ( x g , y g , z g ) z g l
where Gyg(t) denotes the value of the coordinate along the cutting width of the milling cutter at time t.
According to Equations (14) and (15), the relationship between surface positional and angular errors and process design variables during high-efficiency milling can be obtained, providing a basis for consistency of error distribution judgments.

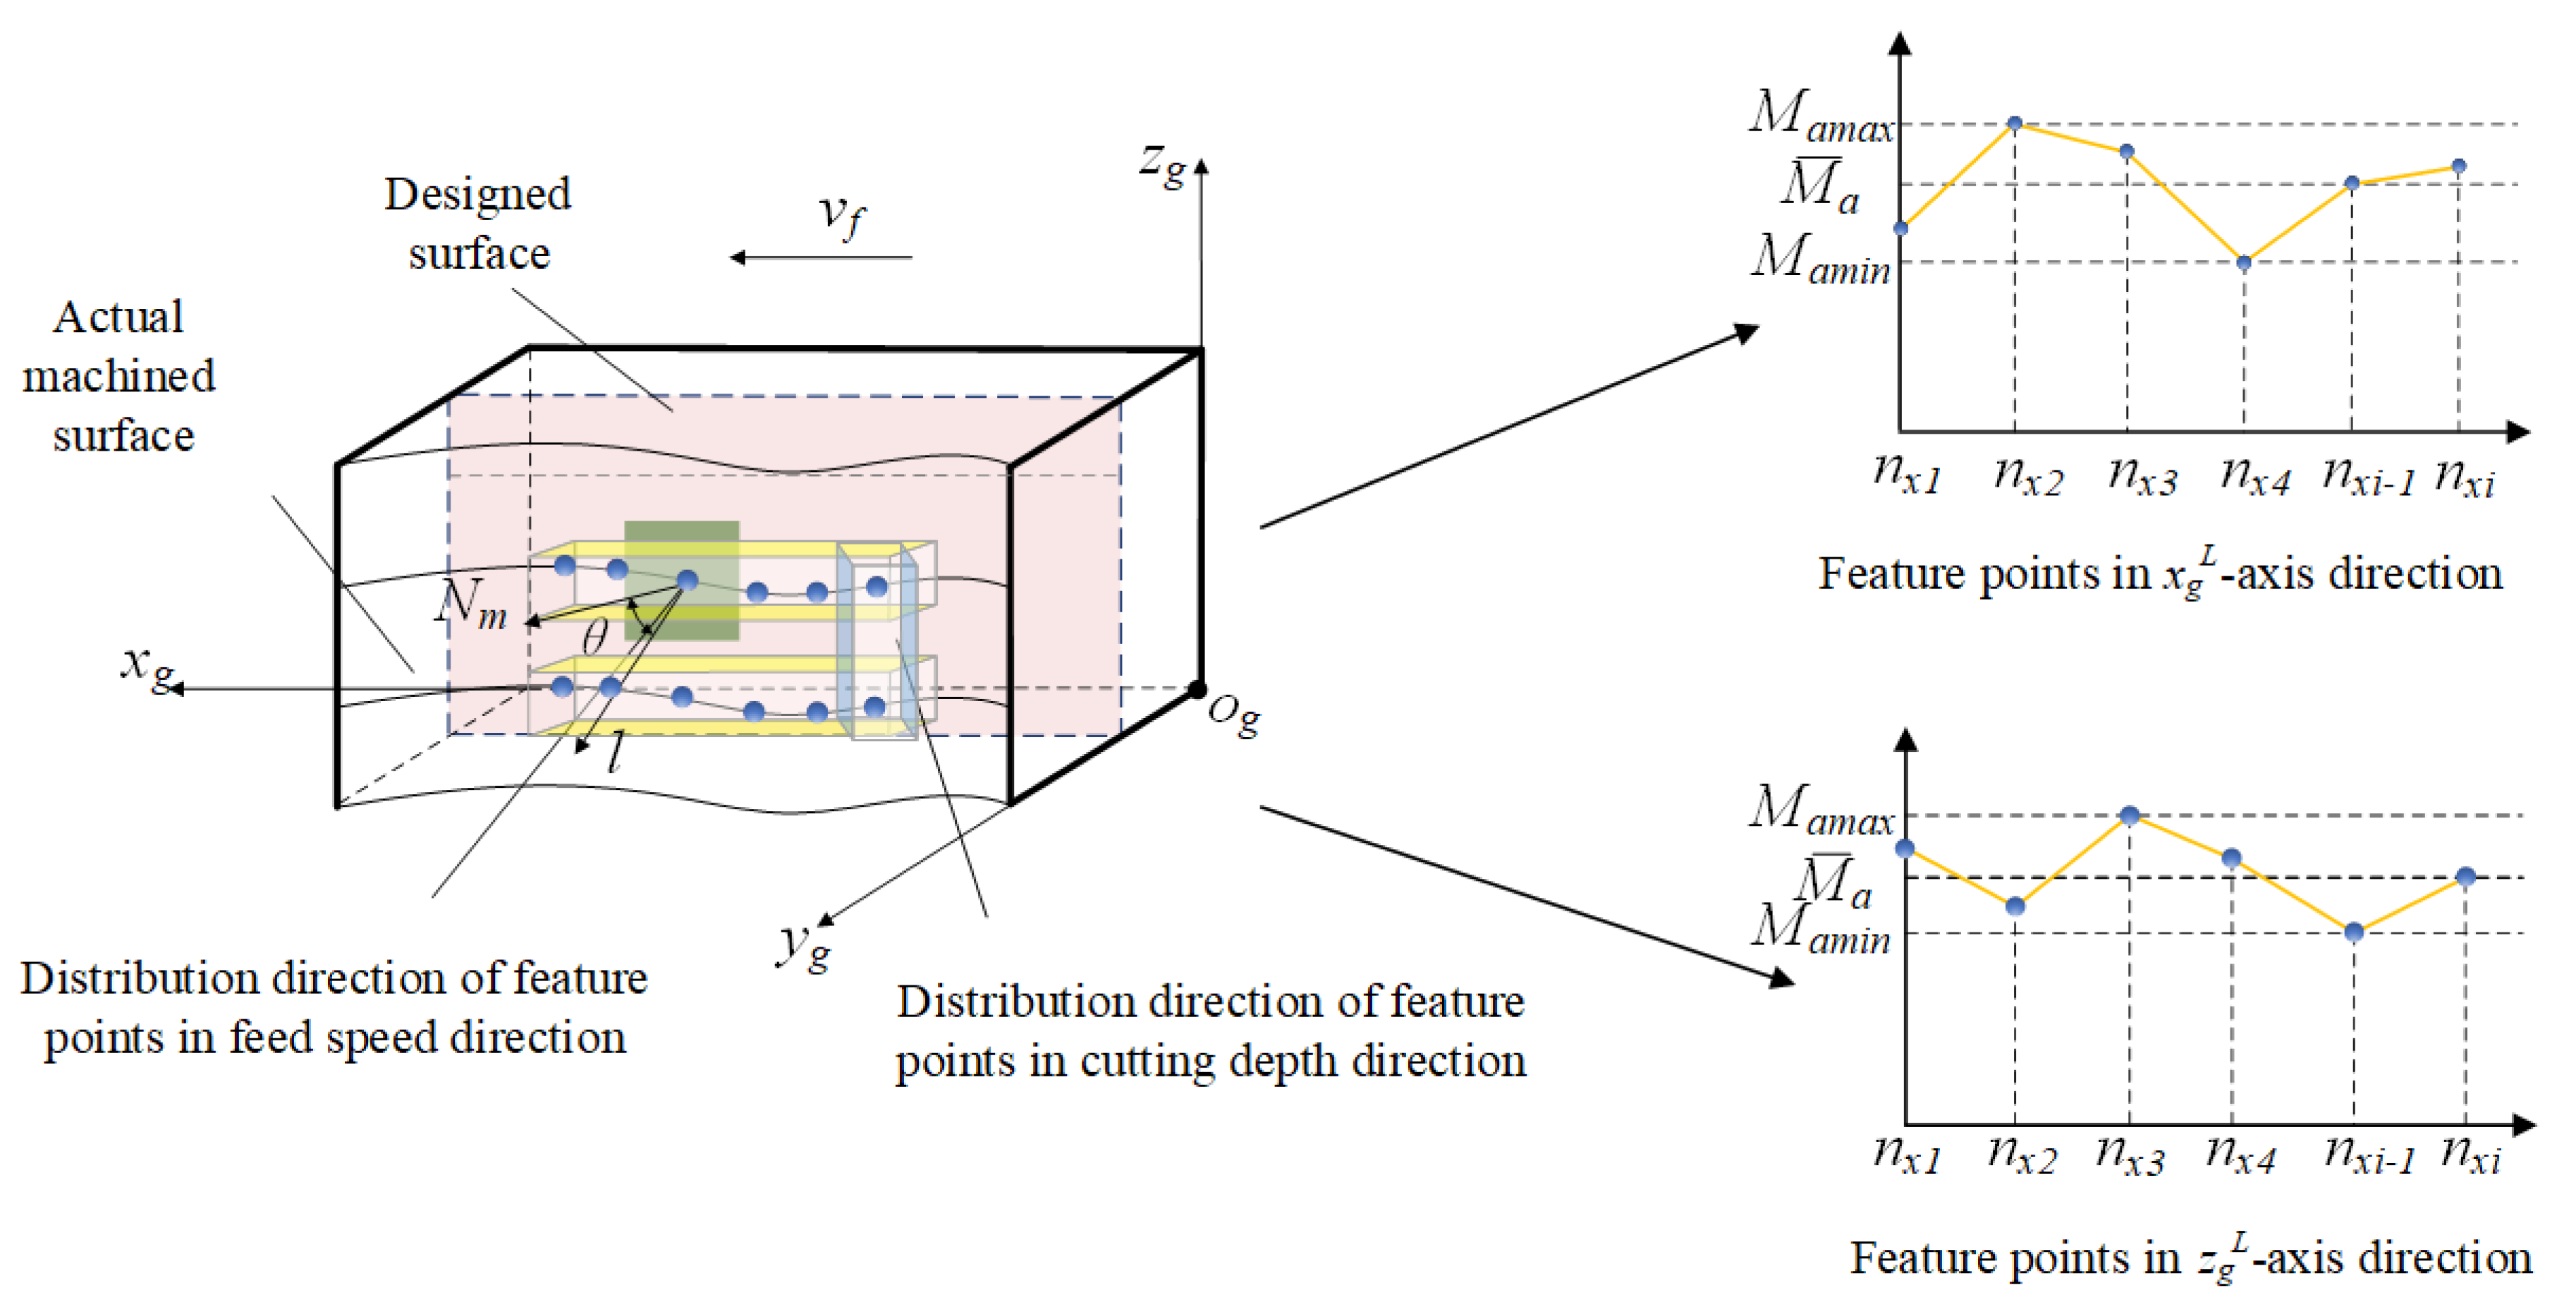
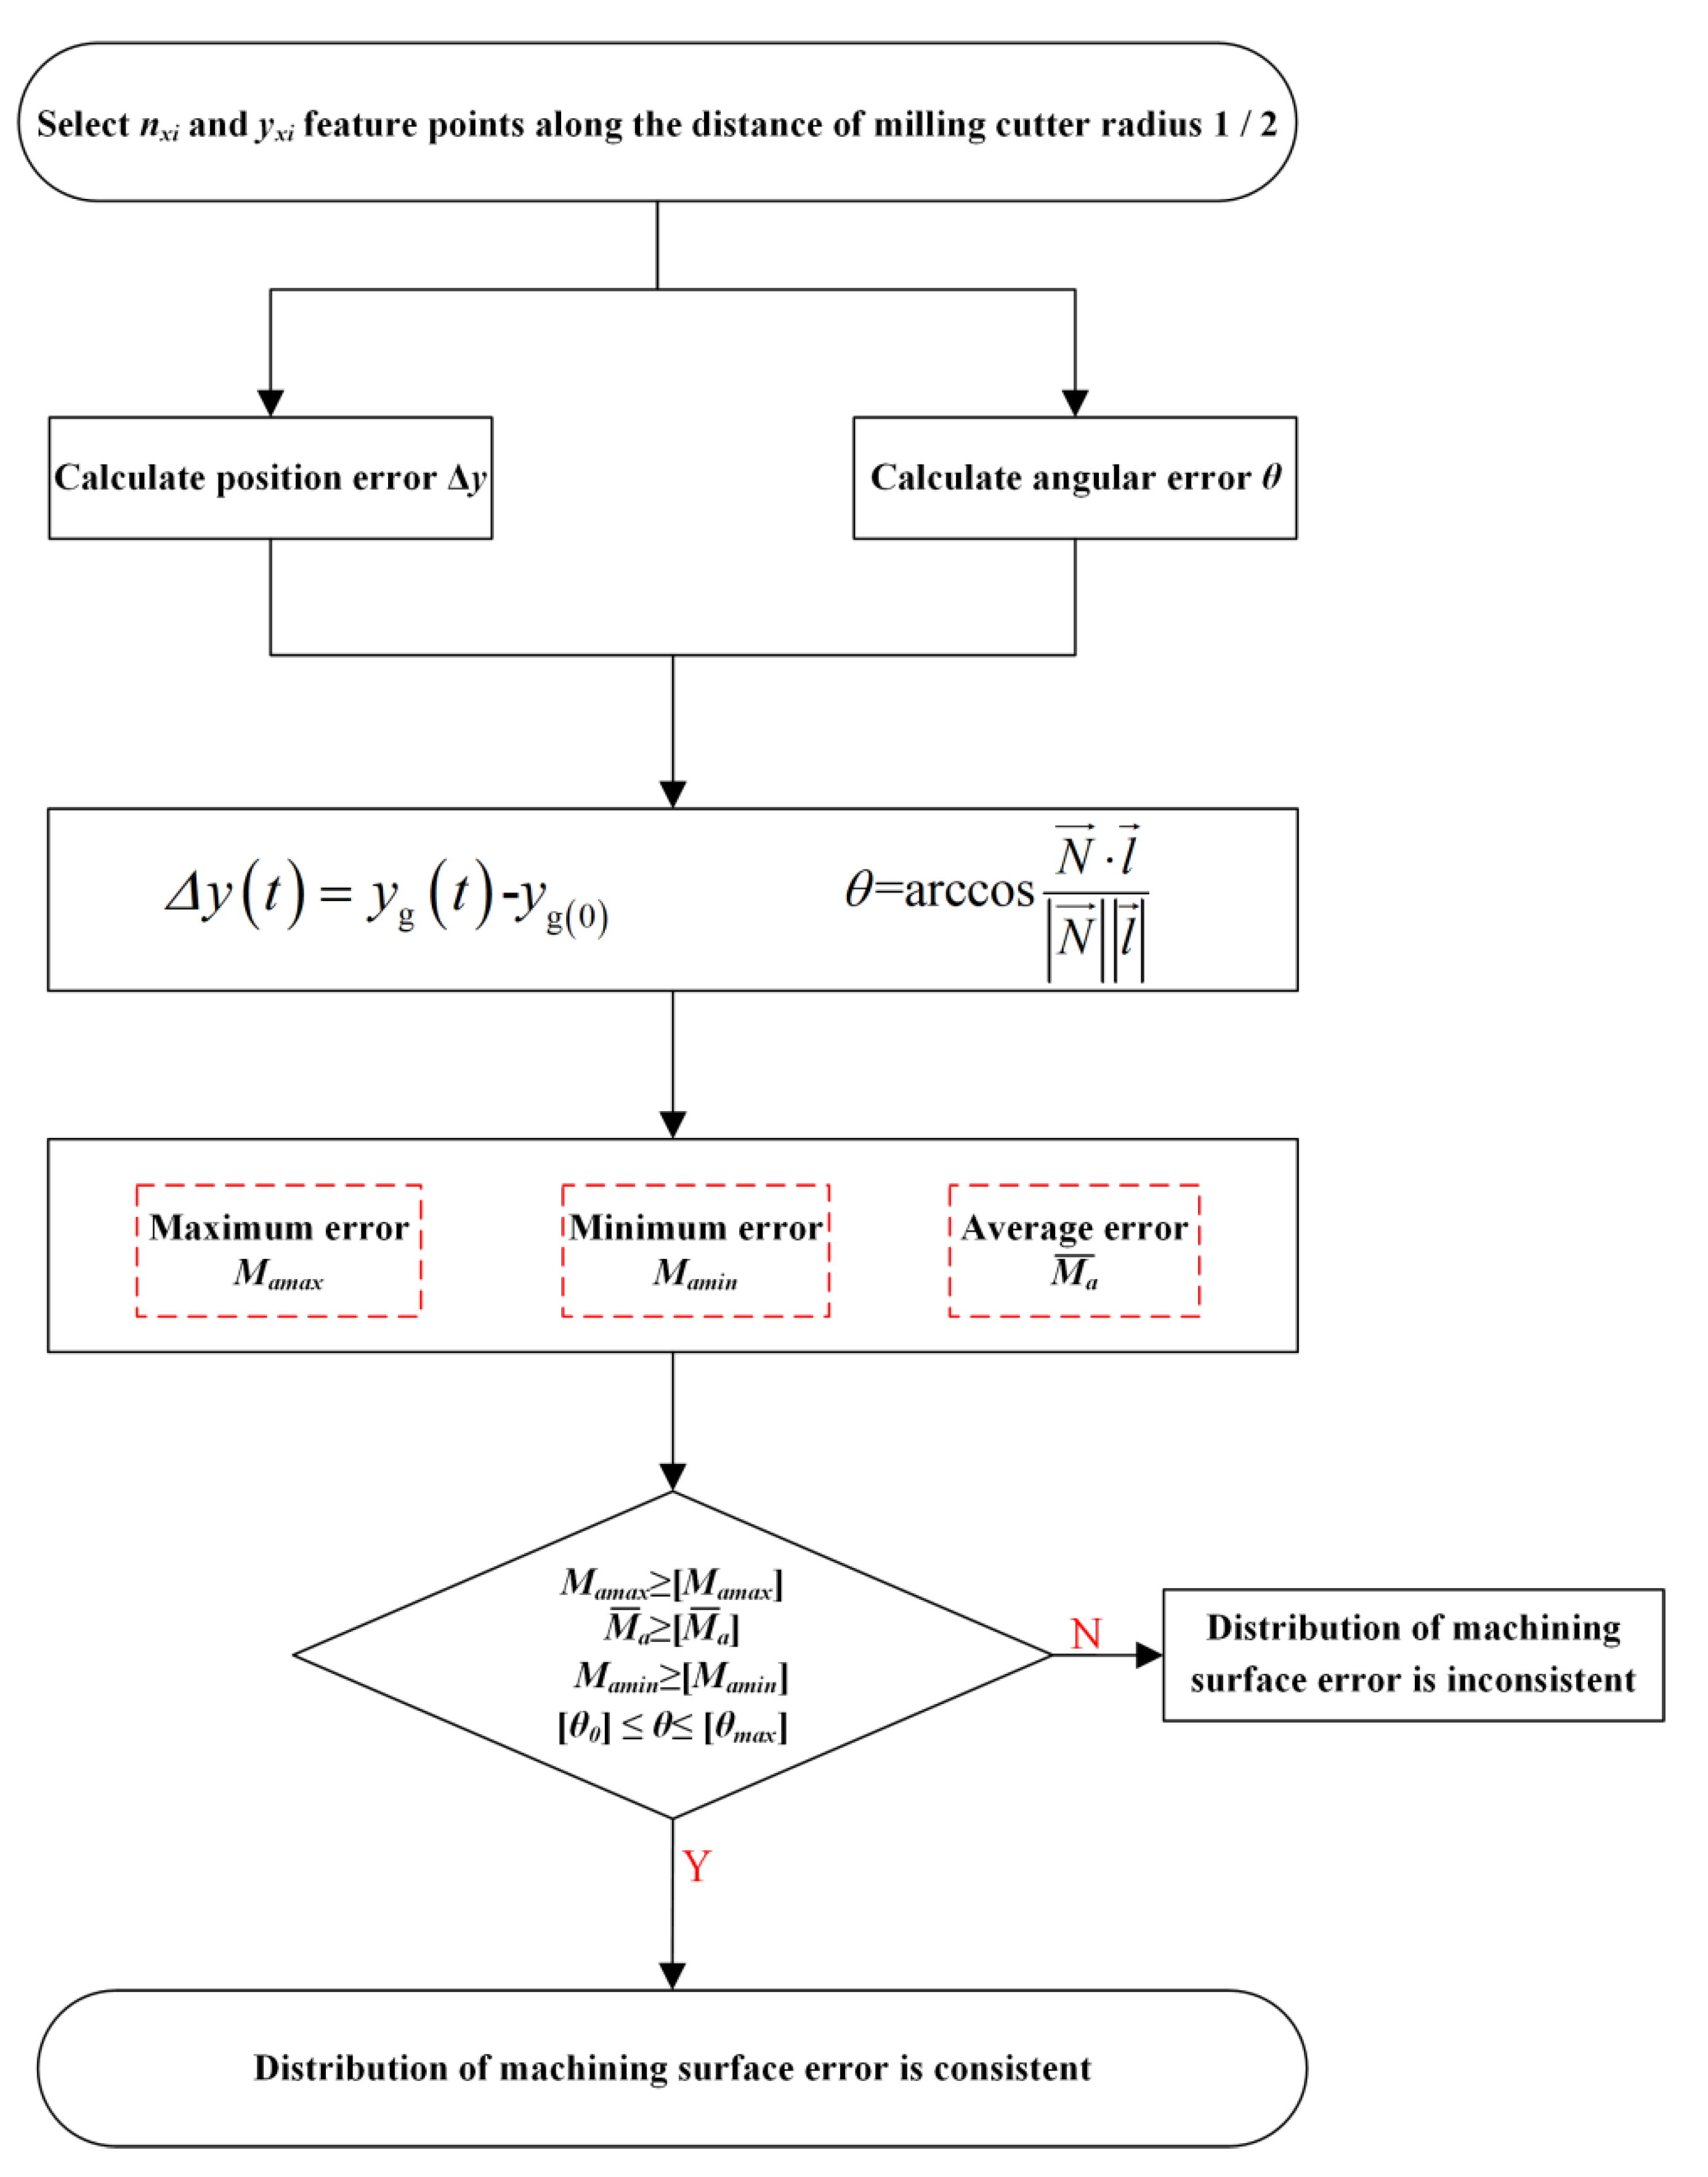
2.3. Consistency Evaluation Model of the Machined Surface Error Distribution

According to the abovementioned machined surface error solution process, it can be seen that the machined surface error is affected by factors such as milling vibration, cutter tooth error, and machined parameters, making the variation of the machined surface error uncertain. To accurately evaluate the state of the machined surface error distribution and its distribution consistency, we first constructed an analysis model of the consistency of the machined surface error distribution, as shown in Figure 5.
As shown in Figure 5, the error distribution curves of the machined surface at these points corresponding to the xgL-axis direction and zgL-axis direction are calculated separately using the error solution model, analysis of the average value M a ¯ of the positional and angular errors of the feature point in different directions, the maximum value Mamax of the positional and angular errors of the feature point on the machined surface, and the minimum value Mamin of the positional and angular errors of the feature point on its flat machined surface, indicates the minimum levels of positional and angular errors that can be allowed for the feature point.
Combining the above models, the judging index is given as shown in Equation (16):
M a max M a max M a ¯ M a ¯ M a min M a min θ 0 θ θ max
where Mamax is the actual machined surface error maximum; [Mamax] is the design reference surface error maximum; M a ¯ is the average value of the actual machined surface error; M a ¯ is the average value of the design reference surface error; Mamin is the minimum value of actual machined surface error; and [Mamin] is the minimum value of the design reference surface error.
The evaluation model for the consistency of the error distribution on the machined surface is shown in Figure 6, based on the evaluation indices derived from the above model for judging the consistency of the machined surface.

3. Influencing Factors and Interaction Identification of the Machined Surface Error

3.1. Screening of Influence Factors of the Machined Surface Error

In the process of high-efficiency milling, the machined parameters, milling vibration, and tooth error distribution characteristics have a non-negligible influence on the consistency of the surface error and its distribution; therefore, after proposing a model for judging the consistency of machined surface error distribution under the action of milling vibration, the influencing factors of machined surface error are first identified, and then the degree of obviousness of the influencing factors and the strength of their interaction are analyzed.
The set of variables that influences the machined surface error is constructed as shown in Equation (17):
S = n , f z , a p , a e , M , a
where M is the milling cutter tooth error, and a is the milling vibration acceleration.
To investigate the degree of obviousness of each influencing factor on the positional and angular errors of the machined surface, in Equation (17), the design variables depth of cut and width of cut are mainly involved in the error calculation in the form of affecting vibration, while the rotational speed of the milling cutter and the feed rate per tooth have a direct effect on vibration, as well as on the vibration period and the period of action of the cutter tooth error. Therefore, the design of the analysis of the variance scheme was finally determined, with the rotational speed of the milling cutter, feed rate per tooth, cutter tooth error, and milling vibration as the design variables for machined surface errors.
The design ranges of each design variable are shown in Table 2, and the design variables of the milling cutter tooth error distribution are shown in Table 3.
Combination of Equations (1)–(8) of the processing surface morphology solution model, compiled using MATLAB, for simulation of the processed surface morphology under the design conditions in Table 2 and Table 3, can obtain the processing surface morphology of milling under each group of design conditions. According to Figure 4 and Equations (14) and (15), the angular and positional errors of the milled surface under the conditions of each group of design schemes can be solved, and the analysis of variance of the design variables of the distribution characteristics of the machined surface error can be performed to obtain the processing surface morphology, as shown in Figure 7. The results of the analysis of variance are shown in Table 4.
The variance values in Table 4 are the variances of each design variable corresponding to the degree of single-factor simulation error correlations, whose values can initially indicate the degree of their influence on milling vibration—the larger the variance, the greater the degree of influence. An F-value greater than F crit indicates an obvious effect; the p-value is the confidence probability of the corresponding F-value—usually, less than 0.05 is an obvious effect, and less than 0.001 is a highly obvious effect. As can be seen from the table, the F-values for both the positional error and the angular error are greater than their own F-values, and the confidence probabilities for both the angular error and the positional error are greater than 0.05, which is a significant effect.
As shown in Table 4, according to the analysis of variance values, the degree of influence of design variables on the machined surface positional errors is as follows: cutter tooth error > feed rate per tooth > milling vibration = rotational speed of the milling cutter. The degree of influence of design variables on the angular errors between the tangent plane and the reference planes is as follows: cutter tooth error > rotational speed of the milling cutter > milling vibration > feed rate per tooth.

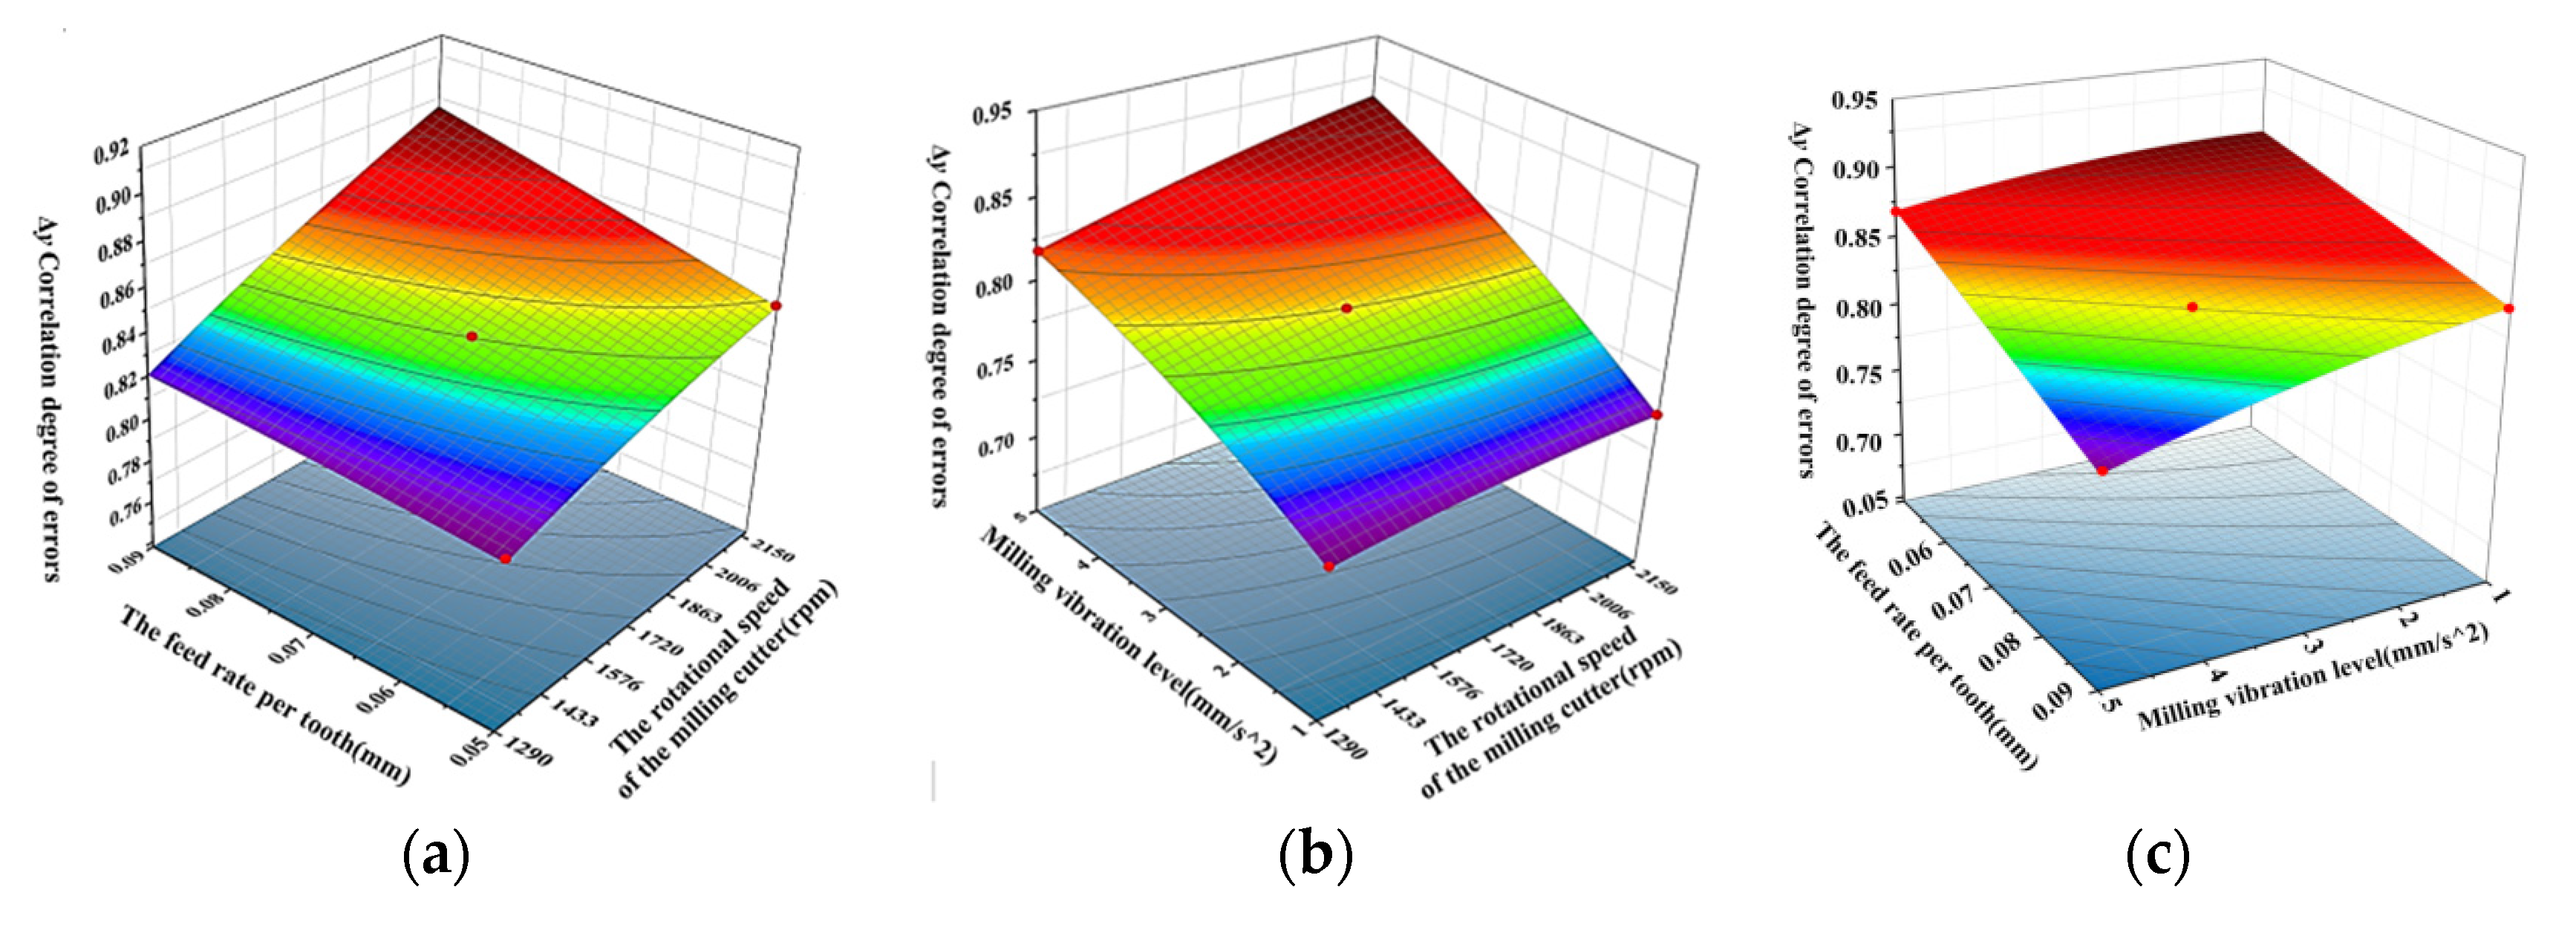
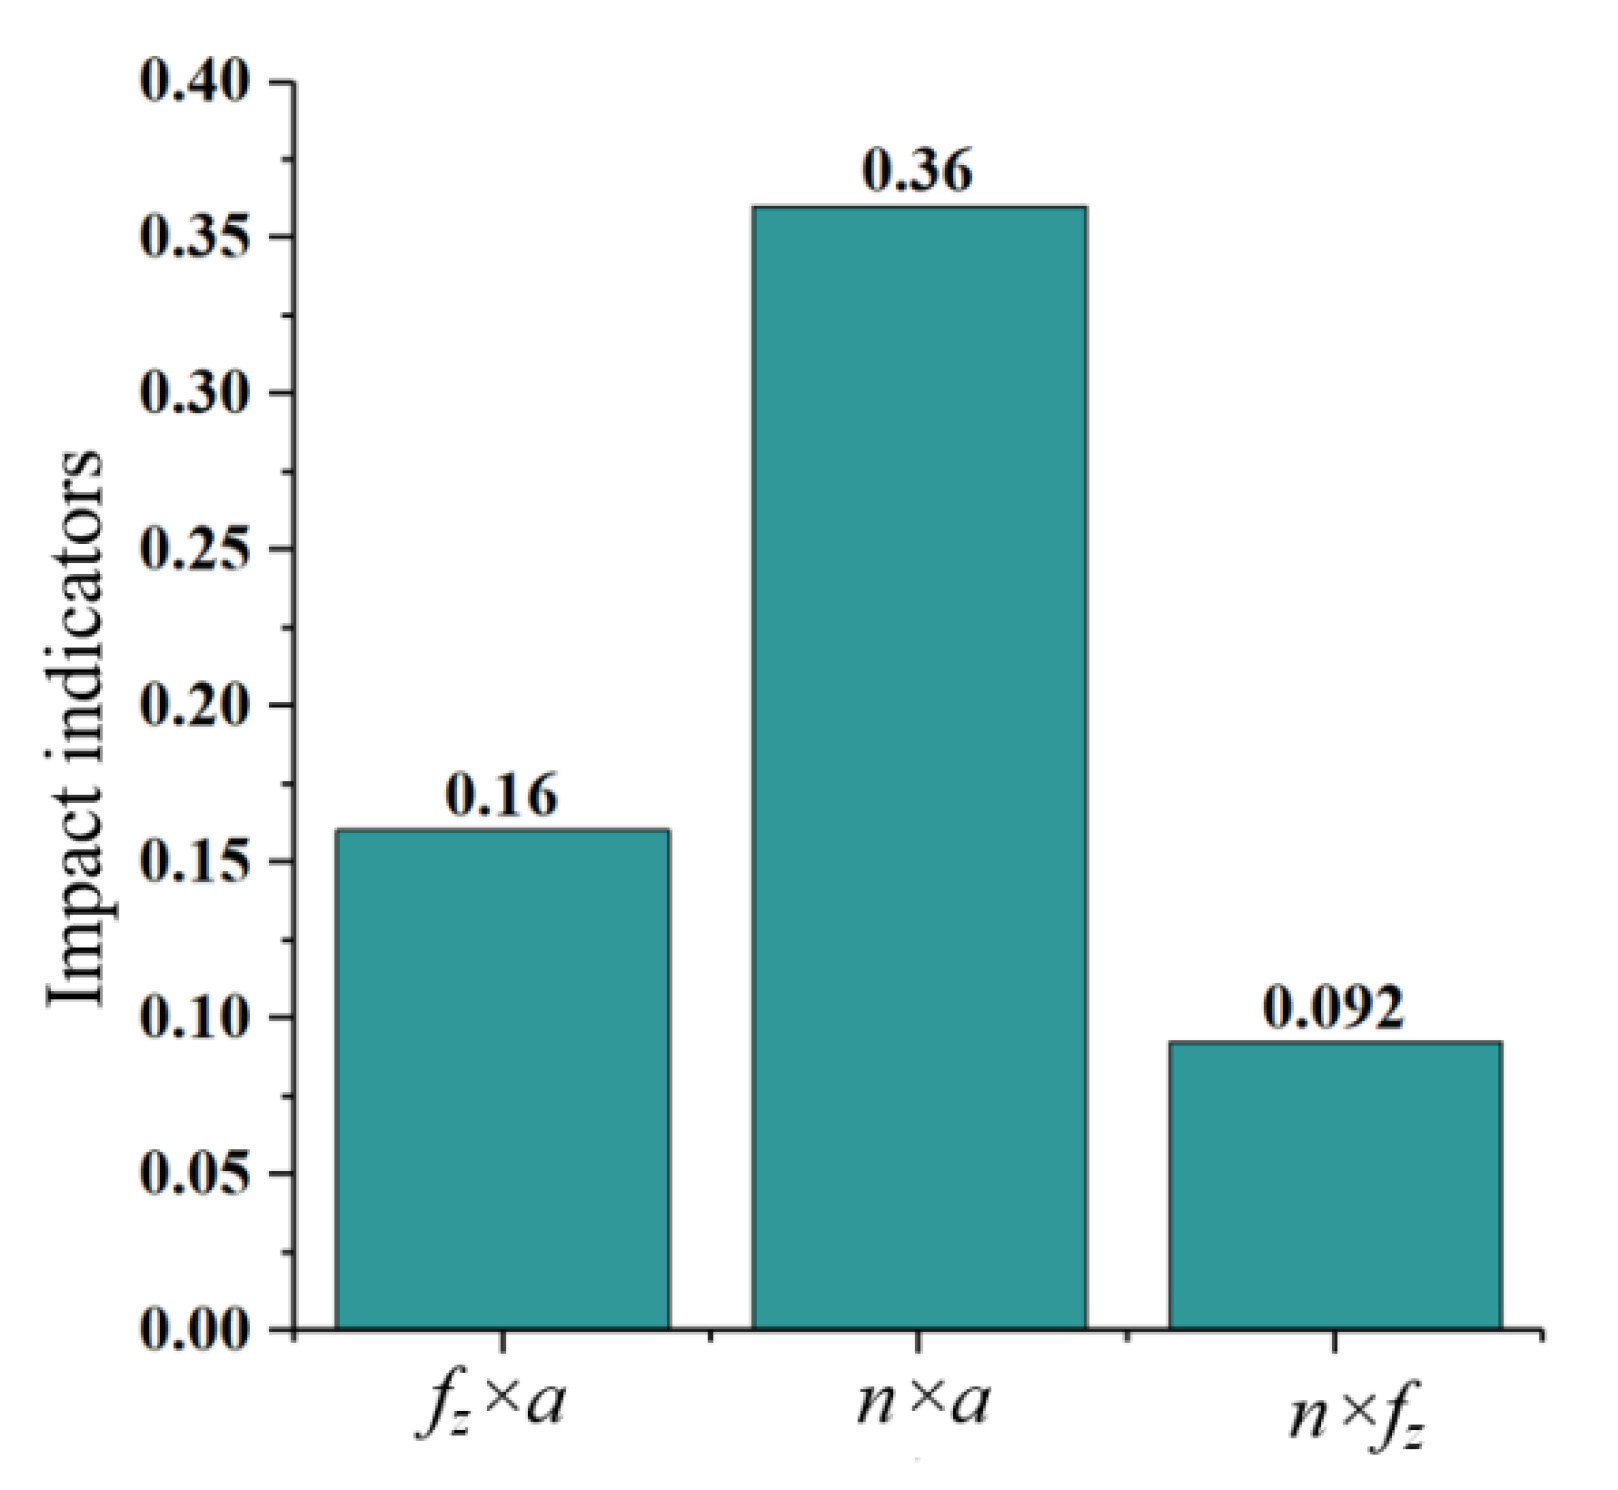
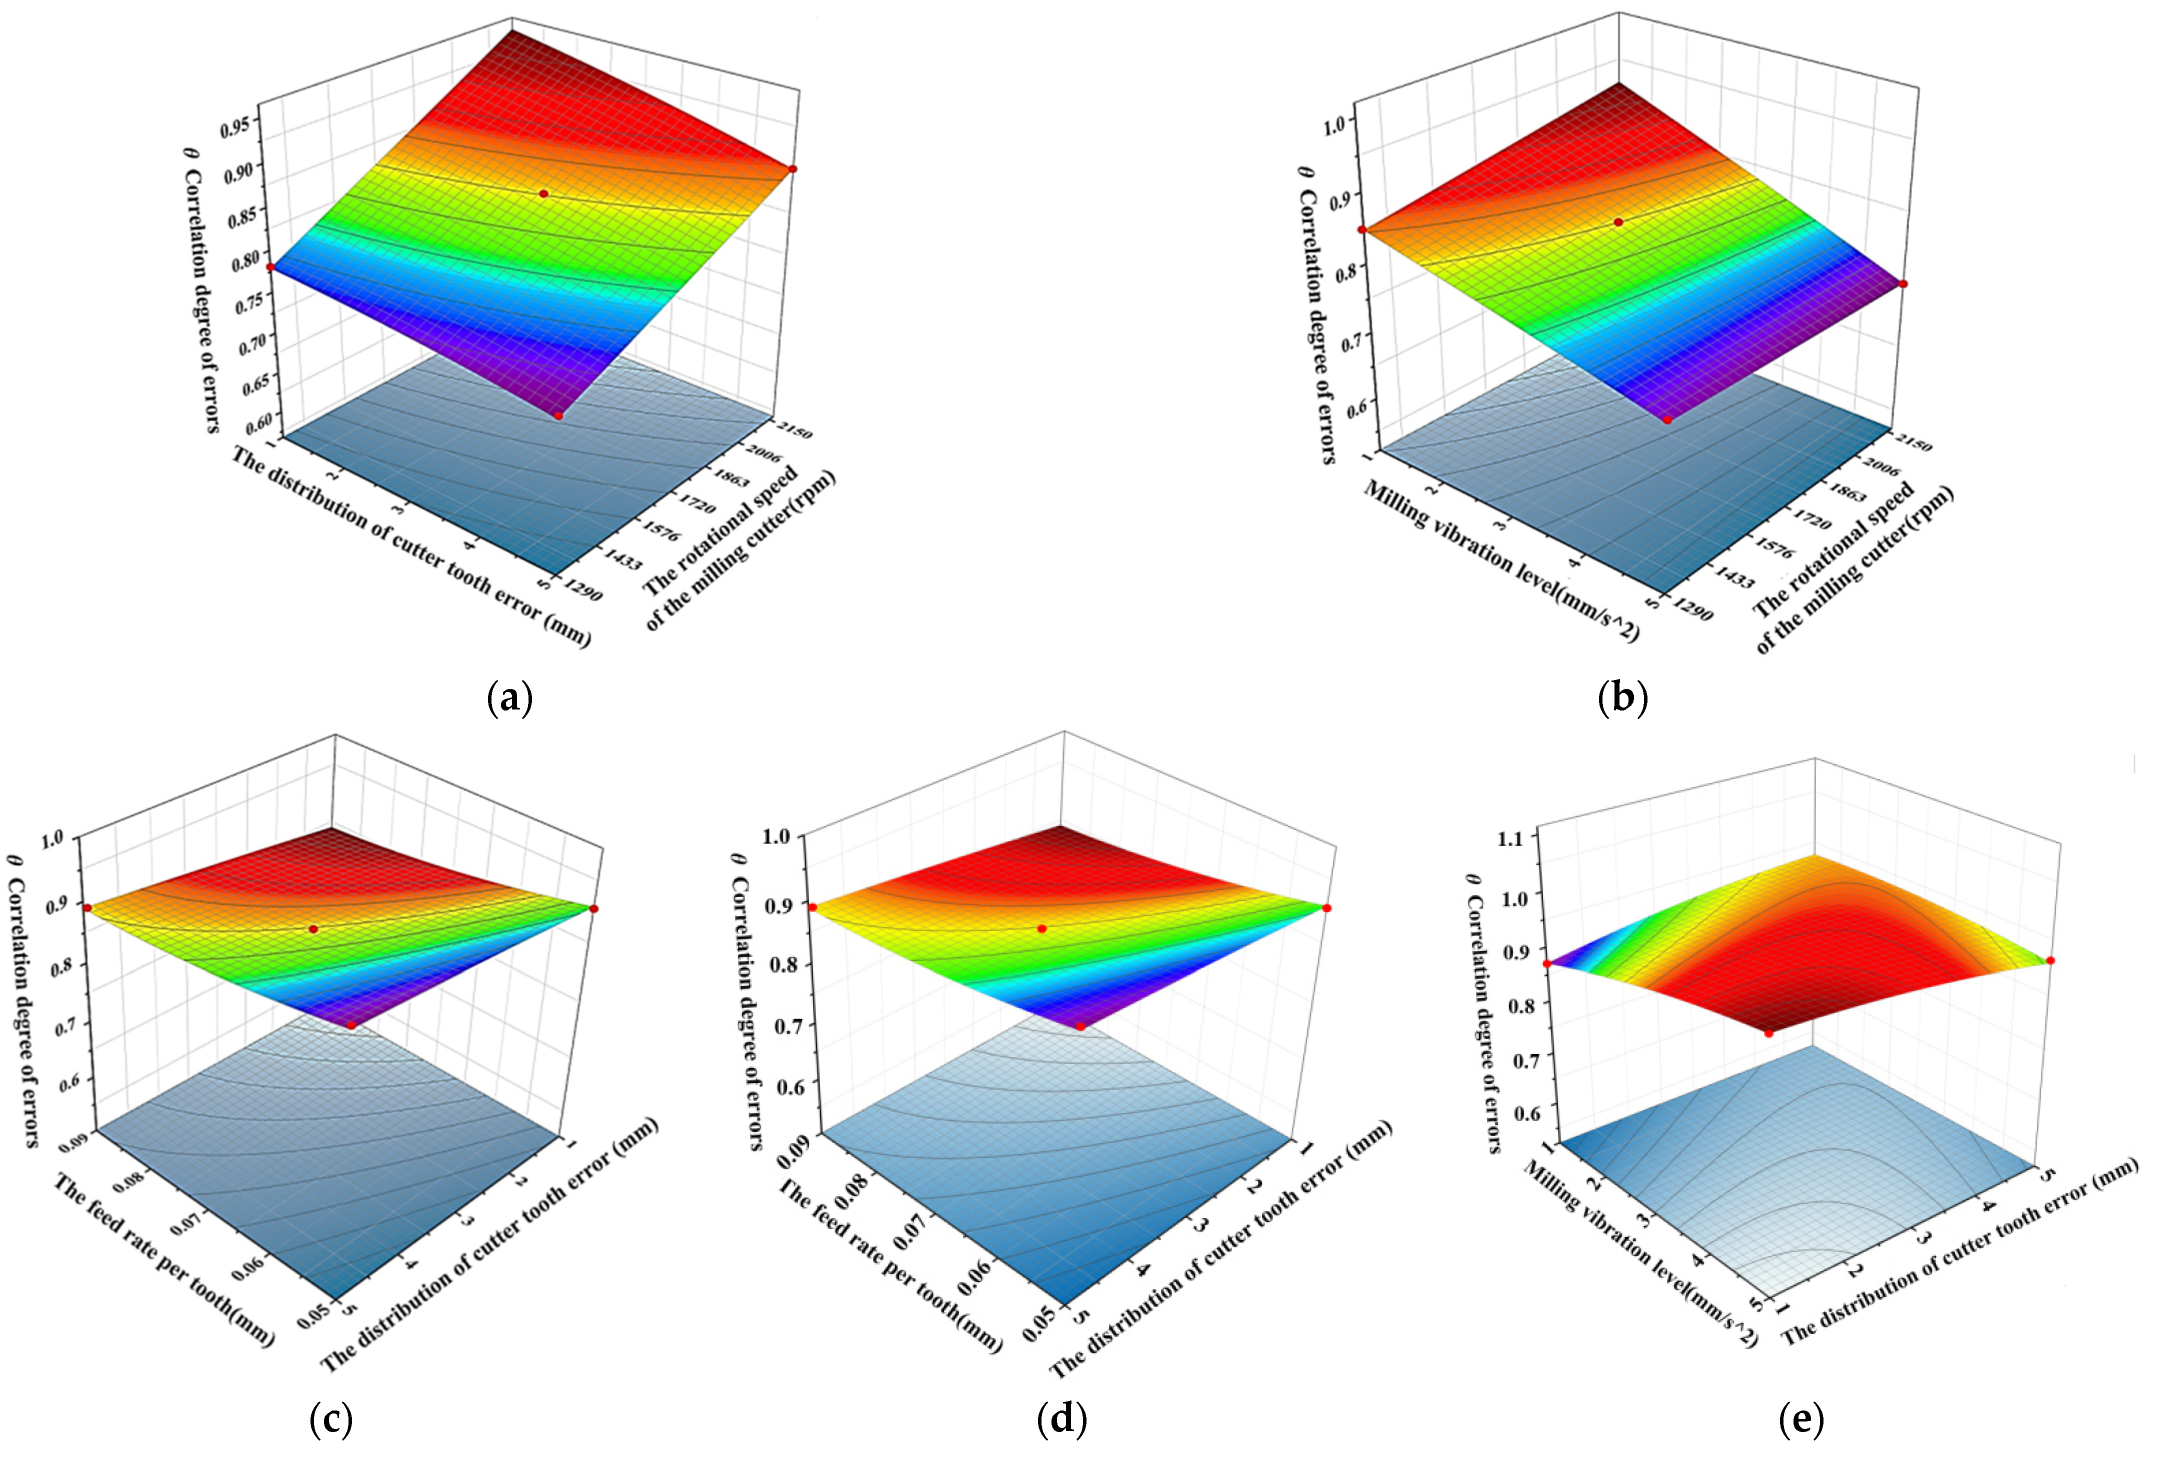
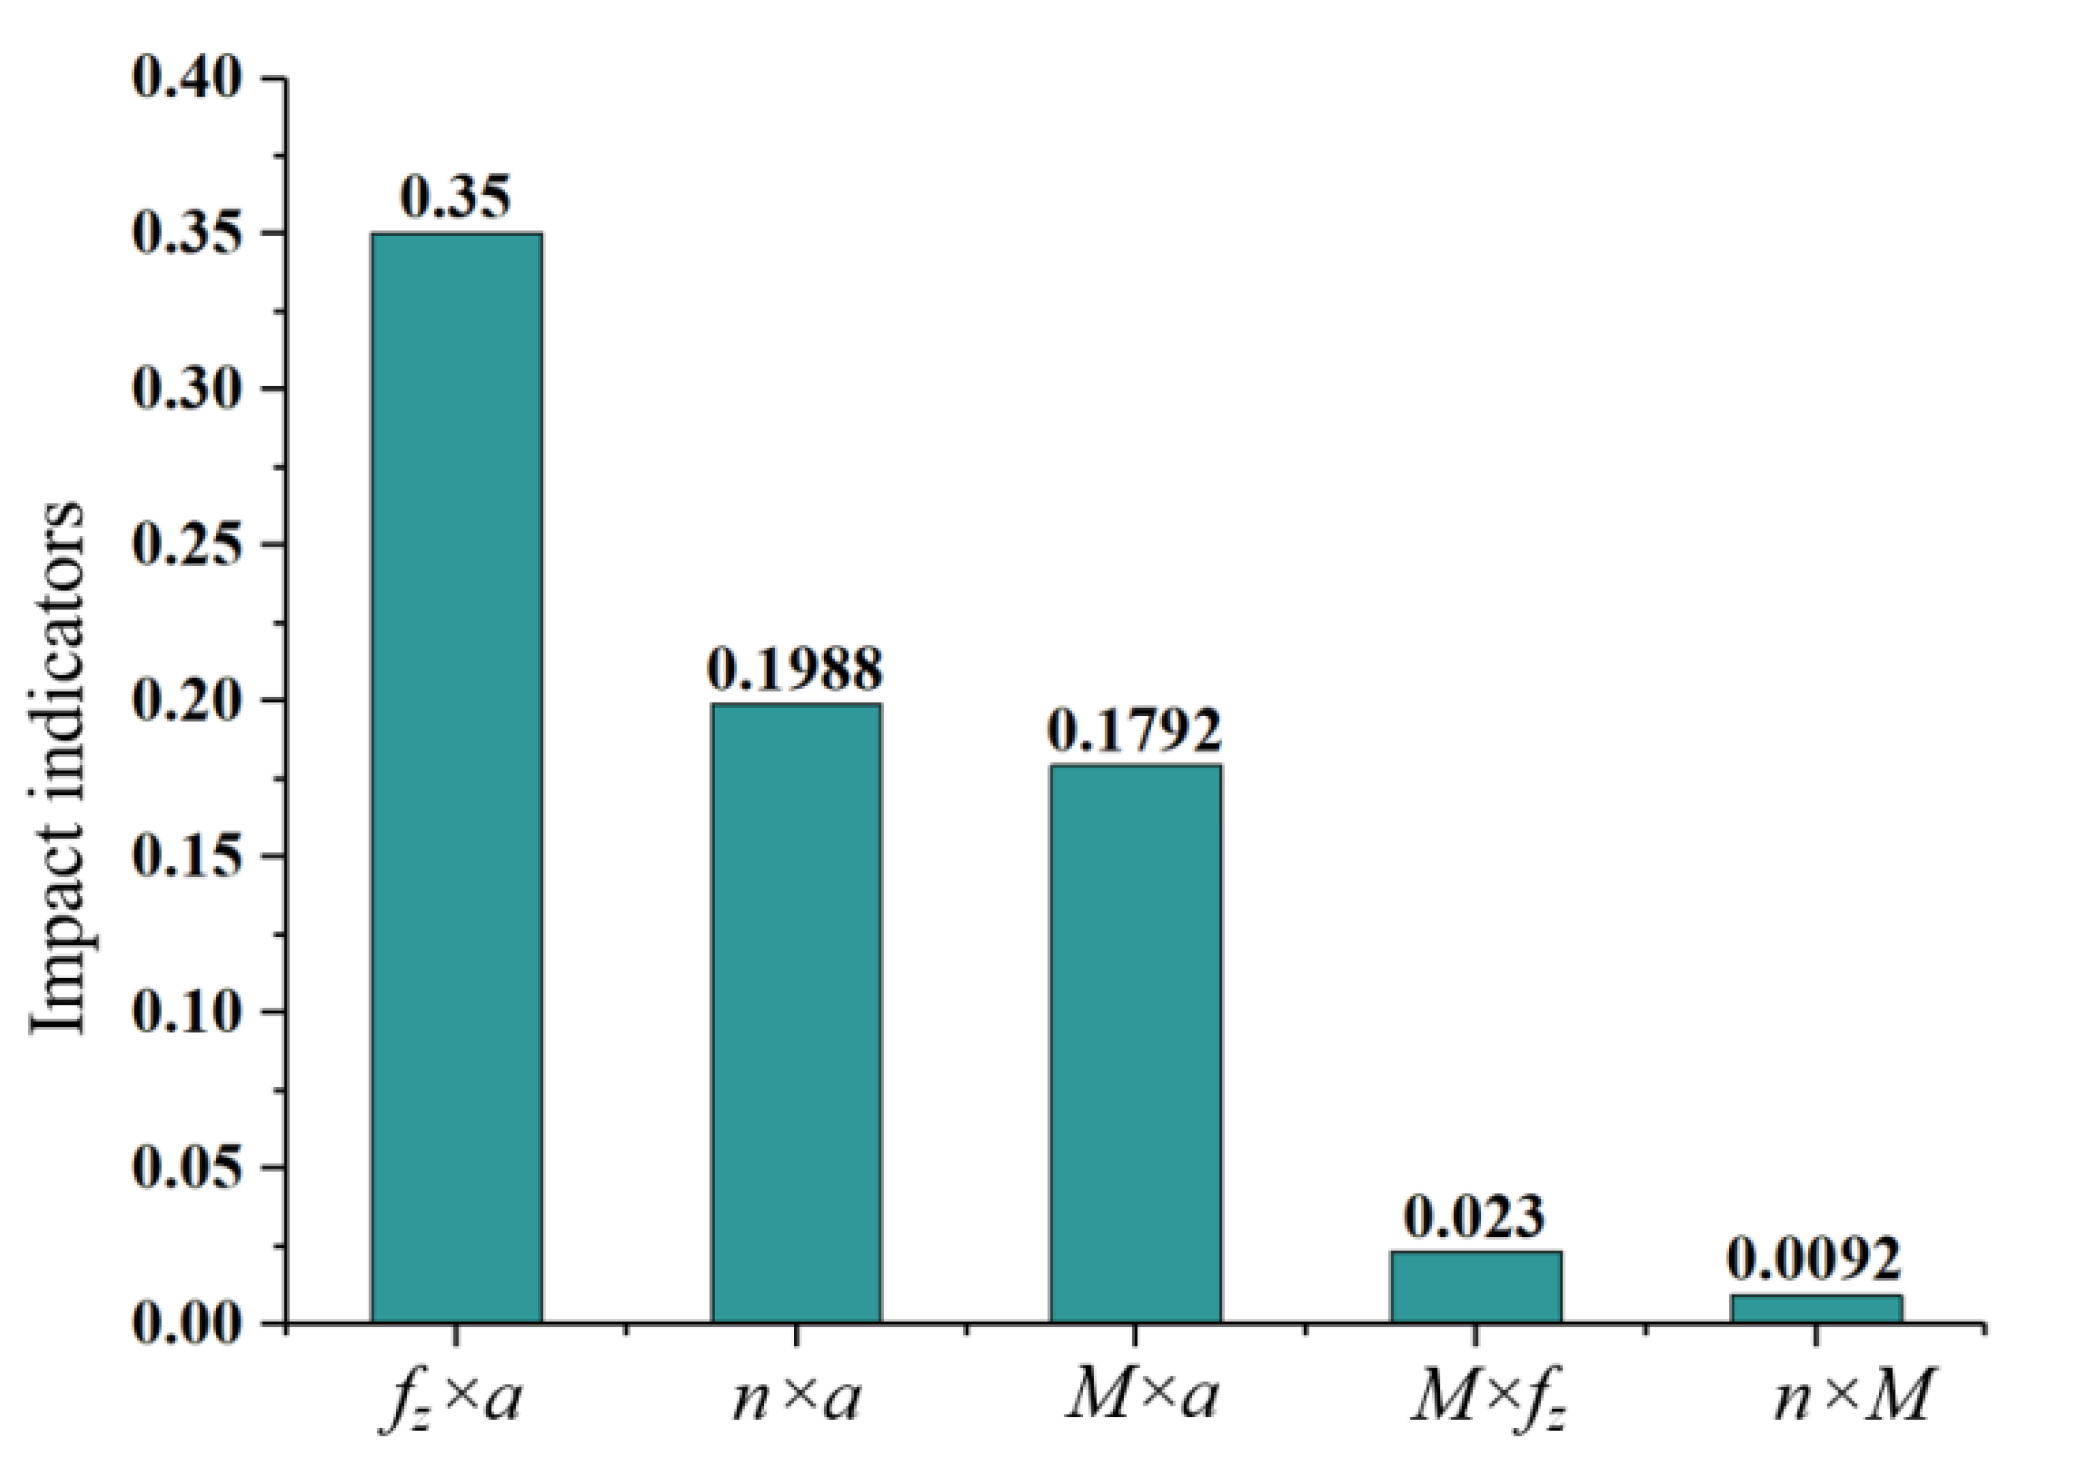
3.2. Interaction of Influencing Factors of the Machined Surface Error

The above analysis of variance results were calculated based on single-factor simulation results. The interaction between the design variables and the influence of the interaction on the positional and angular errors of the machined surface is yet to be revealed; therefore, the simulation scheme of error variation characteristics based on the analysis of variance results combined with the machined surface error solution is shown in Table 5.
In the experimental design of the response surface methodology, response surface models are usually constructed based on second-order polynomials. Therefore, to resolve the response characteristics of the machined surface error to the design variables of the milling process, its second-order expression is constructed as shown in Equation (18):
y = y 0 + i = 1 n p i x i + i = 1 n j = i n p i j x i x j + Q
where y0 is the initial to-be-determined value, pi is the influence coefficient of xi, pij is the coefficient of the interaction effect of xi and xj, and Q is the effect of fitting errors and noise, which obeys normal distribution in this model.
Simulation of each experiment according to the model of solving the formation process of machined surface errors, using the error correlation of the machined surface positional errors and the machined surface angular errors with the design reference planes as the response result of the experiment, according to Equation (18), and using Design-Expert 13.0Trial response surface model analysis software, along with response surface model construction for the simulation solution results of machined surface positional errors and machined surface shape errors, the mathematical model of the response surface methodology can be determined as shown in Equations (19) and (20):
γ Δ y = 0.84 - 0.077 n + 0.002449 f z 0.001873 M + 0.004268 a 0.012 n f z + 0.00579 n M 0.013 n a + 0.00206 f z M + 0.013 f z a + 0.00069 M a + 0.00495 n 2 + 0.00099 f z 2 0.00019 M 2 0.01 a 2
γ θ = 0.79 - 0.081 n + 0.00027 f z 0.00039 M + 0.0022 a 0.012 n f z 0.0501 n M 0.05045 n a + 0.00057 f z M + 0.052 f z a 0.013 M a + 0.00837 n 2 + 0.031 f z 2 0.00467 M 2 0.001596 a 2
To determine the degree of influence of each design variable on the various characteristics of the machined surface errors, impact significance can be analyzed by response surface modeling of machining error distribution characteristics, and the impact significance level of each design variable can be determined. The probability levels (P) of the obvious terms of the influence of the various characteristics of the machined surface positional and angular errors are shown in Figure 8.
As shown in Figure 8, where “×” indicates the interaction between the two, among the design variables of machined surface errors’ variation characteristics, probability levels in the range of 0~0.01 are highly influential; probability levels between 0.01 and 0.05 were considered obvious effects, while probability levels greater than 0.05 indicated weak or non-existent interaction with respect to the various characteristics of the machined surface position errors. As shown in the figure, the probability level of spindle speed is between 0 and 0.01, which is less than 0.05, indicating the most significant effect on the machined surface positional error, while the probability level of feed per tooth is between 0.04 and 0.05, with the least effect compared to other factors. The probability level of feed per tooth is between 0 and 0.01, indicating the greatest effect on the machined surface angular error. The probability level of the interaction between spindle speed and tooth error ranged from 0.04 to 0.05, indicating the least influence.
According to the results of the significance analysis of the machined surface errors, it can be seen that the interactions of the rotational speed of the milling cutter and cutter tooth error, cutter tooth error and milling vibration, and the feed rate per tooth and milling vibration have obvious effects on the various characteristics of the machined surface positional errors; therefore, these three sets of interaction variables were analyzed separately, and the response surface is shown in Figure 9 according to the response surface methodology [20].
The gentler the surface, the smaller the interaction effect of the two factors on the machined surface positional errors, the more pronounced the curvature of the response surface plot, and the greater the interaction effect of the two factors on the machined surface positional errors. From Figure 9, it can be seen that the combination of the interaction effects of the rotational speed of the milling cutter and the feed rate per tooth with the second group of milling vibration and the rotational speed of the milling cutter has a greater effect on the correlation degree of the surface positional errors of the feature point machining, while the combination of the feed rate per tooth and milling vibration interaction has a small degree of influence.
To analyze the specific extent of the interaction of the influencing factors, the average curvature of the surface reflects the average degree of curvature of the surface in the region. Using this as a research idea, the height of the slope of the analogous curve within a specified interval reflects the specific bending degree of the surface; using this as an analogy for the interaction-specific quantitative values, the impact indicator C can be derived by bringing Equations (19) and (20) into Equation (21); the solution process is as follows:
C = tr adj H 1 det Hess   F 2 F 3 Δ x
H 1 = Hess F F F T 0
F x , y , z , 1 = x y z 1 a 11 a 12 a 13 a 14 a 21 a 22 a 23 a 24 a 31 a 32 a 33 a 34 a 41 a 42 a 43 a 44 x y z 1
Hess F = 2 a 11 2 a 12 2 a 13 2 a 21 2 a 22 2 a 23 2 a 31 2 a 32 2 a 33
F 3 = 8 F 1 2 + F 2 2 + F 3 2 3
where HessF denotes the Hessian matrix with F(x,y,z) = 0—that is, the Hessian matrix of Equations (19) and (20)— F denotes the gradient vector, adjH1 represents the accompanying matrix of matrix H1, tr() represents the trace of the matrix, and det(HessF) represents the determinant of the matrix’s solution.
Equations (19) and (20) can be brought into Equation (21) and solved using MATLAB; taking the rotational speed of the milling cutter range 1290~2150 rpm as an example, by 100 equal points, the region with the highest curvature—i.e., the highest degree of bending—was selected as the characterization object, and the results are shown in Figure 10.
The maximum index of interaction between the rotational speed of the milling cutter and the milling vibration on the surface positional error of milling machining is 0.36. The maximum index of interaction between the feed rate per tooth and milling vibration on the machined surface positional error is 0.16. The maximum index of the interaction between the rotational speed of the milling cutter and the feed rate per tooth on the machined surface positional error is 0.092. The reason for these results is that the more dramatic the effect of tool vibration on the peaks, valleys, and surface slope of the machined surface topography in the high-speed cutting process, the greater the effects on the formation of the machined surface which, in turn, affects the machined surface positional error, while for other influencing factors on the machined surface positional error the influence is small.
Among the factors that influence the angular error distribution characteristics of the machined surface, the interactions between the rotational speed of the milling cutter and cutter tooth error and milling vibration, between the feed rate per tooth and cutter tooth error and milling vibration, and between milling vibration and cutter tooth error, have an obvious effects on the distribution characteristics of the error in the angle between the tangent plane and the reference planes; we constructed its response surface as shown in Figure 11.
From Figure 11, it can be seen that the angular error distribution characteristics of the machined surface are jointly influenced by five types of interactions of the four design variables. The response surface bending is more evident in the fourth set of combinations of the feed rate per tooth and milling vibration interaction effects, showing that the interaction of the feed rate per tooth and milling vibration has an obvious effect on the correlation of angular error on the machined surface of the feature point. The degree of interaction indicators was plotted using Equation (21), combined with MATLAB calculation results, as shown in Figure 12.
As shown in Figure 12, the index of interaction between feed per tooth and milling vibration is 0.35, the index of spindle speed and milling vibration is 0.1988, the index of tool tooth error and milling vibration is 0.1792, the index of tool tooth error and feed per tooth is 0.023, and the index of spindle speed and tool tooth error is 0.0092. These results show that the feed rate per tooth affects the milling thickness; in high-efficiency milling, the combined effect of the angle between the teeth of the milling cutter and the milling vibration also causes changes in the machined surface, so that the angular error of the machined surface changes and becomes the maximum interaction effect. Meanwhile, the interaction of the rotational speed of the milling cutter and the milling vibration with the machined surface positional error is different, affecting the milling process due to the offset of the milling tool attitude, resulting in the deflection of the normal vector at the feature points concerning the case without vibration, which affects the angular error of the machined surface. The other influencing factors have a smaller degree of interaction with the angular error.

4. The Machined Surface Error Distribution Consistency Process Design Model

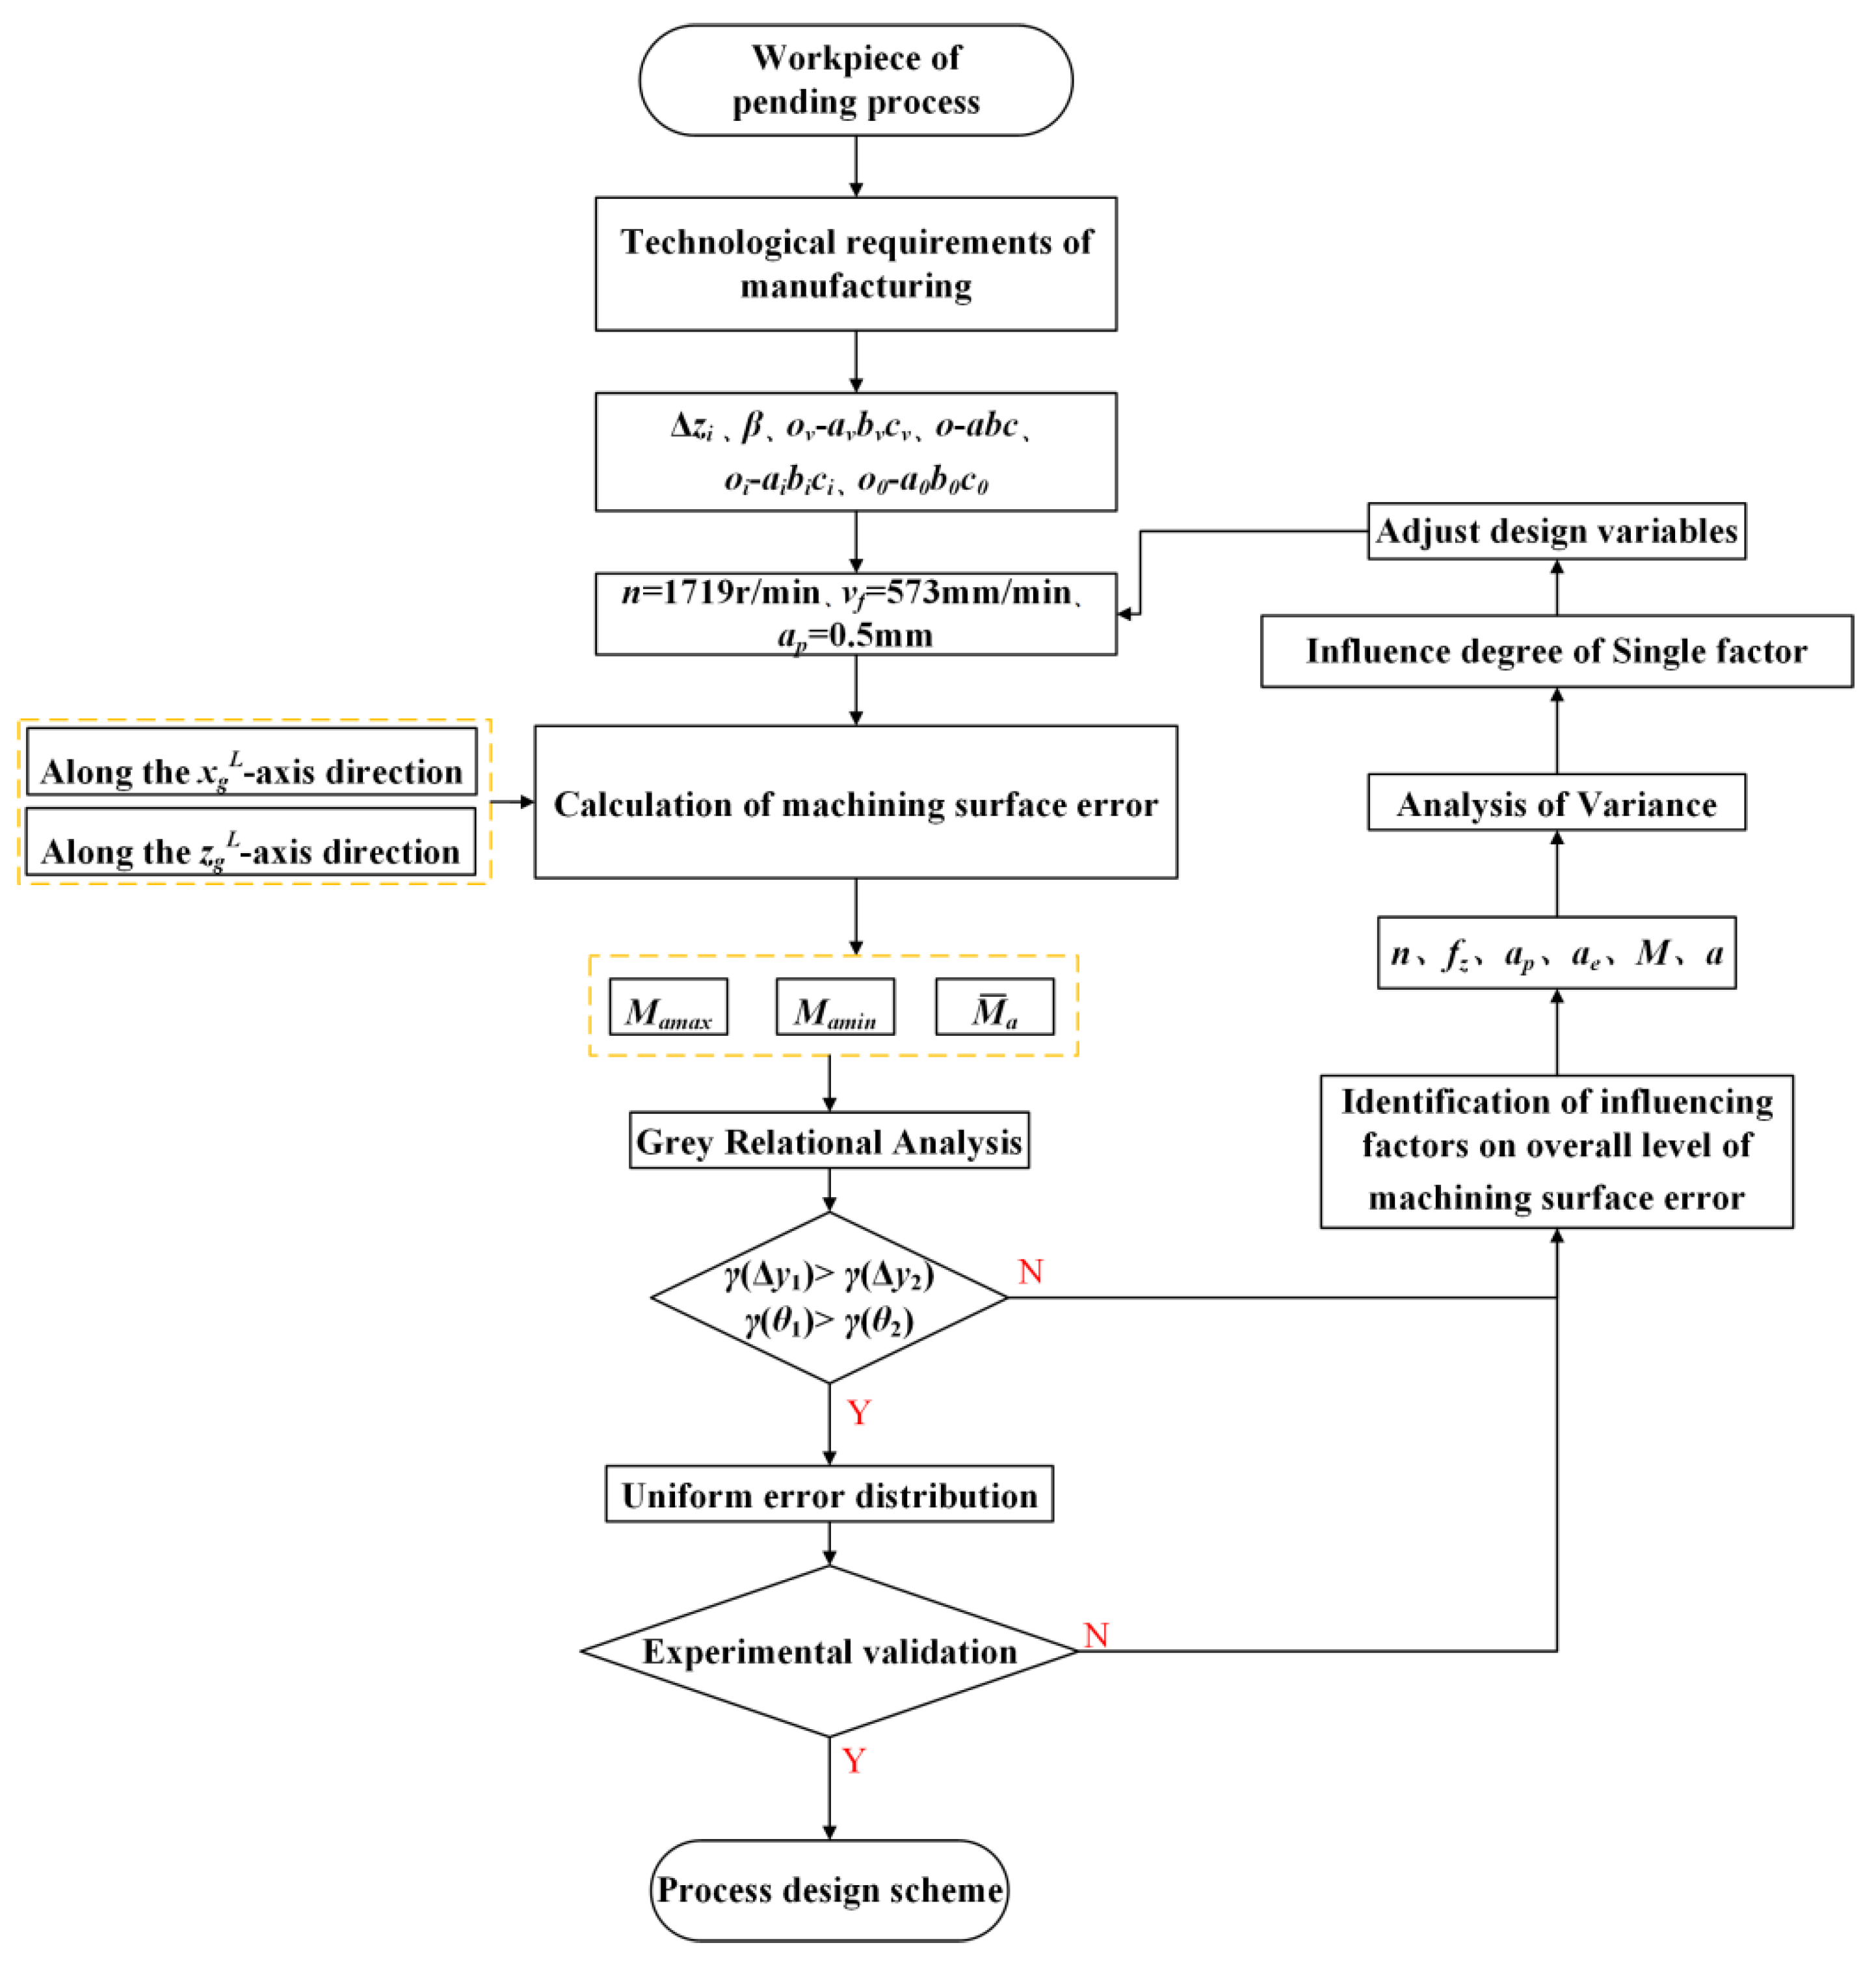
4.1. Process Planning Model

According to the surface error solution and distribution consistency evaluation model, as well as the analysis results of the machined surface error’s influencing factors, a process design model for consistency of machined surface error distribution is proposed, as shown in Figure 13.
Figure 13 shows the surface error calculation on the basis of existing process solutions, along with evaluation of the overall level and consistency of machining error distribution, and the consistency of error distribution of the already-existing process is low; therefore, the response surface methodology is needed to analyze the response characteristics of the consistency of processing error distribution for each design variable, calculate the significance of the effects of each design variable, and functionally plan the design variables and reset the process scheme accordingly. The new process solution is then simulated to verify the overall level of machining error distribution and the level of consistency, experimental verification is carried out after the verification, and the process scheme and its error distribution level and consistency level can be obtained after verification that the consistency of error distribution on the machined surface is high and the overall level of error distribution on the machined surface meets the processing technology requirements.

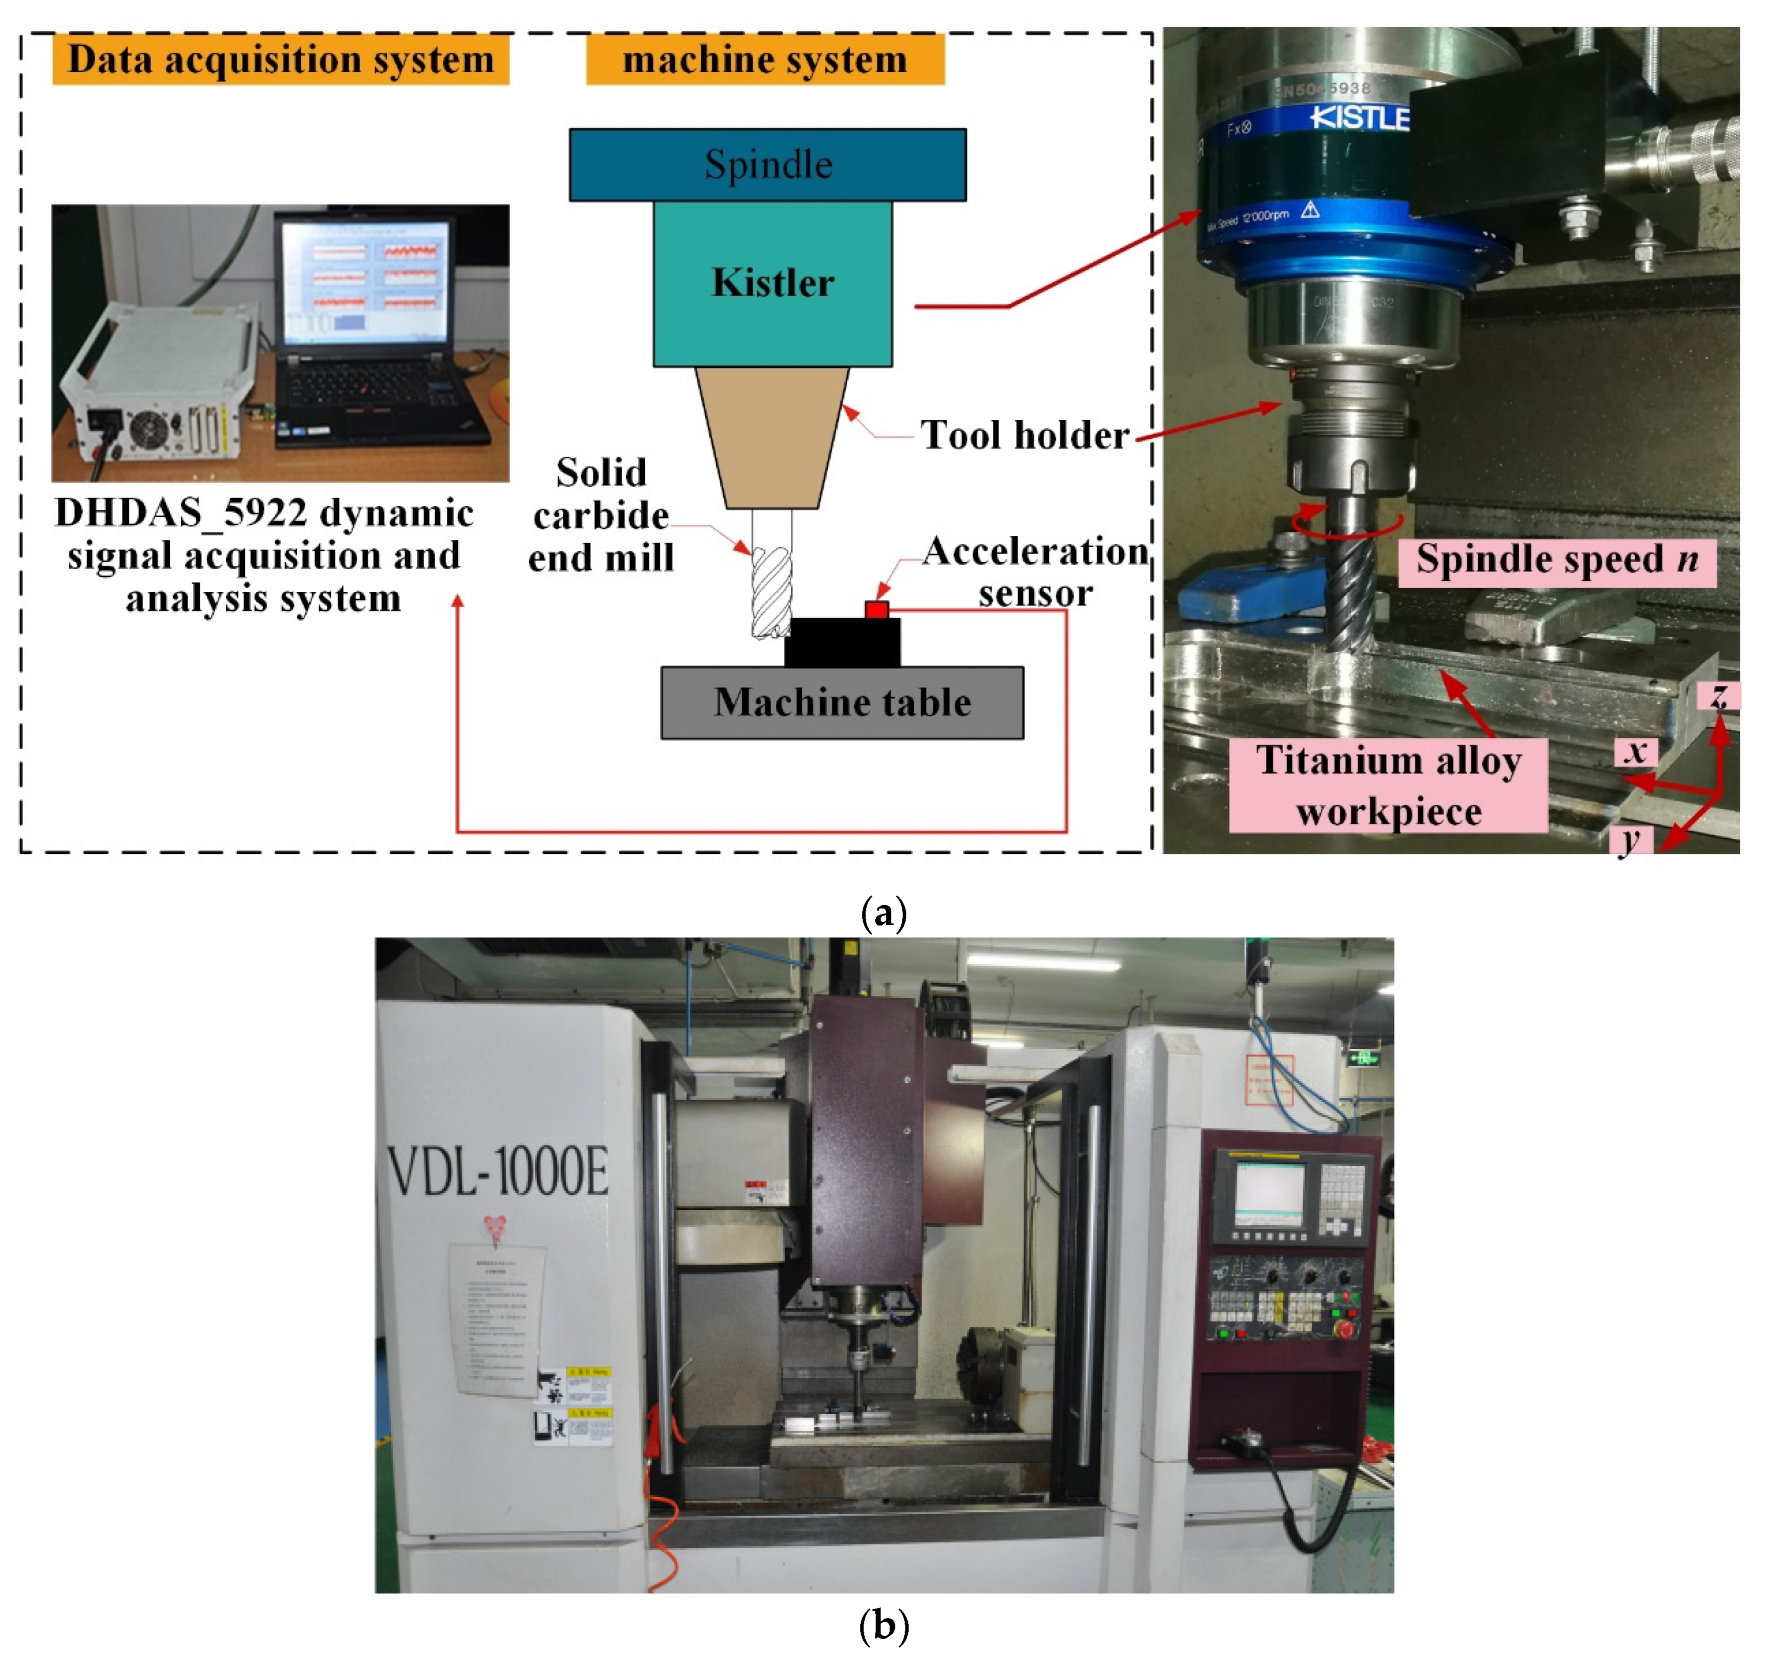
4.2. Experimental Verification

To verify the validity of the process design model proposed in this paper for consistency of surface error distribution in milling, milling experiments were conducted. The milling cutter used in the experiment was a five-tooth solid carbide end mill (MC122-20.0A5B-WJ30TF) made by WALTER (diameter 20 mm, tool length 104 mm, helix angle 50°); the machine used in the experiment was a three-axis milling processing center (work table 1050 mm, width 560 mm). The milling model was down milling and dry milling, and the workpiece used in the experiment was titanium alloy; the components are shown in Table 6, and the experimental setup is shown in Figure 14.
The parameters used for the experiments were as follows: the depth of the cut (ap) was 10 mm, the width of the cut (ae) was 0.5 mm, and the remaining original process parameters and the new process parameters are shown in Table 7.
According to the process parameter scheme in Table 7, firstly, we simulated the processing surface morphology of machining, and the simulation results were solved by using the proposed model of selecting the surface feature points of milling machining and the model of characterizing error points of milling machined errors. Meanwhile, an inspection of machined surface errors was obtained experimentally under the conditions of different process parameter schemes using the three-coordinate measuring machine. The results of solving and experimentally testing the machined error distribution under the conditions of the new and old process schemes are shown in Figure 15 and Figure 16.
As shown in Figure 15 and Figure 16, under the new and old process scheme conditions, the machining errors vary with the change of travel in the feed direction. From the overall distribution of machining errors, the fluctuations of positional and angular errors of the new process scheme are smaller than those of the old process scheme, and the fluctuation ranges of the measured and simulated positional errors corresponding to the new process scheme are 0.0165 and 0.015, respectively, while those of the old process scheme is 0.0201 and 0.0224, respectively. The error fluctuation of the new process solution is 17.9% smaller than that of the old process solution. In addition, the fluctuation ranges of the measured and simulated angular errors corresponding to the new process scheme are 0.00942 and 0.01209, respectively, while those of the old process scheme are 0.02859 and 0.02558, respectively, and the error fluctuation range of the new process scheme is 59.3% smaller than that of the old process scheme.
In terms of maximum machining error, the maximum positional and angular errors for the new process scheme are 0.0095 and −0.00701, respectively, while the maximum positional and angular errors of the old process scheme are 0.0101 and 0.01682, respectively. The two maximum errors corresponding to the new process scheme are on average 61.3% smaller than those of the old process scheme. The above results show that the overall distribution of machining positional and angular errors of the new process solution has less overall fluctuation, and the maximum error is lower than that of the old process solution.
To further verify the degree of correlation between machining errors and benchmarks corresponding to the new and old process schemes, we used grey correlation analysis [21] to calculate the degree of correlation between experiments and simulations of machining positional and angular errors under different process conditions; the results are shown in Table 8 and Table 9.
As shown in Table 8 and Table 9, the correlation degree of surface positional error of the new process scheme is above 0.85, showing strong correlation. This proves that the measured results are in good agreement with the calculated results. The correlation degree of angular error of the new process scheme is above 0.8, which is higher than that of the old scheme. The above results show that the processing error calculation model and the analysis results of error-influencing factors proposed in this paper can accurately identify the degree of influence of process parameters, milling vibration, and cutter tooth error on the machined surface positional and angular error. The error distribution consistency process design model can effectively design the process according to the above influence law, reduce the maximum machined error, and improve the consistency of the error distribution on the machined surface.

5. Conclusions

(1)
An instantaneous cutting model of a high-efficiency milling cutter was developed. Considering the influence of vibration on the overall offset angle and distance of the milling cutter, a simulation model of the machined surface morphology was proposed, a model of the machined surface positional and angular error was developed, and a consistency evaluation model of milling error distribution was proposed.
(2)
The analysis results of the obvious aboriginality of the factors affecting the consistency of the milling error distribution show that the axial and radial errors of the cutter teeth have the most obvious influences on error distribution. At the same time, the positional and angular errors of the machined surface are sensitive to the spindle speed and the feed per tooth, respectively. The interaction of influencing factors of machined surface error distribution was analyzed by response surface methodology. The maximum indicator of the interaction between spindle speed and milling vibration on the milling surface positional error was 0.36, and the maximum indicator of the interaction between feed per tooth and milling vibration on the milling surface angular error was 0.35. These results show that the interactions caused by process parameters and milling vibration have obvious influences on the distribution consistency of machined surface error, while the interaction of cutter tooth radial and axial errors with process parameters is relatively insensitive.
(3)
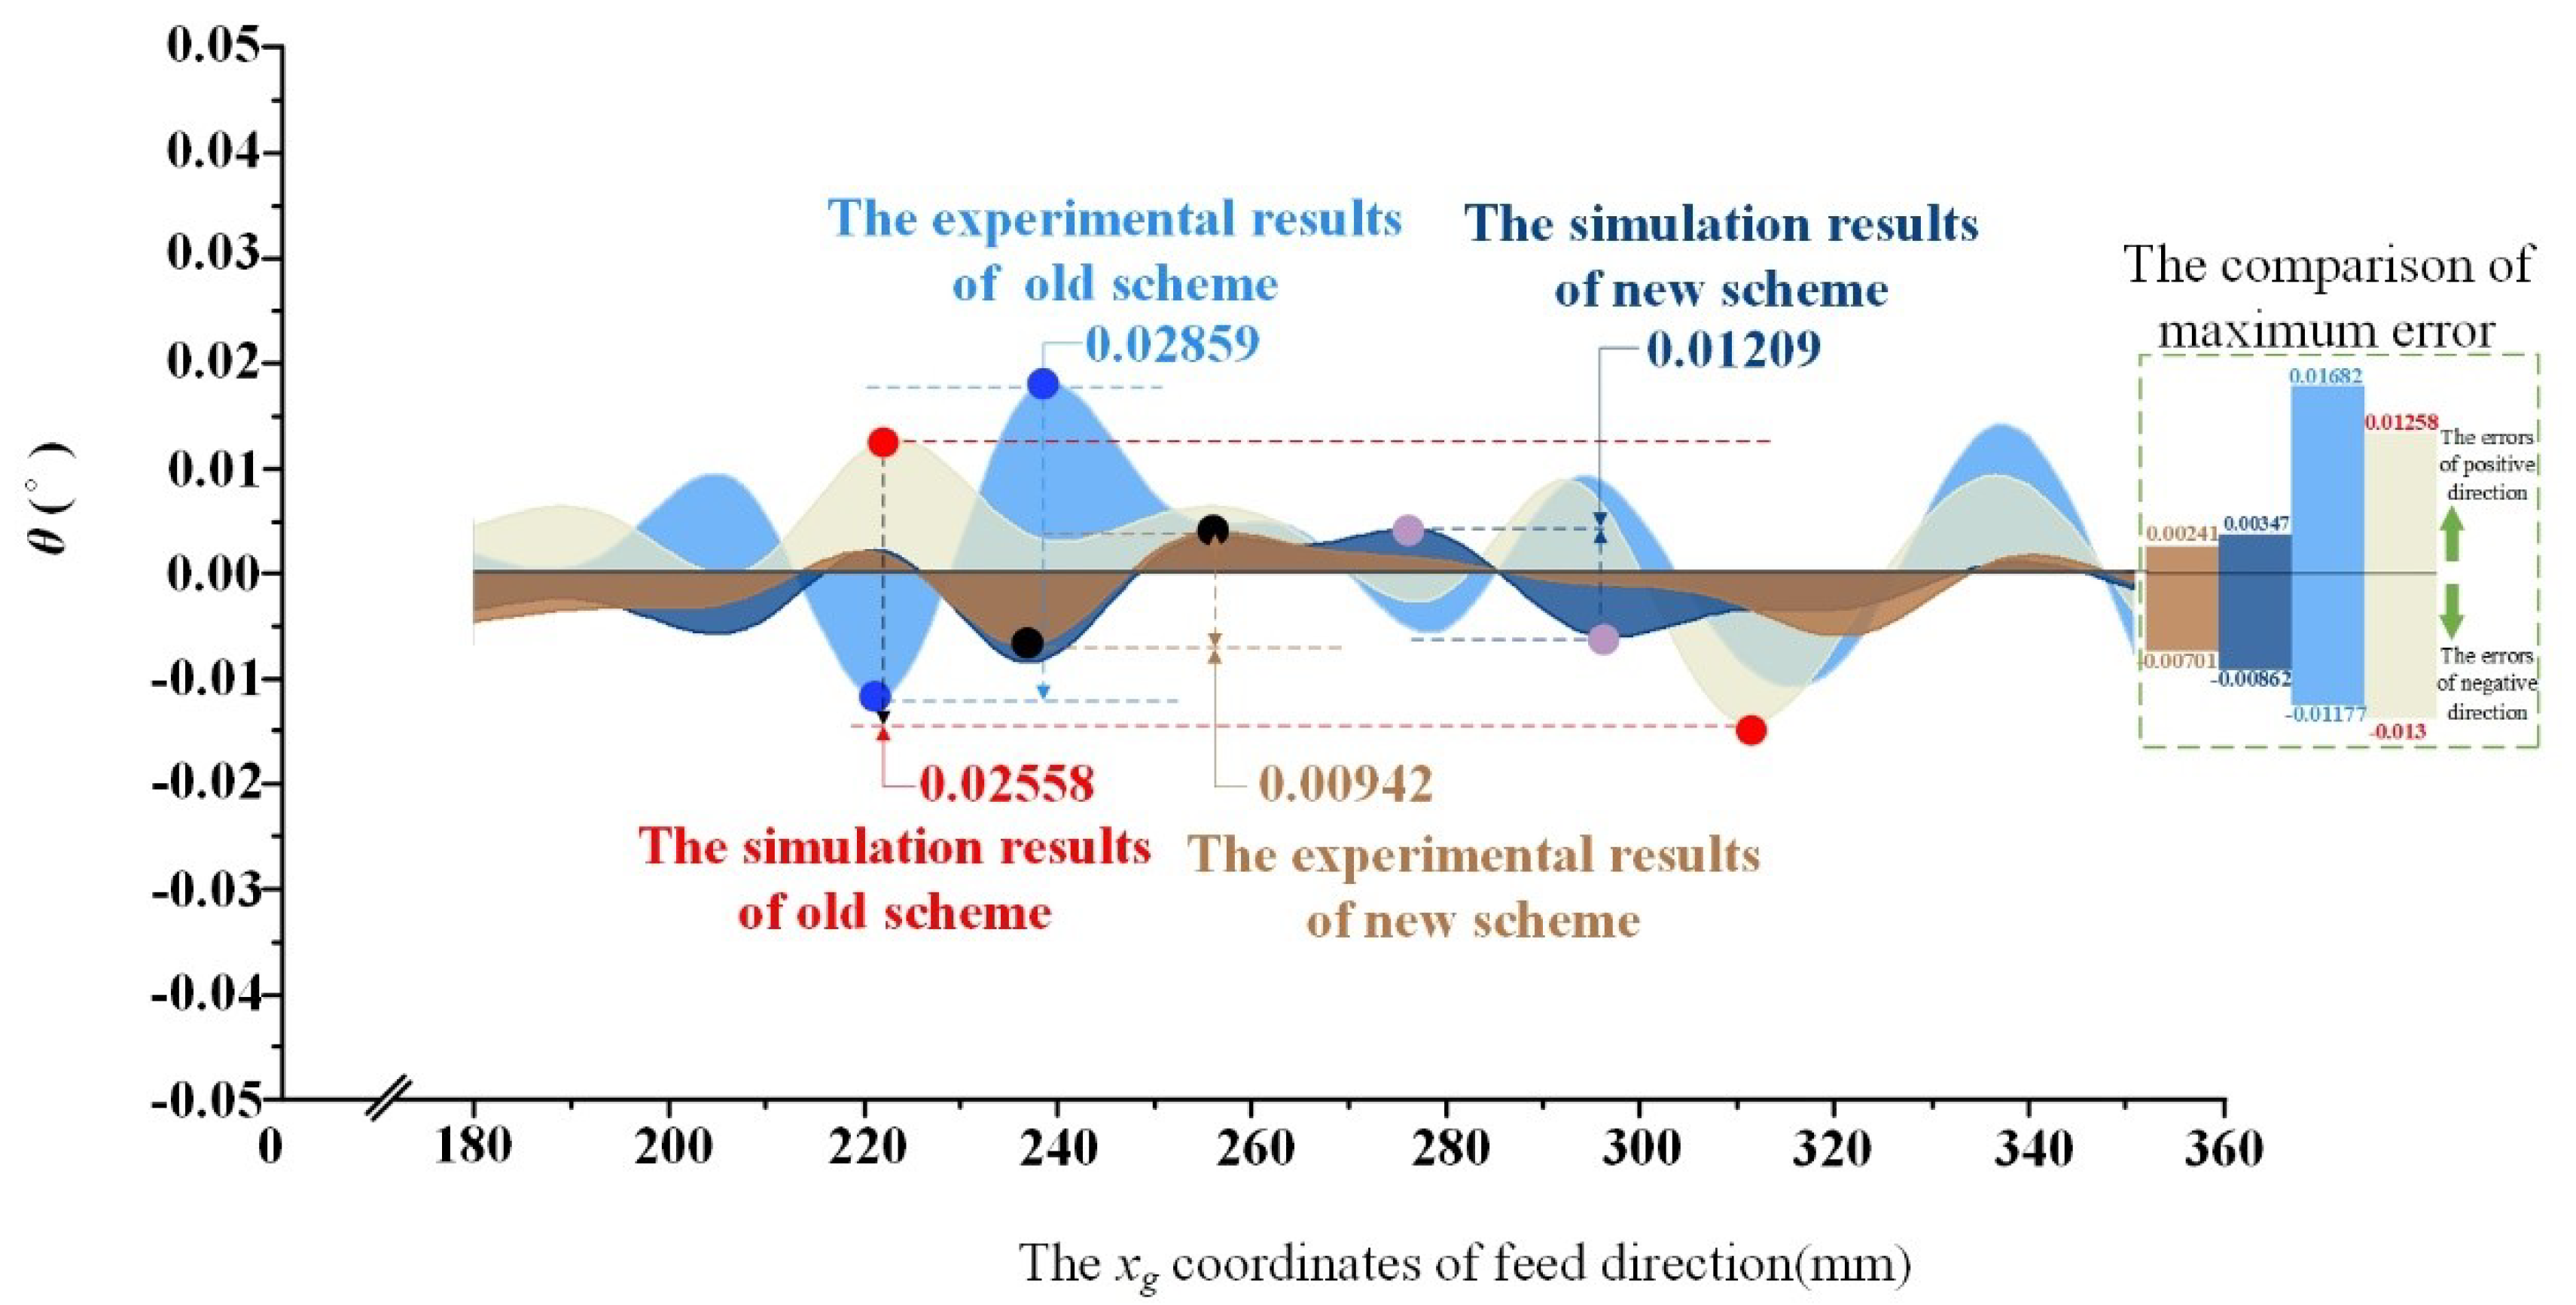
Based on the analysis results of the influence of design variables, a process design model of machined surface error distribution consistency is proposed. The validation results show that the range of positional error of the new process scheme is 17.9% lower than that of the old process scheme, and the range of angular error is reduced by 52.7%, indicating that the error distribution of the new process scheme is relatively concentrated. In addition, through the comparative analysis of the new and old process schemes, the positional error and angular error of the new process scheme are obviously improved compared with those of the old process scheme, proving the efficiency of the proposed design model.

Author Contributions

Conceptualization, P.Z. and Y.J.; methodology, P.Z. and Y.J.; software, Y.J. and C.M.; validation, B.J. and C.M.; investigation, Y.J.; resources, B.J.; data curation, Y.J. and C.M.; writing—original draft preparation, Y.J.; writing—review and editing, Y.J. and B.J.; supervision, B.J. and P.Z.; project administration, B.J.; funding acquisition, B.J. All authors have read and agreed to the published version of the manuscript.

Funding

This research was funded by the National Natural Science Foundation of China, 51875145; the Natural Science Foundation of Heilongjiang Province of China, ZD2020E008; and the National Natural Science Foundation of China, 52105440.

Institutional Review Board Statement

Not applicable.

Informed Consent Statement

Not applicable.

Conflicts of Interest

The authors declare no conflict of interest.

References

  1. Wang, S.M.; Lee, C.Y.; Gunawan, H.; Yeh, C.C. An accuracy-efficiency-power consumption hybrid optimization method for CNC milling process. Appl. Sci. 2019, 9, 1495. [Google Scholar] [CrossRef] [Green Version]
  2. Li, L.; Deng, X.; Zhao, J.; Zhao, F.; Sutherland, J.W. Multi-objective optimization of tool path considering efficiency, energy-saving and carbon-emission for free-form surface milling. J. Clean. Prod. 2018, 172, 3311–3322. [Google Scholar] [CrossRef]
  3. Zhang, X.; Zhang, W.; Zhang, J.; Pang, B.; Zhao, W. Systematic study of the prediction methods for machined surface topography and form error during milling process with flat-end cutter. Proc. Inst. Mech. Eng. Part B J. Eng. Manuf. 2019, 233, 226–242. [Google Scholar] [CrossRef]
  4. Huang, T.; Zhang, X.M.; Ding, H. Error analysis of time-domain methods for milling stability prediction. Procedia CIRP 2018, 77, 457–460. [Google Scholar] [CrossRef]
  5. Eser, A.; Aşkar Ayyıldız, E.; Ayyıldız, M.; Kara, F. Artificial intelligence-based surface roughness estimation modelling for milling of AA6061 alloy. Adv. Mater. Sci. Eng. 2021, 2021, 5576600. [Google Scholar] [CrossRef]
  6. Zhuo, Y.; Han, Z.; An, D.; Jin, H. Surface topography prediction in peripheral milling of thin-walled parts considering cutting vibration and material removal effect. Int. J. Mech. Sci. 2021, 211, 106797. [Google Scholar] [CrossRef]
  7. Chan, T.C.; Hong, Y.P.; Yu, J.H. Effect of Moving Structure on the Spatial Accuracy and Compensation of the Coordinate Measuring Machine. Int. J. Precis. Eng. Manuf. 2021, 22, 1551–1561. [Google Scholar] [CrossRef]
  8. Xu, M.; Li, C.; Kurniawan, R.; Park, G.; Chen, J.; Ko, T.J. Study on surface integrity of titanium alloy machined by electrical discharge-assisted milling. J. Mater. Process. Technol. 2022, 299, 117334. [Google Scholar] [CrossRef]
  9. Wang, L.; He, Y.; Wang, Y.; Li, Y.; Liu, C.; Wang, S.; Wang, Y. Analytical modeling of material removal mechanism in dry whirling milling process considering geometry, kinematics and mechanics. Int. J. Mech. Sci. 2020, 172, 105419. [Google Scholar] [CrossRef]
  10. Usca, Ü.A.; Uzun, M.; Şap, S.; Kuntoğlu, M.; Giasin, K.; Pimenov, D.Y.; Wojciechowski, S. Tool wear, surface roughness, cutting temperature and chips morphology evaluation of Al/TiN coated carbide cutting tools in milling of Cu–B–CrC based ceramic matrix composites. J. Mater. Res. Technol. 2022, 16, 1243–1259. [Google Scholar] [CrossRef]
  11. Kaltenbrunner, T.; Krückl, H.P.; Schnalzger, G.; Klünsner, T.; Teppernegg, T.; Czettl, C.; Ecker, W. Differences in evolution of temperature, plastic deformation and wear in milling tools when up-milling and down-milling Ti6Al4V. J. Manuf. Process. 2022, 77, 75–86. [Google Scholar] [CrossRef]
  12. Zhang, M.; Zhang, D.; Geng, D.; Shao, Z.; Liu, Y.; Jiang, X. Effects of tool vibration on surface integrity in rotary ultrasonic elliptical end milling of Ti–6Al–4V. J. Alloy. Compd. 2020, 821, 153266. [Google Scholar] [CrossRef]
  13. Wang, C.; Ding, P.; Huang, X.; Gao, T.; Li, C.; Zhang, C. Reliability sensitivity analysis of ballend milling accuracy. Int. J. Adv. Manuf. Technol. 2021, 112, 2051–2064. [Google Scholar] [CrossRef]
  14. Deng, C.; Miao, J.; Ma, Y.; Wei, B.; Feng, Y. Reliability analysis of chatter stability for milling process system with uncertainties based on neural network and fourth moment method. Int. J. Prod. Res. 2020, 58, 2732–2750. [Google Scholar] [CrossRef]
  15. Xiong, Z.; Lianyu, Z.; Wei, F. Adaptive optimization of milling process parameters for thin-walled parts driven by real-time vibration data. Chin. J. Mech. Eng. 2020, 56, 172–184. [Google Scholar] [CrossRef]
  16. Aslan, A. Optimization and analysis of process parameters for flank wear, cutting forces and vibration in turning of AISI 5140: A comprehensive study. Measurement 2020, 163, 107959. [Google Scholar] [CrossRef]
  17. Salur, E.; Aslan, A.; Kuntoglu, M.; Gunes, A.; Sahin, O.S. Experimental study and analysis of machinability characteristics of metal matrix composites during drilling. Compos. Part B Eng. 2019, 166, 401–413. [Google Scholar]
  18. Pimenov, D.Y.; Bustillo, A.; Wojciechowski, S.; Sharma, V.S.; Gupta, M.K.; Kuntoğlu, M. Artificial intelligence systems for tool condition monitoring in machining: Analysis and critical review. J. Intell. Manuf. 2022, 33, 1–43. [Google Scholar] [CrossRef]
  19. Kuntoğlu, M.; Salur, E.; Gupta, M.K.; Sarıkaya, M.; Pimenov, D.Y. A state-of-the-art review on sensors and signal processing systems in mechanical machining processes. Int. J. Adv. Manuf. Technol. 2021, 116, 2711–2735. [Google Scholar] [CrossRef]
  20. Wei, W.; Li, Y.; Xu, Y.; Yang, C. Research on tool wear factors for milling wood-plastic composites based on response surface methodology. Bioresources 2021, 16, 151. [Google Scholar] [CrossRef]
  21. Daniel, S.A.A.; Pugazhenthi, R.; Kumar, R.; Vijayananth, S. Multi objective prediction and optimization of control parameters in the milling of aluminium hybrid metal matrix composites using ANN and Taguchi-grey relational analysis. Def. Technol. 2019, 15, 545–556. [Google Scholar] [CrossRef]
Figure 1. The instantaneous cutting attitude of a high-efficiency milling cutter.
Applsci 12 07199 g001
Figure 2. Offset model of cutter tooth position under vibration.
Applsci 12 07199 g002
Figure 3. Surface morphology and error variation of the milling process under vibration.
Applsci 12 07199 g003
Figure 4. Solution model of positional and angular errors of the machined surface.
Applsci 12 07199 g004
Figure 5. Consistency analysis model of the machined surface error distribution.
Applsci 12 07199 g005
Figure 6. Consistency evaluation model of machined surface error distribution.
Applsci 12 07199 g006
Figure 7. Simulation results of machined surface morphology.
Applsci 12 07199 g007aApplsci 12 07199 g007b
Figure 8. Inherent items of influencing factors of the machined surface error variation characteristics.
Applsci 12 07199 g008
Figure 9. Response surface of design variable interactions with positional error: (a) The feed rate per tooth and rotational speed of the milling cutter. (b) The rotational speed of the milling cutter and milling vibration level. (c) The feed rate per tooth and milling vibration level.
Applsci 12 07199 g009
Figure 10. The influence index of machined surface positional error.
Applsci 12 07199 g010
Figure 11. Response surface of design variable interactions with angular error: (a) The distribution of cutter tooth error and the rotational speed of the milling cutter. (b) The milling vibration level and the rotational speed of the milling cutter. (c) The speed rate per tooth and the distribution of cutter tooth error. (d) The feed rate per tooth and the milling vibration level. (e) The milling vibration level and the distribution of cutter tooth error.
Applsci 12 07199 g011
Figure 12. The influence index of machined surface angle error.
Applsci 12 07199 g012
Figure 13. Process design method for consistency of milling error distribution.
Applsci 12 07199 g013
Figure 14. Milling experimental device: (a) Milling experiment site. (b) Three-axis milling machining center.
Applsci 12 07199 g014
Figure 15. Positional reference point error of the old and new process schemes.
Applsci 12 07199 g015
Figure 16. Positional point angular error of the new and old process schemes.
Applsci 12 07199 g016
Table 1. Meaning of milling cutter structure and cutting state parameters.
NumberParametersMeaning of Parameters
1og-xgygzgWorkpiece coordinate system, where og is the origin of the coordinates, which is the vertex behind the bottom of the cutting end of the milling workpiece. The xg axis is the same as the feed speed direction of the milling cutter, the yg axis is parallel to the milling width direction, and the zg axis is parallel to the cutting depth direction.
2o-abcCutting coordinate system without milling vibration, where o is the origin of the coordinates, located at the center of the milling cutter bottom. The a axis is parallel to the feed speed direction, the b axis is parallel to the cutting width direction, and the c axis is parallel to the cutting depth direction.
3ov-avbvcvCutting coordinate system with milling vibration, where ov is the coordinate origin, which is the position of the center point o of the bottom surface of the milling cutter under the vibration of the milling cutter. The av axis is the milling cutter ideal coordinate system’s a axis vibration offset state, the bv axis is the milling cutter ideal coordinate system’s b axis vibration offset state, and the cv axis is the milling cutter ideal coordinate system’s c0 axis vibration offset state.
4oi-aibiciCutter tooth coordinate system, where oi is the knife point. The ai axis is perpendicular to the cutter tooth’s instantaneous cutting speed direction, and points to the cutter center. The bi axis is parallel to the instantaneous cutting speed direction of the cutter tooth, and the ci axis is parallel to the milling cutter spindle.
5o0-a0b0c0Structure coordinate system of the milling cutter, Where o0 is the coordinate origin and is the intersection point of the milling cutter axis and the surface where the minimum point of the cutter tooth is located, where the a0 axis is in the plane where the minimum point of the cutter tip is located, and is perpendicular to the b0 axis, while the b0 axis is in the plane where the minimum point of the cutter tooth is located, and points to the tipping point with the largest outer diameter.
6ΔZiMilling cutter tooth axial error.
7xg(L)The value of workpiece length on the xg axis in the workpiece coordinate system.
8yg(W)The value of workpiece width on the yg axis in the workpiece coordinate system.
9zg(H)The value of workpiece height the on zg axis in the workpiece coordinate system.
10mi(c1)Any point on the cutting edge of the milling cutter that participates in the cutting part is the ith tooth, and the c axis coordinate of the milling cutter coordinate system is c1.
11mj(c2)Any point on the cutting edge of the milling cutter that does not coincide with mi(c1) in the cutting part is the jth tooth, and the coordinate of axis c of the milling cutter coordinate system is c2.
121The plane is parallel to the aob plane of the milling cutter coordinate system at point mi(c1).
132Parallel plane of point mj(c2) and the milling cutter coordinate system’s aob plane.
14VfThe milling cutter’s feed rate.
15δThe space angle between the milling cutter spindle and the ideal-state milling cutter spindle under vibration.
16φsiThe angle between the cutter tooth coordinate system of cutter tooth i and the cutter structure coordinate system.
17φq(t)The angle between the cutter tooth structure coordinate system and the cutting coordinate system under vibration.
18βThe helix angle of the milling cutter.
Table 2. Process design variables of the machined surface error.
Design VariableLevel 1Level 2Level 3Level 4Level 5
n (rpm)12901462163418061978
fz (mm/z)0.050.060.070.080.09
ap (mm)1012141618
ae (mm)0.50.60.70.80.9
Vibration acceleration of zgL-axis direction (m/s2)1.791.221.863.232.54
Vibration acceleration of xgL-axis direction (m/s2)0.961.041.151.531.69
Vibration acceleration of ygL-axis direction (m/s2)2.195.402.215.925.74
Table 3. Design variables for error distribution of milling cutter teeth.
Milling Cutter NumberCutter Tooth Error (mm)
Milling cutter 1Δzi0.0460.0070.0170.0360.028
Δri0.0260.0560.0160.0280.019
Milling cutter 2Δzi0.0440.0320.0080.0250.027
Δri0.0050.0120.0090.0280.036
Milling cutter 3Δzi0.023−0.012−0.0230.031−0.024
Δri0.015−0.0030.013−0.0070.002
Milling cutter 4Δzi0.0120.0220.034−0.0170.026
Δri−0.0130.0020.0210.0220.015
Milling cutter 5Δzi0.0130.008−0.0230.0270.038
Δri0.0010.012−0.011−0.0280.003
Table 4. Variance analysis results of machining error.
Design VariableVariance
Δyθ
n0.000120.00038
fz0.000210.00014
Cutter tooth error0.000230.00078
Milling vibration0.000120.00035
Fp-ValueF crit
ΔyθΔyθΔyθ
3.81914.48140.03080.01823.23883.2388
Table 5. Simulation scheme of error variation characteristics.
Serial Numbern
(rpm)
fz
(mm)
MaSerial Numbern
(rpm)
fz
(mm)
Ma
117200.07M3a51217200.07M3a4
212900.05M1a51312900.09M4a5
317200.07M3a31417200.07M3a3
424430.07M3a31517200.07M2a3
517200.07M2a31621500.05M5a1
621500.09M4a11717200.07M3a2
712900.09M5a41817200.04M3a3
817200.10M3a31917200.07M3a3
917200.07M3a3209960.07M3a3
1021500.09M1a52112900.05M1a1
1121500.05M5a5
Table 6. The material composition of the TC4 titanium alloy workpiece.
ElementTiAlVFeOSiCNHOthers
Contents (%)Balance5.5~6.83.5~4.50.30.20.150.10.050.010.5
Table 7. Validation of process parameters used in the experiment.
Serial Numbern
(r/min)
fz
(mm/z)
ap
(mm)
ae
(mm)
Cutter Tooth Error (mm)i = 1i = 2i = 3i = 4i = 5
Original process scheme17190.06100.5Δzi−0.004−0.001−0.0130−0.009
Δri0.000−0.029−0.039−0.010−0.018
New Process Scheme12900.09100.5Δzi0.005−0.019−0.0140.000−0.009
Δri−0.001−0.006−0.006−0.004−0.000
Table 8. The consistency of machining error distribution of surface positional error in the old scheme.
Cutting Depth of
the Milling Cutter
Δyθ
MamaxMamin M ¯ a γMamaxMamin M ¯ a γ
ap = 0 mm0.0138−0.0172−0.001240.950.017562−0.01961−0.001270.73
ap = 5 mm0.0101−0.0100−0.001080.920.01554−0.01699−0.002560.82
ap = 10 mm0.0156−0.0161−0.001440.880.020612−0.01792.44 × 10−50.77
Table 9. The consistency of machining error distribution of surface angular error in the new scheme.
Cutting Depth of
the Milling Cutter
Δyθ
MamaxMamin M ¯ a γMamaxMamin M ¯ a γ
ap = 0 mm0.0151−0.00810.0039560.910.0273−0.02380.0016720.87
ap = 5 mm0.0095−0.0070.000560.900.0168−0.01560.0007590.83
ap = 10 mm0.0118−0.1080.0021930.850.0189−0.0318−0.00120.82
Publisher’s Note: MDPI stays neutral with regard to jurisdictional claims in published maps and institutional affiliations.

