1. Introduction
The still ongoing pandemic of the COVID-19 virus has had a huge impact on many aspects of human activities and interaction [
1,
2]. The academic world was no exception, as it had to resort to distance learning, but also to remote research in many fields, mostly through various online platforms [
3,
4,
5,
6,
7,
8,
9,
10]. Even before the pandemic, the field of acoustics that investigates perceptual phenomena by performing listening tests has already been contemplating the idea to perform online listening tests for some time [
11], and the same idea can be applied to other fields such as speech audiometry [
12,
13]. The pandemic itself has sped up the use of such an approach. The beginnings of this approach were focused on the possibility of distributing and performing online tests anywhere through available means of electronic communication, thus making them accessible to a pool of potential test subjects that is considerably larger than the one available in a laboratory.
Experiments performed remotely suffer from the lack of control over the experimental conditions, leading to question to what degree the collected experimental data is reliable [
14,
15,
16]. When it comes to online listening tests, it is entirely up to the test subject to follow the guidelines provided by the experiment designer regarding the acoustics of the room and the background noise inside, and the type and characteristics of the sound reproduction system (loudspeakers or headphones) to be used.
Some types of investigations of perceptual phenomena require a calibrated sound reproduction system in terms of exact level and/or flat frequency response, making them suitable only for a controlled laboratory environment. Other types of tests are not as sensitive to the lack of exact calibration and can be performed at home. In any case, any kind of calibration performed on a home listening test setup proves to be a herculean task, as the test subjects have no access to the equipment necessary for performing the calibration. This issue is often mentioned in reports on remotely performed research, but no suggestion is given on how to tackle it.
To solve at least a part of this problem that deals with the calibration of the reproduction level, the authors claim that it is possible to perform such a calibration using sounds people are familiar with from everyday experience, namely, speech. The accuracy of such a procedure needs to be evaluated, but the assumption is that it is sufficient for non-critical online listening test applications.
The test subjects in online listening tests are likely to use both headphones and loudspeakers, i.e., whatever is available to them. The levels required for headphone and loudspeaker reproduction that elicit the same sense of loudness differ by about 6 dB in anechoic conditions, as documented in literature [
17,
18,
19,
20] as “the 6-dB mismatch”. Studies show that the mismatch depends on the spectral content of the presented sound, the acoustics of the room and even the type of headphones used [
21,
22], and that it can be avoided by careful equalization at the eardrum of the listener [
23,
24]. However, as the level calibration method proposed in this paper is intended for use in non-laboratory conditions, this mismatch is inevitable and needs to be accounted for in the calibration procedure.
The first part of this study examines the consistency of the test subjects as listeners in setting what they consider to be the “normal” level of reproduced speech depending on the voice of the speaker, the sound reproduction system used (loudspeakers or headphones), and the (non)existence of a visual stimulus that represents the interlocutor. In studies [
25,
26], it is suggested that people tend to associate loudness of speech with average levels, whereas the loudness of non-intelligible sounds is strongly associated with their peak levels. Moreover, it is also suggested that people are more consistent in setting the level of speech than they are when asked to set the level of non-speech sounds. Thus, the choice of speech as a level calibration signal is a sensible solution.
The second part of the study examines the consistency of the test subjects as readers in reading a paragraph of text at what they consider to be the “normal” level of speech, depending on the (non)existence of a visual stimulus that again represents the interlocutor. The understanding and perception of what normal, comfortable, or convenient level of speech is has been examined in various research, yielding typical levels for conversational communication in various conditions related to the level of background noise and room acoustics [
27,
28,
29,
30,
31]. The changes in verbal communication people resort to in order to overcome the problems of noise and/or unfavorable room acoustics and maintain speech intelligibility go beyond adjusting the level, as documented in literature [
32], first and foremost being the Lombard effect [
33].
The main purpose of this research is (1) to evaluate if speech as a familiar, everyday sound can be used in calibration of the reproduction level in non-laboratory listening test setups, based on the perception of “normal” level of speech, and (2) to make a preliminary proposal of a method of level calibration that would utilize speech as a calibration sound in the stated conditions. A similar attempt was made in study [
34], and the present study represents a more comprehensive approach to this issue. Open issues and the directions of further research are discussed.
2. Materials and Methods
2.1. Experimental Setup
The experimental setup was placed in a dedicated listening room with the dimensions of 10.2 m × 7.2 m × 3.2 m (L × W × H) and the volume of 235 m3. The room is acoustically treated to yield the reverberation time of 0.5 s over the entire standard frequency range of 125 Hz to 4 kHz, except in the 125 Hz octave band, in which the reverberation time is slightly higher and reaches 0.7 s. As the room is also used as a listening room for quality evaluation of sound reproduction systems, the reverberation time measurements were extended to the 63 Hz octave band, in which its value reaches 0.81 s, as well as to 8 kHz octave band, in which it decreases to 0.38 s. The measured noise level in the room was 25 to 30 dBA, depending on the time of day.
Placing the experimental setup into an anechoic chamber was initially considered and ultimately dismissed, as it does not properly represent the acoustical conditions in a typical home environment and would look and sound unnatural to the test subjects.
The loudspeakers used in the experiment were a pair of active, bookshelf-sized near-field studio monitors set in a wide stereo configuration. They were put at a distance of 1 m from the listening position. The angle between the loudspeakers was set to 90° instead of 60° used in standard stereo listening to facilitate a clear view of the visual stimulus, when used in the experiment. Moreover, this setup allows the sound to be perceived from the direction consistent with the positions of the visual stimulus. The frequency response of the loudspeakers is maintained within ±2 dB within the entire frequency range of speech.
For headphone reproduction, a pair of open headphones, calibrated in terms of frequency response, was used as a part of a dedicated hardware-software package.
Visual stimulus was used in the experiment to create an illusion of a virtual speaker/interlocutor speaking to the test subject in the listening experiment, and a virtual listener/interlocutor being read to by the test subject in the reading part of the experiment. Due to the SARS-CoV-2 pandemic and all the epidemiological countermeasures that were in force at the time, the decision to use a real person as the visual stimulus had to be abandoned to reduce health risk to a minimum. Instead, a dummy head was appropriately clothed and then put on a small trolley, thus being placed at the height of a standard sitting person. Moreover, the trolley provided an easy way of placing the dummy head at predetermined positions in front of the test subject, or to move it out of sight when no visual stimulus was required. Two positions of the visual stimulus, as viewed from the listener position, are shown in
Figure 1.
To make the execution of the listening part of the experiment as simple as possible for the test subjects, a graphic user interface has been developed using MaxMSP [
35] that offers a simple way of changing the level of the currently reproduced sound sample and records the last set value when moving on to the next test sample.
A class-1 measurement microphone was used in the reading part of the experiment for recording the subjects as they were reading the provided text. The microphone was placed one meter away from the reader.
2.2. Calibration
The calibration procedure of the sound reproduction systems used for the listening part of the experiment consisted of several steps. Firstly, the reproduction level of the pair of loudspeakers was calibrated at 80 dBA using broadband pink noise limited to the common frequency range of speech, i.e., from 50 to 5000 Hz. The bandwidth of the pink noise was limited to 5 kHz to avoid coloration of the reproduced pink noise at high frequencies that could possibly influence the subjective calibration process, although it was performed only informally. The coloration stems from the comb filtering effect that appears at high frequencies due to the proximity of the table surface to both the loudspeaker and the listener, but also due to the diffraction from the edges of the computer monitor that was placed on that table. Moreover, the broadband A-weighted levels of full-band and filtered pink noise differ by less than 0.5 dB, thus, the required calibration level is maintained. The reproduction level was measured at the position of the listener, i.e., their head, using a class-1 sound level meter. After this, a dummy head was placed at the same position. Pink noise was reproduced over loudspeakers once again and was recorded using the dummy head and REAPER v6.45, developed by COCKOS Inc. from Rosendale, NY, USA as the DAW software of choice After that, the chosen pair of headphones was placed on the dummy head. Pink noise was reproduced over them and recorded the same way as before. To equalize the loudness of the two recordings, i.e., the sounds heard by the dummy head, a feature of the DAW software was used, regarding the analysis of loudness of recordings. In particular, the loudness of the two recordings was analyzed in terms of the so-called Loudness Units Full Scale (LUFS), and the headphone output level was adjusted so that the obtained LUFS values were equal for both recordings [
36].
As an informal test, a similar, but purely subjective loudness-matching calibration procedure was conducted using a small group of expert listeners. They were asked to listen to the same pink noise while alternating the reproduction between loudspeakers and headphones, and to adjust the headphone level until the perceived loudness of pink noise was the same on both systems. For every listener, the set headphone level differed from the one obtained as described above by no more than 1.5 dB. This result suggests that even a purely subjective loudness-matching level calibration of the two systems would work reasonably well.
The calibration procedure for the reading part of the experiment consisted of recording the pure 1-kHz tone of a class-1 calibrator with the known level of 94 dB placed onto the microphone. All recordings of read speech that were made during the experiment were analyzed and their level was referenced to the known level of the recorded calibrator signal. As the experiment was conducted over several days, the calibration tone was recorded each day before starting the recording test session and also at the end of the day. The analysis of the calibration recordings reveals that the gain structure in the recording system remained stable and practically unchanged over the course of the experiment, i.e., the observed changes were lower than 0.1 dB.
2.3. Stimuli
The speech stimuli used in this experiment consisted of four excerpts taken from texts written in the Croatian language. Each excerpt was read by a professionally trained speaker employed at a prominent radio or television station in Croatia. Two male and two female speakers were engaged to read these texts. The length of all four recordings was set to 30 to 40 s, so that the excerpts they contain could form a meaningful whole, instead of being cut abruptly. The level of these recordings was left as is, i.e., the difference between the equivalent sound pressure level of the loudest and the softest sample was around 6 dB, both unweighted and A-weighted. No normalization of any kind was undertaken to equalize the level or loudness of all samples to test if this starting difference will play a role and have an influence on the results of the experiment.
2.4. Test Subjects
A total of 35 test subjects took part in the experiments. They were recruited mostly from the student population. Several subjects are the employees of the University of Zagreb.
Standard demographic data was collected on the subjects’ age and gender. The resulting age range within the group was 19 to 48. The average age of the entire group was 23.5 years, and the standard deviation for the group was quite large at 6.5 years, due to the employees being considerably older than the students. There were 22 males and 13 females.
The subjects were also asked to assess the condition of their hearing as either normal or impaired. Two subjects reported their hearing to be impaired in some way, but the analysis of the results showed that their responses do not qualify as outliers in any way. As a consequence, they were kept in the subject pool, and the data they provided was kept as well.
The test subjects were asked to evaluate the way they talk with regard to loudness. In this respect, the options to choose from were quiet (5 subjects), normal (18 subjects), and loud (12 subjects). The habits of the listeners regarding the way they listen to music were examined as well. In particular, they were asked to state how often they listened to loud music, the options being never (1 subject), sometimes (27 subjects), or always (7 subjects). Additionally, their preference of the sound reproduction system used when listening to music and speech was recorded as well. The majority of the subjects stated that they prefer to use headphones over loudspeakers when listening to music (24 vs. 11, respectively). When it comes to listening to speech, the majority of the group preferred loudspeakers (20 subjects) over headphones (15 subjects).
2.5. Experimental Procedure
The experimental procedure was divided into three parts. In the initial part, the subjects were informed about the task at hand, but not on the nature and purpose of the experiment. They were asked to provide the demographic and all other data collected about them, and to sign the informed consent form to confirm that they willingly participated in the experiment, having been informed of the procedure to be followed and assured that no individual personal data shall ever be disclosed to the public.
In the first of the two parts of the experiment itself, the listeners were asked to listen to the prepared samples of the speech stimuli and to set the reproduction level so that the loudness of speech felt normal to them. The reproduction of each sample started at a randomly selected low level that made the sound sample barely audible. Mono reproduction was used over a pair of loudspeakers and a pair of headphones. The dummy head was used as an illustration of a speaker talking to the subject, i.e., a visual stimulus that accompanies the reproduced speech samples. Three different scenarios were tested: (1) no dummy head, (2) the dummy head placed within the personal space of the subject (at a distance of 85 cm), and (3) the dummy head placed within the social space of the subject (at a distance of 280 cm). The size of personal and social space was adopted as described in [
37]. The subjects were asked to imagine the dummy head as a speaker talking to them. They listened to all four speech samples on both reproduction systems for all three conditions of the visual stimulus, thus providing a total of 24 responses per subject. The levels of these three factors and all 24 possible combinations are shown in
Table 1. The ultimate result of this part of the experiment are the A-weighted levels of normal speech in the described conditions, as set by the subjects by listening to an imaginary speaker.
In the second part of the experiment, the subjects were asked to read the text used in one of the speech samples prepared for the listening part of the experiment. Most importantly, they were asked to read the text at what they considered to be the normal loudness of speech. The subjects were recorded using a calibrated recording system, so that the actual speech level can be determined. As in the listening part of the experiment, a dummy head as the visual stimulus was used here as well in three scenarios. In the first one, the subjects were reading “to the room”, i.e., no visual stimulus was present. In the other two scenarios, the dummy head acted as an imaginary listener to whom the subjects were reading. As before, the dummy head was placed at two different distances from the subjects: at 85 cm, which puts it within the personal space of the subject, and at 280 cm, i.e., within the social space of the subject. All three levels of the visual stimulus as the only investigated factor are shown in
Table 2. The low noise level in the test room allowed the listeners to read the lines of the text in their normal voice [
27,
31], without the occurrence of the Lombard effect [
33]. The ultimate result of this part of the experiment are the A-weighted levels of normal speech at a distance of one meter, as determined by the subjects by playing the role of the speaker themselves.
3. Results and Discussion
The following subsections report the results of the analyses performed on the collected raw data. In statistical analyses, all decisions on statistical significance were made at the 0.05 significance level. The statistical analyses were performed in R [
38]. The post hoc power analysis was performed according to [
39].
3.1. Listening
In the listening part of the experiment, 35 listeners have experienced all 24 experimental conditions defined by the levels of the three investigated factors. Each subject gave 24 responses in total, i.e., one per condition. A total of 840 observations was collected in the form of the A-weighted level of reproduced speech as the dependent variable. As described earlier, the independent variables/factors whose influence was tested were the following:
sound reproduction system: two levels (loudspeakers or headphones);
visual stimulus—dummy head representing the speaker/interlocutor: three levels (none present, dummy head at personal distance, dummy head at social distance);
speaker voice: four levels (two male and two female).
To match the experimental design, a three-way repeated measures ANOVA with all three within factors was implemented to statistically analyze the obtained data. The data in all the groups satisfied the condition of normality, as examined with the Shapiro–Wilk test and the corresponding QQ plots. No outliers have been found. Mauchly’s test of sphericity was performed, and the Greenhouse–Geisser corrections were applied where required. The resulting ANOVA table obtained from R is shown below as
Table 3, with effect size expressed as eta-squared
. Estimated power was added to the table as well.
The results of the ANOVA analysis indicate that there is a statistically significant effect of the used sound reproduction system and speaker voice as the main effects on the set A-weighted level of reproduced speech. The interaction of all three factors also shows as statistically significant. However, the calculated effect size in terms of eta-squared (0.01 = small; 0.06 = medium; 0.14 = large) reveals that the only meaningful effect is the sound reproduction system used. Moreover, the power analysis shows that the power of the test (0.7 = adequate; 0.8 = good; 0.9 = strong) is adequate enough to detect the influence of the main effects, but not to detect the effect of their interactions. In terms of practical significance of the observed differences and the obtained effect size, the only meaningful and truly significant result is the systemic 5 dB difference in the set A-weighted level of speech when listened to over loudspeakers vs. headphones.
Table 4 shows that the marginal mean of all A-weighted levels of speech obtained for headphones is 55.0 dBA, and the same quantity obtained for loudspeakers is 49.9 dBA. Respective standard deviations are shown as well. The difference of 5.1 dB is statistically significant and suggests that the listeners are prone to setting a significantly higher level of speech when listening to it on headphones, in comparison with listening on loudspeakers.
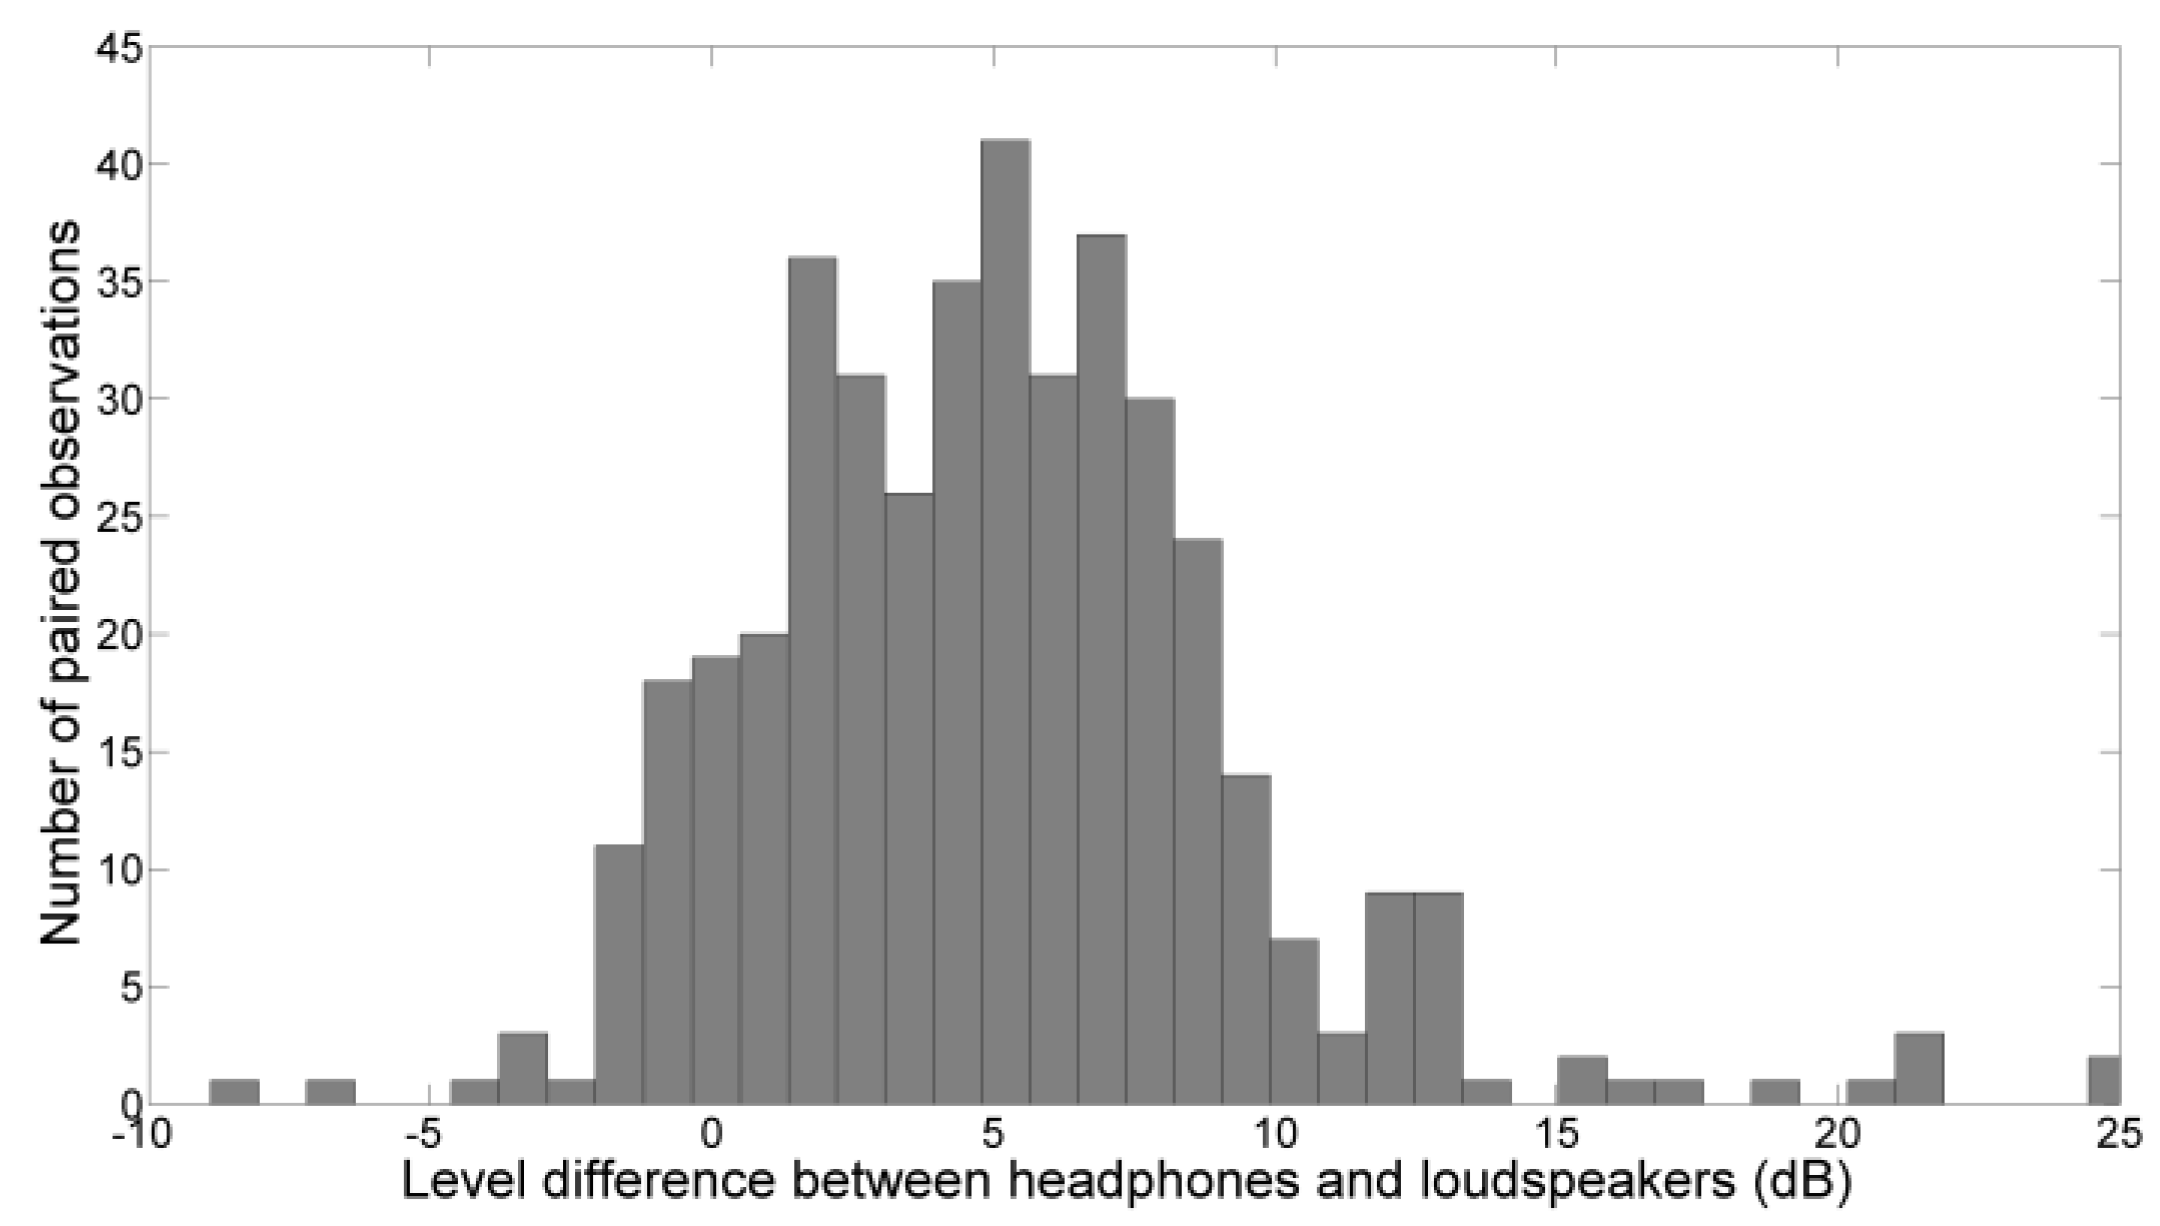
To further analyze this finding, the difference between the A-weighted levels of speech listened over headphones and loudspeakers was calculated for every pair of corresponding observations (the same visual stimulus and the same voice, for each listener). Thus, a total of 420 pairs of observations were obtained, and the same number of difference values. These values are shown in
Figure 2 as a histogram.
The histogram in
Figure 2 shows the distribution of the difference peaking at 5 dB, as already confirmed with statistical analysis. Additionally, it shows that the subjects were prone to setting a higher level of speech when listening on headphones, with the extremes exceeding 10 dB and going up to 25 dB. On the other hand, negative values of the difference, i.e., higher level set on loudspeakers than on headphones while listening appear in a marginal number of observations.
Assuming that the listeners expect a certain loudness of normal speech regardless of the sound reproduction system used for reproducing that speech, the obtained results are in line with the phenomenon of the “missing 6 dB”, i.e., a higher reproduction level required on headphones than on loudspeakers to evoke the same sense of loudness. The phenomenon has been reported in numerous work [
17,
18,
19,
20]. The level mismatch can be avoided if individual equalization is performed to produce the same waveforms at the eardrums using both reproduction systems [
23,
24]. However, even then, the mismatch is still present for sounds with pronounced low-frequency content and in moderately reverberant rooms [
21,
22]. In the context of this research and its possible application, the described mismatch is to be kept in mind and accounted for, as there is no other way to address this issue in non-laboratory environments, i.e., in acoustically ordinary rooms in dwellings or at the workplace, with the subject equipped with a pair of headphones and/or loudspeakers of arbitrary type and model.
Table 5 shows the marginal means and standard deviations for the three investigated conditions of the visual stimulus.
The data shows that all three marginal means fall within the interval of less than 1.5 dB. The results of the ANOVA test do not show a statistically significant effect of the visual stimulus on the set level of speech. The visual stimulus put at 280 cm away from the listener yields a 1.3–1.4 dB lower average level than the other two conditions (no dummy head and dummy head at 85 cm from the listener) that yield virtually identical average levels. This indicates that the visual stimulus, as set up in this experiment, has virtually no meaningful effect on the chosen level of reproduced speech, as the indicated differences between marginal means barely exceed the just-noticeable difference in level (1 dB) that leads to a perceivable difference in loudness. The very small effect size in terms of the calculated eta-squared goes in line with this finding.
Table 6 shows the marginal means and respective standard deviations for four different speaker voices.
The data shows that all four marginal means fall within the interval of 1.8 dB. The results of the ANOVA test do show a statistically significant effect of the used speaker voice on the set level of speech. The post hoc pairwise comparison tests as a follow-up indeed reveal that there is a significant difference between voice 1 and voice 3. However, in the context of non-laboratory level calibration, the calibrated level maintained in the range of 1.8 dB would be considered perfectly acceptable. Therefore, the conclusion is that the used voice has virtually no meaningful effect on the chosen “normal” level of reproduced speech as a means of calibrating the reproduction level in online, non-laboratory listening tests. The small effect size in terms of the calculated eta-squared supports this finding.
3.2. Reading
In the reading part of the experiment, 34 listeners gave three responses each, thus yielding a total of 102 observations in the form of A-weighted level of read speech as the dependent variable. As described earlier, during this part of the experiment, the listeners were asked to read a few lines of text for three different levels of the visual stimulus, identical to the ones in the listening part of the experiment.
To statistically analyze the obtained data and determine the possible influence of visual stimulus as the independent factor on the A-weighted level of read speech as the dependent variable, a one-way repeated measures ANOVA was implemented. The data in all three groups satisfied the condition of normality, as examined with the Shapiro–Wilk test and the corresponding QQ plots. Two outliers have been found, but not deemed extreme. Mauchly’s test of sphericity was performed, and the Greenhouse–Geisser correction was applied. The resulting ANOVA table obtained from R is shown below as
Table 7, with effect size expressed as eta-squared
. Estimated power was added to the table as well.
The results of this test indicate that there is a statistically significant effect of the visual stimulus on the A-weighted level of read speech. In terms of effect size expressed with the calculated eta-squared, the effect of visual stimulus is a medium-sized one. Power analysis confirms that the test has high power in the given conditions.
A closer look at the mean values for the three groups shown in
Table 8 reveals that the lowest value was obtained when the subjects were asked to read to the virtual person placed within their personal space, while the highest one was obtained with the virtual person positioned at a distance, i.e., far from the speaker, but still within their social space. The post hoc pairwise comparison test reveals that the differences between all three pairs of mean values are statistically significant. In practical terms, regarding the calibration method proposed below, the two conditions with the visual stimulus present in the room (placed close and far from the reader) are the important ones, and they show the difference of the average A-weighted levels of 2.9 dB. This 3-dB difference suggests that the readers will tend to raise their voice a bit to “reach” the virtual person positioned farther away from them.
In study [
31], optimum speech level has been found constant if the background noise level is kept below 40 dBA. This condition was fulfilled in our test room, yielding a reasonably constant and consistent level of read speech. The average A-weighted level of 55 dBA at 1 meter, found for the visual stimulus placed within the personal space of the listener is consistent with the one reported in [
27] for face-to-face communication at the distance of 1 meter performed with background noise level lower than 45 dBA.
In the context of non-laboratory level calibration using the concept of “normal” speech level, the obtained mean values for three different conditions of the visual stimulus are all contained in the interval of less than 3 dB. This result suggests that the level at which the subjects read a paragraph of text is reasonably stable, regardless of the (non)existence of visual stimulus. Moreover, it opens up the possibility of using a real person/reader as the source of speech that could be used for calibrating the reproduction level in a non-laboratory listening test setup.
3.3. Inter-Individual Differences
To gain a full insight into how the subjects involved in this experiment perceive “normal speech level” on an individual basis rather than as a group, it is imperative to examine and assess the magnitude of the interindividual differences between the subjects.
To do so, a visual examination was made by plotting every observation (A-weighted level) made by each subject. The observations collected in the listening part of the experiment are shown on the chart in
Figure 3, whereas the ones collected in the reading part of the experiment are shown in
Figure 4. For a simpler and clearer comparison, both charts use the same range of the A-weighted levels on the y-axis.
Figure 3 shows that the interindividual differences in the listening part of the experiment are considerable, much larger than the ones reported in [
34] as the result of a similar experiment using a reproduced speech sample spoken by a single female speaker and reproduced only over headphones. The range of observed values obtained for each listener reveals that the perception of what the “normal” speech level should be under the described experimental conditions is highly individual. As shown in
Figure 3, it is quite easy to find pairs of listeners with completely non-overlapping ranges of observations, e.g., the observations made by one listener never exceed 50 dBA, whereas the ones made by another start at 55 dBA and go considerably higher. The sheer range of observations viewed for the listeners individually is an indicator of their consistency in setting the “normal” speech level depending on the listening conditions (reproduction system, speaker voice, visual stimulus). A simple analysis was made, aimed on finding the width of the interval that contains all observations given by a subject by subtracting the highest value of the A-weighted speech level from the lowest one. The results reveal that some listeners (20 percent) can be declared reasonably consistent, i.e., not particularly affected with the changing listening conditions during the listening part of the experiment, as all their observations lie within 10 dB. Most of the listeners (60 percent) are moderately consistent, with all their observations contained in the interval with the width between 10 and 20 dB. Finally, the remaining 20 percent of the listeners are quite inconsistent, with the range of their observations being greater than 20 dB.
The extremely wide range of individual observations is also visible at the group level, as illustrated with standard deviations that correspond to individual marginal means shown in
Table 4,
Table 5 and
Table 6 for each of the three main effects (the choice of the reproduction system, visual stimulus, and speaker voice, respectively) in the listening part of the experiment. As shown, these standard deviations are in the range of 6.4 to 7.8 dB.
All the data presented above suggests that the interindividual differences exhibited in the listening part of the experiment definitely have a much stronger influence on the outcome of the experiment than any of the three main effects and their interactions.
As a conclusion, any listening test that uses level calibration based simply on setting the “normal” level of a calibration speech sample will inherently suffer from a large error that will be built into the observations and the output data obtained from such a test.
The observations collected during the reading part of the experiment are shown in
Figure 4, and the corresponding descriptive data is presented in
Table 8, as shown above.
A comparison with the data obtained from the listening part of the experiment reveals that the subjects were considerably more consistent when it comes to reading at a “normal” speech level, than when it comes to setting the “normal” level by themselves when listening to reproduced speech. As shown in
Figure 4, the overall spread of the speech levels obtained for all subjects while reading is considerably smaller than the one obtained for listening. As described above, only the visual stimulus was varied in this part of the experiment, thus yielding three observations per listeners, i.e., three measured levels of read speech.
Table 8 shows the average level and the standard deviation for the entire group for each of the three conditions of the visual stimulus. In comparison with the standard deviations obtained in the listening part of the experiment, the ones obtained here are considerably smaller, i.e., in the range of 3.1 to 4.2 dB.
The differences between subjects were also examined with regard to the demographic and other data they provided during the experiment. No plausible connection was found between the subjects’ age, gender, possible hearing impairment, and their listening habits, and the observations they provided both as listeners and as readers. When it comes to the self-assessment regarding the way they talk (quiet, normal or loud talkers), the basic analysis does show that there is a 2-dB average increase in the average A-weighted level of read speech between these three categories, i.e., 54, 56, and 58 dBA, respectively. The analysis of the data reveals that most of the subjects have made an accurate enough self-assessment regarding how loud they talk. No serious misjudgments were observed, i.e., no self-proclaimed loud talker read the text sample in a quiet voice, and vice versa. Occasional slight misjudgments were observed, most of which refer to self-proclaimed loud and quiet talkers who actually ended up reading the text at normal level. Only one subject self-assessed their way of talking as normal and then read the text as a loud talker would. The term “normal” level denotes the average A-weighted level at which the self-proclaimed normal talkers read the text, i.e., 55 dBA.
4. Proposal of a Method of Level Calibration in Non-Laboratory Tests
Judging by the results of the conducted experiment, it is highly unlikely that level calibration of a non-laboratory listening setup can be made simply by listening to a calibration sample of reproduced speech and setting the reproduction volume so that the speech would sound “normally” loud. The results of the experiment clearly show that the understanding of what normal speech level should be is highly individual. In any group of participants involved in a non-laboratory listening test (e.g., an online test), the reproduction level calibrated in this manner would vary considerably within the group, thus introducing a large amount of additional variability, i.e., error, into the results of such a test.
On the other hand, the results of the experiment show that the differences between the subjects are considerably smaller when it comes to reading at a “normal” speech level. Therefore, a speech-based level calibration could be performed by reading a few lines of text to a listener involved in a listening test in non-laboratory conditions.
The proposed level calibration method based on “normal” speech level, to be used in non-laboratory test setups, involves a test subject performing a non-laboratory listening test and a second person serving as a live reader. The task of the test subjects would be twofold: (1) after proper instruction, to find and choose a space in their environment that is suitable for performing the listening test, i.e., with typical room acoustic conditions and low background noise, and (2) to find a “normal” talker for the role of the reader, i.e., to exclude any candidates that are obviously too loud or too quiet talkers. The reader would be positioned within the personal space of the subject, e.g., at a conversational distance of 1 m, and they would need to read a sample of text prepared by the designer of the experiment. The subject would need to adjust the level of the pre-recorded sample of the same text read by a speaker, i.e., do a purely subjective loudness-matching procedure between the speech read live and the pre-recorded sample. This way, the test subjects would have a live reference based on which they would perform the calibration, and the effort they would have to make would be to remember what the live reader sounded like, i.e., they would have to resort only to short-term memory. In research performed in study [
34], it is suggested that the listeners simply set the normal level of speech based on their long-term memory and experience on what that level should be. However, the results of this research do not favor this course of action.
The results of the reading part of the experiment show that the level of speech at a conversational, personal distance of 1 m in an acoustically ordinary room with low background noise averages at 55.3 dBA with the standard deviation of 3.7 dBA. It is reasonable to expect that the proposed calibration method would yield the same average level of reference speech read by a live reader, i.e., 55 dBA.
5. Open Questions for Future Research
At the time of the experiment, the pandemic of COVID-19 was a serious issue to deal with. To obey the epidemiological measures that were in force at the time, thus meeting the hygienic standards and reducing the health risk for the subjects, the authors chose to use a dummy head representing a person the subject listened to and were reading to as the visual stimulus, rather than involving a real person. As the proposed non-laboratory level calibration method involves human-to-human interaction between the reader of a text and the subject involved in a listening test that requires calibration, the behavior of the readers when reading to a real person needs to be examined. Therefore, in the next stages of the research, the reading part of the presented experiment shall be conducted once more with a real person serving as the visual stimulus for the readers. The difference between having a real person vs. a dummy head as a visual stimulus for the reader shall be assessed.
The proposed level calibration method assumes that the subject will need to perform a purely subjective loudness matching between the speech uttered by a live person in the role of the reader and the pre-recorded speech sample as an integral part of the listening test for which the calibration is required. The ability of the listeners to perform such loudness matching of speech needs to be examined as well, with the emphasis on the possible influence of the (mis)match of the gender of the pre-recorded speaker and the live reader and the (mis)match of the read and pre-recorded speech content.
The degree of the level mismatch between headphone and loudspeaker reproduction needs to be examined for conditions specific to this research, i.e., for speech sounds reproduced in acoustically ordinary rooms. To do so, another listening experiment needs to be conducted, in which the listeners are to be asked specifically to match the loudness of speech reproduced over loudspeakers and headphones, instead of simply setting the normal speech level on both reproduction systems, as was conducted here.
Finally, the proposed level calibration method has the potential to provide a reasonably stable calibration level that is unlikely to be achieved simply by listening to a speech sample and adjusting the volume to “normal” speech level. However, the trade-off is the increased complexity of the calibration procedure that requires additional effort from the test subject before the listening test itself has even begun. Therefore, the ability and the willingness of potential test subjects in non-laboratory tests to perform such a calibration procedure needs to be investigated as well.
6. Conclusions
The research described in this paper focused on determining whether speech samples can be used for calibrating the reproduction level in non-laboratory listening test setups, e.g., for home online listening tests.
In the listening part of the conducted experiment, the subjects were asked to set the volume of the sound reproduction system so that the loudness of a reproduced speech sample would feel “normal” to them. The resulting A-weighted level of that speech was collected as the output variable. Groupwise, the only significant difference of 5 dB was found for the change of the sound reproduction system from loudspeakers to headphones, and the subjects were prone to setting a higher reproduction level when using headphones, i.e., 50 dBA on average on loudspeakers vs. 55 dBA on headphones. On the other hand, the (non)-existence of a visual stimulus in the form of an appropriately clothed dummy head acting as the imagined talker did not have a significant influence on the chosen speech level, and neither did the choice of the speaker voice which the subjects listened to. The interaction between these three factors was not found to be meaningful. The examination of the interindividual differences between the subjects revealed that the subjects exhibit an extremely broad range of what they consider to be the “normal” speech level. Consequently, they have the dominant influence on the outcome of this experiment, showing that level calibration using a sample of speech is not a viable solution if the calibration is made simply by adjusting the reproduction level so that the loudness of speech would be perceived as “normal”.
In the reading part of the experiment, the subjects were asked to read a paragraph of text in their “normal” voice. The results reveal that the subjects were considerably more consistent when reading at a “normal” speech level than they were when they needed to set it by listening to a speech sample. Depending on the condition of the visual stimulus, the average reading level ranged from 55 to 58 dBA, and the lowest value was found for the visual stimulus placed within the personal space of the reader. The examination of the interindividual differences reveal that the level at which the subjects read is generally consistent with their self-assessment of the type of talker they are.
No influence has been found of the subjects’ age, gender, possible hearing impairment, and their habits related to listening of music and speech on their perception of “normal” speech level, both while reading and while listening.
Based on these findings, a method of level calibration that involves read speech as a reference calibration sound was proposed for possible use in non-laboratory listening setups. The method involves a live reader placed at conversational distance of 1 m from the test subject. The reader reads a paragraph of prepared text at a normal level of 55 dBA, The test subject performs loudness-matching of read speech with a sample of pre-recorded speech, thus calibrating the level of the pre-recorded speech at 55 dBA, and, consequently, the presentation level for the entire listening test.
Future research needs to address some aspects of the proposed method that were beyond the scope of this paper: (a) the difference, if any, between reading to a live person rather than to a dummy head, (b) the ability of the subjects to perform subjective loudness matching of two speech samples and the possible influence of the (mis)match of speaker voices and/or speech content, (c) the degree of the “6-dB mismatch” between loudspeaker and headphone presentation in conditions specific to the described application, and (d) the response of the potential test subjects to the increased complexity of the proposed method of calibration.
Author Contributions
Conceptualization, D.K., M.H. and K.J.; methodology, D.K., M.H. and K.J.; software, D.K. and P.F.; validation, M.H. and K.J.; formal analysis, D.K. and M.H.; investigation, D.K.; resources, M.H.; data curation, D.K. and P.F.; writing—original draft preparation, D.K.; writing—review and editing, M.H. and K.J; visualization, D.K. and M.H.; supervision, M.H.; project administration, M.H.; funding acquisition, M.H. All authors have read and agreed to the published version of the manuscript.
Funding
This research was funded by the Croatian Science Foundation through its DOK-01-2018-ESF program, grant number 2018/8777. The APC was funded by the University of Zagreb, Faculty of Electrical Engineering and Computing.
Institutional Review Board Statement
The study was conducted in accordance with the Declaration of Helsinki and the Ethical Code of the University of Zagreb and approved by the Ethics Committee of the Faculty of Electrical Engineering and Computing (protocol code EP-10-21, approved on 1 October 2021).
Informed Consent Statement
Informed consent was obtained from all subjects involved in the study.
Data Availability Statement
The raw data collected for the purpose of this study are available on request from the corresponding author. Even though the data are anonymous, it was not made publicly available to maintain the confidentiality and protect the privacy of the participants as a group.
Conflicts of Interest
The authors declare no conflict of interest. The funders had no role in the design of the study; in the collection, analyses, or interpretation of data; in the writing of the manuscript, or in the decision to publish the results.
References
- European Centre for Disease Prevention and Control. COVID-19. Available online: https://www.ecdc.europa.eu/en/covid-19-pandemic (accessed on 15 May 2022).
- World Health Organization. Coronavirus Disease (COVID-19) Pandemic. Available online: https://www.who.int/emergencies/diseases/novel-coronavirus-2019 (accessed on 15 May 2022).
- Acoucou–Acoustic Courseware. Available online: https://acoucou.org/ (accessed on 10 June 2022).
- Jaruszewska, K.; Baranski, F.; Piotrowska, M.; Melon, M.; Dazel, O.; Vorländer, M.; Aspöck, L.; Horvat, M.; Jambrošić, K.; Rychtáriková, M.; et al. ACOUCOU Platform to Acquire Professional Skills and Knowledge in the Field of Acoustics. In Proceedings of the 23rd International Congress on Acoustics, Aachen, Germany, 9–13 September 2019. [Google Scholar]
- Henninger, F.; Shevchenko, Y.; Mertens, U.K.; Kieslich, P.; Hilbig, B. lab.js: A free, open, online study builder. Behav. Res. 2022, 54, 556–573. [Google Scholar] [CrossRef] [PubMed]
- Gureckis, T.M.; Martin, J.; McDonnell, J.; Rich, A.S.; Markant, D.; Coenen, A.; Halpern, D.; Hamrick, J.B.; Chan, P. psiTurk: An open-source framework for conducting replicable behavioral experiments online. Behav. Res. 2016, 48, 829–842. [Google Scholar] [CrossRef] [PubMed] [Green Version]
- Keller, F.; Gunasekharan, S.; Mayo, N.; Corley, M. Timing accuracy of Web experiments: A case study using the WebExp software package. Behav. Res. Methods 2009, 41, 1–12. [Google Scholar] [CrossRef] [Green Version]
- de Leeuw, J.R. jsPsych: A JavaScript library for creating behavioral experiments in a Web browser. Behav. Res. 2015, 47, 1–12. [Google Scholar] [CrossRef]
- Chen, T.; Myers, J. Worldlikeness: A Web crowdsourcing platform for typological psycholinguistics. Linguist. Vanguard 2021, 7 (Suppl. 1), 20190011. [Google Scholar] [CrossRef]
- Anwyl-Irvine, A.L.; Massonnié, J.; Flitton, A.; Flitton, A.; Kirkham, N.; Evershed, J.K. Gorilla in our midst: An online behavioral experiment builder. Behav. Res. 2020, 52, 388–407. [Google Scholar] [CrossRef] [Green Version]
- Pedersen, T.H.; Antunes, S.; Rasmussen, B. Online listening tests on sound insulation of walls: A feasibility study. In Proceedings of the Euronoise 2012, Prague, Czech Republic, 10–13 June 2012. [Google Scholar]
- Ondáš, S.; Kiktová, E.; Pleva, M.; Oravcová, M.; Hudák, L.; Juhár, J.; Zimmermann, J. Pediatric Speech Audiometry Web Application for Hearing Detection in the Home Environment. Electronics 2020, 9, 994. [Google Scholar] [CrossRef]
- Kiktová, E.; Zimmermann, J.; Ondáš, S.; Pleva, M.; Juhár, J.; Šoltésová, V. The Role of Hearing Screening Using an Audiometry Application in the Education of Children with Hearing Impairment. In Proceedings of the 2020 18th International Conference on Emerging eLearning Technologies and Applications (ICETA), Košice, Slovakia, 12–13 November 2020. [Google Scholar] [CrossRef]
- Seow, T.X.F.; Hauser, T.U. Reliability of web-based affective auditory stimulus presentation. Behav. Res. 2022, 54, 378–392. [Google Scholar] [CrossRef]
- Clifford, S.; Jerit, J. Is There a Cost to Convenience? An Experimental Comparison of Data Quality in Laboratory and Online Studies. J. Exp. Political Sci. 2014, 1, 120–131. [Google Scholar] [CrossRef] [Green Version]
- Rodd, J. How to maintain data quality when you can’t see your participants. APS Obs. 2019, 32, 34–37. Available online: https://www.psychologicalscience.org/observer/how-to-maintain-data-quality-when-you-cant-see-your-participants (accessed on 15 May 2022).
- Beranek, L.L. Acoustic Measurements; John Wiley & Sons: New York, NY, USA, 1949. [Google Scholar]
- Munson, W.A.; Wiener, F.M. In search of the missing 6 dB. J. Acoust. Soc. Am. 1952, 24, 498–501. [Google Scholar] [CrossRef]
- Robinson, D.W.; Dadson, R.W. A re-determination of the equal-loudness relations for pure tones. Br. J. Appl. Phys. 1956, 7, 166. [Google Scholar] [CrossRef]
- Theile, G. On the standardization of the frequency response of high-quality studio headphones. J. Audio Eng. Soc. 1986, 34, 956–969. [Google Scholar]
- Denk, F.; Kohnen, M.; Llorca-Bofi, J.; Vorländer, M.; Kollmeier, B. The “Missing 6 dB” Revisited: Influence of Room Acoustics and Binaural Parameters on the Loudness Mismatch Between Headphones and Loudspeakers. Front. Psychol. 2021, 12, 976. [Google Scholar] [CrossRef] [PubMed]
- Kohnen, M.; Denk, F.; Llorca-Bofi, J.; Vorländer, M.; Kollmeier, B. Loudness in different rooms versus headphone reproduction: Is there a mismatch even after careful equalization. In Proceedings of the 23rd International Congress on Acoustics, Aachen, Germany, 9–13 September 2019. [Google Scholar]
- Völk, F.; Fastl, H. Locating the missing 6 dB by loudness calibration of binaural synthesis. In Proceedings of the 131st AES Convention (Convention Paper 8488), New York, NY, USA, 20–23 October 2011. [Google Scholar]
- Brinkmann, F.; Lindau, A.; Weinzierl, S. On the authenticity of individual dynamic binaural synthesis. J. Acoust. Soc. Am. 2017, 142, 1784–1795. [Google Scholar] [CrossRef] [Green Version]
- Dash, I.; Bassett, M.; Cabrera, D. Relative importance of speech and nonspeech components in program loudness assessment. In Proceedings of the 128th AES Convention (Convention Paper 8043), London, UK, 22–25 May 2010. [Google Scholar]
- Dash, I.; Mossman, M.; Cabrera, D. The relative importance of speech and nonspeech components for preferred listening levels. In Proceedings of the 132nd AES Convention (Convention Paper 8614), Budapest, Hungary, 26–29 April 2012. [Google Scholar]
- Pearsons, K.S.; Bennett, R.L.; Fidell, S. Speech Levels in Various Noise Environments; US Environmental Protection Agency, Office of Health and Ecological Effects, Office of Research and Development: Washington, DC, USA, 1977. [Google Scholar]
- Sato, H.; Sato, H.; Morimoto, M.; Ota, R. Acceptable range of speech level for both young and aged listeners in reverberant and quiet sound fields. J. Acoust. Soc. Am. 2007, 122, 1616–1623. [Google Scholar] [CrossRef] [PubMed] [Green Version]
- Sato, H.; Morimoto, M.; Ota, R. Acceptable range of speech level in noisy sound fields for young adults and elderly persons. J. Acoust. Soc. Am. 2011, 130, 1411–1419. [Google Scholar] [CrossRef] [Green Version]
- Weisser, A.; Buchholz, J.M. Conversational speech levels and signal-to-noise ratios in realistic acoustic conditions. J. Acoust. Soc. Am. 2019, 145, 349–360. [Google Scholar] [CrossRef]
- Kobayashi, M.; Morimoto, M.; Sato, H.; Sato, H. Optimum speech level to minimize listening difficulty in public spaces. J. Acoust. Soc. Am. 2007, 121, 251–256. [Google Scholar] [CrossRef]
- Rennies, J.; Schepker, H.; Holube, I.; Kollmeier, B. Listening effort and speech intelligibility in listening situations affected by noise and reverberation. J. Acoust. Soc. Am. 2014, 136, 2642–2653. [Google Scholar] [CrossRef]
- Lombard, E. Le signe de l’elevation de la voix (The sign of the elevation of the voice). Ann. Mal. L’Oreille Larynx 1911, 37, 101–119. [Google Scholar]
- Kritly, L.; Basecq, V.; Glorieux, C.; Rychtáriková, M. Challenges on level calibration of online listening test: A proposed subjective method. In Proceedings of the Euronoise 2021, Madeira, Portugal, 25–27 October 2021. [Google Scholar]
- Max MSP. Available online: https://cycling74.com/products/max (accessed on 10 June 2022).
- Malachy, R.; Ward, N.; Sazdov, R. Considerations when calibrating program material stimuli using LUFS. In Proceedings of the 140th AES Convention (Convention e-Brief 245), Paris, France, 4–7 June 2016. [Google Scholar]
- Hall, E.T. The Hidden Dimension; Anchor Books: New York, NY, USA, 1966. [Google Scholar]
- R Core Team. R: A Language and Environment for Statistical Computing; R Foundation for Statistical Computing: Vienna, Austria, 2021; Available online: https://www.R-project.org/ (accessed on 10 June 2022).
- Lakens, D.; Caldwell, A. Simulation-Based Power Analysis for Factorial Analysis of Variance Designs. Adv. Meth. Pract. Psychol. Sci. 2021, 4, 251524592095150. [Google Scholar] [CrossRef]
Figure 1.
Two positions of the visual stimulus in the experiment; left: within the personal space of the subject (at 85 cm); right: within the social space of the subject (at 280 cm).
Figure 1.
Two positions of the visual stimulus in the experiment; left: within the personal space of the subject (at 85 cm); right: within the social space of the subject (at 280 cm).
Figure 2.
The histogram of the difference of the set A-weighted level of speech listened over headphones and loudspeakers.
Figure 2.
The histogram of the difference of the set A-weighted level of speech listened over headphones and loudspeakers.
Figure 3.
The range of observations provided by each subject for the A-weighted level of speech in the listening part of the experiment.
Figure 3.
The range of observations provided by each subject for the A-weighted level of speech in the listening part of the experiment.
Figure 4.
The range of observations provided by each subject for the A-weighted level of speech in the reading part of the experiment.
Figure 4.
The range of observations provided by each subject for the A-weighted level of speech in the reading part of the experiment.
Table 1.
The levels of the three factors investigated in the listening part of the experiment: Sound reproduction system (loudspeakers or headphones), visual stimulus (none present, dummy head close to the listener, dummy head far from the listener), and speaker voice (four different voices), yielding 24 different experimental conditions the subjects experienced during listening.
| Sound Reproduction System | Visual Stimulus | Speaker Voice |
|---|
| Loudspeakers | None | Voice 1 |
| Voice 2 |
| Voice 3 |
| Voice 4 |
| Close: dummy head at 85 cm | Voice 1 |
| Voice 2 |
| Voice 3 |
| Voice 4 |
| Far: dummy head at 280 cm | Voice 1 |
| Voice 2 |
| Voice 3 |
| Voice 4 |
| Headphones | None present | Voice 1 |
| Voice 2 |
| Voice 3 |
| Voice 4 |
| Close: dummy head at 85 cm | Voice 1 |
| Voice 2 |
| Voice 3 |
| Voice 4 |
| Far: dummy head at 280 cm | Voice 1 |
| Voice 2 |
| Voice 3 |
| Voice 4 |
Table 2.
The levels of the visual stimulus (none present, dummy head close to the reader, dummy head far from the reader) as the only factor investigated in the reading part of the experiment, yielding three different experimental conditions the subjects experienced during reading.
Table 2.
The levels of the visual stimulus (none present, dummy head close to the reader, dummy head far from the reader) as the only factor investigated in the reading part of the experiment, yielding three different experimental conditions the subjects experienced during reading.
| Visual Stimulus |
|---|
| None |
| Close: dummy head at 85 cm |
| Far: dummy head at 280 cm |
Table 3.
The three-way ANOVA output table with effect size reported with η2 and the results of the power analysis added to the rightmost column.
Table 3.
The three-way ANOVA output table with effect size reported with η2 and the results of the power analysis added to the rightmost column.
| Effect/Interaction | dFn | dFd | F | p | η2 | Power |
|---|
| Sound reproduction system | 1.00 | 34.00 | 69.556 | <0.001 * | 0.117 | 1.000 |
| Visual stimulus | 1.55 | 52.76 | 2.616 | 0.095 | 0.008 | 0.646 |
| Speaker voice | 3.00 | 102.00 | 36.646 | <0.001 * | 0.010 | 0.770 |
| System/visual | 1.53 | 52.14 | 1.596 | 0.215 | <0.001 | 0.045 |
| System/voice | 3.00 | 102.00 | 1.623 | 0.189 | <0.001 | 0.008 |
| Visual/voice | 4.34 | 147.42 | 2.063 | 0.083 | <0.001 | 0.011 |
| System/visual/voice | 6.00 | 204.00 | 2.153 | 0.049 * | <0.001 | 0.010 |
Table 4.
Marginal means and standard deviations of the groups at two different levels of the sound reproduction system in the listening part of the experiment.
Table 4.
Marginal means and standard deviations of the groups at two different levels of the sound reproduction system in the listening part of the experiment.
| Sound Reproduction System | Loudspeakers | Headphones |
|---|
| Mean A-weighted level (dBA) | 49.9 | 55.0 |
| Standard deviation (dB) | 6.4 | 7.7 |
Table 5.
Marginal means and standard deviations of the groups at three different levels of the visual stimulus in the listening part of the experiment.
Table 5.
Marginal means and standard deviations of the groups at three different levels of the visual stimulus in the listening part of the experiment.
| Visual Stimulus | No Visual Stimulus | Dummy Head at 85 cm | Dummy Head at 280 cm |
|---|
| Mean A-weighted level (dBA) | 53.0 | 52.9 | 51.6 |
| Standard deviation (dB) | 7.4 | 7.4 | 7.8 |
Table 6.
Marginal means and standard deviations of the groups at four different levels of speaker voice in the listening part of the experiment.
Table 6.
Marginal means and standard deviations of the groups at four different levels of speaker voice in the listening part of the experiment.
| Speaker Voice | Voice 1 | Voice 2 | Voice 2 | Voice 4 |
|---|
| Mean A-weighted level (dBA) | 51.9 | 52.5 | 53.7 | 52.0 |
| Standard deviation (dB) | 7.6 | 7.4 | 7.6 | 7.4 |
Table 7.
The one-way ANOVA output table with effect size reported with η2 and the results of the power analysis added to the rightmost column.
Table 7.
The one-way ANOVA output table with effect size reported with η2 and the results of the power analysis added to the rightmost column.
| Effect | dFn | dFd | F | p | η2 | Power |
|---|
| Visual stimulus | 1.43 | 47.07 | 30.000 | <0.001 * | 0.098 | 0.984 |
Table 8.
Marginal means and standard deviations of the groups at three different levels of the visual stimulus in the reading part of the experiment.
Table 8.
Marginal means and standard deviations of the groups at three different levels of the visual stimulus in the reading part of the experiment.
| Visual Stimulus | No Visual Stimulus | Dummy Head at 85 cm | Dummy Head at 280 cm |
|---|
| Mean A-weighted level (dBA) | 56.8 | 55.2 | 58.1 |
| Standard deviation (dB) | 3.1 | 3.7 | 4.2 |
| Publisher’s Note: MDPI stays neutral with regard to jurisdictional claims in published maps and institutional affiliations. |
© 2022 by the authors. Licensee MDPI, Basel, Switzerland. This article is an open access article distributed under the terms and conditions of the Creative Commons Attribution (CC BY) license (https://creativecommons.org/licenses/by/4.0/).


