Abstract
Pulse rate variability (PRV), measured from pulsatile signals such as the photoplethysmogram (PPG), has been largely used in recent years as a surrogate of heart rate variability (HRV), which is measured from electrocardiograms (ECG). However, different studies have shown that PRV does not always replicate HRV as there are multiple factors that could affect their relationship, such as respiration and pulse transit time. In this study, an in-vitro model was developed for the simulation of the upper-circulatory system, and PPG signals were acquired from it when haemodynamic changes were induced. PRV was obtained from these signals and time-domain, frequency-domain and non-linear indices were extracted. Factorial analyses were performed to understand the effects of changing blood pressure and flow on PRV indices in the absence of HRV. Results showed that PRV indices are affected by these haemodynamic changes and that these may explain some of the differences between HRV and PRV. Future studies should aim to replicate these results in healthy volunteers and patients, as well as to include the HRV information in the in-vitro model for a more profound understanding of these differences.
1. Introduction
Pulse rate variability (PRV) describes the changes in pulse rate through time, when it is measured from pulse wave signals such as the photoplethysmogram (PPG) [1,2]. PRV has been used as a surrogate of heart rate variability (HRV) and applied for the diagnosis and monitoring of several diseases [2], including the assessment of cardiovascular variables, such as blood pressure [3]. However, previous studies have shown that, although HRV and PRV show similar trends, they should not be considered to be the same, since the former tends to overestimate some of these indices, especially under haemodynamic changes, which have an effect on these differences [4,5,6]. It has been even suggested that PRV shows differences according to the site of measurement, implying that different processes affect this information in a more local way [7].
In an attempt to understand the differences between HRV and PRV, Constant et al. evaluated how PRV changed in children with pacemakers set to a fixed heart rate [8]. They observed that PRV was present even in the absence of HRV and concluded that the differences between PRV and HRV arise from respiratory patterns and Pulse Transit Time (PTT). In 2014, Pellegrino et al. aimed to understand the relationship between PRV and HRV in rabbits during ventricular pacing to drive HRV to zero, and cardiac autonomic blockade, using atropine (cardiovagal blockade), metoprolol (sympathetic blockade) and both drugs (dual blockade) to understand the autonomic substrates of HRV and PRV [9]. Their results showed that: (a) PRV remained non-negligible even during ventricular pacing when HRV was almost completely eliminated, and HRV and PRV behaviour was not related in this scenario; (b) time-domain indices showed strong correlations between HRV and PRV during cardiac autonomic blockade; (c) LF and HF indices showed a relatively good agreement between HRV and PRV during the cardiac autonomic blockade, but with a consistent overestimation of HF and TP values, while normalised indices and LF/HF showed very poor accuracy and precision, especially during atropine and dual blockade and most likely because of the intrinsic PRV when HRV is decreased; and (d) non-linear measures, especially those based on entropy analysis, showed poor agreement and low correlation between HRV and PRV during any of the conditions of the autonomic blockade. Although they did not obtain PRV from human PPG signals, but from an invasive arterial pressure sensor placed into the abdominal aorta of rabbits, their results showed that PRV contains different information that may explain its differences from HRV, and they hypothesised that these differences must come from changes in pre-ejection time (PET), i.e., the time after ventricular depolarisation and before the opening of the aortic valve and which is a function of contractility, preload and afterload, or in PTT, which changes due to pulse pressure and arterial elasticity.
Since both HRV and PRV relate to the changes in the duration of cardiac cycles but are measured using signals with different origins [1], there is an intrinsic difficulty in isolating PRV to understand how it is affected by physiological changes and explain the origin of the differences between HRV and PRV using data obtained from in-vivo studies. In recent years, the use of in-vitro models for the simulation of the circulatory system has gained attention, especially since it allows for the investigation of a specific process in the absence of many uncontrolled and confounding variables that are simultaneously occurring in the living human body [10]. Hence, in this study, the development of an in-vitro setup for the simulation of the upper-body circulatory system was proposed, from which PPG signals can be acquired while blood pressure and flow are modified by changing the stroke rate of a commercial pump that replicates the activity of the heart, but without the effects of autonomic modulation, i.e., in the absence of HRV. Moreover, and since the respiratory system is not modelled in this first study, the effects of respiration are also not present. This allows for the investigation of the effects of changing only cardiovascular parameters on PRV assessed from the obtained PPG signals. It was hypothesised that PRV indices would be present even in the absence of HRV changes and that they are affected both by blood pressure and blood flow changes. From the obtained results, it can be concluded that PRV was affected by haemodynamic changes in this in-vitro setup, and, although care should be taken with the measured indices when the pressure in the system was very low and hence the quality of the signal was lower, most PRV indices were shown to be affected by both target flow and stroke rate changes, and by their interaction.
2. Materials and Methods
2.1. In-Vitro Setup
An in-vitro setup was built for the simulation of the upper-body circulatory system, which includes the heart, the arteries and the venous return, as well as the simulation of tissue for the acquisition of optical signals from this setup, including the use of artificial blood and the simulation of skin layers in the points of PPG measurement.
2.1.1. Upper-Body Circulatory Rig
Figure 1 shows the diagram of the designed rig that simulates the upper-body circulatory system. This consisted of a commercial pulsatile pump (PD-1100, BDC Laboratories, Wheat Ridge, CO, USA) that replicates heart activity; silicon tubes with varying diameters and wall thicknesses that simulate arterial segments and venous return; and a tank that mimicked the venous blood reservoir. Table 1 summarises the characteristics of arterial and venous segments replicated in this setup, which were selected according to average human vessel sizes reported in the literature [11,12,13,14]. It is important to mention that, as stated by the manufacturer, the PD-1100 pump features a closed-loop control that provided superior beat-to-beat repeatability during operation, making it unlike that there are changes in the duration of the stroke from beat-to-beat.
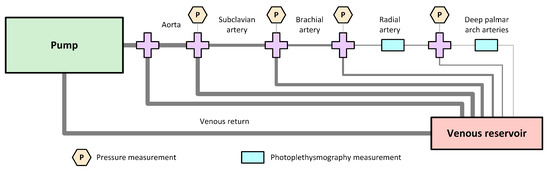
Figure 1.
Diagram of the designed rig for the simulation of the upper-body circulatory system, which consists of a commercial pump that replicates the heart activity; aorta, subclavian, brachial, radial and deep-palmar arch arterial segments; a venous reservoir; and a single vein replicating the venous return. Pressure sensors were placed to measure the pressure of the fluid flowing through the system, and silicon, custom-made phantoms were used for the placement of photoplethysmography (PPG) sensors.

Table 1.
Characteristics of arterial and venous segments replicated on the in-vitro setup.
2.1.2. Radial and Deep Palmar Arch Phantoms
Since the aim of this study was to acquire and analyse PRV information obtained from PPG signals from this in-vitro model, two independent tissue phantoms were used to simulate the points of measurement of these PPG signals. The inclusion of the phantoms allowed for a better positioning of PPG sensors and a more accurate replication of tissue surrounding the arteries.
Figure 2 illustrates the design of the built phantoms. In both cases, the phantoms consisted of a clear, hollow cuboid with a length of L = 60 mm, a width of 15 mm, height of H = 5 mm, and wall thickness of T = 1.5 mm. These cuboids were 3D printed using clear resin (Formlabs, Somerville, MA, USA) and filled with clear polydimethylsiloxane (PDMS) with 3% catalyst, which has been shown to replicate mechanical properties of skin [15], and a single custom-made tube was passed through each of the phantoms, to replicate the radial and deep-palmar arch arteries. In the case of the radial artery, this was located closer to the edge of the phantom, since the radial artery is relatively superficial in the wrist. Hence, for the radial phantom. On the contrary, and since the deep palmar arch phantom was replicating a finger, the vessel passing through this phantom was located approximately in the vertical centre of the cuboid, with . In both cases, the inner diameters and had the values selected and shown in Table 1. The vessels used for the simulation of these arterial segments were custom-made following the methodology proposed by Nomoni et al. [15,16].
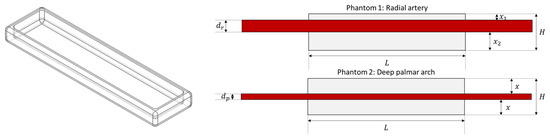
Figure 2.
Design of phantoms for replicating tissue and positioning photoplethysmographic sensors.
2.1.3. Artificial Blood
In order to be able to acquire PPG signals from this in-vitro system, it was necessary to produce a fluid that simulated some of the optical properties of blood. This was done using deioinized water, Indian ink, phosphate-buffered saline (PBS) and a cyan die (Epson 102 cyan ink, Epson, Suwa, Japan). The amount of each of these components were determined according to the volume of Indian ink, , as
This recipe was based on the work presented by Akl et al. [17].
The optical spectrum of this fluid was verified using a UV/VIS/NIR spectrophotometer (Lambda 1050, PerkinElmer, Waltham, MA, USA), with which the absorbance of the fluid at different wavelengths was assessed. This artificial blood was expected to have a green/blue colour which would increase the absorbance in red and infrared regions of light.
2.1.4. Pressure and Photoplethysmography Measurements
As illustrated in Figure 1, several pressure measurements were obtained in the system. Pressure sensors (PRESS-S-000, PendoTECH, Princeton, NJ, USA) were connected to the tubing via plastic Luer connectors. The readings of these pressure sensors were acquired using a data acquisition card (NI cDAQ-9178, National Instruments, Austin, TX, USA) connected to a computer in which a LabVIEW (National Instruments, Austin, TX, USA) Virtual Instrument (VI) was running.
Simultaneously, two modified commercial neonatal PPG probes (Solaris Medical Technology Inc., San Francisco, CA, USA)were placed on the developed phantoms and connected to a ZenPPG, a dual-wavelength, dual-channel research PPG acquisition and processing system developed in the Research Centre for Biomedical Engineering at City, University of London [18,19]. The PPG signals were also acquired using a data acquisition card (NI USB-6162, National Instruments, Austin, TX, USA) and the same LabVIEW VI. In this VI, signals were acquired, visualised and stored for offline processing, while it was also used to set the currents going through the red and infrared LEDs in the commercial PPG probes to a value of around 30 mA.
2.1.5. Setup Validation
Cardiac output has a direct relationship with stroke rate (SR) and stroke volume (SV), since it can be estimated as
SV refers to the volume of blood ejected from the ventricle with each heartbeat and depends on the difference between end-diastolic (EDV) and end-systolic volumes (ESV). SV decreases as heart rate increases due to shortening of diastolic filling time [20].
Moreover, blood pressure (BP) can be defined as the ratio between CO and the compliance (C) of the system, i.e.,
hence it can be described in terms of SR and SV, and is expected to increase if CO increases.
Therefore, the behaviour of the in-vitro setup was assessed by changing the SR and target flow (TF) of the pump, which changes SV. Modifying these two variables, changes in Q were controlled and the pressure was modified. SR was changed from 60 beats per minute (bpm) to 180 bpm in steps of 30 bpm, while TF was changed from 1 L/min to 5 L/min, in steps of 0.5 L/min. The mean pressure at each measuring location was assessed to evaluate the changes in BP as SR and TF were modified, while heart rate (HR) was measured from both pressure and PPG signals. Finally, SV values were assessed by extracting the maximum value of the pattern used to drive the pump. The pattern used was the built-in pattern recommended by the pump manufacturer.
2.2. Experimental Protocol
Since the main aim of this study was to determine the relationship between PRV and haemodynamic changes in the absence of HRV, an experiment was carried out to evaluate the effects of changing stroke rate and target flow on PRV indices. Stroke rates were changed from 60 to 180 bpm with 30 bpm steps, while target flow was increased from 1 to 5 L/min, in steps of 0.5 L/min. This resulted in a total of 45 combinations. Target flow was kept stable until data with all stroke rates were acquired, and then target flow was increased. 10-min of data was acquired from each combination of factors, and this was repeated two times.
As was mentioned previously, a LabVIEW VI was employed to acquire PPG and pressure signals. A sampling rate of 2 kHz was used for acquiring data. Pressure measurements were taken from the aortic, subclavian, brachial, radial and deep palmar arch (DPA) arterial segments, while PPG signals were obtained from the phantoms located at the radial and DPA vessels.
Before acquiring the data, the baseline values of pressure measurements without any pumping activity were acquired to obtain the offset of each of the pressure sensors, which were then used to convert this data from voltage units to pressure units (mmHg), considering a sensitivity of 199088.64 mmHg/V for the pressure sensors.
2.3. Data Processing
The acquired signals were processed offline using MATLAB® (version 2020a). Initially, pressure signals were converted from voltage to millimetres of mercury (mmHg), as explained above. Then, both PPG and pressure signals were resampled to 256 Hz using linear interpolation, and filtered using a second order, low pass Butterworth filter, with a cutoff frequency of 20 Hz.
Only red PPG signals were used for further analysis in this study. These were segmented into 5 min portions, with a stride of 30 s between consecutive segments. Then, interbeat intervals (IBIs) were identified using D2Max [21] and corrected according to their length, as explained in [22]. The a fiducial point was used to extract PRV trends and time-domain, frequency-domain and nonlinear indices were obtained from them. From the time-domain, the average duration of IBIs (AVNN), their standard deviation (SDNN), the root-mean-square value of the successive differences (RMSSD), the number of successive differences with a duration longer than 50 ms (NN50) and the proportion of successive differences longer than 50 ms (pNN50) were extracted.
PRV trends were interpolated using cubic spline interpolation and resampled to 4 Hz, and a fast Fourier transform was used to obtain frequency spectra. From these, frequency-domain indices were obtained. The absolute power of the very low frequency (frequencies below 0.04 Hz, VLF), low frequency (frequencies between 0.04 and 0.15 Hz, LF), and high frequency (frequencies between 0.15 and 0.4 Hz, HF) bands, as well as the total power of the spectra between 0.0033 and 0.4 Hz (TP), were obtained. Relative powers of the LF and HF band (nLF and nHF, respectively) and the ratio between LF and HF (LF/HF) were also measured. In addition, the centroids of the LF and HF bands, and from the whole spectra were obtained, and their x- and y-coordinates were extracted (, , , , , ). Finally, the spectral entropy (SpEn) was extracted from the obtained frequency-domain representation of PRV trends.
Non-linear indices were also extracted. From the 1-lag Poincaré plot, the area of the ellipse (S) and its major and minor axes (SD2 and SD1, respectively), the ratio between axes (SD1/SD2) and a measurement of the compaction of the points in the ellipse (COM) were obtained. From detrended fluctuation analysis, (A1) and (A2) were obtained. Finally, entropy-related indices were also measured. These were the basic-scale entropy (BSE), sign-series entropy (SSE), approximate entropy (ApEn), sample entropy (SampEn) and multi-scale entropy using SampEn as base function (MSE).
2.4. Statistical Analysis
A factorial analysis was performed to assess if changing SR (factor A) and TF (factor B) had an effect on PRV indices. A diagram of this analysis is shown in Figure A3. This was done to evaluate if these changes had a significant impact on PRV, even in the absence of HRV. Since data did not follow a normal distribution, as was verified by the Lilliefors test, Box-Cox transformations were applied by finding the optimal lambda for each index. In all cases, a level of significance of 5% was considered. Post-hoc comparisons using Tukey’s test were applied in the cases in which either A, B or their interaction A × B showed statistically significant differences in the factorial analyses.
3. Results
3.1. In-Vitro Setup Validation
Figure 3 shows the constructed rig to simulate part of the upper-body circulatory system. As explained, this system included a commercial pulsatile pump that replicates the heart activity. This pump can follow different patterns for generating each cardiac cycle. In this study, the built-in pattern was used, which changes the stroke volume according to the SR and TF. Greater stroke volumes could be obtained by decreasing SR and increasing TF.
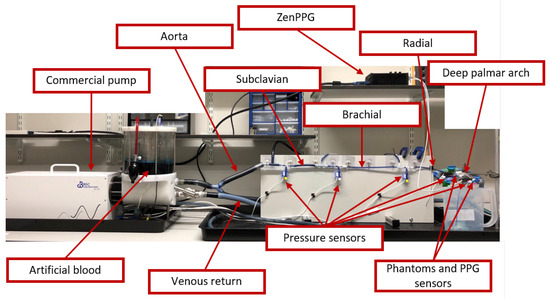
Figure 3.
Constructed rig for the in-vitro experiment. This consisted of a commercial pump that replicates heart activity, tubing that mimics arteries and veins from the upper-body circulatory system, and a fluid that has similar optical properties as blood. Pressure sensors and photoplethysmographic (PPG) probes were used to measure the pressure in the tubes and the optical pulsatile signals from two developed tissue phantoms, that model the skin. PPG signals were acquired and processed using a custom-made system (ZenPPG) while pressure information was acquired directly from a data acquisition card.
In order to acquire optical signals such as the PPG, it was necessary to develop a fluid that replicates the optical behaviour of blood, which is referred to as artificial blood in Figure 3. Figure A1 in the Appendix A shows the absorbance spectra obtained when the developed fluid was tested using the spectrophotometer. It can be observed that the artificial blood had a peak absorbance at around 610 nm, replicating part of the optical behaviour of real blood. Since the maximum absorbance was observed at this wavelength, the subsequent analysis with PPG signals and PRV information was performed using only this wavelength.
A validation of this setup was performed to assess if the measured pressure was affected by changes in SR and TF, and if the correct SR was measured from the acquired optical signals. Figure A2 in theAppendix A exemplifies the signals acquired from the rig using an SR of 60 bpm and a TF of 3 L/min, while Figure 4 and Figure 5 show the behaviour of pressure measurements and pulse rate measurement, respectively, as SR and TF were modified. As can be observed, the measured pressure signals feature good quality and follow the expected behaviour, i.e., the pressure increased as the target flow increased at the same stroke rate, while it decreased when the stroke rate was increased. Also, it can be observed that the pressure measured in the aorta was greater than in the rest of the locations and became lower in the subclavian segment. Then, it started increasing slightly due to the smaller area and increased resistance in the subsequent arterial segments. From the PPG signals, it can be observed that the pulse rate can be reliably extracted from the signals, although the measurement became less reliable with lower stroke volumes, i.e. higher stroke rates and lower target flows.
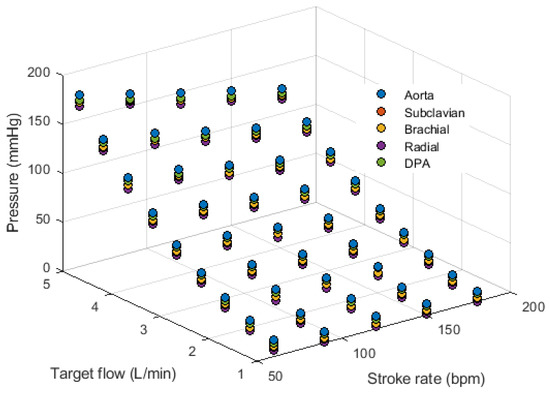
Figure 4.
Behaviour of mean pressure measured from the aorta, subclavian, brachial, radial and deep palmar arch (DPA) locations while changing stroke rate and target flow.
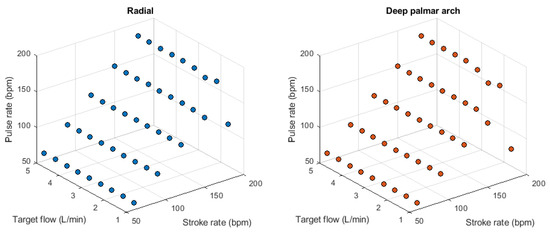
Figure 5.
Behaviour of pulse rate measured from the radial (left) and deep palmar arch (right) phantoms using photoplethysmographic sensors while changing stroke rate and target flow.
3.2. Photoplethysmography and Pulse Rate Variability Measurements
Figure 6 exemplifies the PPG signals measured under different stroke rates and target flows. It can be observed that the quality of the PPG signals decreases as the stroke volume decreases. Figure A4, Figure A5, Figure A6, Figure A7, Figure A8, Figure A9, Figure A10, Figure A11, Figure A12, Figure A13, Figure A14, Figure A15, Figure A16, Figure A17, Figure A18 and Figure A19 in the Appendix C show the mean and standard deviation of PRV indices extracted from each of the PPG signals with each combination of SR and TF.

Figure 6.
Example of photoplethysmographic (PPG) signals acquired from the constructed rig under different stroke rates and target flows.
3.3. Relationship between PRV and Haemodynamic Changes
Factorial analyses were performed to understand the relationship between each of the extracted indices and SR and TF changes. Figure 7 and Figure 8 summarise the effect estimates and significance for each of the factors and their combination when PRV indices were extracted from the radial and DPA phantoms, respectively. All interactions showed statistically significant differences, meaning that changing SR and TF had a statistically significant effect on all PRV indices.

Figure 7.
Effect estimates for stroke rate (SR), target flow (TF) and their interaction on each of the indices extracted from pulse rate variability (PRV) measured from the radial phantom. Red stars on top of the bars indicate statistically significant effects.
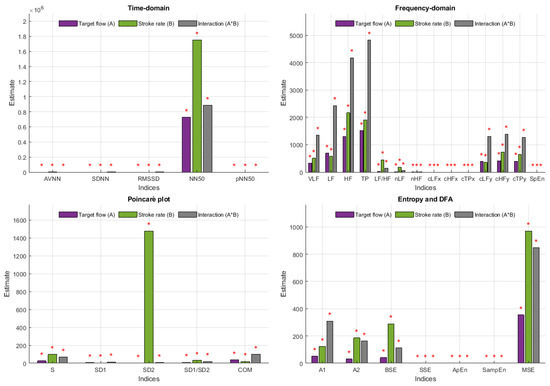
Figure 8.
Effect estimates for stroke rate (SR), target flow (TF) and their interaction on each of the indices extracted from pulse rate variability (PRV) measured from the deep palmar arch phantom. Red stars on top of the bars indicate statistically significant effects.
When measured from the radial phantom, some of the indices were clearly more affected by SR, such as AVNN, NN50 and SD2, in which the estimate for the effect of SR was clearly larger than the estimate for the effect of TF and the interaction. Similarly, some indices had larger estimates for TF, such as SDNN, RMSSD, COM, absolute frequency domain indices, and y-coordinate centroid-related indices. A1 is the only index measured from this location that had a larger effect estimate for the interaction between the two factors.
In the case of indices extracted from the DPA phantom, this behaviour changes. SD2, AVNN and NN50 continued to have a remarkable larger effect estimate with changes in SR, while the interactions became stronger in this case, with most indices showing larger effects for these than for the independent factors.
Figure 9, Figure 10, Figure 11 and Figure 12 show the post hoc analyses for each of the independent factors. Target flow changes induced statistically significant differences, especially on the time domain, Poincaré plot, DFA and entropy-related indices, both for radial and DPA measured PRV, while relative and centroid-related frequency-domain indices were more affected by TF changes when extracted from signals obtained from the radial phantom. The effects of changing SR showed a very similar behaviour regardless of the point of measurement, with significant differences observed among most levels, especially again on time-domain and non-linear indices.

Figure 9.
Post-hoc comparisons for target flow (TF) levels when pulse rate variability indices are measured from the radial phantom. The appearance of a circle indicates a significant difference between the corresponding levels for each of the indices.

Figure 10.
Post-hoc comparisons for target flow (TF) levels when pulse rate variability indices are measured from the deep palmar arch phantom. The appearance of a circle indicates a significant difference between the corresponding levels for each of the indices.
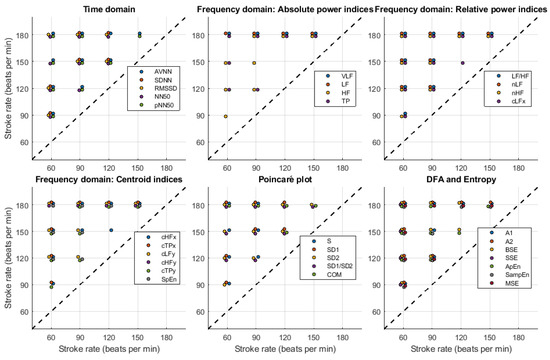
Figure 11.
Post-hoc comparisons for stroke rate (SR) levels when pulse rate variability indices are measured from the radial phantom. The appearance of a circle indicates a significant difference between the corresponding levels for each of the indices.
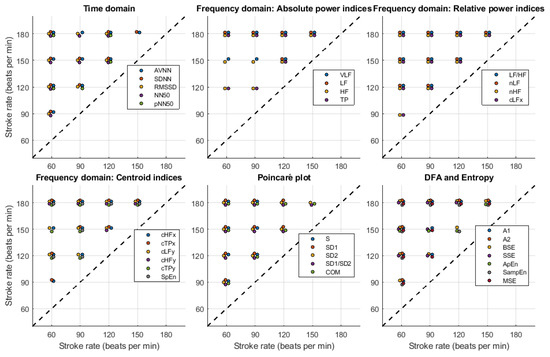
Figure 12.
Post-hoc comparisons for stroke rate (SR) levels when pulse rate variability indices are measured from the deep palmar arch phantom. The appearance of a circle indicates a significant difference between the corresponding levels for each of the indices.
Figure 13 and Figure 14 show the results for the post-hoc analyses of the interactions. Both for radial and DPA PRV indices the results followed the same trend. Time-domain, centroid-related frequency-domain and non-linear indices were largely affected by the changes in target flow and stroke rate, while absolute and relative frequency-domain indices showed less significant differences among possible combinations. There were more significant differences as SR and TF increased.

Figure 13.
Post-hoc comparisons for the interaction between stroke rate (SR) and target flow (TF) when pulse rate variability indices are measured from the radial phantom. The appearance of a circle indicates a significant difference between the corresponding levels for each of the indices.

Figure 14.
Post-hoc comparisons for the interaction between stroke rate (SR) and target flow (TF) when pulse rate variability indices are measured from the deep palmar arch phantom. The appearance of a circle indicates a significant difference between the corresponding levels for each of the indices.
4. Discussion
As has been seen in previous studies, PRV has been shown to be different to HRV [2,3,4,5], even in circumstances in which HRV is reduced or absent [8,9]. However, the origin of these differences is not entirely clear and could be related to respiratory modulation or cardiovascular changes, such as changes in PTT [8,9].
Understanding how much cardiovascular changes, specifically changes in haemodynamics, explain the differences between HRV and PRV is difficult in in-vivo studies. Hence, in this study, the use of an in-vitro setup was proposed to evaluate if, in the absence of HRV in this simplified model, changes in cardiac output generated by changes in stroke rate and stroke volume could affect PRV indices.
4.1. In-Vitro Setup
An in-vitro model was built following anatomical characteristics of the upper-limb circulatory system. This section of the body was chosen since PRV is usually measured from the finger or the wrist, and because blood pressure is usually assessed on the arm, both invasively and non-invasively. Although it is not possible to completely mimic the anatomy and physiology of the circulatory system in an in-vitro model, the length of the arterial segments, the diameter of the vessels and the behaviour of the pulsatile pump were designed and selected to be as similar as possible to the average human being. Also, the artificial blood used was shown to have an optical response partly similar to the optical spectrum of blood. Hence, optical signals can be acquired using the proposed artificial blood recipe, with better performance for red wavelengths, where the absorbance peak is at its maximum.
The behaviour of the system was validated by measuring pressure signals at each arterial segment, PPG signals at the radial and deep palmar arch segments, and by altering stroke rate, target flow, and hence stroke volume. It was observed that the system behaved as expected. From the PPG signals, it was possible to determine stroke rate reliably, although the signals became noisier as the stroke volume was decreased, lowering the signal-to-noise ratio in these signals and making it harder to properly determine stroke rate. From the pressure signals, the expected performance was observed: As stroke volume increased, pressure increased in all measurement sites. Also, there were differences in the magnitudes of the pressure signals that were expected given the differences in resistance to flow due to the different vessel diameters.
As explained by Nomoni et al. [15] and May et al. [10], using this kind of setup has become increasingly useful in the study of PPG signals and light-tissue interaction, since it allows for a dynamic simulation of the circulatory system as well as the investigation of several processes that are difficult to investigate in in-vivo studies due to the large number of uncontrolled variables. Moreover, using these in-vitro setups allows for the investigation of extreme conditions that can be difficult or unethical to simulate in in-vivo circumstances, such as the complete absence of autonomic regulation. To the best of our knowledge, this is the first study that aims to investigate PRV in an in-vitro model in the absence of HRV or any other physiological processes, such as respiration.
4.2. Behaviour of PRV Indices with Haemodynamic Changes
The behaviour of PRV indices extracted from PPG signals acquired from both phantoms is worth analysing. In general, it can be seen that indices extracted from the DPA phantom tended to have larger variabilities, probably due to the lower quality of the signal obtained from this location, which made it harder to accurately determine cardiac cycles.
Specifically from time-domain indices, it can be observed that the measurement of AVNN is generally stable except for the cases in which the amplitude of the signal is too small, such as when SR is 150 and 180 bpm and TF is lower than 2 L/min. SDNN and RMSSD had very similar behaviour, with relatively lower values as TF increases. A similar although not as clear behaviour can be observed from NN50 and pNN50.
In absolute-power frequency-domain indices, the results obtained when SR was 150 and 180 bpm had an important outlier when TF was 1 L/min. Again, this is likely due to the lower quality of the signals at these stroke volumes and care should be taken when analysing the obtained results at these levels. LF, HF, and TP showed similar behaviour, with increased values as TF increased to 3 L/min and then decreased values as TF increased to 5 L/min. Interestingly, it can be observed that there is an important difference in magnitude between VLF, LF and HF, with larger magnitudes in the HF band. This is in line with the results reported by Constant et al. [8], who concluded that this frequency band was more affected by cardiovascular factors such as PTT, even when HRV was dramatically reduced. This can also be observed from nLF and nHF, with most nHF values close to 0.9. However, the trend of increasing and decreasing values as TF increases is not visible in these two indices. Also, as SR increased, LF/HF and nLF tended to decrease with increases in TF, while nHF showed the opposite behaviour. SpEn did not show a clear trend with changes in TF but did show a continuous increase as SR surged.
Centroid-related indices showed similar results when y-coordinates were analysed. Again, there is an important outlier as stroke rate increased and target flow was kept low, but the inverted parabolic behaviour observed when SR is lower is also present in these indices. However, x-coordinates were less affected by changes, meaning that the power of the band tends to be around the same frequencies regardless of stroke volume changes, while the amplitude of the band does vary with haemodynamic changes.
For Poincaré plot indices, and as has been explained in the literature [23], SD1 is expected to behave as RMSSD. This can be seen in the results obtained from Poincaré plot indices, where the behaviour was exactly the same. S, SD1/SD2 and COM also have the same trend with varying magnitudes. And SD2 has a similar behaviour as AVNN, which is also expected [23].
Finally, from the remaining non-linear indices, it can be seen that magnitudes tended to remain relatively stable regardless of changes in stroke rate. A trend is hard to determine from DFA-related indices, while from entropy-related indices, the most visible trend can be observed from SSE, where it increased with rising TF. BSE, ApEn, SampEn and MSE did not show such clear patterns of behaviour.
4.3. Relationship between PRV and Cardiac Output Changes
The main aim of this study was to assess if PRV indices were affected by stroke rate and target flow changes, in the absence of HRV and autonomic regulation. From the factorial analyses, it was observed that all indices measured from both phantoms had statistically significant effects due to the interaction of factors and the factors individually.
From the radial phantom, and similarly to what was observed from the behaviour of PRV indices, AVNN and SD2 had an important effect due to SR. MSE showed also larger estimates due to the effect of SR on its magnitude. In addition to these indices, NN50, S, SD1/SD2, A2 and BSE also showed larger estimates due to the effect of SR than TF or the interaction when measured from the DPA phantom. This might be due to the increased number of outliers and the lower quality of the signal. Also, in concordance with the qualitative observations of the behaviour of the indices, SDNN, RMSSD, pNN50, absolute-power and y-coordinates of centroid-related frequency domain indices, S, SD1, SD1/SD2 and COM showed that TF had the larger effect estimate when measured from the radial phantom. When obtained from the DPA phantom, and again most likely due to the quality of the signal, the greater effect estimates were found on the interaction of both factors.
Regardless of the differences between phantoms and signal qualities obtained, it is remarkable that all indices showed a statistically significant effect due to these heamodynamic changes, meaning that even in the absence of HRV and autonomic regulation, changing stroke rate and target flow affect PRV indices. Given the greater susceptibility of DPA-related indices to noise, the remaining discussion is focused solely on data obtained from the radial phantom.
Post hoc analyses were performed to evaluate the origin of these differences. Only focusing on target flow changes, most differences occurred when comparing lower flows to TF values greater than 2.5 L/min and for time-domain, centroid-related frequency-domain, and non-linear indices. For absolute and relative power indices, the majority of the differences were observed when comparing L/min to the rest of the conditions, but this behaviour might be related to the lower quality of the signal at this level and the presence of outliers on these indices (see Figure A3, Figure A4, Figure A5, Figure A6, Figure A7, Figure A8, Figure A9 and Figure A10). Changes in stroke rate had a significant effect on most indices, especially when SR was increased to 180 bpm. The indices that showed the lower amount of significant comparisons among levels were VLF, LF and COM. Moreover, the interactions showed significant differences in most possible combinations of factors, showing that both SR and TF play an important role in PRV and its regulation even in the absence of HRV.
These results corroborate those reported by Constant et al. [8] and Pellegrino et al. [9], who concluded that PRV is modulated by other aspects different to HRV. Although from these results it is evident that in this in-vitro setup PRV was present and affected by stroke volume changes, further studies should be performed to better understand the origins of the changes in PRV and to try to replicate these results in an in-vivo model. Moreover, these results alongside the development of the in-vitro model could allow for a better understanding of PRV in a controlled manner and its relationship with cardiovascular diseases.
4.4. Limitations of the Study
The main limitation of this study is the restrictions imposed by the in-vitro model. As has been already mentioned, it is not possible to completely simulate the behaviour of the cardiovascular system and the autonomic nervous system in an in-vitro model, limiting the physiological phenomena and anatomical features to be studied [10]. However, having this controlled scenario allowed for understanding how PRV alone would react to haemodynamic changes, and was considered a good first step towards a better understanding of the interaction of PRV and cardiovascular changes. Also, lower quality of signals with decreased stroke volumes may have affected the results obtained, especially when PPG signals were measured from the DPA phantom. However, robust algorithms suggested in the literature [22] were used in an attempt to make the results more precise and it was observed that only very extreme conditions were difficult to analyse.
5. Conclusions
PRV has been shown to be affected by additional aspects different to HRV but it is difficult to isolate PRV from these other variables to understand how it could be affected by changes such as increases or decreases in blood flow and blood pressure. An in-vitro model was designed and implemented in this study, in which the upper-circulatory system was simulated and from which pressure and PPG signals could be measured. In the absence of HRV and autonomic regulation, PRV indices were extracted from PPG signals measured from this in-vitro system. It was observed that PRV was affected due to changes in stroke rate and target flow. Future studies should aim to better understand the origin of these differences, validate these results in an in-vivo model, and implement autonomic regulation in the in-vitro setup.
Author Contributions
Conceptualization, E.M.-M. and P.A.K.; methodology, E.M.-M. and P.K; formal analysis, E.M.-M.; writing—original draft preparation, E.M.-M.; writing—review and editing, P.A.K.; supervision, P.A.K. All authors have read and agreed to the published version of the manuscript.
Funding
This research received no external funding.
Institutional Review Board Statement
Not applicable.
Informed Consent Statement
Not applicable.
Data Availability Statement
The data presented in this study are available on request from the corresponding author.
Conflicts of Interest
The authors declare no conflict of interest.
Abbreviations
The following abbreviations are used in this manuscript:
| PRV | Pulse rate variability |
| PPG | Photoplethysmography |
| HRV | Heart rate variability |
| ECG | Electrocardiography |
| SR | Stroke rate |
| TF | Target flow |
Appendix A. In-Vitro Setup
Figure A1 shows the absorbance spectra obtained when the developed fluid was tested using the spectrophotometer.
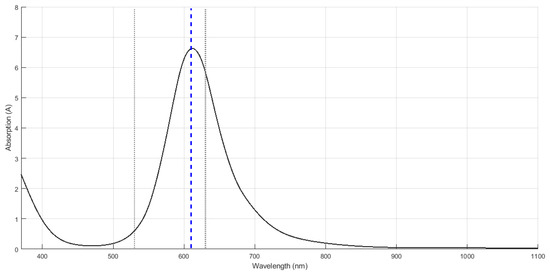
Figure A1.
Spectrum obtained from the spectrophotometer and the artificial blood. The maximum absorbance was obtained with a wavelength of 610 nm.
Figure A2 exemplifies the pressure and photoplethysmographic signals obtained from the constructed rig.

Figure A2.
Pressure and photoplethysmographic (PPG) signals acquired from the constructed rig when stroke rate was set to 60 beats per minute and target flow was set to 3 L/min. DPA: Deep palmar arch.
Appendix B. Factorial Analysis
Figure A3 illustrates the factorial analysis performed in which two factors, stroke rate (SR, orange lines and boxes) and target flow (TF, green lines and boxes), were considered. SR had 5 levels, while TF had 9 levels. The interactions among all levels of both factors were analysed (discontinuous lines).
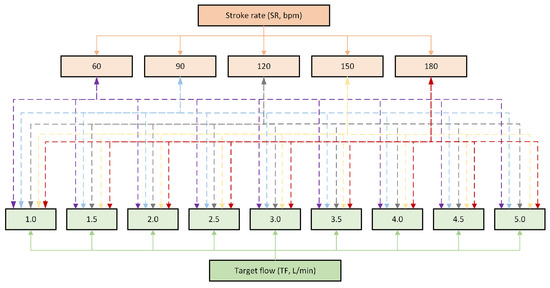
Figure A3.
Diagram of the factorial analysis performed, where 2 factors, stroke rate (SR) and target flow (TF), were considered, as well as their interactions (discontinuous lines).
Appendix C. Behaviour of Pulse Rate Variability Indices
Figure A4, Figure A5, Figure A6, Figure A7, Figure A8, Figure A9, Figure A10, Figure A11, Figure A12, Figure A13, Figure A14, Figure A15, Figure A16, Figure A17, Figure A18 and Figure A19 show the behaviour of pulse rate variability indices extracted from photoplethysmographic signals obtained with different stroke rates and target flows. Target flow has been separated as below and above 2.5 L/min to facilitate visualisation due to the impact of outliers in the lower TF values.
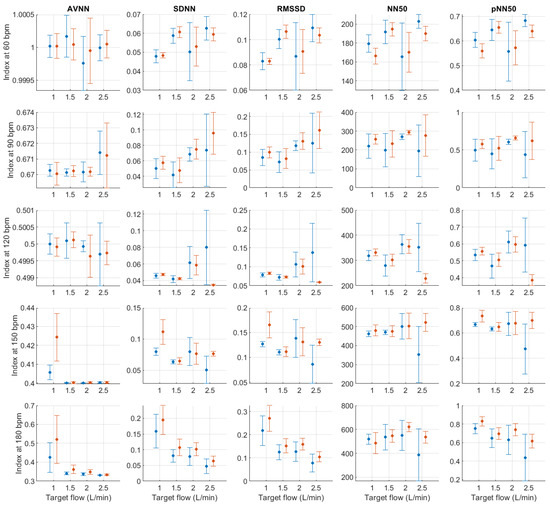
Figure A4.
Mean and standard deviation of time-domain indices extracted from pulse rate variability under different stroke rates (SR) and target flows (TF, TF below 2.5 L/min) conditions, and measured from the radial (blue) and deep palmar arch (orange) phantoms.
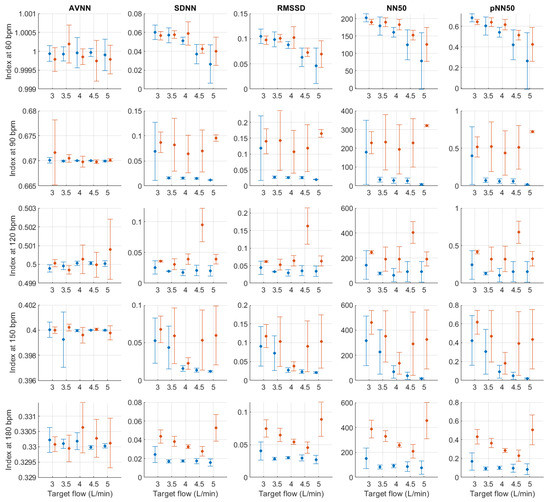
Figure A5.
Mean and standard deviation of time-domain indices extracted from pulse rate variability under different stroke rates (SR) and target flows (TF, TF above 2.5 L/min) conditions, and measured from the radial (blue) and deep palmar arch (orange) phantoms.
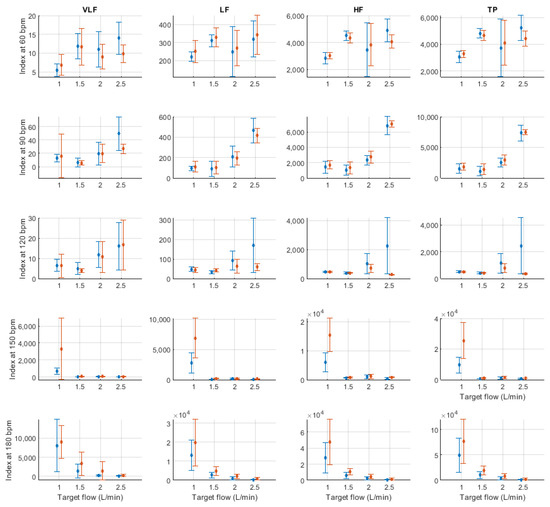
Figure A6.
Mean and standard deviation of absolute frequency-domain indices extracted from pulse rate variability under different stroke rates (SR) and target flows (TF, TF below 2.5 L/min) conditions, and measured from the radial (blue) and deep palmar arch (orange) phantoms.
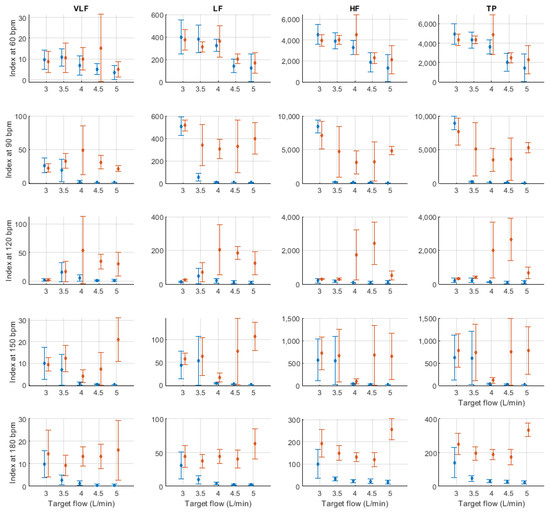
Figure A7.
Mean and standard deviation of absolute frequency-domain indices extracted from pulse rate variability under different stroke rates (SR) and target flows (TF, TF above 2.5 L/min) conditions, and measured from the radial (blue) and deep palmar arch (orange) phantoms.
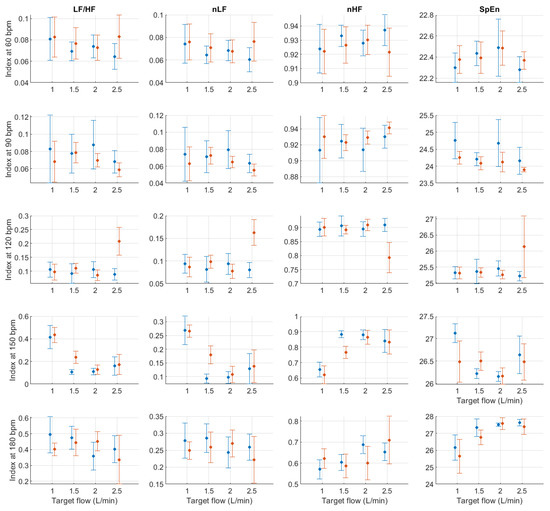
Figure A8.
Mean and standard deviation of relative frequency-domain indices extracted from pulse rate variability under different stroke rates (SR) and target flows (TF, TF below 2.5 L/min) conditions, and measured from the radial (blue) and deep palmar arch (orange) phantoms.
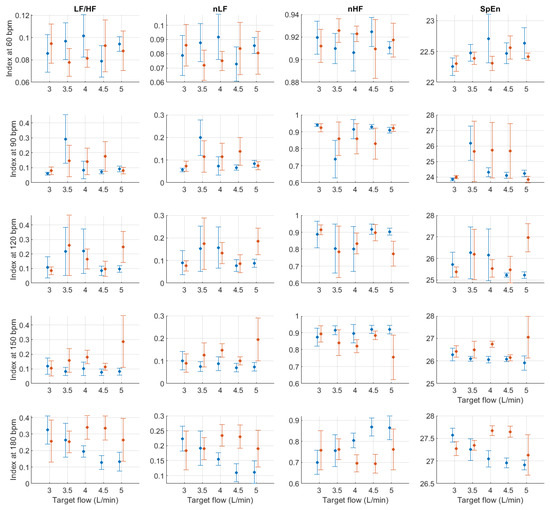
Figure A9.
Mean and standard deviation of relative frequency-domain indices extracted from pulse rate variability under different stroke rates (SR) and target flows (TF, TF above 2.5 L/min) conditions, and measured from the radial (blue) and deep palmar arch (orange) phantoms.
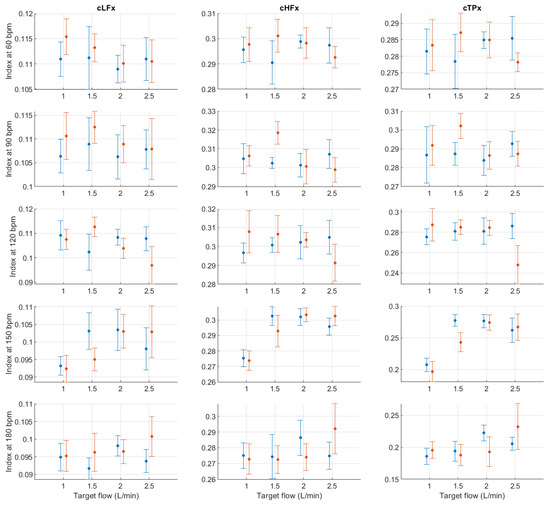
Figure A10.
Mean and standard deviation of the x-coordinates of the centroid-related indices extracted from pulse rate variability under different stroke rates (SR) and target flows (TF, TF below 2.5 L/min) conditions, and measured from the radial (blue) and deep palmar arch (orange) phantoms.
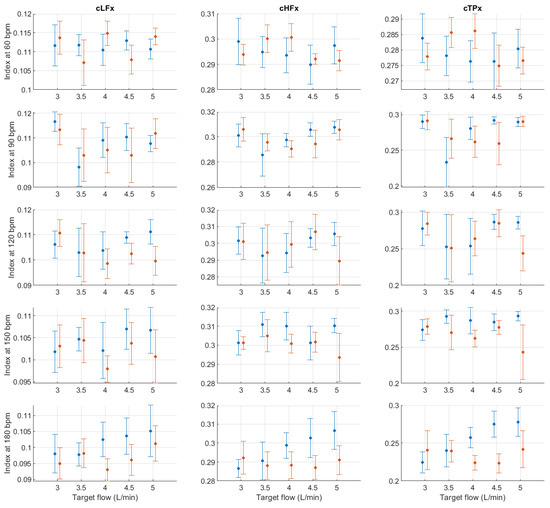
Figure A11.
Mean and standard deviation of the x-coordinates of the centroid-related indices extracted from pulse rate variability under different stroke rates (SR) and target flows (TF, TF above 2.5 L/min) conditions, and measured from the radial (blue) and deep palmar arch (orange) phantoms.
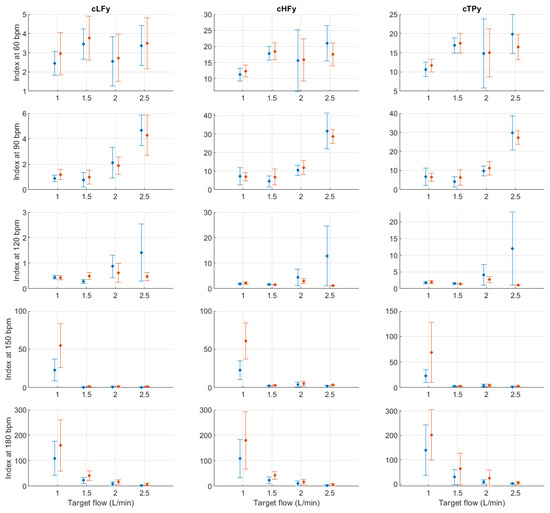
Figure A12.
Mean and standard deviation of the y-coordinates of the centroid-related indices extracted from pulse rate variability under different stroke rates (SR) and target flows (TF, TF below 2.5 L/min) conditions, and measured from the radial (blue) and deep palmar arch (orange) phantoms.
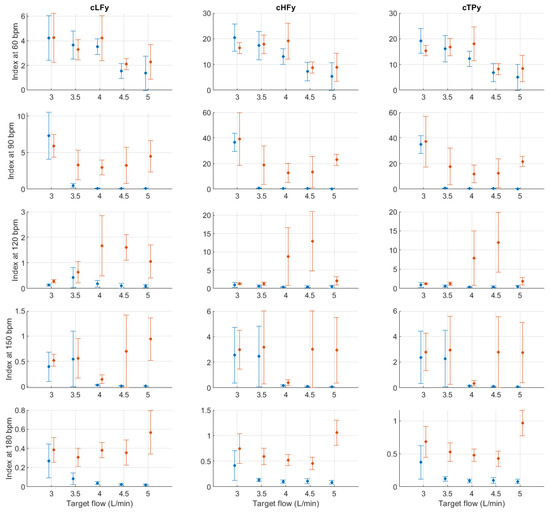
Figure A13.
Mean and standard deviation of the y-coordinates of the centroid-related indices extracted from pulse rate variability under different stroke rates (SR) and target flows (TF, TF above 2.5 L/min) conditions, and measured from the radial (blue) and deep palmar arch (orange) phantoms.
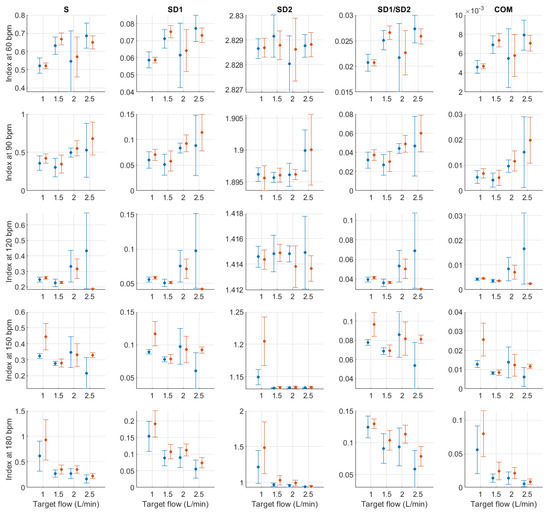
Figure A14.
Mean and standard deviation of Poincaré plot indices extracted from pulse rate variability under different stroke rates (SR) and target flows (TF, TF below 2.5 L/min) conditions, and measured from the radial (blue) and deep palmar arch (orange) phantoms.
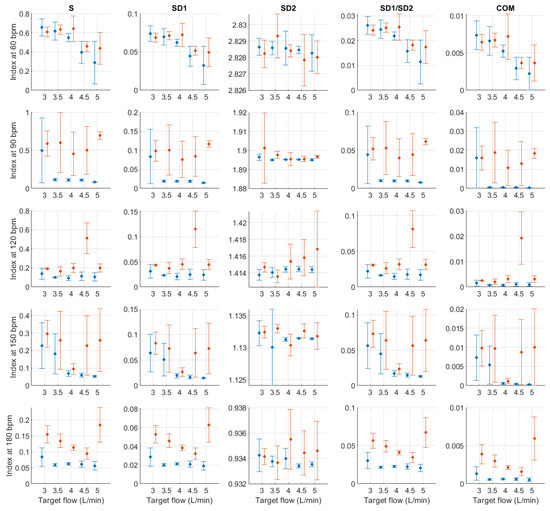
Figure A15.
Mean and standard deviation of Poincaré plot indices extracted from pulse rate variability under different stroke rates (SR) and target flows (TF, TF above 2.5 L/min) conditions, and measured from the radial (blue) and deep palmar arch (orange) phantoms.
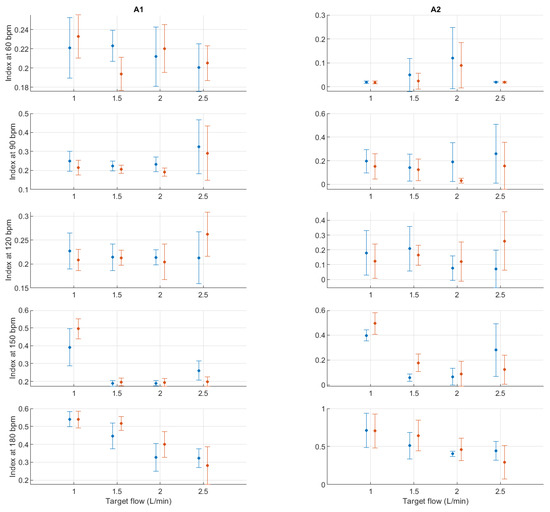
Figure A16.
Mean and standard deviation of detrended fluctuation analysis indices extracted from pulse rate variability under different stroke rates (SR) and target flows (TF, TF below 2.5 L/min) conditions, and measured from the radial (blue) and deep palmar arch (orange) phantoms.
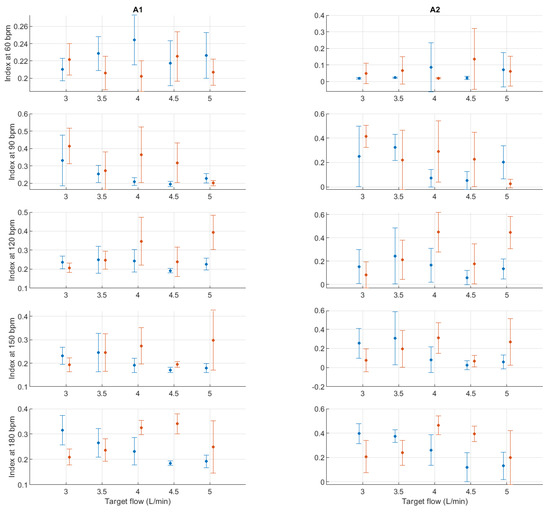
Figure A17.
Mean and standard deviation of detrended fluctuation analysis indices extracted from pulse rate variability under different stroke rates (SR) and target flows (TF, TF above 2.5 L/min) conditions, and measured from the radial (blue) and deep palmar arch (orange) phantoms.
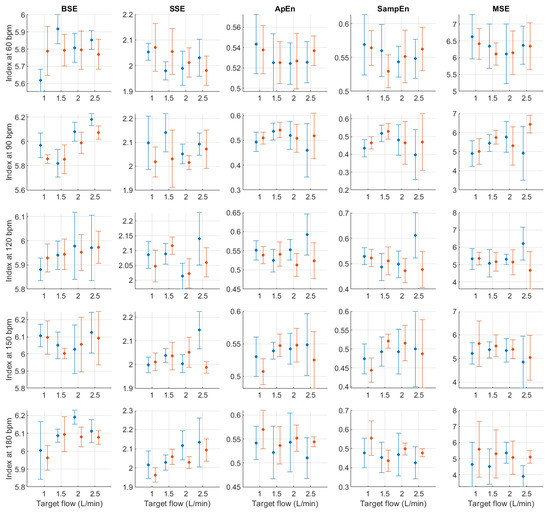
Figure A18.
Mean and standard deviation of entropy-related indices extracted from pulse rate variability under different stroke rates (SR) and target flows (TF, TF below 2.5 L/min) conditions, and measured from the radial (blue) and deep palmar arch (orange) phantoms.
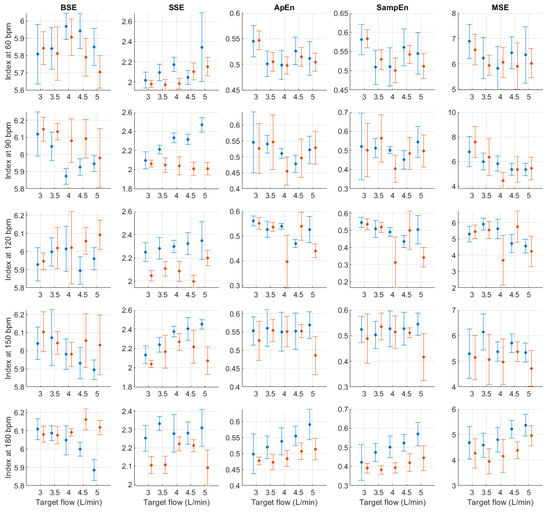
Figure A19.
Mean and standard deviation of entropy-related indices extracted from pulse rate variability under different stroke rates (SR) and target flows (TF, TF above 2.5 L/min) conditions, and measured from the radial (blue) and deep palmar arch (orange) phantoms.
References
- Schäfer, A.; Vagedes, J. How accurate is pulse rate variability as an estimate of heart rate variability? A review on studies comparing photoplethysmographic technology with an electrocardiogram. Int. J. Cardiol. 2013, 166, 15–29. [Google Scholar] [CrossRef] [PubMed]
- Mejía-Mejía, E.; May, J.M.; Torres, R.; Kyriacou, P.A. Pulse rate variability in cardiovascular health: A review on its applications and relationship with heart rate variability. Physiol. Meas. 2020, 41, 07TR01. [Google Scholar] [CrossRef] [PubMed]
- Mejía-Mejía, E.; May, J.M.; Elgendi, M.; Kyriacou, P.A. Classification of blood pressure in critically ill patients using photoplethysmography and machine learning. Comput. Meth. Prog. Biomed. 2021, 208, 106222. [Google Scholar] [CrossRef] [PubMed]
- Yuda, E.; Shibata, M.; Ogata, Y.; Ueda, N.; Yambe, T.; Yoshizawa, M.; Hayano, J. Pulse rate variability: A new biomarker, not a surrogate for heart rate variability. J. Physiol. Anthropol. 2020, 39, 21. [Google Scholar] [CrossRef]
- Mejía-Mejía, E.; Budidha, K.; Abay, T.Y.; May, J.M.; Kyriacou, P.A. Heart Rate Variability (HRV) and Pulse Rate Variability (PRV) for the Assessment of Autonomic Responses. Front. Physiol. 2020, 11, 779. [Google Scholar] [CrossRef] [PubMed]
- Mejía-Mejía, E.; May, J.M.; Elgendi, M.; Kyriacou, P.A. Differential effects of the blood pressure state on pulse rate variability and heart rate variability in critically ill patients. NPJ Digit. Med. 2021, 4, 82. [Google Scholar] [CrossRef] [PubMed]
- Yuda, E.; Yamamoto, K.; Yoshida, Y.; Hayano, J. Differences in pulse rate variability with measurement site. J. Physiol. Anthropol. 2020, 39, 4. [Google Scholar] [CrossRef] [PubMed] [Green Version]
- Constant, I.; Laude, D.; Murat, I.; Elghozi, J.L. Pulse rate variability is not a surrogate for heart rate variability. Clin. Sci. 1999, 4, 391–397. [Google Scholar] [CrossRef]
- Pellegrino, P.R.; Schiller, A.M.; Zucker, I.H. Validation of pulse rate variability as a surrogate for heart rate variability in chronically instrumented rabbits. Am. J. Physiol. Heart Circ. Physiol. 2014, 307, H97–H109. [Google Scholar] [CrossRef] [PubMed] [Green Version]
- May, J.M.; Mejía-Mejía, E.; Nomoni, M.; Budidha, K.; Choi, C.; Kyriacou, P.A. Effects of Contact Pressure in Reflectance Photoplethysmography in an In Vitro Tissue-Vessel Phantom. Sensors 2021, 21, 8421. [Google Scholar] [CrossRef] [PubMed]
- Dotter, C.; Roberts, D.J.; Steinberg, I. Aortic Length: Angiocardiographic Measurements. Circulation 1950, 2, 915–920. [Google Scholar] [CrossRef] [Green Version]
- Poonam, N.J.; Rajan, K.S.; Tripta, S. Anatomical Considerations and Clinical Implications of Subclavian Artery. J. Evol. Med. Dent. Sci. 2013, 2, 5484–5491. [Google Scholar] [CrossRef]
- Chakravarthi, K.K.; Siddaraju, K.S.; Venumadhav, N.; Sharma, A.; Kumar, N. Anatomical Variations of Brachial Artery—Its Morphology, Embryogenesis and Clinical Implications. J. Clin. Diagn. Res. 2014, 8, AC17–AC20. [Google Scholar] [CrossRef] [PubMed]
- Nasr, A.Y. The radial artery and its variations: Anatomical study and clinical implications. Folia Morphol. 2012, 71, 252–262. [Google Scholar]
- Nomoni, M.; May, J.M.; Kyriacou, P.A. Novel Polydimethylsiloxane (PDMS) Pulsatile Vascular Tissue Phantoms for the In-Vitro Investigation of Light Tissue Interaction in Photoplethysmography. Sensors 2020, 20, 4246. [Google Scholar] [CrossRef] [PubMed]
- Nomoni, M.; May, J.M.; Kyriacou, P.A. A Pulsatile Optical Tissue Phantom for the Investigation of Light-Tissue Interaction in Reflectance Photoplethysmography. In Proceedings of the 41st Annual International Conference of the IEEE Engineering in Medicine and Biology Society (EMBC), Berlin, Germany, 23–27 July 2019; pp. 3204–3207. [Google Scholar]
- Akl, T.J.; King, T.J.; Long, R.; Ericson, M.N.; Wilson, M.A.; McShane, M.J.; Coté, G.L. In vitro performance of a perfusion and oxygenation optical sensor using a unique liver phantom. In Proceedings of the SPIE BiOS, San Francisco, CA, USA, 21–26 January 2012; p. 822904. [Google Scholar]
- Rybynok, V.; May, J.M.; Budidha, K.; Njoum, H.; Phillips, J.P.; Kyriacou, P.A. ZenPPG: A modular multi-channel photoplethysmography system. In Proceedings of the International Symposium of Innovations and Applications of Monitoring Perfusion, Oxygenation and Ventilation (IAMPOV), New Haven, CT, USA, 29 June–1 July 2012. [Google Scholar]
- Budidha, K.; Rybynok, V.; Kyriacou, P.A. Design and Development of a Modular, Multichannel Photoplethysmography System. IEEE Trans. Instrum. Meas. 2018, 67, 1954–1965. [Google Scholar] [CrossRef]
- Kumar, K.R.; Kirsch, R.E.; Hornik, C.P. Cardiovascular Physiology for Intensivists. In Critical Heart Disease in Infants and Children; Ungerleider, R.M., Meliones, J.N., McMillan, K.N., Cooper, D.S., Jacobs, J.P., Eds.; Elsevier: Philadelphia, PA, USA, 2019; pp. 111–133.e5. [Google Scholar]
- Elgendi, M.; Norton, I.; Brearley, M.; Abbott, D.; Schuurmans, D. Systolic peak detection in acceleration photoplethysmograms measured from emergency responders in tropical conditions. PLoS ONE 2013, 8, e76858. [Google Scholar] [CrossRef] [Green Version]
- Mejía-Mejía, E.; May, J.M.; Kyriacou, P.A. Effects of using different algorithms and fiducial points for the detection of interbeat intervals, and different sampling rates on the assessment of pulse rate variability from photoplethysmography. Comput. Meth. Prog. Biomed. 2022, 218, 106724. [Google Scholar] [CrossRef] [PubMed]
- Khandoker, A.H.; Karmakar, C.; Brennan, M.; Palaniswami, M.; Voss, A. Poincaré Plot Methods for Heart Rate Variability Analysis; Springer: Boston, MA, USA, 2013. [Google Scholar]
Publisher’s Note: MDPI stays neutral with regard to jurisdictional claims in published maps and institutional affiliations. |
© 2022 by the authors. Licensee MDPI, Basel, Switzerland. This article is an open access article distributed under the terms and conditions of the Creative Commons Attribution (CC BY) license (https://creativecommons.org/licenses/by/4.0/).