1. Introduction
Stains in occlusal pits and fissures can completely mask early enamel demineralization and hence confound visual detection of incipient, remineralizable caries states. The clinical standard of visual and radiographic examination for caries detection shows sensitivities of only 49.1% and 36.0%, respectively, for occlusal lesions in Germany [
1]. Due to the poor performance of these techniques, some dentists may resort to tactile examination or probing, which can cause traumatic enamel defects in lesions [
2,
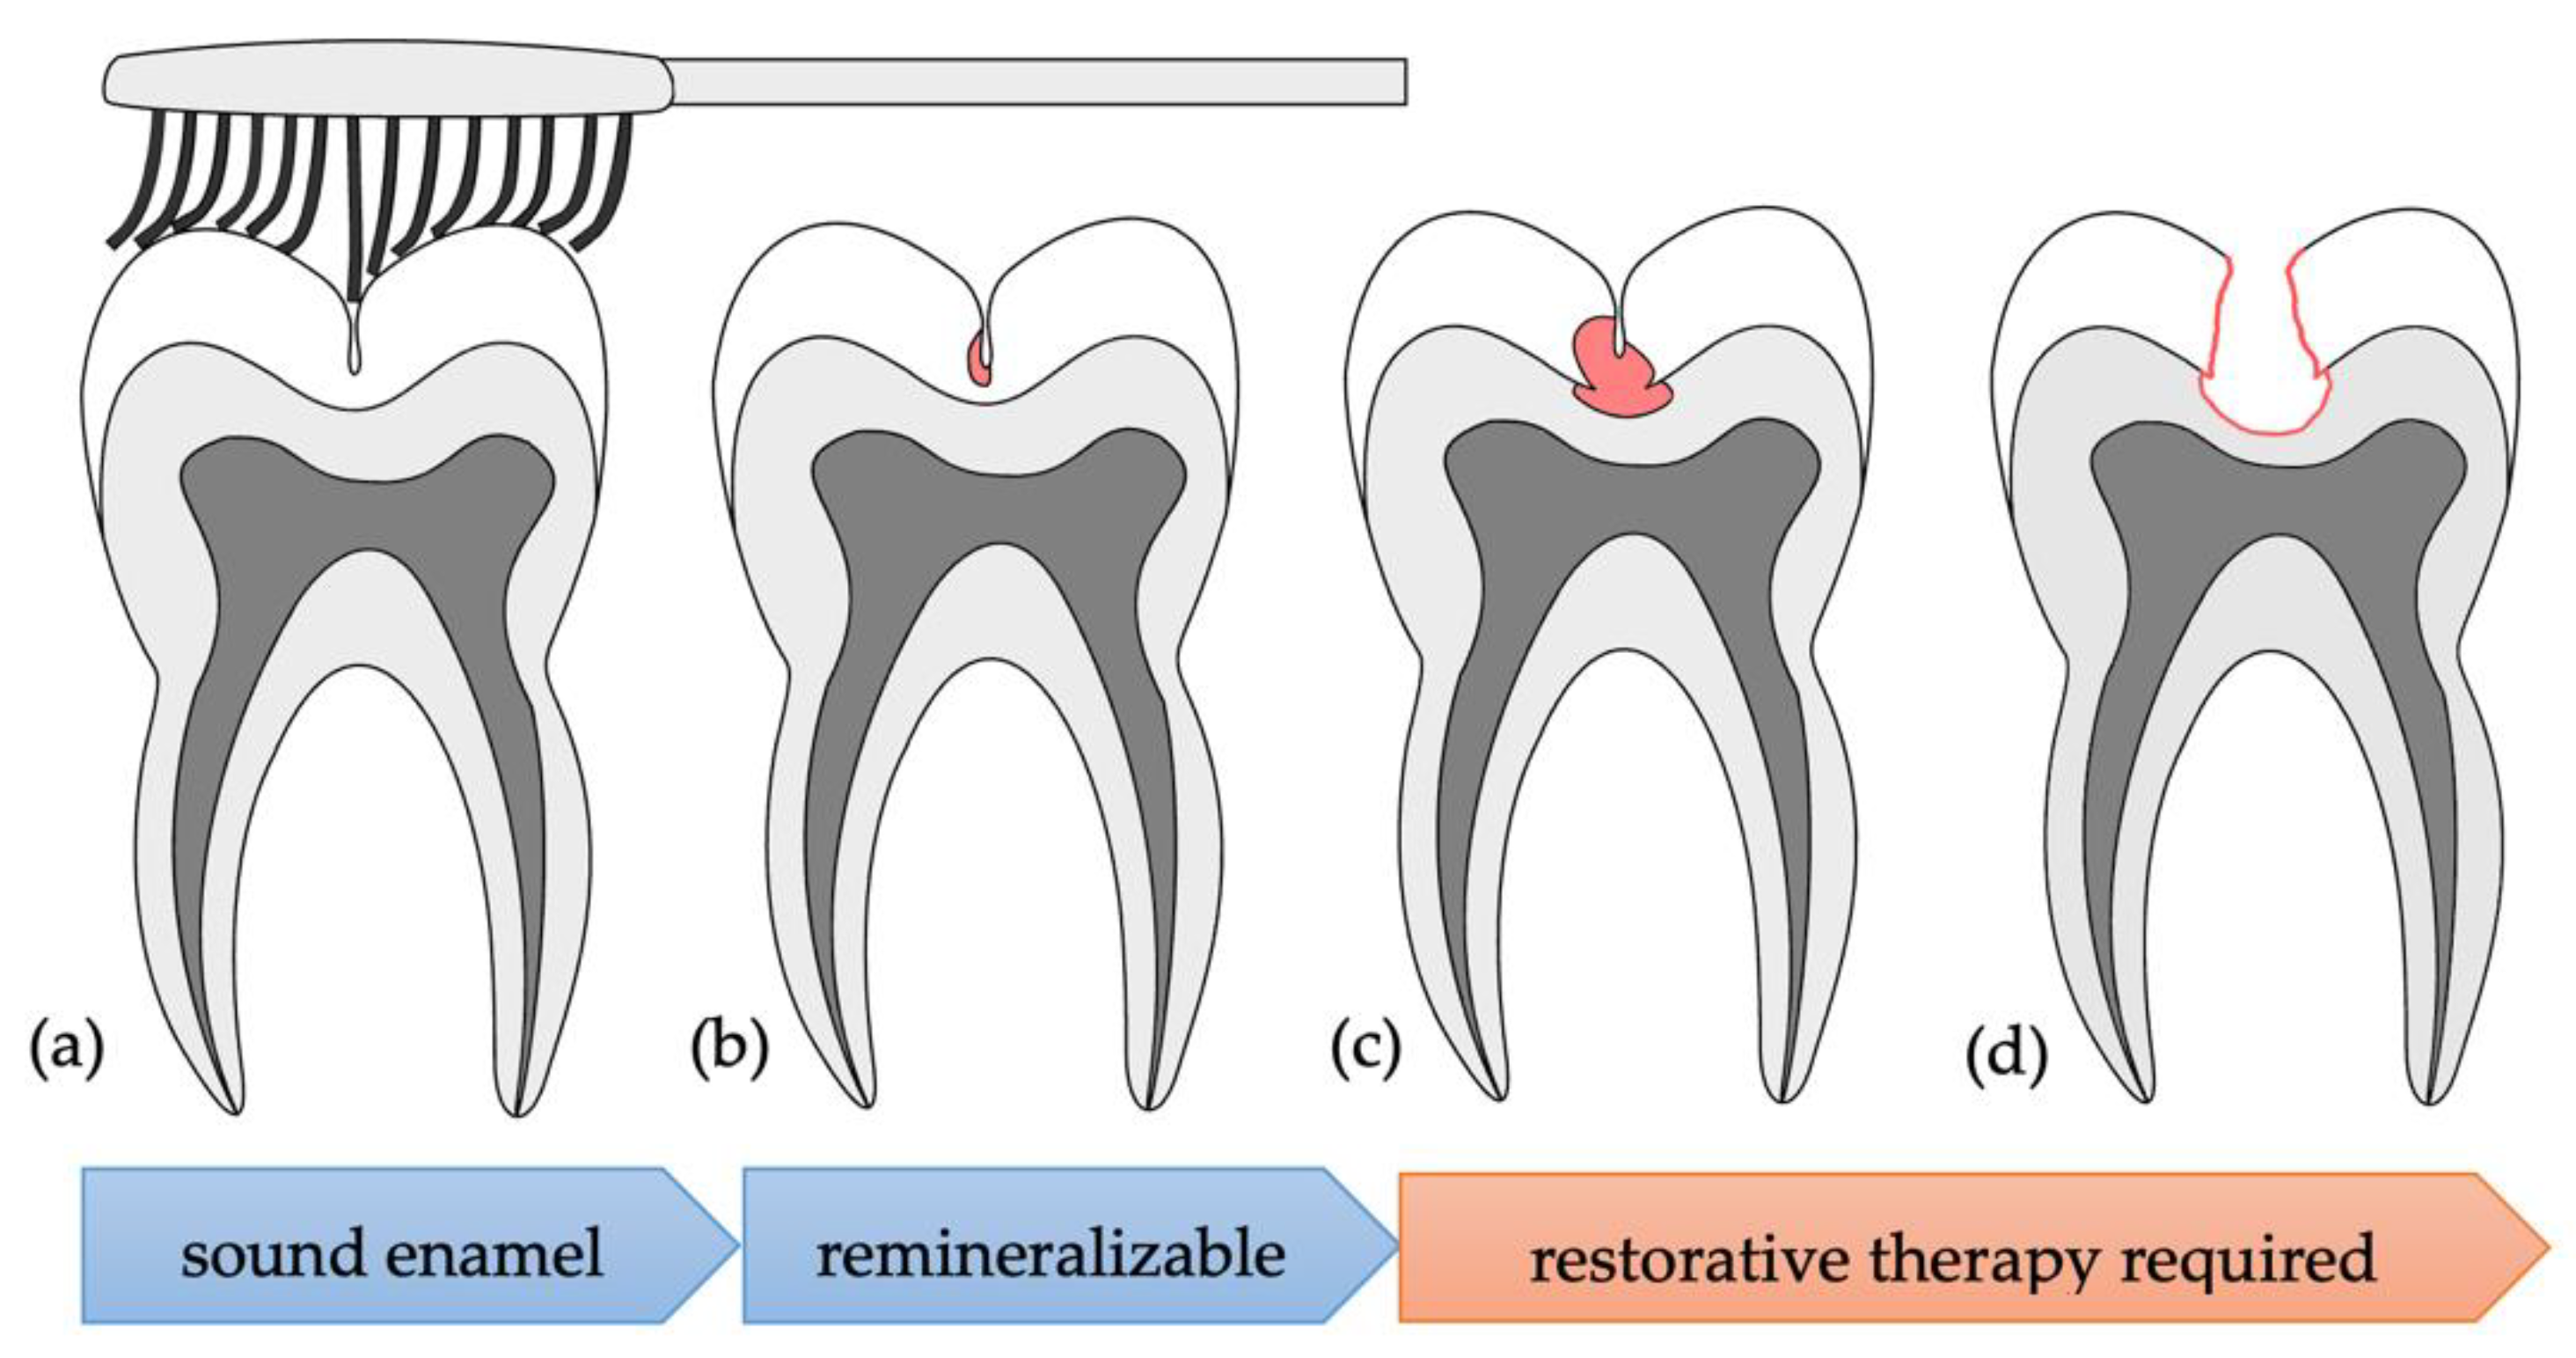
3]. Occlusal caries refers to carious lesions originating from a tooth’s occlusal surface. Due to the jagged cusp-and-fissure relief of occlusal surfaces, dental biofilms (plaque) can more easily persevere despite mechanical plaque removal (tooth brushing). In particular, fissures are often so narrow that a toothbrush’s bristles cannot penetrate to and hence clean the fissure bottom, allowing plaque to remain and mature. Bacteria in dental plaque secrete acids, demineralizing the tooth’s enamel and causing dental caries. When this demineralization is confined to enamel, the lesion can be treated non-invasively by remineralization techniques. However, if gone unnoticed, the lesion progresses, penetrating into dentin at the fissure bottom (
Figure 1). Then, restorative therapy is required. Hidden caries are a form of occlusal caries where the lesion originates in the fissure bottom and spreads laterally, undermining a superficial layer of sound enamel. Therefore, the lesion is unlikely to be detected by visual inspection, even by experienced clinicians. The inadequacy of conventional techniques underlines the need for novel techniques with improved incipient lesion detection and caries-monitoring performance [
4,
5,
6].
Demineralization causes changes to the enamel spectrum in the visible (VIS) and near-infrared (NIR) region due to an increase in pore volume [
7]. On this basis, spectral imaging has been used previously in vitro for lesion detection, primarily focusing on NIR wavelengths beyond 1000 nm [
8,
9,
10,
11,
12]. NIR wavelengths below 1000 nm have the advantage of being detectable with moderately priced silicon sensors at higher resolution, as opposed to the more costly and lower-resolved indium gallium arsenide (InGaAs) sensors required for higher wavelengths [
13].
Hyperspectral imaging (HSI) was originally developed by NASA as a remote sensing technique [
14]. It allows for the acquisition of two-dimensional spatial (morphological) images, while providing chemical information as an additional third, spectral dimension (
Scheme 1).
As light enters a material, it is repeatedly scattered, absorbed and reflected, and conclusions on a material’s composition can be drawn from its light-scattering and reflectance properties [
15,
16]. HSI detects the reflected light and has thus evolved to become a diagnostic technique in numerous medical fields, including cancer detection [
17,
18,
19,
20,
21], heart disease [
22] and retinal pathologies [
23,
24]. In dental caries detection, HSI relies on changes in enamel’s light reflectance due to biochemical and morphological alterations induced by a carious lesion [
7]. HSI shows promising potential for early lesion detection in a clinical setting, with short image acquisition times and noncontact, nonionizing imaging [
11,
12]. Unlike previously applied spectral imaging approaches that focus on specific wavelengths, here, hyperspectral imaging considers a wide range of wavelengths and combines spatial (morphological) and spectral (chemical) information [
13]. Different data processing techniques have been applied to hyperspectral data in dentistry, including the examination of characteristic wavelength intensities [
12] and automated quadratic discriminant analysis [
11].
Artificial intelligence (AI) is increasingly gaining focus in medical diagnostics. Many correlations not apparent to the human eye can be detected by methods of artificial intelligence. Therefore, AI can provide information complementary to traditional diagnostic techniques to improve diagnostic performance. For example, AI can provide accurate and thorough assessment of dental radiographs [
25].
The present in vitro study on extracted teeth revisits the wavelength region 525–1000 nm and considers the entirety of recorded wavelengths in an attempt to characterize the spectral differences between stained but sound enamel and stained demineralized (lesion) enamel. Moreover, classification algorithms (such as support-vector machines, nearest neighbor classifiers and decision trees), all a type of supervised machine learning approach of artificial intelligence, are applied for the first time to automatically parse innocuous stains from incipient lesions. Classification performance is validated by cross-validation. To simulate the classifier’s application as a decision-support system in clinical dentistry, additional extracted teeth’s occlusal surfaces are classified, and enamel health predictions are presented in an occlusal projection of the tooth.
2. Materials and Methods
The procedure for HSI-based automated classification of stained intact and stained demineralized occlusal areas is depicted in
Scheme 2.
Tooth acquisition and selection: Sixty-five human permanent bicuspids and molars, of which thirty-five were maxillary and thirty-one were mandibular, were investigated in this study. All teeth were recently extracted in clinical routine for medically justified reasons not related to this study in private practices across the state of Saxony, Germany, and therefore, this study is exempt from ethical approval [
26]. No personal or general health information was collected from the donors. The selection of the investigated tooth samples was based on the visual appearance of their occlusal surfaces, which was assessed by three experienced dentists independently, such that no communication occurred between the three raters. None of the raters are authors of this study. All raters were calibrated on ICDAS scoring using the ICDAS II Training Packet prior to tooth assessment [
27]. In the case of different scores allocated to a tooth, the most frequent score was taken. If all three raters assigned different scores, the tooth was excluded from the study. Moreover, using his or her clinical experience, each rater independently encircled the most questionable area of each tooth’s fissure on an accompanying photograph of each tooth. Teeth with stained or discolored occlusal fissures were included in this study. Teeth with surface cavitation with dentin exposure (≥ICDAS 5) or with fissure sealants or occlusal restorations were excluded from this study. In order to prevent dehydration, the teeth were stored in a distilled water and thymol solution. For each tooth, a central region of its fissural system was defined for validation of its occlusal health state. Validation was performed by histological cross-section analysis with polarized light microscopy (PLM).
Hyperspectral imaging setup: Hyperspectral images of each tooth’s entire occlusal surface were acquired using a commercially available hyperspectral imaging line-scan camera (Diaspective Vision TIVITA
® Tissue, Diaspective Vision, Pepelow, Germany) to measure oxygenation, perfusion, heme and water content of skin and mucous membranes. The camera provides spatially resolved images (640 × 480 pixels) within the wavelength range of 505–1000 nm (100 spectral bands, Δλ = 5 nm). The reflected, broadband light is collected by a 75 mm, coated NIR lens (Azure Photonics, Inc., San Ramon, CA, USA) at an aperture of f/2.8 and passes through a moveable internal slit to an optical grating where the light is dispersed into its wavelengths. The resulting intensities are then projected onto the camera sensor, where one axis represents the coordinates of a single line and the other axis represents the intensities of the wavelengths (
x-λ orientation). The second spatial dimension is generated by internally moving the slit along the object. For a thorough explanation of the line-scan hyperspectral acquisition principle, we highly recommend the review of Lu and Fei on medical hyperspectral imaging [
13]. The teeth were measured under moist conditions; larger water residues in the fissural system were carefully removed with a paper point prior to imaging. Occlusal surfaces were located 350 mm below the lens and aligned parallel to the tabletop. Two external 40 W halogen bulbs with an aluminum-coated reflector (OSRAM Halopar GU10, OSRAM GmbH, Munich, Germany) illuminated the samples in the analyzed wavelength range. In order to ensure a reproducible and stable spectrum output of the illumination unit, a warm-up time of 60 s prior to measurements was applied and the recommended voltage (230 V) was supplied by a stabilized power supply. The camera calibration and data normalization procedure was described in more detail previously [
28]. Briefly, the reflected intensity of the tooth is normalized to a previously measured dark image with closed shutter as well as to a white image with a reflectance standard (>98% reflectance, Optopolymer
®, Optopolymer, Munich, Germany) in order to correct sensor noise and illumination inhomogeneities. The resulting normalized reflectance image at each wavelength was represented as a grayscale image according to its reflectance intensity (range: 0–1; dark: low reflectance intensity, bright: high reflectance intensity).
Polarized light microscopy: PLM of histological cross-sections was used to determine the reference occlusal health state. Cross-sections of approx. 80 µm thickness were created at the clinically most questionable region of the central fissure of each tooth using Donath’s thin-section technique [
29]. The sections were analyzed using a Leica DMRB polarization microscope (Leica Microsystems GmbH, Wetzlar, Germany) with crossed polarizer and analyzer and an additional full-wave retardation plate (red I plate) prior to the analyzer. Digital photographs were taken of all sections with a full-frame digital camera (SONY Alpha 7, Sony Europe B.V., Surrey, UK) attached to the microscope and in combination with a 2.5× magnification objective. No further image processing was performed. Two dentists experienced in tooth histology and not involved in the teeth’s visual examination consensually determined each tooth’s occlusal health state as intact but with stained enamel (hereafter ‘stained’) or stained and demineralized enamel (hereafter ‘stained lesion’). Fissural areas that showed natural positive birefringence exhibiting a distinctive change of color (yellow—violet) were associated with stained enamel. Stained lesions were identified by increased absorption, i.e., reduced transparency, and specific polarization properties such as negative birefringence or depolarization with a characteristic brown-dark, often droplet-shaped involvement of the surrounding enamel.
Classification and statistical analysis: Using custom MATLAB
® (MathWorks, Natick, MA, USA) code, a graphical user interface (GUI) for reading, visualizing and selecting hyperspectral data was developed. Within this GUI, ten data points in close proximity to the histologically validated region were selected manually for each tooth (
Figure 2a). The corresponding reflectance spectra were saved for further processing and associated with the histological occlusal state by binarization (0 = stained, 1 = stained lesion). The number of teeth and spectra within each occlusal health state group is shown in
Table 1. In order to remove potential noise from the spectra, an additional second dataset was generated by applying a Savitzky–Golay filter (order = 2, frame length = 7) to the selected raw reflectance spectra (
Figure 2b). The Savitzky–Golay filter is well established in (hyper)spectral data analysis because it enables an increase in data precision without distorting the underlying signal [
30]. Intensities at the wavelengths 505–525 nm were eliminated due to the high noise level of the camera sensor in this region.
The filtered, cropped spectra were used to train 24 classification algorithms of artificial intelligence. These include algorithms of the subgroups support vector machines (SVM), nearest-neighbor (kNN) and decision trees. An SVM tries to find the best plane (line) that divides data points into their respective classes. The mathematical approach by which the plane is found varies between different SVMs [
31,
32]. k-Nearest-neighbor algorithms count the proportion of one class’s data points within the
k number of this data point’s neighbors compared to other classes’ data points in the vicinity of a given data point. kNN algorithms differ in the number of neighbors they consider and the distance metric used in calculating which neighboring data points are closest [
33]. A decision tree considers one data feature after another. At each decision node, the path is split and the next feature is considered. Decision tree algorithms vary in their maximum number of decisions and the number of data points belonging to a terminal node [
34,
35].
The resulting classification models were validated by stratified 10-fold cross-validation using MATLAB
®’s Classification Learner toolbox. Automated cross-validation ensures that no single data point is present in the training set and validation set at the same time: The dataset is divided randomly into 10 evenly distributed subsets, which are then sequentially alternated as training sets and validation sets used to train and to validate, respectively, each single classification algorithm. For illustration, in the first round of cross-validation, subsets 1–9 are used for algorithm training, while subset 10 is used for determining the classification model’s performance. Then, cross-validation repeats this procedure 10 times, alternating the validation subset with a different training subset in every round [
36,
37,
38].
Due to the imbalanced distribution of represented groups (see
Table 1), Matthews correlation coefficient (
MCC) was chosen as a performance indicator.
MCC is a more appropriate metric for measuring the performance of imbalanced, binary classification tasks compared to traditional other confusion matrix-based measures, such as accuracy or the F1-score [
39]. Nonetheless, this study also mentions sensitivity and specificity as traditional metrics for easier comparability.
MCC is calculated as follows:
The calculation of MCC relies on four parameters derived from the confusion matrix for each classification learner: 1. True positives (TP), spectra correctly classified as stained (0); 2. True negatives (TN), spectra correctly classified as stained lesions (1); 3. False positives (FP), spectra incorrectly classified as stained (0); 4. False negatives (FN), spectra incorrectly classified as stained lesions (1).
MCC returns a value between −1 and +1. A MCC of +1 indicates a perfect prediction, 0 indicates random prediction and −1 indicates a perfect inverse prediction. The algorithm that yielded the classification model with the highest MCC value after 10-fold cross validation was selected for further use.
To simulate the algorithm’s application in a clinical setting, five further teeth that were not included in algorithm training and model generation were imaged and processed with the same setup and protocol. Then, the highest-scoring classification model was applied to HSI reflectance images of these five additional teeth and predicted an enamel health state (stained or stained lesion) for the spectrum at each pixel within the tooth’s selected fissural area. These predictions were color-coded and superimposed onto an image of the tooth’s occlusal surface (green = stained, 0; red = stained lesion, 1) for qualitative assessment. Histological cross-sections were prepared for reference according to the method described above.
3. Results
Based on the previously described criteria for occlusal state validation with PLM, the investigated teeth were categorized as ‘stained’ or as ‘stained lesion’.
Table 1 shows the data distribution after histological assignment of each sample’s occlusal state. Of the analyzed 65 teeth, 12 were categorized as stained and 53 as stained lesions, resulting in an imbalanced data set.
The spectral characteristics of the stained and stained lesion groups are contrasted in the mean reflectance spectrum (
Figure 3). The difference spectrum (
difference = reflectancestained − reflectancestained lesion) illustrates more clearly that the mean reflectance of stained enamel is higher than that of stained lesions in the wavelength range 525–710 nm. In contrast, stained lesions showed a higher mean reflectance in the wavelength range 710–1000 nm. This relationship is also visible in the raw reflectance images, where stains appear transparent at near-infrared wavelengths (
Figure 3, dotted white lines), but stained lesions show an increased reflectance compared to the surrounding sound enamel (
Figure 3, white arrows).
Classification algorithms were able to distinguish well between the spectra of stained enamel and stained lesions. A kNN classification algorithm considering
k = 1 neighbor, utilizing Euclidian distance metric and equal distance weights (“fine kNN”) achieved the highest performance (
MCC = 0.75, sensitivity of 0.95, specificity of 0.80) when trained on the filtered dataset. Algorithms performed slightly better on when trained on filtered data than when trained on raw, unfiltered reflectance data. The confusion matrices of the highest-performing algorithm trained on the filtered and on the unfiltered dataset, respectively, of 65 teeth are shown in
Table 2.
The classification model generated by the fine kNN algorithm was used to classify the fissural systems of five additional teeth, which were not included in the training and evaluation of the algorithm (
Table 3). The projection maps show that the classified enamel state is in good agreement with the PLM images in the histologically validated area: Stained samples show a nearly homogeneous distribution of the predicted enamel state “stained”. However, some clearly circumscribed regions away from the histologically validated area are classified as “stained lesion”. Stained lesion samples exhibit a more heterogeneous distribution of enamel health states: A large proportion of fissural areas are classified as “stained lesion”; however, there are numerous “stained” regions of varying sizes dispersed in between.
4. Discussion
Based on HSI measurements, the occlusal surfaces of posterior teeth were classified into stained but sound enamel and stained lesions using a classification algorithm of artificial intelligence, and its classification performance was validated with PLM. The classification model was subsequently used to classify the enamel health of further teeth’s occlusal surfaces, the results of which were color-coded and mapped onto an occlusal projection of each respective tooth, allowing immediate assessment of large parts of its occlusal fissural system.
This study used a wide range of wavelengths, unlike previous research focusing on intensities at specific wavelengths [
12]. As dental hard tissue possesses no specific absorption bands in the 505–1000 nm range [
40], this approach may aid classification performance. Stains can be detected in the employed wavelength range and there is little interference from water bands, which occur above 1450 nm [
41,
42,
43].
Previous research suggests that stains appear transparent beyond 1150 nm [
41,
44], and hence no longer confound demineralization detection. This study, however, suggests that stains may appear somewhat transparent at lower NIR wavelengths already, as the underlying demineralization present in stained lesions became visible at wavelengths over approximately 800 nm (see
Figure 3), which possibly originates from the increased scattering of incipient demineralizations. Nonetheless, the performance of differentiating stains from stained lesions by means of classification algorithms in the wavelength range 1000–2000 nm would be of great interest. However, costlier InGaAs sensors are then required, which could impede widespread clinical adoption. Further research is also required to investigate the transparency of stains of different origins in the NIR.
The teeth in this study were free of plaque, saliva and blood. For clinical application, these complicating circumstances must be considered. The effect of plaque, saliva and blood present on a tooth’s occlusal surface on the feasibility and quality of hyperspectral imaging and classification performance needs to be assessed.
The results in this study are based on the simplified assumption of a homogeneous distribution of the occlusal health state that was histologically determined at the central region of the fissure. Occlusal caries originates from the fissure in the vast majority of cases. The part of the fissure that clinical experience showed to be the most questionable part (i.e., the most likely to be carious) was selected for further analysis in this study, as this is the clinically most relevant issue. As caries is a dynamic process, however, occlusal classification images show heterogeneous enamel health states (
Table 3). Lesions may develop in one or more sites of the fissure and subsequently spread to further areas. Hence, it is likely that some parts of an analyzed tooth are still unaffected, whereas others contain lesions of varying extent. Thus, teeth showing sound but stained enamel in the histological cross-sectional plane may show lesions in other parts of their fissure (
Table 3a,b). On the other hand, histologically carious teeth show still unaffected fissural regions (
Table 3c,e). In order to refine the validation process, further cross-sections from different parts of the tooth’s fissural system should be considered. Occlusal caries originating from outside the fissure are rare and pose no pertinent clinical issue. In close proximity to the histologically validated areas, the HSI-based classification results show very good agreement with the reference occlusal health state determined by PLM of ground sections (
MCC = 0.75).
The uneven distribution of samples between stained but intact and stained demineralized teeth hinders the use of traditional confusion matrix-based measures such as sensitivity, specificity, the F1-Score or accuracy, as these can encounter strong bias from imbalanced data [
45].
MCC was calculated as an additional performance metric because of its reduced susceptibility to bias in imbalanced data sets, and it should be considered more frequently when interpreting classification results for easier performance comparison between different uneven sample sets.
For validating classification performance, a cross-validation approach was used due to the limited sample size of only 65 teeth. Classical machine learning concepts, as proposed in our work, frequently utilize cross-validation since a larger proportion of the available data can be used for classifier training and hence the sample’s heterogeneity can be considered more reliably, improving classification performance and validity within the constraints of a small dataset [
36,
37,
38]. By contrast, a hard train–test split would have severely reduced the number of teeth available for training and for validating the classification algorithm. Hence, the classification model’s performance and the results’ validity would have been negatively impacted. With stratified 10-fold cross-validation, a compromise was found to maintain strict separation of training and test data, while utilizing a larger sample size to ensure maximum classification performance and validity. This study shows that a reliable distinction between stained but intact enamel and stained lesions is possible with automated classification based on HSI measurements. Further studies should consider a larger sample size and generate an extensive spectral database of stained and stained lesion enamel to account for interindividual biological variance in enamel spectra and for different causes of stains, in an effort to improve classification performance. Especially the group of stained enamel, with its small number of samples in this study but heterogeneous appearance, would likely profit from such a database to ensure sufficient representation of its biological variety and prevent incorrect classification. A similar database for the 900–1700 nm wavelength region has been constructed [
11,
46]. With a database’s larger sample size, a train–test split would become feasible with negligible effects on classification performance and result validity. Moreover, the effect of using deep learning algorithms, as opposed to traditional machine learning algorithms, on classification performance should be explored. Multiple histological cross-sections per tooth should be considered, allowing precise evaluation of a tooth’s entire fissure.
In a later phase, results should be validated in vivo, considering the aggravating circumstances of plaque, saliva and possibly blood present on tooth surfaces. The real-time analysis of samples is important to develop to enable routine clinical application. In order to perform in vivo studies, compact handheld HSI devices for intraoral applications are needed. Currently, an endoscopic HSI camera is under development, which will be used in further studies.


 ,
, 


