
Research on Interface Slip Characteristics of Heritage Composite Timber Columns under Inclined Deformation


Abstract
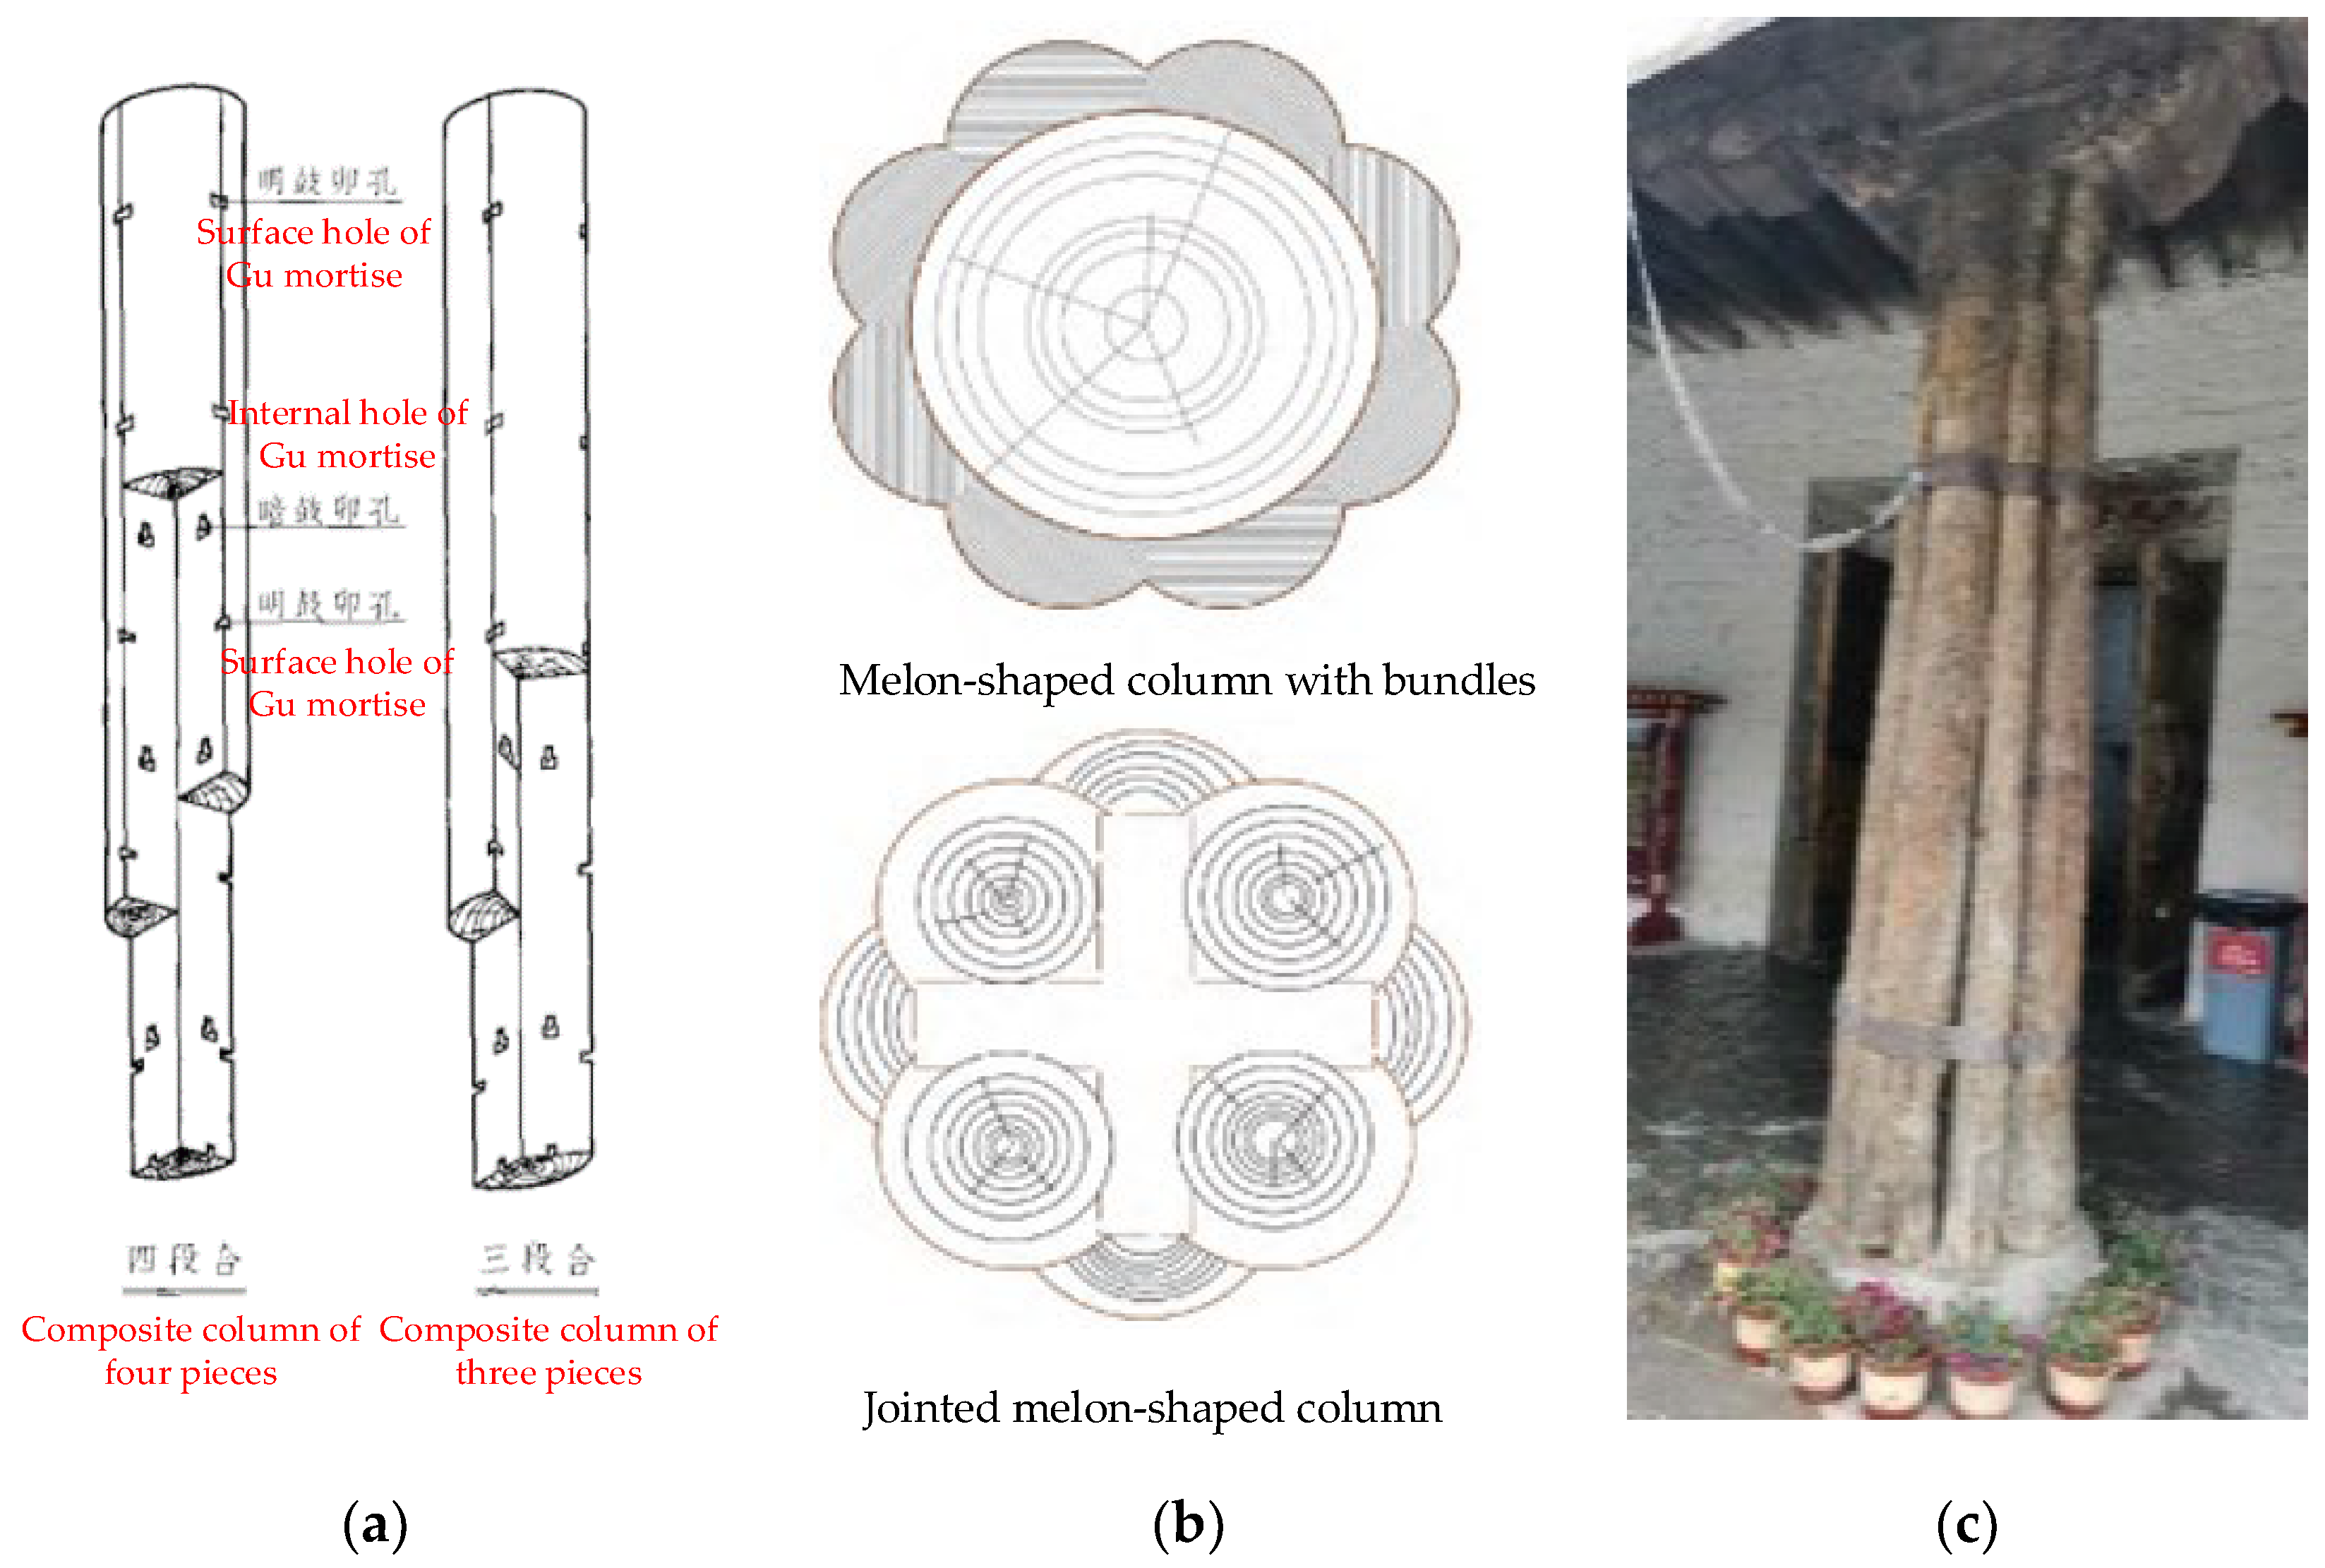
:1. Introduction
2. Mechanical Performance of a Unilateral Combined Interface under Inclined Deformation
2.1. Stress State of the Unilateral Contact Interface of a Composite Timber Column
2.1.1. Basic Assumptions
- The interaction between the dowel pin and mortise–tenon joint in the ancient timber structure is not considered.
- Each component material is in the linear elastic range under tension and compression.
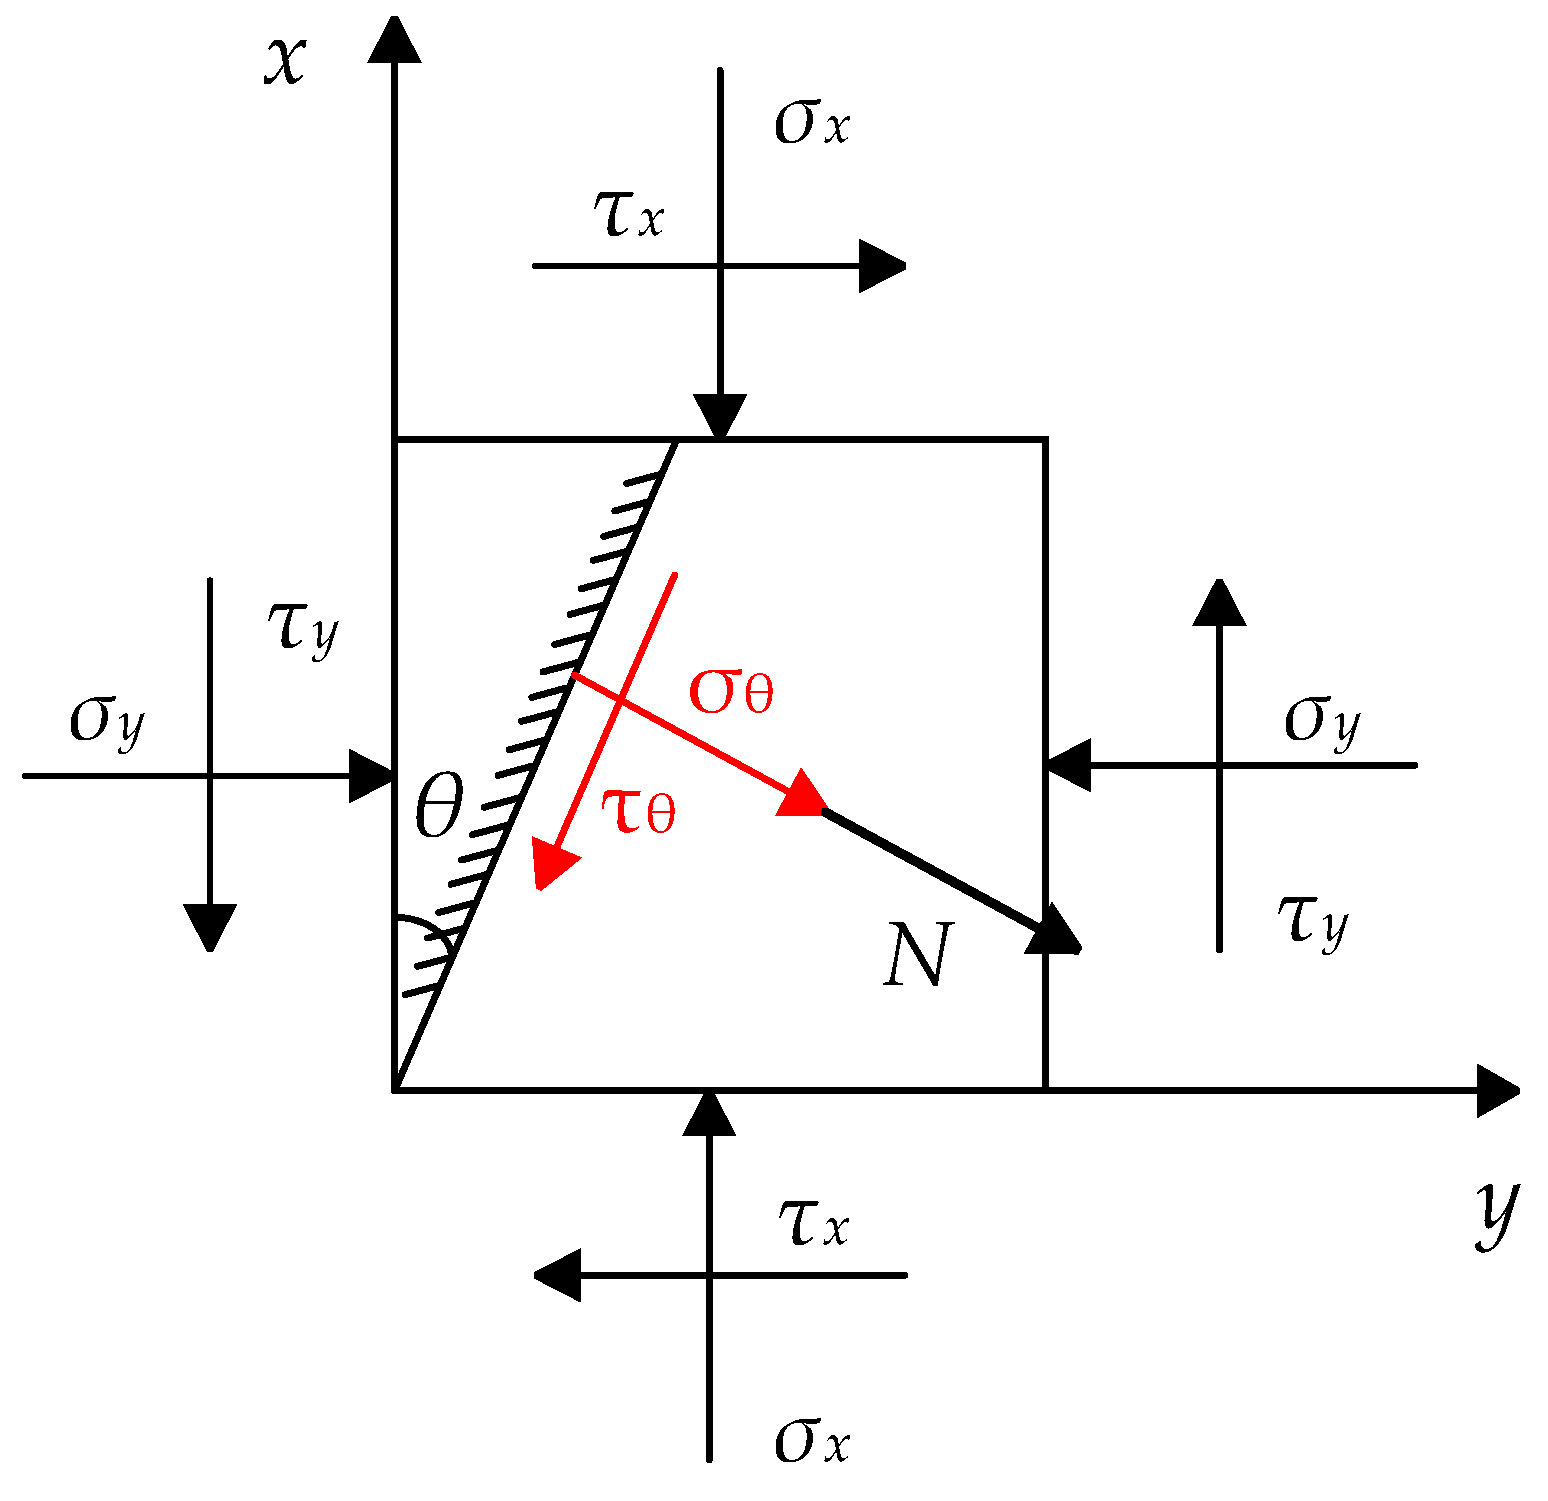
- Shear stress along the interface direction and normal stress perpendicular to the interface direction will be generated on the interface of the timber column.
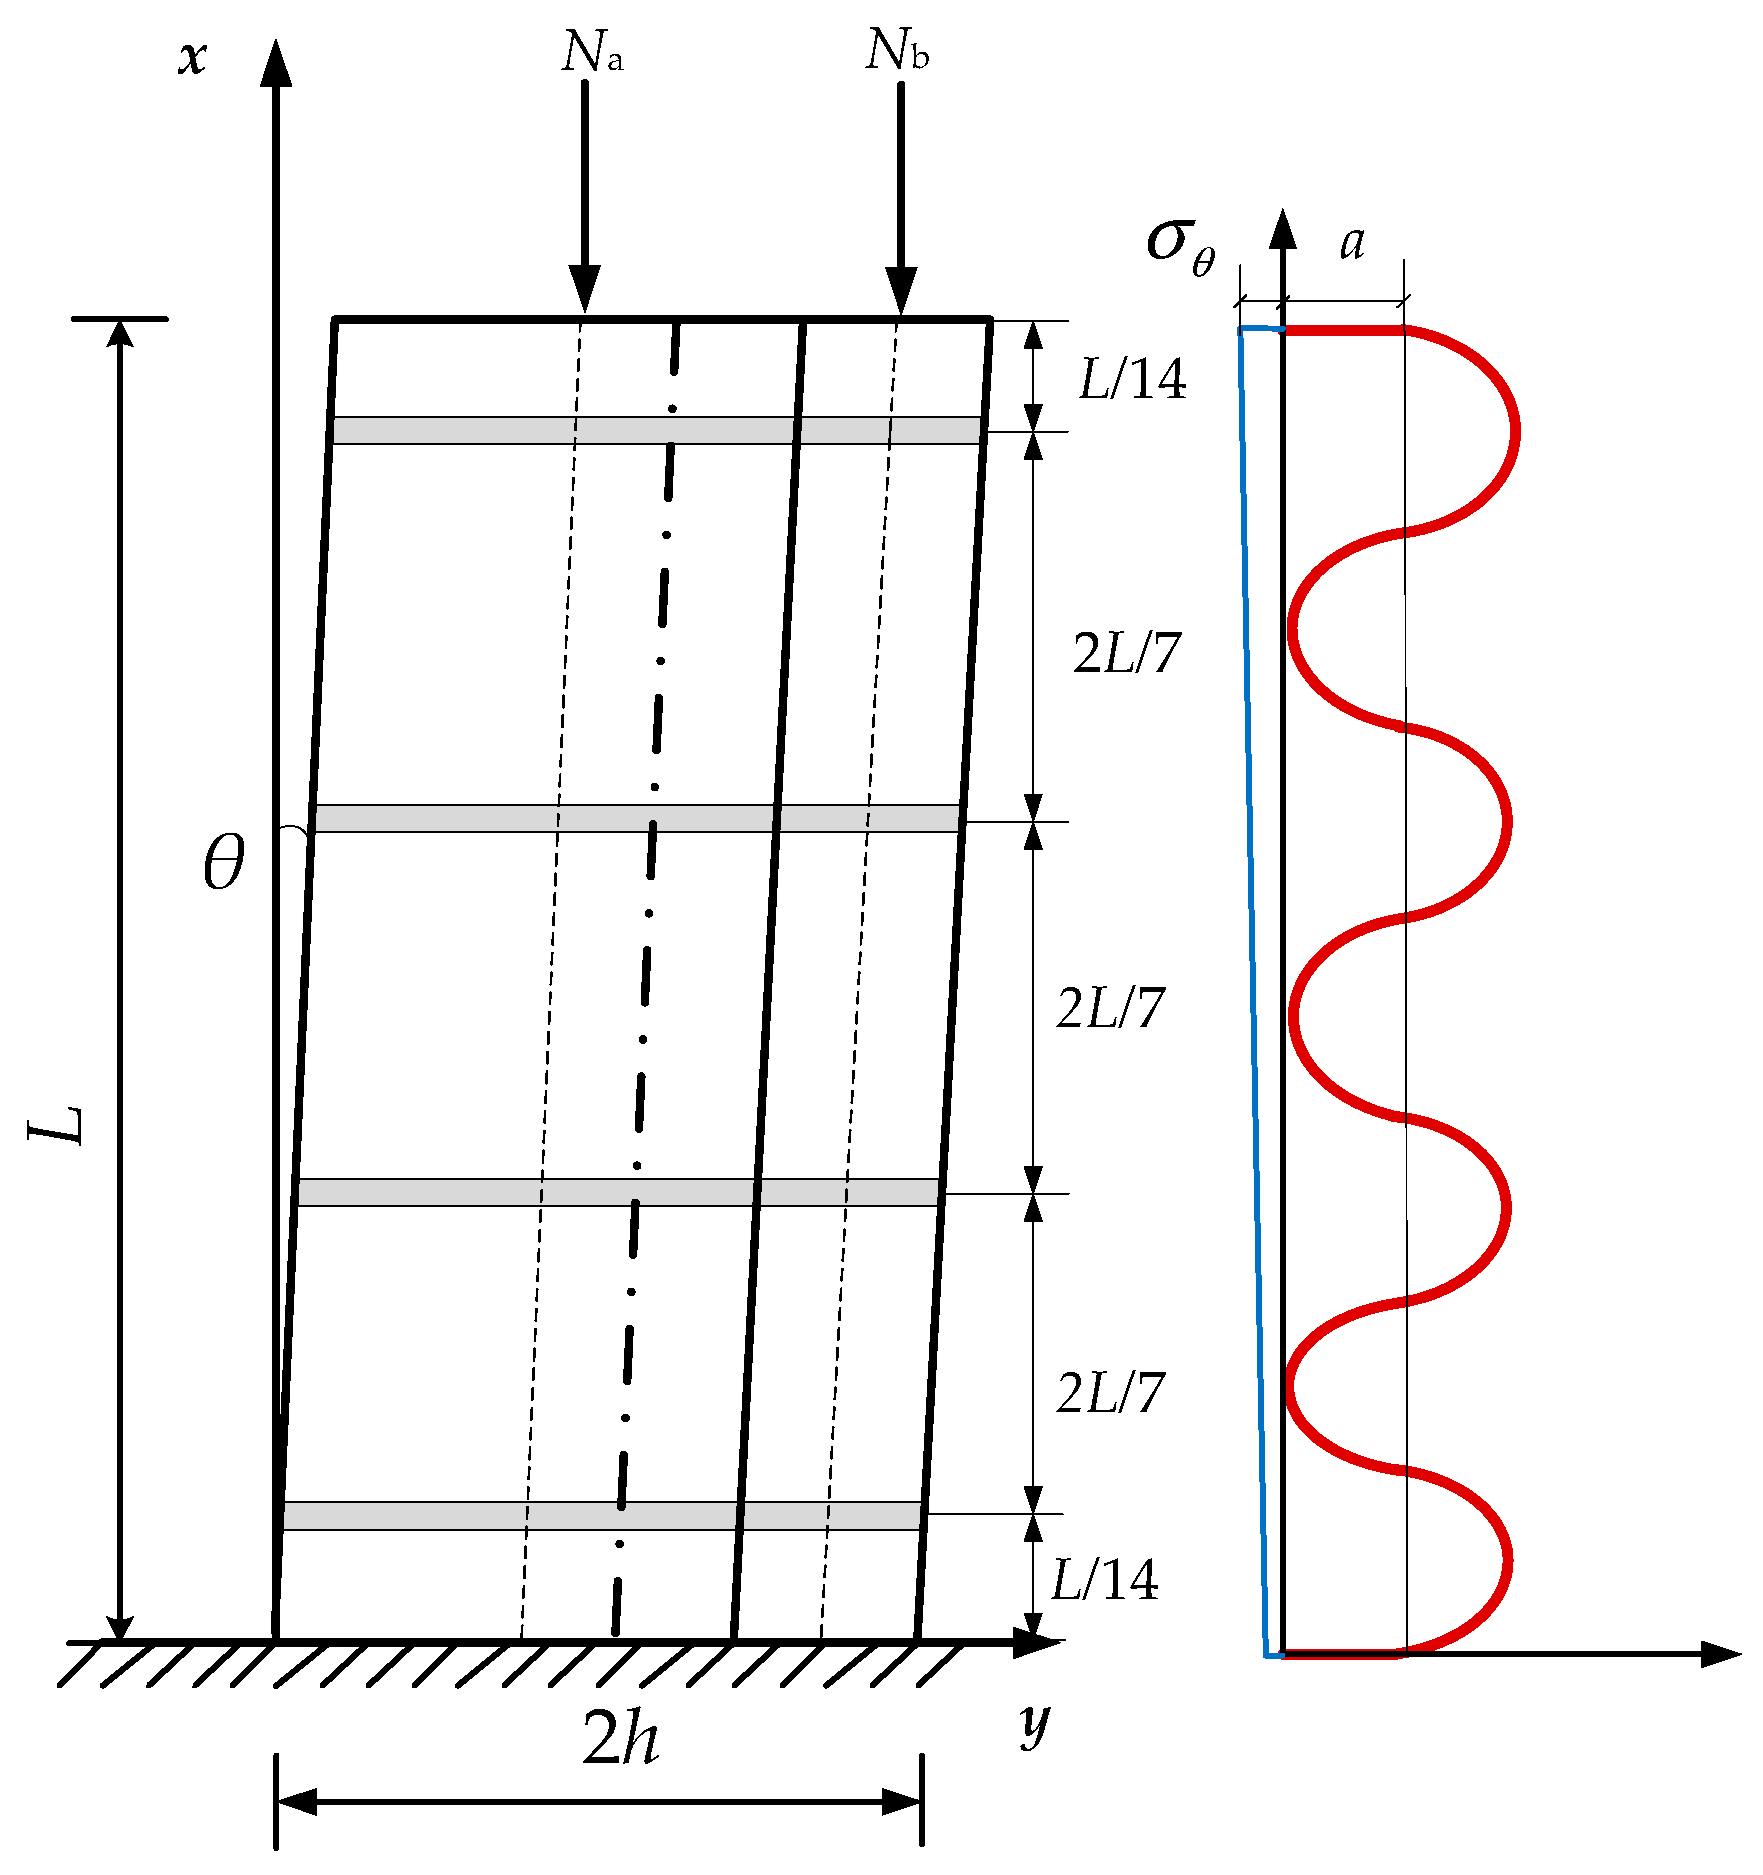
- The positive pressure that is produced by the iron hoops and applies to the interface is in a sinusoidal distribution and varies with the position and number of hoops.
- Under the action of a vertical load, N, there is only friction slip along the interface but no displacement that is perpendicular to the interface.
- On the non-sliding stage, the wood conforms to the plane section assumption.
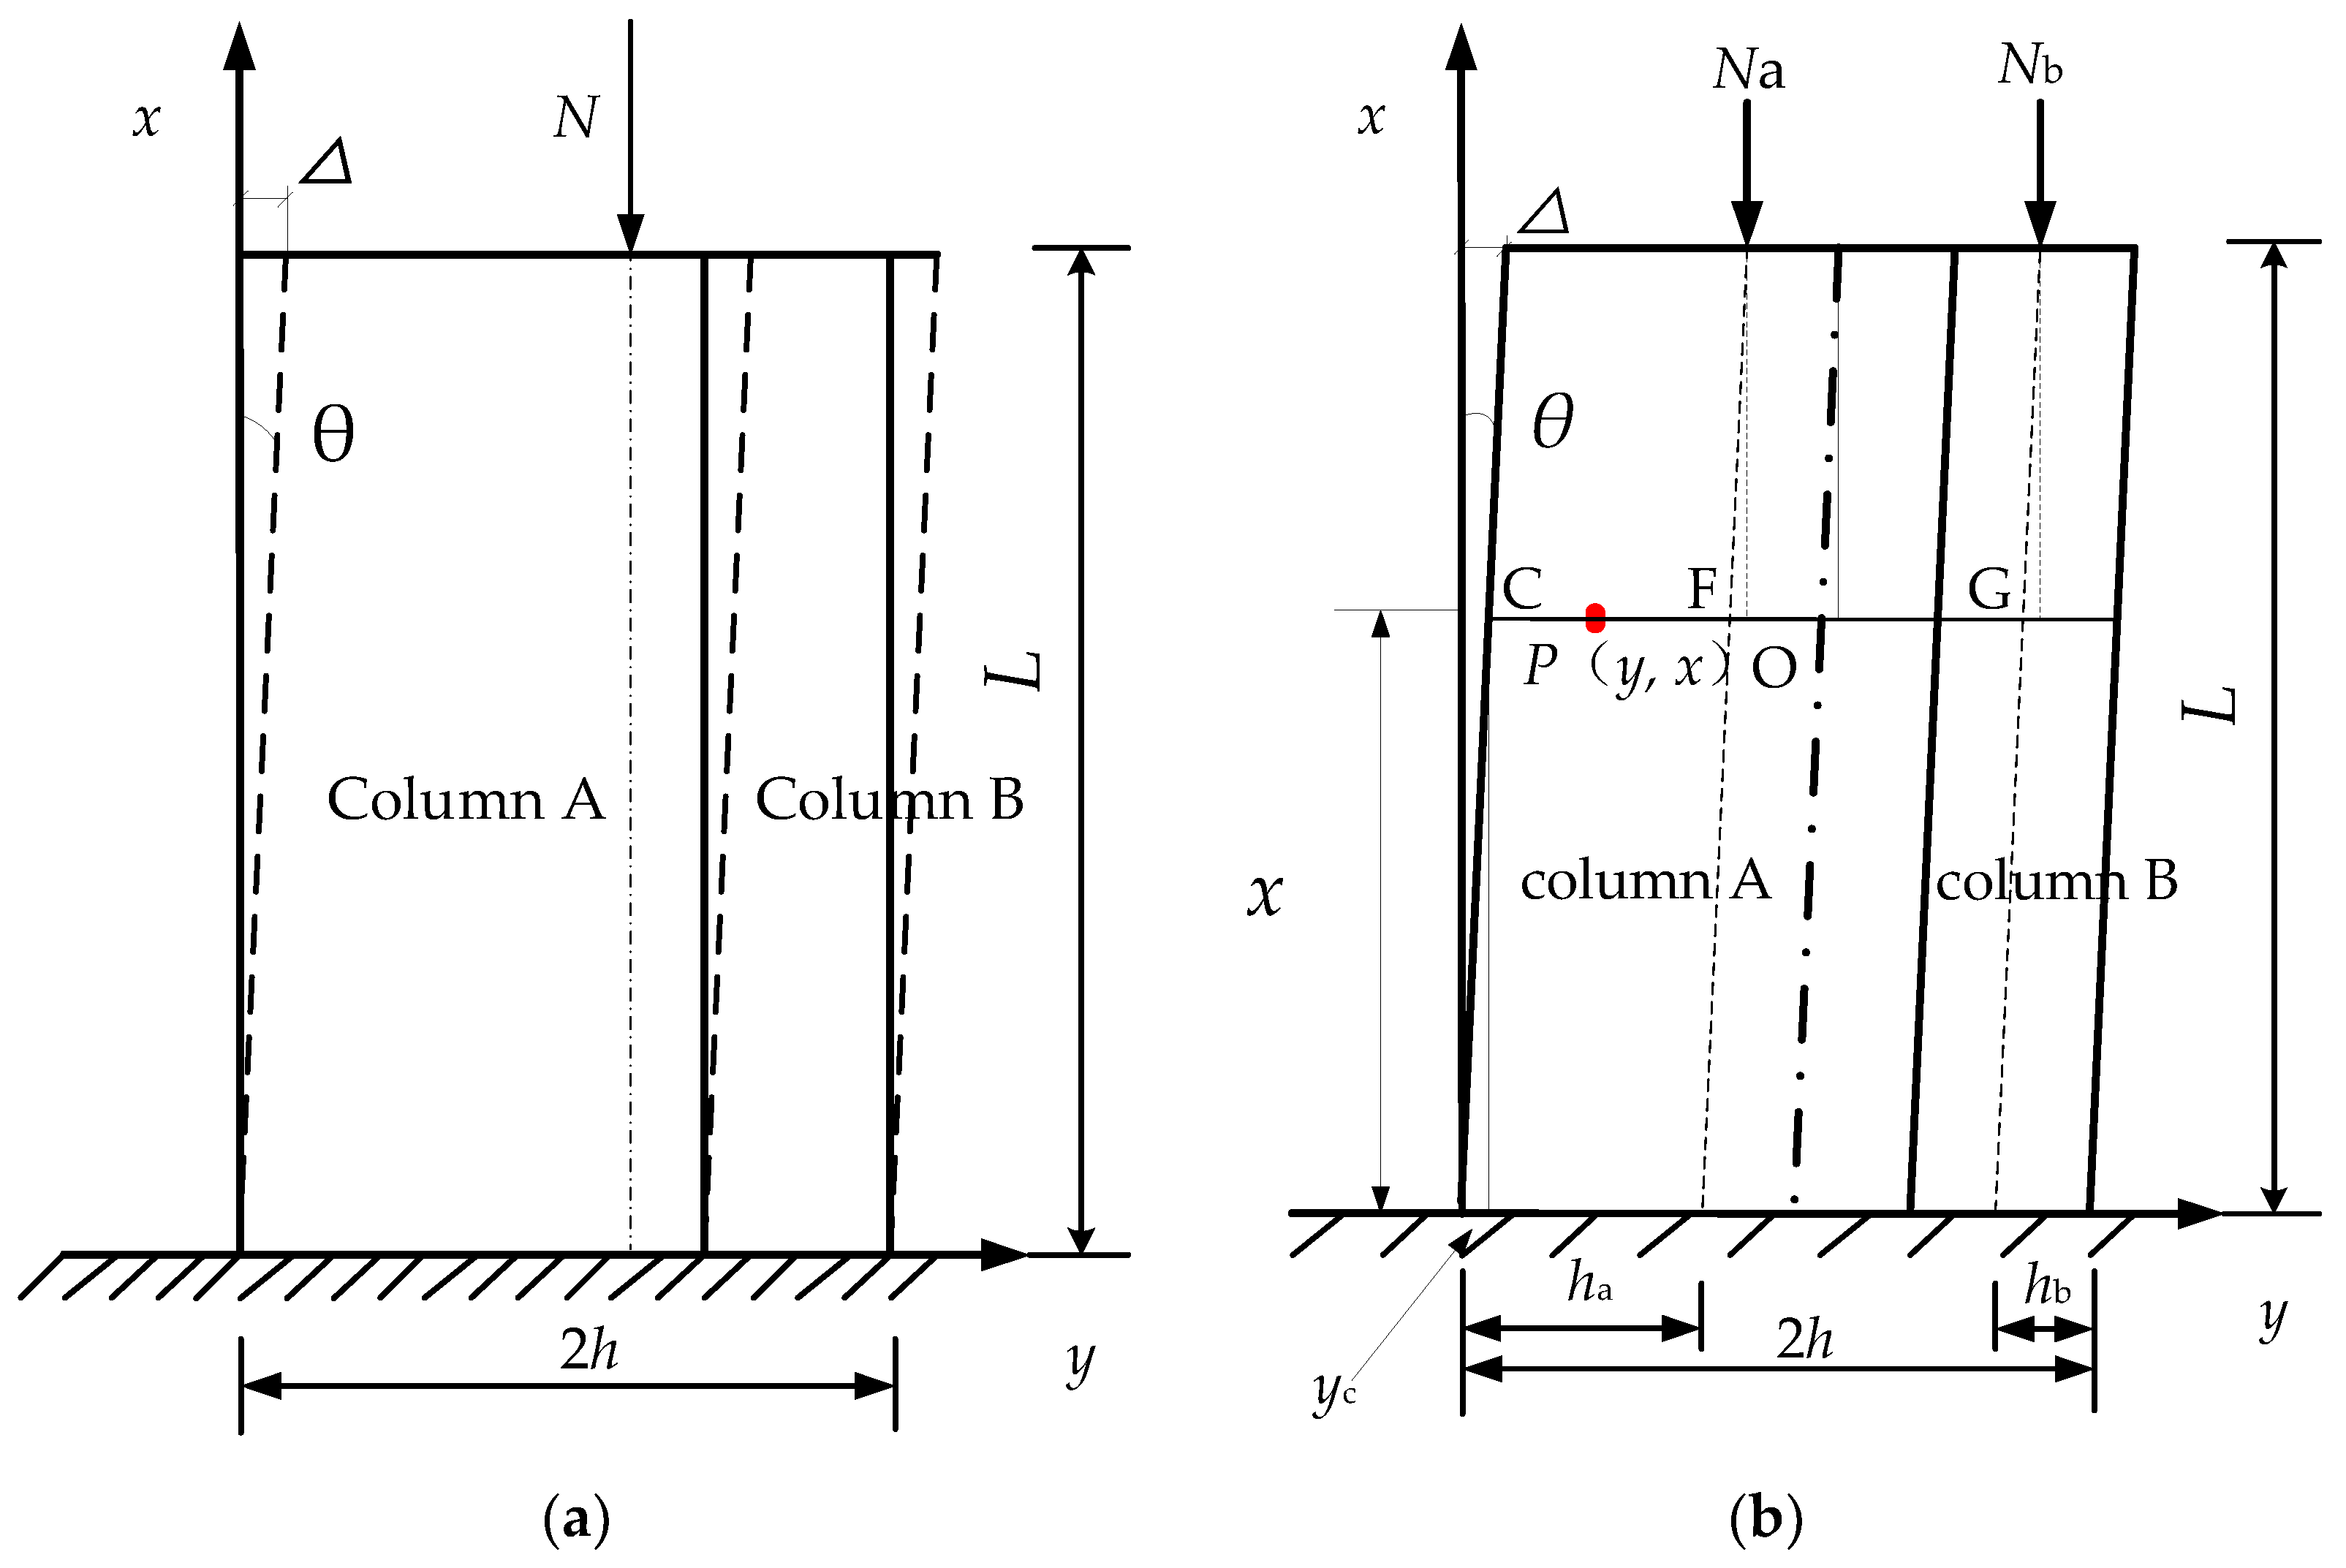
2.1.2. Vertical Stress Distribution at Any Point
2.1.3. Stress Distribution on the Interface
2.2. Mechanical Model of Unilateral Contact on the Interface under the Effect of Iron Hoops
2.2.1. The Sticky Stage
2.2.2. The Sliding Stage
3. The Shear Sliding Test of the Composite Timber Column’s Interface
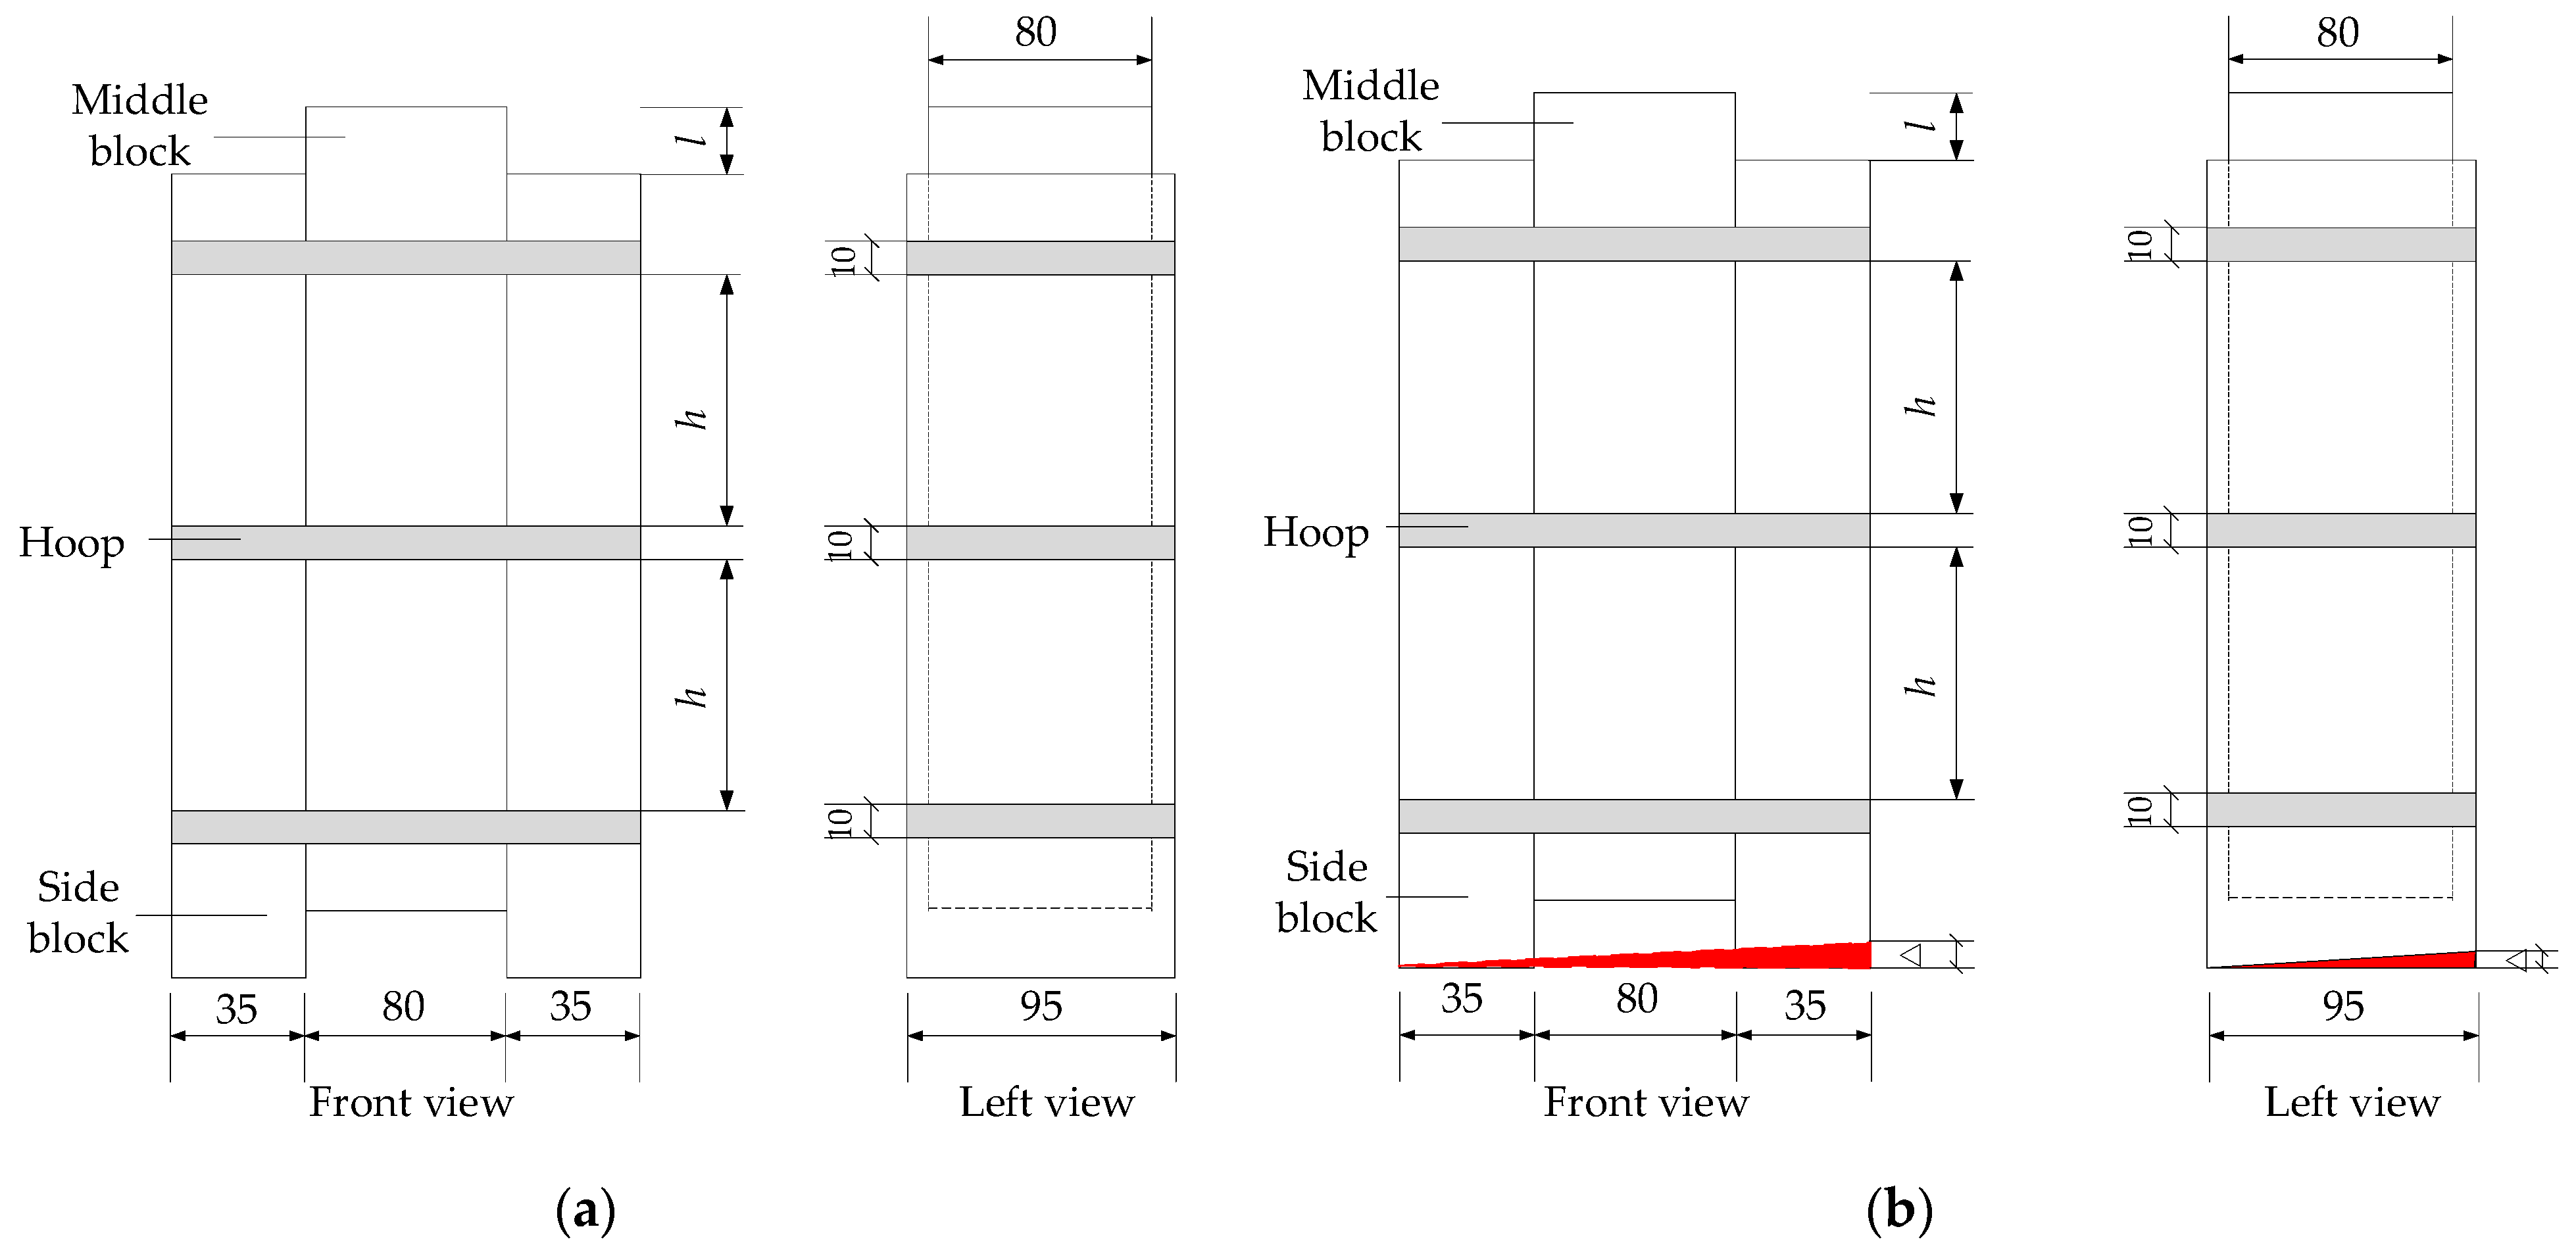
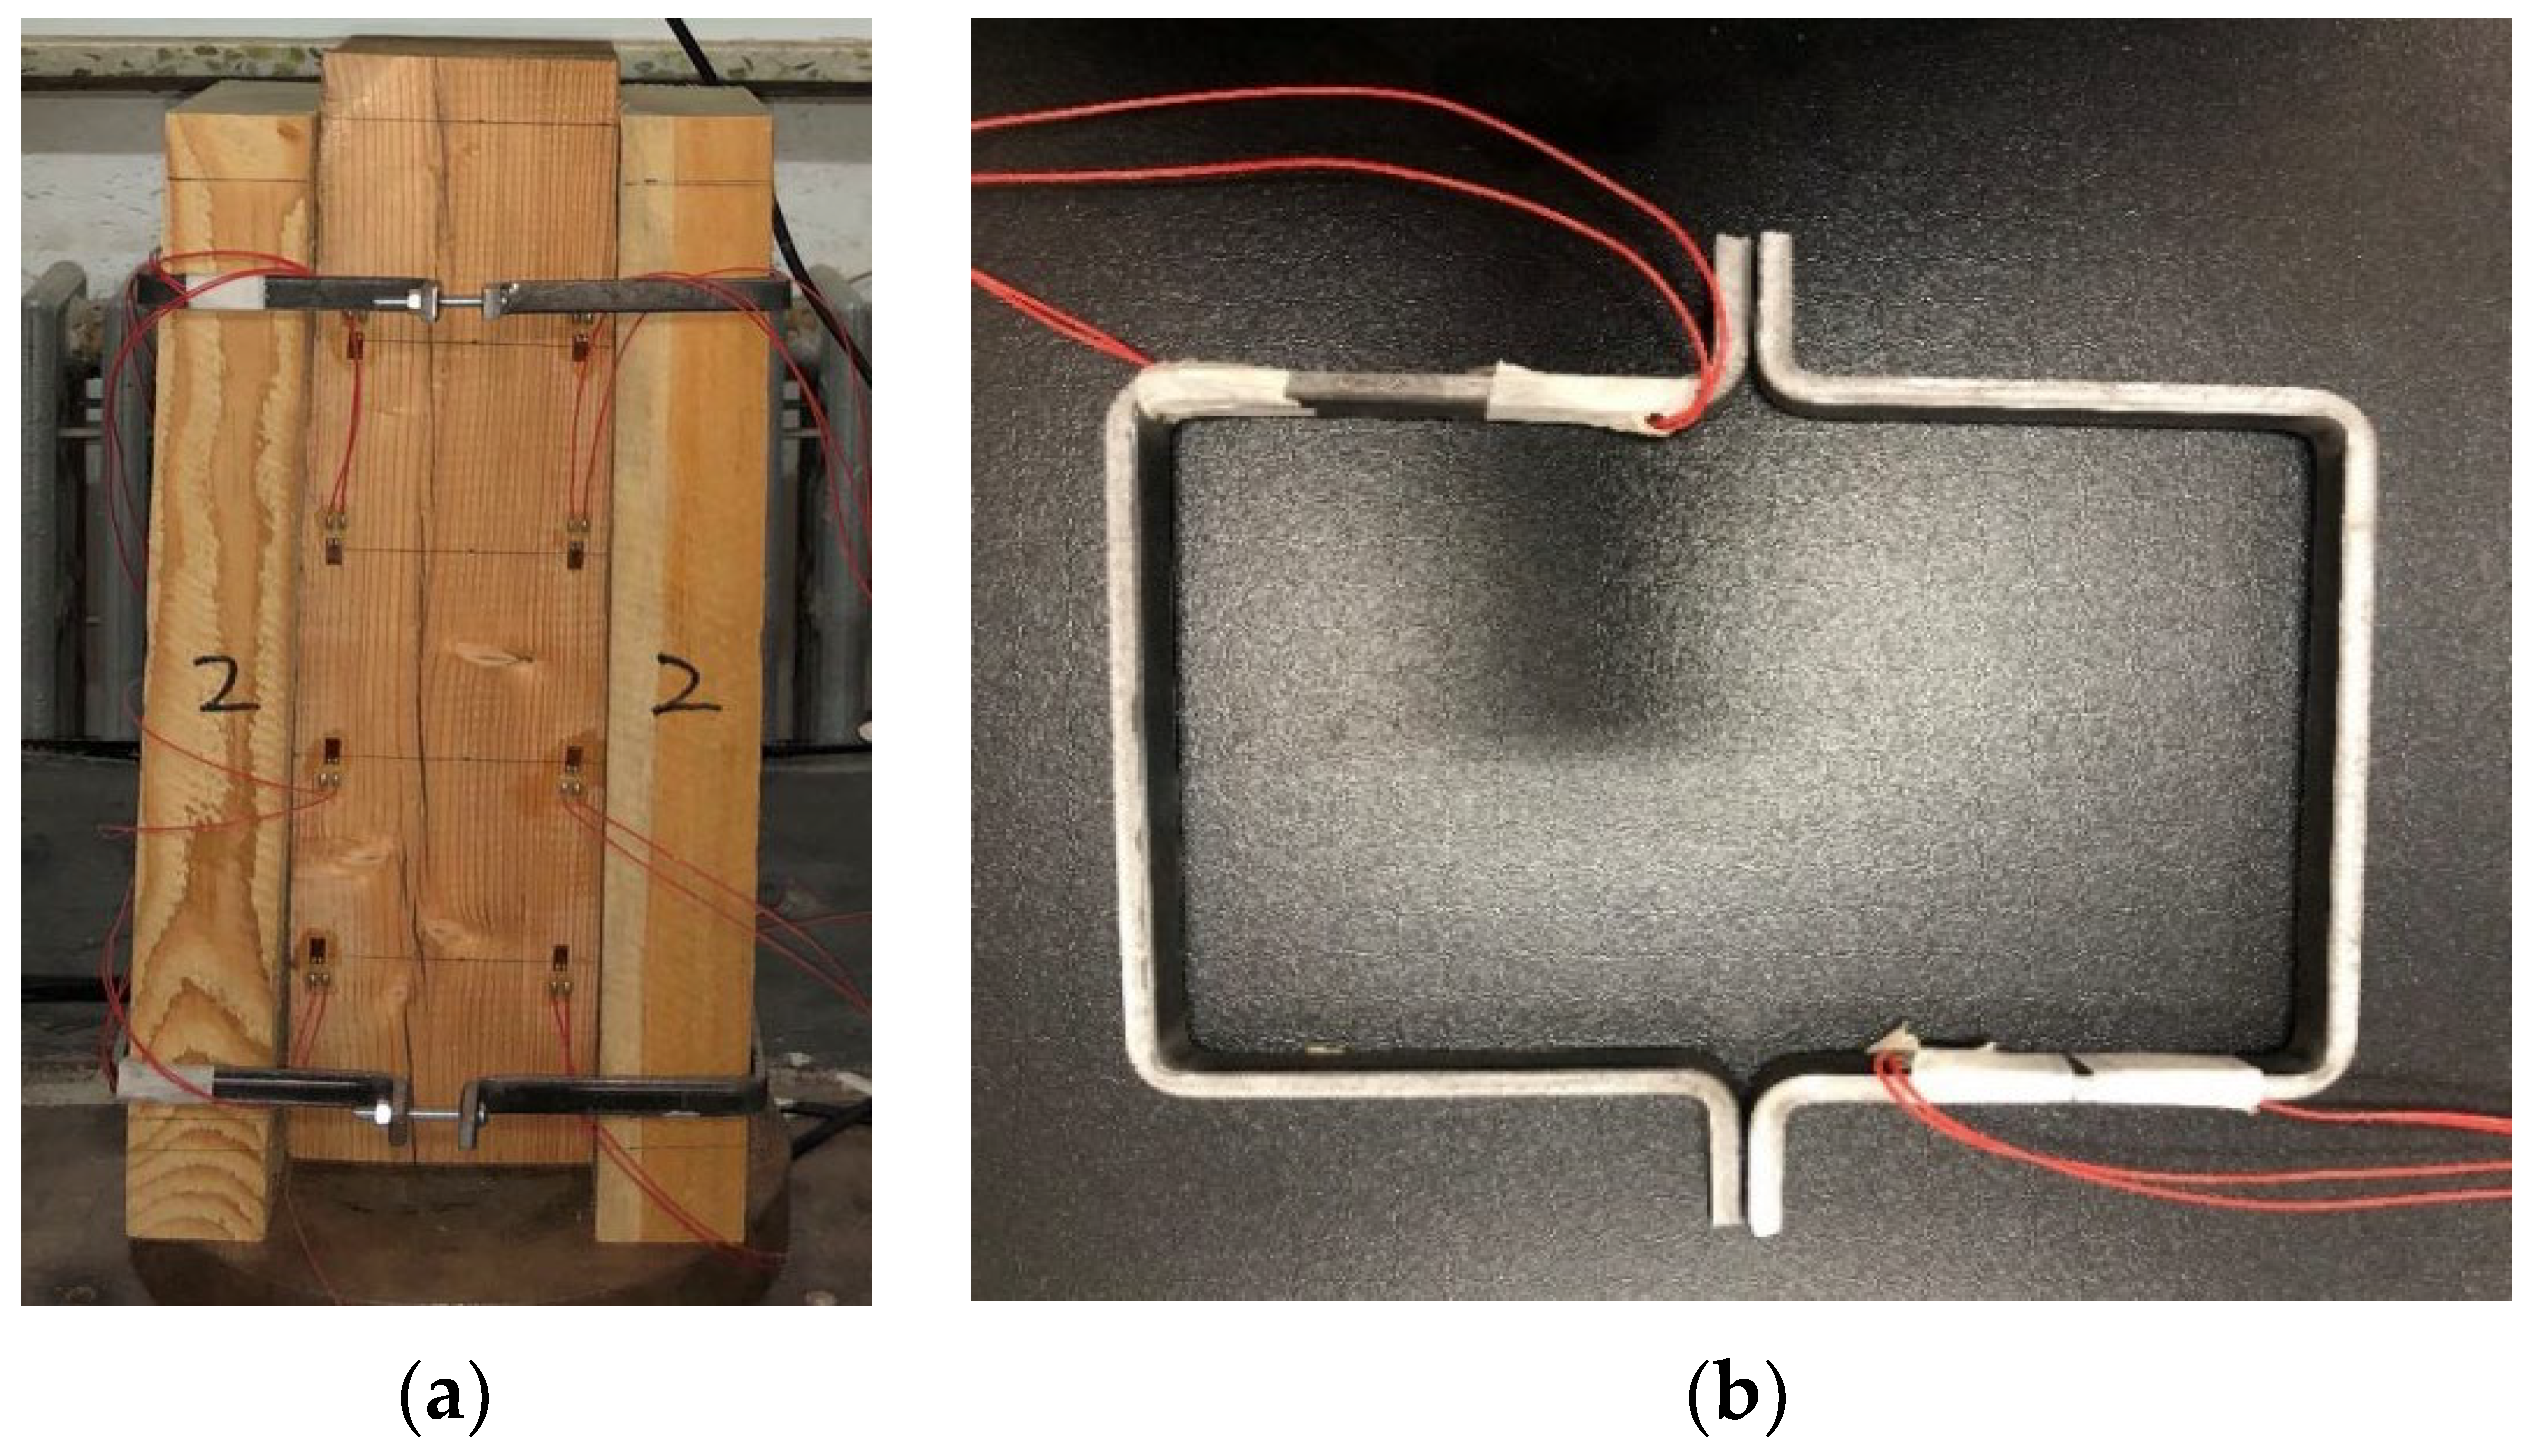
3.1. Specimens’ Design
3.2. Test Results and Discussion
3.2.1. Failure Mechanism
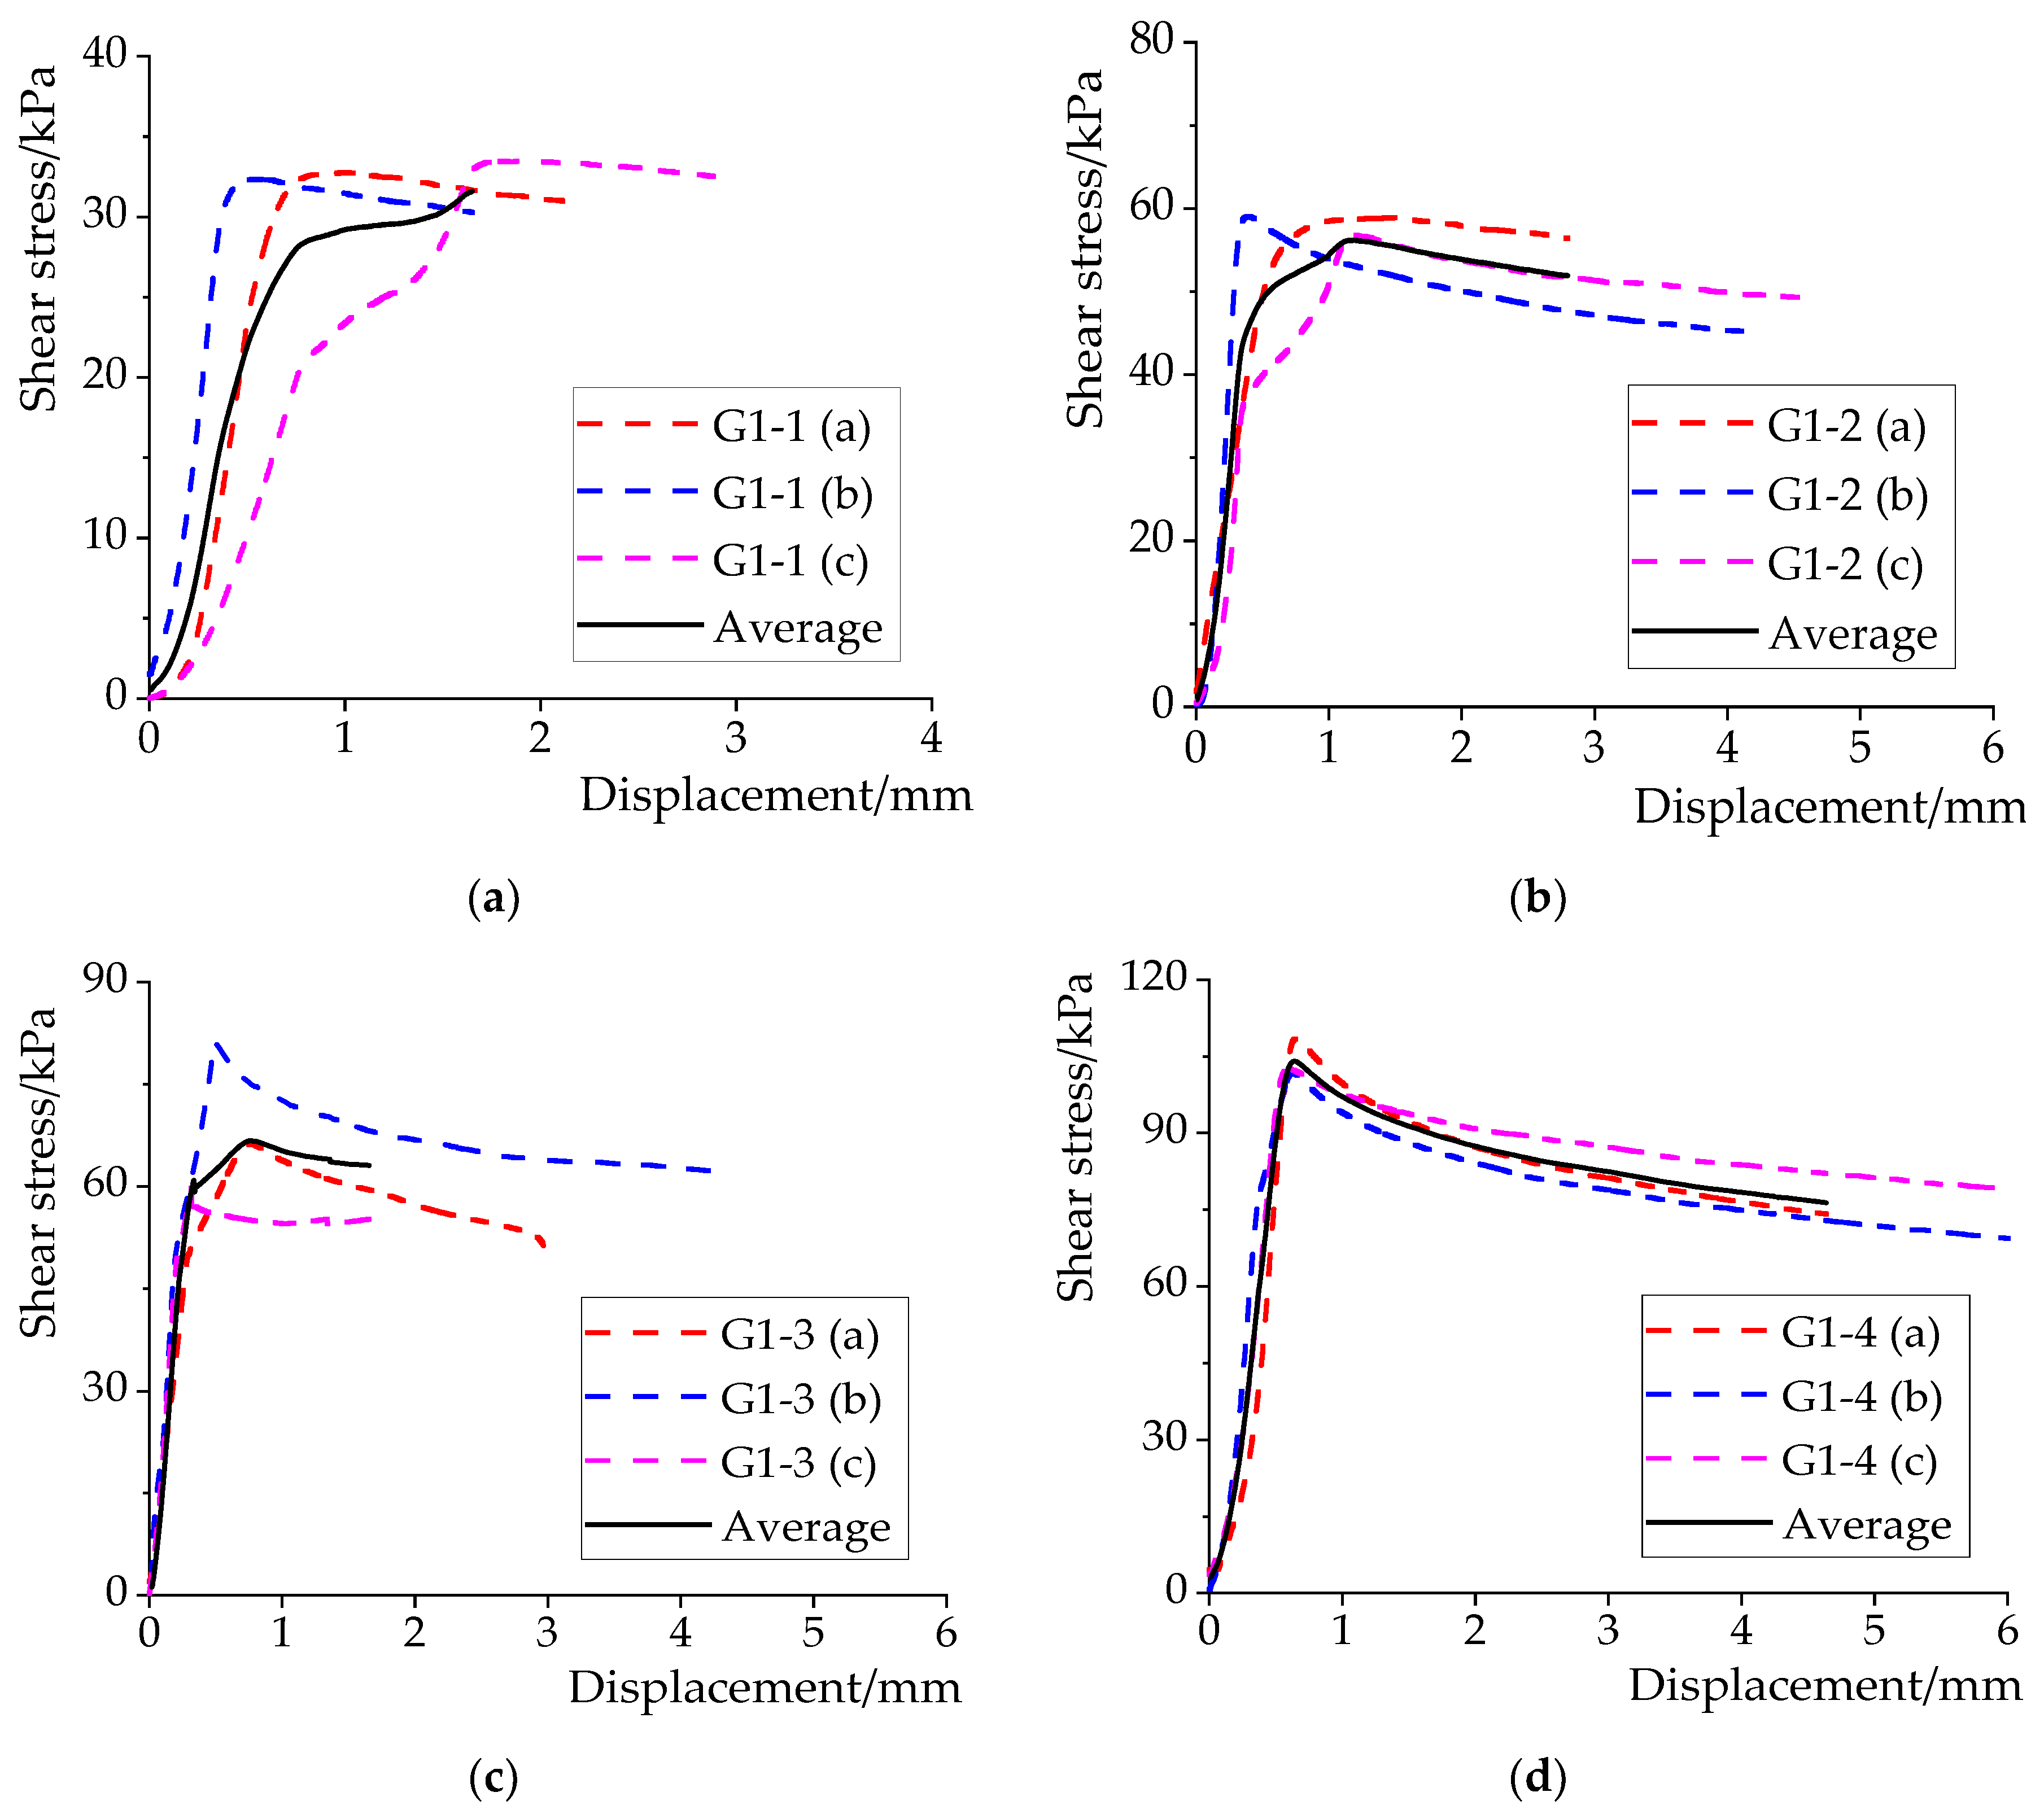
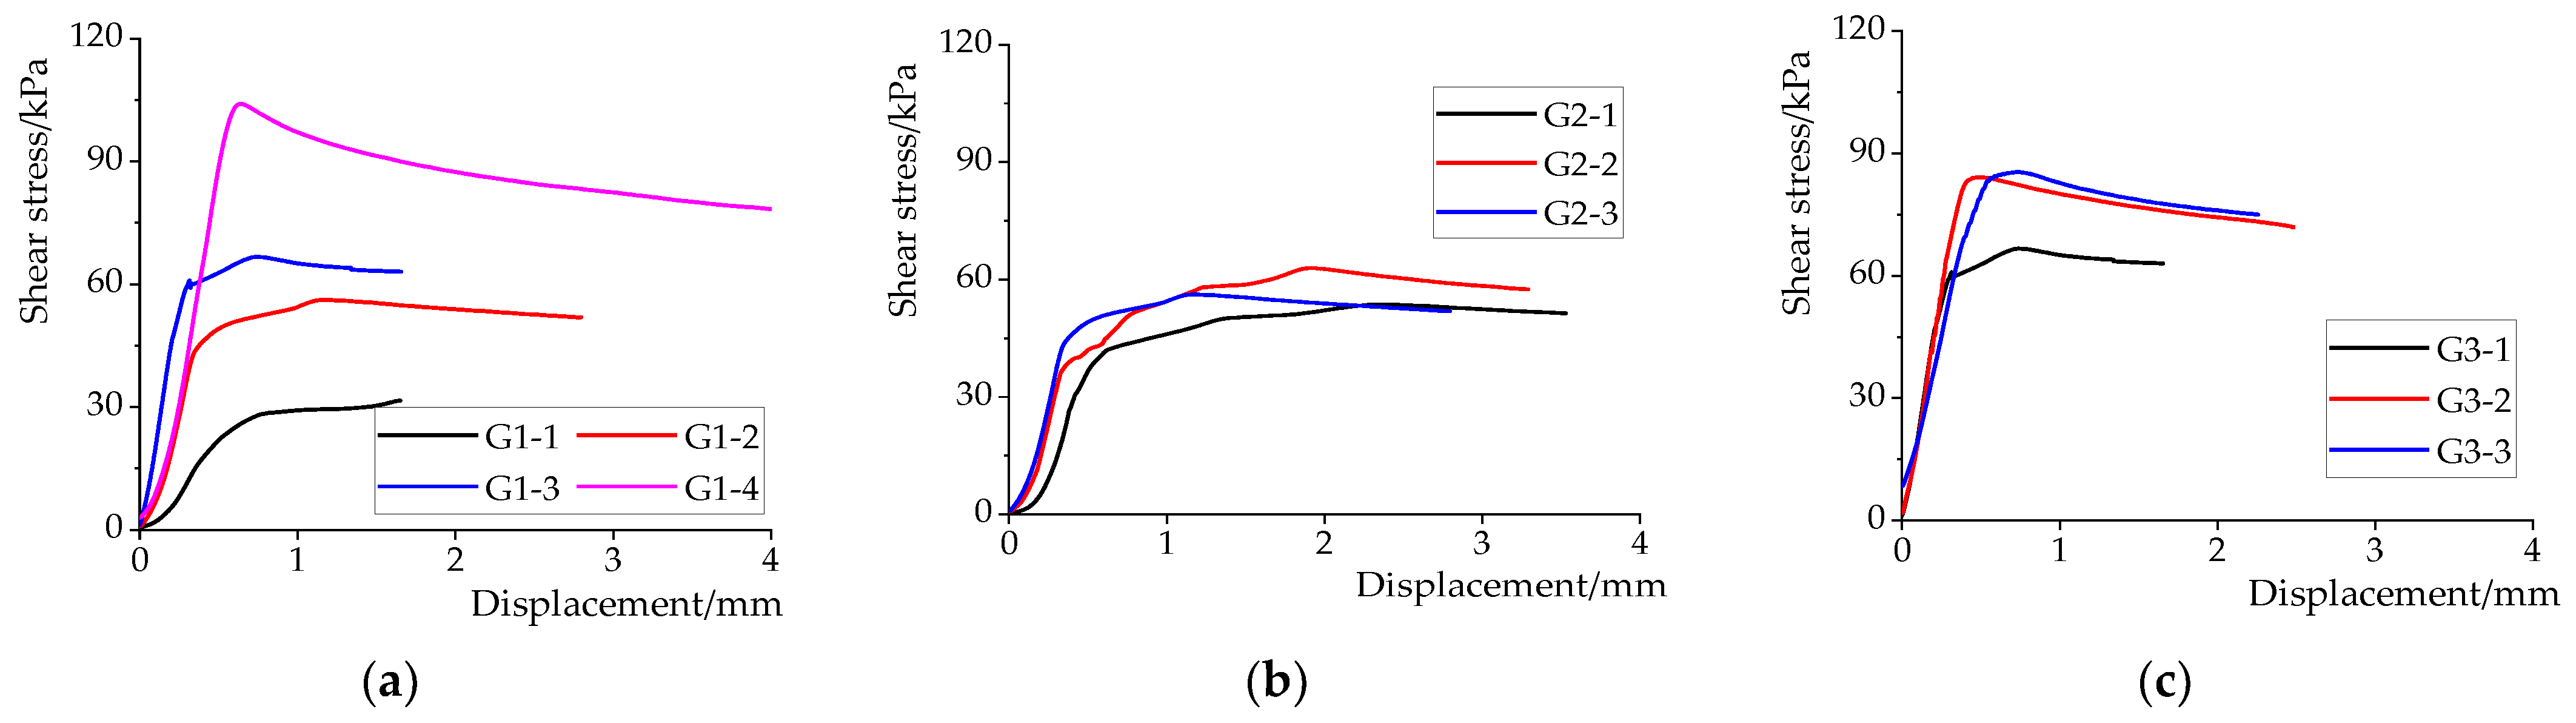
3.2.2. Parameter Analysis
- (1)
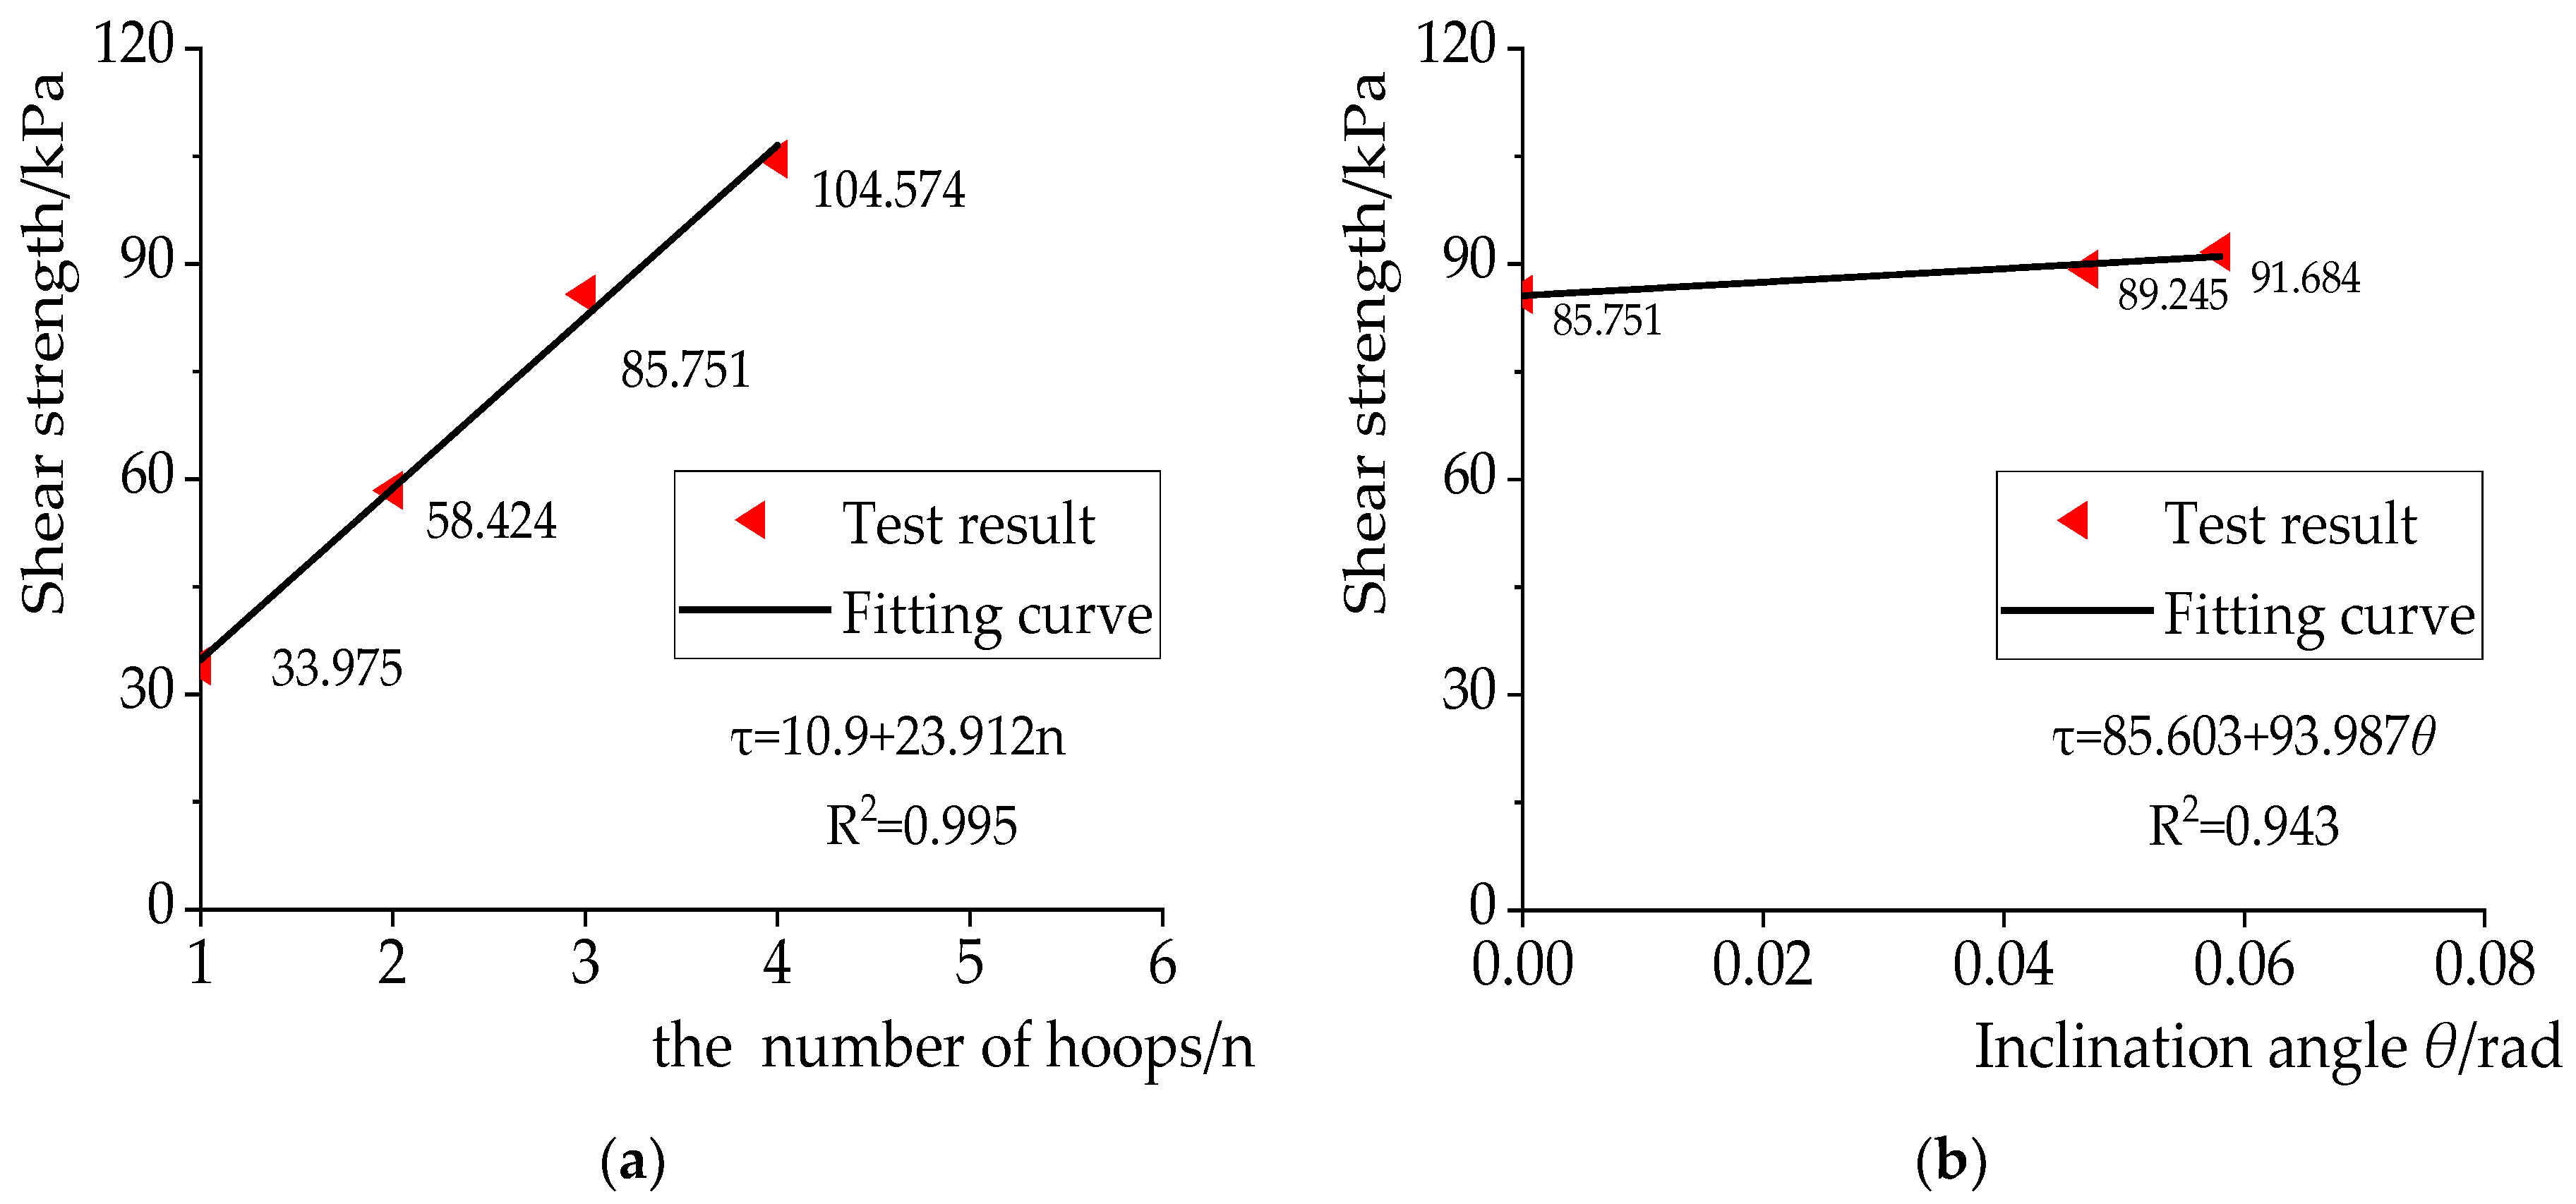
- The Effect of the Number of Iron Hoops
- (2)
- The Effect of the Spacing of the Iron Hoops
- (3)
- The Effect of the Inclination Angle of the Interface
4. Verification and Comparison of Theoretical and Experimental Results
4.1. Comparison of Results
4.2. Error Analysis
- In the actual ancient composite timber columns, the effect of the iron hoops on the interface is discontinuous. However, in the process of theoretical analysis, it is assumed that the positive pressure from the iron hoops on the interface is applied in a continuous sinusoidal distribution, an assumption which inevitably expands the influence range of the iron hoops on the interface, making the theoretical results of the positive pressure from the iron hoops greater than the test results. Thus, the inclination angle of the theoretical results is greater than that of the test results.
- The actual ultimate shear load of the interface is less than that of the theoretical result due to the size error (the gap between the interfaces) of the specimen and the material defects (the initial shrinkage cracks and knots of the wood).
5. Conclusions
- Based on the analysis of the slip characteristics of the interface, the limit inclination angle of the point slip and the limit inclination angle of the surface slip of the interface were obtained. According to this, a three-stage slip failure mode of the interface has been proposed: the fully sticky stage, the partially sticky stage and the sliding stage;
- Using the elastic mechanics equation, the sliding displacement in the sliding stage of the interface can be calculated by Equation (22) and the shear stiffness of the interface can be expressed by Equation (23);
- The number and the spacing of the iron hoops and the inclination angle of the interface were found to be the important factors affecting the shear strength of the interface. When the number of iron hoops n = 2, 3 and 4, the interfacial shear strength was 1.72 times, 2.52 times and 3.10 times that which was found when the number of iron hoops n = 1, respectively, indicating that increasing the number of iron hoops can improve the shear strength of the interface significantly. There is an optimal value of hoop spacing. If the spacing of the iron hoops is too large or too small, the shear strength of the interface cannot be improved effectively. Within a certain range of the inclination angle, the shear strength is positively correlated with the inclination angle of the interface.
Author Contributions
Funding
Institutional Review Board Statement
Informed Consent Statement
Data Availability Statement
Acknowledgments
Conflicts of Interest
References
- Pan, G.X.; He, J.Z. The Interpretation of Yingzaofashi; Southeast University Press: Nanjing, China, 2005; pp. 66–68. [Google Scholar]
- Yang, X.B.; Wang, J.J.; Chen, Q.; Wang, Z.F. Study on axial compression performance of hollow glulam columns. J. Cent. South Univ. For. Tech. 2020, 40, 153–159. [Google Scholar]
- Zeng, D.; Zhou, X.Y.; Cao, L. Research on the mechanical properties of larch glulam column under axial compression. Indust. Constr. 2016, 46, 63–67, 71. [Google Scholar]
- Chen, Y.P.; Wang, T.L.; Liu, X.Y.; Yu, R.L. Preliminary Study on the Melon-Shaped Column Structure in the Grand Hall of Ningbo Baoguo Temple. Sci. Silv. Sin. 2011, 47, 135–140. [Google Scholar]
- Chen, D.; Xiong, H.B.; Liu, Z.H. Experimental Research on Axial Compressive Property of Built-up Columns in Modern Timber Constructions. Struct. Eng. 2011, 27, 206–211. [Google Scholar]
- An, H. Mechanical Performance of Built-up Columns Assembled with Compressed Wood Dowels under Axial Compression. Master’s Thesis, University of Technology, Dalian, China, 2021. [Google Scholar]
- Zhou, S.Z. Study on ultimate bearing capacity of eccentrically compressed wood members. J. Chongqing Jianzhu Univ. 1996, 18, 61–76, 109. [Google Scholar]
- Chang, P.; Hu, Y.C.; Wang, J.J.; Wang, Z. Analytical solution of normal section compressive stress and bearing capacity of ancient timber column semi-rigid connection joints influenced by cumulative deformation. J. Beijing Jiaotong Univ. 2018, 42, 44–50. [Google Scholar]
- Song, X.B.; Lam, F. Laterally braced wood beam-columns subjected to biaxial eccentric loading. Comput. Struct. 2009, 87, 1058–1066. [Google Scholar] [CrossRef]
- Theiler, M.; Frangi, A.; Steiger, R. Strain-based calculation model for centrically and eccentrically loaded timber columns. Eng. Struct. 2013, 56, 1103–1116. [Google Scholar] [CrossRef]
- Schnabl, S.; Planinc, I. The influence of boundary conditions and axial deformability on buckling behavior of two-layer composite columns with interlayer slip. Eng. Struct. 2010, 32, 3103–3111. [Google Scholar] [CrossRef] [Green Version]
- Schnabl, S.; Planinc, I. Inelastic buckling of two-layer composite columns with non-linear interface compliance. Int. J. Mech. Sci. 2011, 53, 1077–1083. [Google Scholar] [CrossRef] [Green Version]
- Kryžanowski, A.; Schnabl, S.; Turk, G.; Planinc, I. Exact slip-buckling analysis of two-layer composite columns. Int. J. Solids Struct. 2009, 46, 2929–2938. [Google Scholar] [CrossRef] [Green Version]
- Girhammar, U.A.; Pan, D.H. Exact static analysis of partially composite beams and beam-columns. Int. J. Mech. Sci. 2006, 49, 239–255. [Google Scholar] [CrossRef]
- Girhammar, U.A.; Gopu, V.K.A. Composite beam-columns with Interlayer slip-exact analysis. J. Struct. Eng. 1993, 119, 1265–1282. [Google Scholar] [CrossRef]
- Cao, P.L.; Yang, Q.S.; Law, S.S. Nonlinear analytical model of a two-layer wooden beam in a heritage structure. Eng. Struct. 2015, 101, 494–508. [Google Scholar] [CrossRef]
- Kroflič, A.; Planinc, I.; Saje, M.; Turk, G.; Čas, B. Non-linear analysis of two-layer timber beams considering interlayer slip and uplift. Eng. Struct. 2010, 32, 1617–1630. [Google Scholar] [CrossRef] [Green Version]
- Yang, X.J.; Sun, Y.F.; Wang, Z. Study on effective bond length between CFRP sheets and fast-growing wood (Larix olgensis, Cunninghamia lanceolata). J. Northwest Sci.-Tech. Univ. Agric. For. Nat. Sci. Ed. 2011, 39, 101–106. [Google Scholar]
- Han, Q. Study on Bond-Slip Mechanism of CFRP-Concrete Interface. Ph.D. Thesis, South China University of Technology, Guangzhou, China, 2010. [Google Scholar]
- Sun, J.G.; Gu, Y.L.; Yin, Q.Y. Study on the influence factors of bonding properties of CFRP-concrete interface based on double-shear test. China Concr. Cem. Prod. 2018, 9, 77–80. [Google Scholar]
- Gong, J.; Zou, X.; Xia, P. Experimental Investigation of the Natural Bonding Strength between Stay-In-Place Form and Concrete in FRP-Concrete Decks/Beams. Appl. Sci. 2019, 9, 913. [Google Scholar] [CrossRef] [Green Version]
- Anonymous. Wooden Structure Design Manual, 3rd ed.; China Architecture & Building Press: Beijing, China, 2021; pp. 16–18. [Google Scholar]


| Test Group Number | Parameter | Number of Iron Hoops | Number of Specimens | Spacing of Iron Hoops | Inclination Angle/° |
|---|---|---|---|---|---|
| 1-1 | Number of iron hoops | 1 | 3 * | / | 0 |
| 1-2 | 2 | 3 | 260 mm | 0 | |
| 1-3 | 3 | 3 | 125 mm | 0 | |
| 1-4 | 4 | 3 | 80 mm | 0 | |
| 2-1 | Spacing of iron hoops | 2 | 3 | 0 mm | 0 |
| 2-2 | 2 | 3 | 170 mm | 0 | |
| 2-3 | 2 | 3 | 260 mm | 0 | |
| 3-1 | Inclination angle | 3 | 3 | 125 mm | 0 |
| 3-2 | 3 | 3 | 125 mm | 2.79 | |
| 3-3 | 3 | 3 | 125 mm | 3.55 |
| Parameter | Specimen Number | Parameter Value | Ultimate Shear Load P/kN | ||
|---|---|---|---|---|---|
| Number of iron hoops | G1-1 (a) | 1 | 1.651 | 32.474 | 33.975 |
| G1-1 (b) | 1.762 | 34.657 | |||
| G1-1 (c) | 1.769 | 34.795 | |||
| G1-2 (a) | 2 | 2.896 | 56.962 | 58.424 | |
| G1-2 (b) | 3.004 | 59.086 | |||
| G1-2 (c) | 3.011 | 59.224 | |||
| G1-3 (a) | 3 | 4.569 | 89.868 | 85.751 | |
| G1-3 (b) | 4.385 | 86.249 | |||
| G1-3 (c) | 4.125 | 81.135 | |||
| G1-4 (a) | 4 | 5.183 | 101.945 | 104.574 | |
| G1-4 (b) | 5.232 | 102.909 | |||
| G1-4 (c) | 5.535 | 108.869 | |||
| Spacing of iron hoops | G2-1 (a) | 0 mm | 2.389 | 46.990 | 56.398 |
| G2-1 (b) | 2.898 | 57.001 | |||
| G2-1 (c) | 3.315 | 65.203 | |||
| G2-2 (a) | 170 mm | 3.196 | 62.863 | 65.360 | |
| G2-2 (b) | 3.309 | 65.085 | |||
| G2-2 (c) | 3.464 | 68.134 | |||
| G2-3 (a) | 260 mm | 2.896 | 56.962 | 58.424 | |
| G2-3 (b) | 3.004 | 59.086 | |||
| G2-3 (c) | 3.011 | 59.224 | |||
| Inclination angle | G3-1 (a) | 0° | 4.125 | 81.135 | 85.751 |
| G3-1 (b) | 4.385 | 86.249 | |||
| G3-1 (c) | 4.569 | 89.868 | |||
| G3-2 (a) | 2.79° | 4.280 | 84.184 | 89.245 | |
| G3-2 (b) | 4.467 | 87.862 | |||
| G3-2 (c) | 4.865 | 95.690 | |||
| G3-3 (a) | 3.55° | 4.452 | 87.567 | 91.684 | |
| G3-3 (b) | 4.567 | 89.829 | |||
| G3-3 (c) | 4.965 | 97.657 |
| Group Number | Error | Error | ||||
|---|---|---|---|---|---|---|
| Test Result | Theoretical Result | Test Setting | Theoretical Result | |||
| 3-2 | 89.245 | 79.372 | 11.1% | 2.79 | 3.21 | 15.1% |
| 3-3 | 91.684 | 80.843 | 11.8% | 3.55 | 3.84 | 8.2% |
Publisher’s Note: MDPI stays neutral with regard to jurisdictional claims in published maps and institutional affiliations. |
© 2022 by the authors. Licensee MDPI, Basel, Switzerland. This article is an open access article distributed under the terms and conditions of the Creative Commons Attribution (CC BY) license (https://creativecommons.org/licenses/by/4.0/).
Share and Cite
Chang, P.; Feng, Q.; Wu, N.; Yang, N. Research on Interface Slip Characteristics of Heritage Composite Timber Columns under Inclined Deformation. Appl. Sci. 2022, 12, 7351. https://doi.org/10.3390/app12147351
Chang P, Feng Q, Wu N, Yang N. Research on Interface Slip Characteristics of Heritage Composite Timber Columns under Inclined Deformation. Applied Sciences. 2022; 12(14):7351. https://doi.org/10.3390/app12147351
Chicago/Turabian StyleChang, Peng, Qiuge Feng, Nannan Wu, and Na Yang. 2022. "Research on Interface Slip Characteristics of Heritage Composite Timber Columns under Inclined Deformation" Applied Sciences 12, no. 14: 7351. https://doi.org/10.3390/app12147351