Abstract
There are various types of autonomous unmanned systems, covering different spaces of sea, land, and air, and they are comprehensively going deep into multiple fields of national security and social life. Due to the development of technology, the scale of unmanned systems is getting larger and larger, the number of components in the system is increasing, and the operating environment of the system is also becoming more and more complex. Therefore, the probability of failure of the components of the system will also be significantly increased. In order to eliminate the impact of the fault in time, the fault diagnosis method is significant. Considering the differences of components in autonomous unmanned systems, if a specific fault diagnosis algorithm is designed for each type of component, it will bring difficulties to the coordinated control of the system. Therefore, this paper analyzes the data characteristics of unmanned autonomous system devices (such as sensors) and finds that these data have time series. Therefore, the data of different devices can be converted into time series, and a general fault diagnosis algorithm suitable for most devices can be studied. The fault diagnosis algorithm is based on the clustering algorithm. In order to improve the clustering effect, the time series of different devices are represented by Gaussian mixture clustering to reduce the computational complexity of the clustering calculation. Then, a time series similarity measurement method based on the improved Markov chain is proposed. This method can better distinguish normal samples from abnormal samples so as to classify and identify faults effectively.
1. Introduction
The unmanned system consists of a single or multiple unmanned platforms, which can complete designated tasks autonomously or through remote control. The system is highly integrated with mechanization, information, and intelligent platforms to form a smart unmanned system, including a single unmanned aerial vehicle, unmanned vehicles, unmanned ships, unmanned submersibles, and other typical objects.
In order to ensure the reliable execution of the tasks of the multi-unmanned system, it is necessary to pay attention to all aspects of the work of the multi-unmanned system and ensure the safety of each part for overall safety. The autonomous fault monitoring and fault-tolerant control of multiple unmanned systems is a hot research topic at home and abroad. Compared with the traditional single-control system, considering the scale and complexity of the multi-unmanned system, the multi-agent system lacks a central node to coordinate the overall behavior of the system. As a result, the failure of a single node can easily spread to the whole system through the coordination and cooperation between nodes, bringing severe challenges to the system security.
Reference [1] designs a fault estimator that satisfies the hybrid passive/H∞ performance index for stochastic multi-agent systems with unknown actuator offset faults and partial actuator failure faults. Reference [2] proposes a fault-tolerant tracking control design method based on LMI technology and Lyapunov stabilization method, which is applied to aircraft with sensor failures so that for disturbances and sensor failures, the closed-loop system is asymptotically stable at a given disturbance attenuation level. Reference [3] uses Kirsch operator and a deep convolutional neural network to identify abnormal areas of photovoltaic modules, extract defect features, and then use a multi-class support vector machine for defect detection. Reference [4] performs interval sampling and reconstruction of the surface vibration acceleration signals of the rotor UAV under different flight states. It then uses a one-dimensional convolutional neural network (1D-CNN) to perform the reconstruction. Fault identification can effectively identify different or weak fault types with slight differences. Reference [5] applies the transfer learning algorithm based on a convolutional neural network to the fault diagnosis of MEMS inertial sensor of unmanned aerial vehicle, improving the fault classification performance. Reference [6] proposed a credit assignment-based fuzzy cerebellar model articulation controller (FCA-CMAC) neural network information fusion model. The model is used as an estimator for unknown continuous faults, and the proposed fault identification method can diagnose thrusters’ continuous, uncertain, and novel failure modes. The heading angle sensor (compass) signal, the yaw rate, and the control signal are used as the input of the FCA-CMAC, and the fault diagnosis results are obtained through offline training. Reference [7] utilizes the characteristics of parallel processing and highly self-organizing and self-learning information of a fuzzy neural network to diagnose the diesel engine of unmanned cabin, overcoming the limitation of a single system and obtaining better fault diagnosis results. Reference [8] proposes a fault diagnosis strategy for induction motors based on support vector machine (SVM) multi-classification. Fault features extracted from electrical and mechanical diagnostic media are used as input to the support vector machine, which performs feature data fusion.
The above study shows that most of the existing fault intelligent diagnosis methods are diagnosis algorithms for a specific target, such as an oil cylinder, partial actuator, etc., and the algorithms are designed using its characteristics (e.g., physical characteristics, electrical characteristics). Therefore, each algorithm has different assumptions and applicable objects and lacks universality. However, there are many types of equipment in autonomous unmanned systems, and their characteristics are also different. If each equipment adopts different fault diagnosis algorithms, it will cause great difficulties for the system’s autonomous fault diagnosis and algorithm integration. Therefore, it is important to design a general fault diagnosis algorithm suitable for most equipment.
The completion of autonomous unmanned systems missions is usually based on time, and the sampled equipment data have a strong dependence on time. Time series refers to a dataset in which the data are sorted according to the order of generation time. The recorded data are the monitoring data of the same indicator of the same device and object over time. These data have a trend with time change sequence. Time series is one of the most common forms of data recording, which widely exists in various fields such as underwater ships, aerospace, and so on.
The main contributions of this paper are as follows.
- (1)
- This paper abandons the previous idea of designing a fault diagnosis algorithm based on the characteristics of special equipment and takes the time series characteristics of unmanned autonomous system data as the main research object. Based on the above assumptions, this paper proposes a fault diagnosis method suitable for most equipment.
- (2)
- To improve the applicability of the fault diagnosis algorithm, this paper proposes a fault diagnosis algorithm based on time series. This algorithm and clustering method are combined for fault detection so that autonomous unmanned systems can reveal fault data’s inherent laws and properties by learning unlabeled training samples.
- (3)
- In order to reduce the computational complexity of clustering, this paper proposes a time series symbolization method based on Gaussian mixture clustering to express different types of sensor data uniformly. Through the above processing, the time series can effectively reduce the dimension and calculation.
- (4)
- In order to improve the clustering effect, a time series similarity measurement algorithm based on improved Markov chain is proposed. The algorithm can better extract features and make the discrimination between samples more obvious.
2. Related Work
As a source of information, sensors play an essential role in automatic control systems, and the accuracy of measurement results directly affects the entire system’s operation. Faulty sensor signals can lead to incorrect decisions that affect system safety and productivity. Researchers have designed many methods for the fault diagnosis of sensors, such as the diagnosis method based on signal analysis [9,10,11,12,13], and the diagnosis method based on fault pattern recognition [14,15,16,17,18].
The approach adopted in this paper is to treat the sensor data as a time series. Time series classification has been widely used in all aspects of life such as pattern recognition, industrial control, anomaly detection, etc. Time series data have high dimensions and are difficult to classify. Symbolic representation of time series refers to the representation of high-dimensional and noisy continuous real-valued data into low-dimensional and intuitive symbolic sequence data on the premise of maintaining and reflecting the basic characteristics of time series data. There are many studies on the characterization of time series. Keogh et al. presented piecewise approximate polymerization (PAA) [19]. This method is a way to reduce the dimension of time series data, which can effectively improve computing efficiency and reduce the cost of data storage. Lin et al. first proposed SAX, a symbol approximation representation method based on the piecework approximation aggregation method [20]. The value is mapped to the corresponding coincident space according to the segmentation points of the sequence under the Gaussian curve for symbolic representation. Fuad proposes an improved method for traditional symbolic approximate representation to solve the problem of distance measurement. This method uses UMD distance to update the lookup table, making it more advantageous in lower bound tightness and time complexity compared with the original method [21]. Random shifting-based SAX is an improved method proposed by Bai, which can significantly improve the tightness of the lower bound without increasing the corresponding representation granularity [22]. Malinowski put forward a way that adds trend information based on traditional symbol approximation aggregation. The central idea is to use linear regression for each segment to find the mean and slope and convert the time series into a binary string, the fitting error and classification effect are better than the good traditional symbol approximate aggregation method [23]. Yin et al. put forward a new kind of long-time series symbol representation method based on the trends. The difference from other methods is to focus on retaining most of the trend features and patterns of the original series [24]. The above techniques are all based on the assumption that the standardized time series obeys Gaussian distribution, which is often difficult to be established in the natural environment. Especially in autonomous unmanned systems, data do not follow normal distribution due to sampling and other reasons, so the method often leads to large errors in the subsequent process. Pham, N.D. et al. proposed an adaptive time series representation aSAX (adaptive SAX), which combines the traditional symbol approximation representation method with the k-means clustering method to find adaptive symbol segmentation points. This method is superior to the classical time series representation method in all kinds of data sets with or without Gaussian distribution, but the time complexity increases [25]. In 2016, Barnaghi, P.M. proposed an enhanced time series representation method; this method is built on the basis of extended SAX. The maximum, minimum, and average values of each time series are constructed as vectors, the cosine similarity of the vector is used to measure the similarity of the vector, and k-means clustering method is used to divide the symbol region. The calculation time of this method is complicated, and the promotion effect is not significant [26]. Passos, H.D. et al. proposed three different symbolic representation methods, including the k-means-based representation method, k-means-based symbolic aggregation approximate representation method, and k-means-based extended symbolic aggregation approximate representation method [27].
Another way to explore the symbolization of time series is to use it as a text and to learn from the way of thinking of natural language processing. Lin et al. proposed a histogram-based time series representation BOP (bag-of-patterns) based on the bag-of-words model [28]. This method considers the global structure of time series and retains the local structure. This kind of symbol representation method based on natural language processing requires large memory, and it has high time complexity in the training phase, so it cannot be used well in an autonomous unmanned system.
3. Core Idea
3.1. Problem Statement
Time Series: In this paper, time series with the same time interval are abbreviated as:
Time series data describe the changes of various parameters of equipment in work and also contain the law and trend of fault occurrence, which is an important basis for fault detection in this paper.
Cluster-Based Fault Diagnosis: In the fault diagnosis algorithm based on machine learning, it can be divided into two categories: supervised learning and unsupervised learning. Due to the confidentiality of the autonomous unmanned system, the small number of faulty samples, and the difficulty of manual interpretation under massive data, it is impossible to perform supervised learning by effectively labeling the dataset. The learning of unlabeled training samples is needed to reveal the inherent laws and properties of the autonomous unmanned system data. Clustering is often the preferred method for such unsupervised learning.
The operation of dividing samples into a data set into several disjoint subsets is called clustering, and each subset is a cluster. Formally speaking, the sample set contains unmarked samples, and for each sample, the goal of the clustering algorithm is to divide the set composed of these samples into several disjoint clusters, where is the number of clusters, and
In order to improve the clustering effect of time series and better discover abnormal data, we need to solve the following problems, denoted as questions Q1–2:
- (1)
- Design a time series dimensionality reduction method to reduce the cost of clustering calculation (Q1);
- (2)
- Determine the similarity measure of two time series (Q2).
3.2. Overview of Our Model
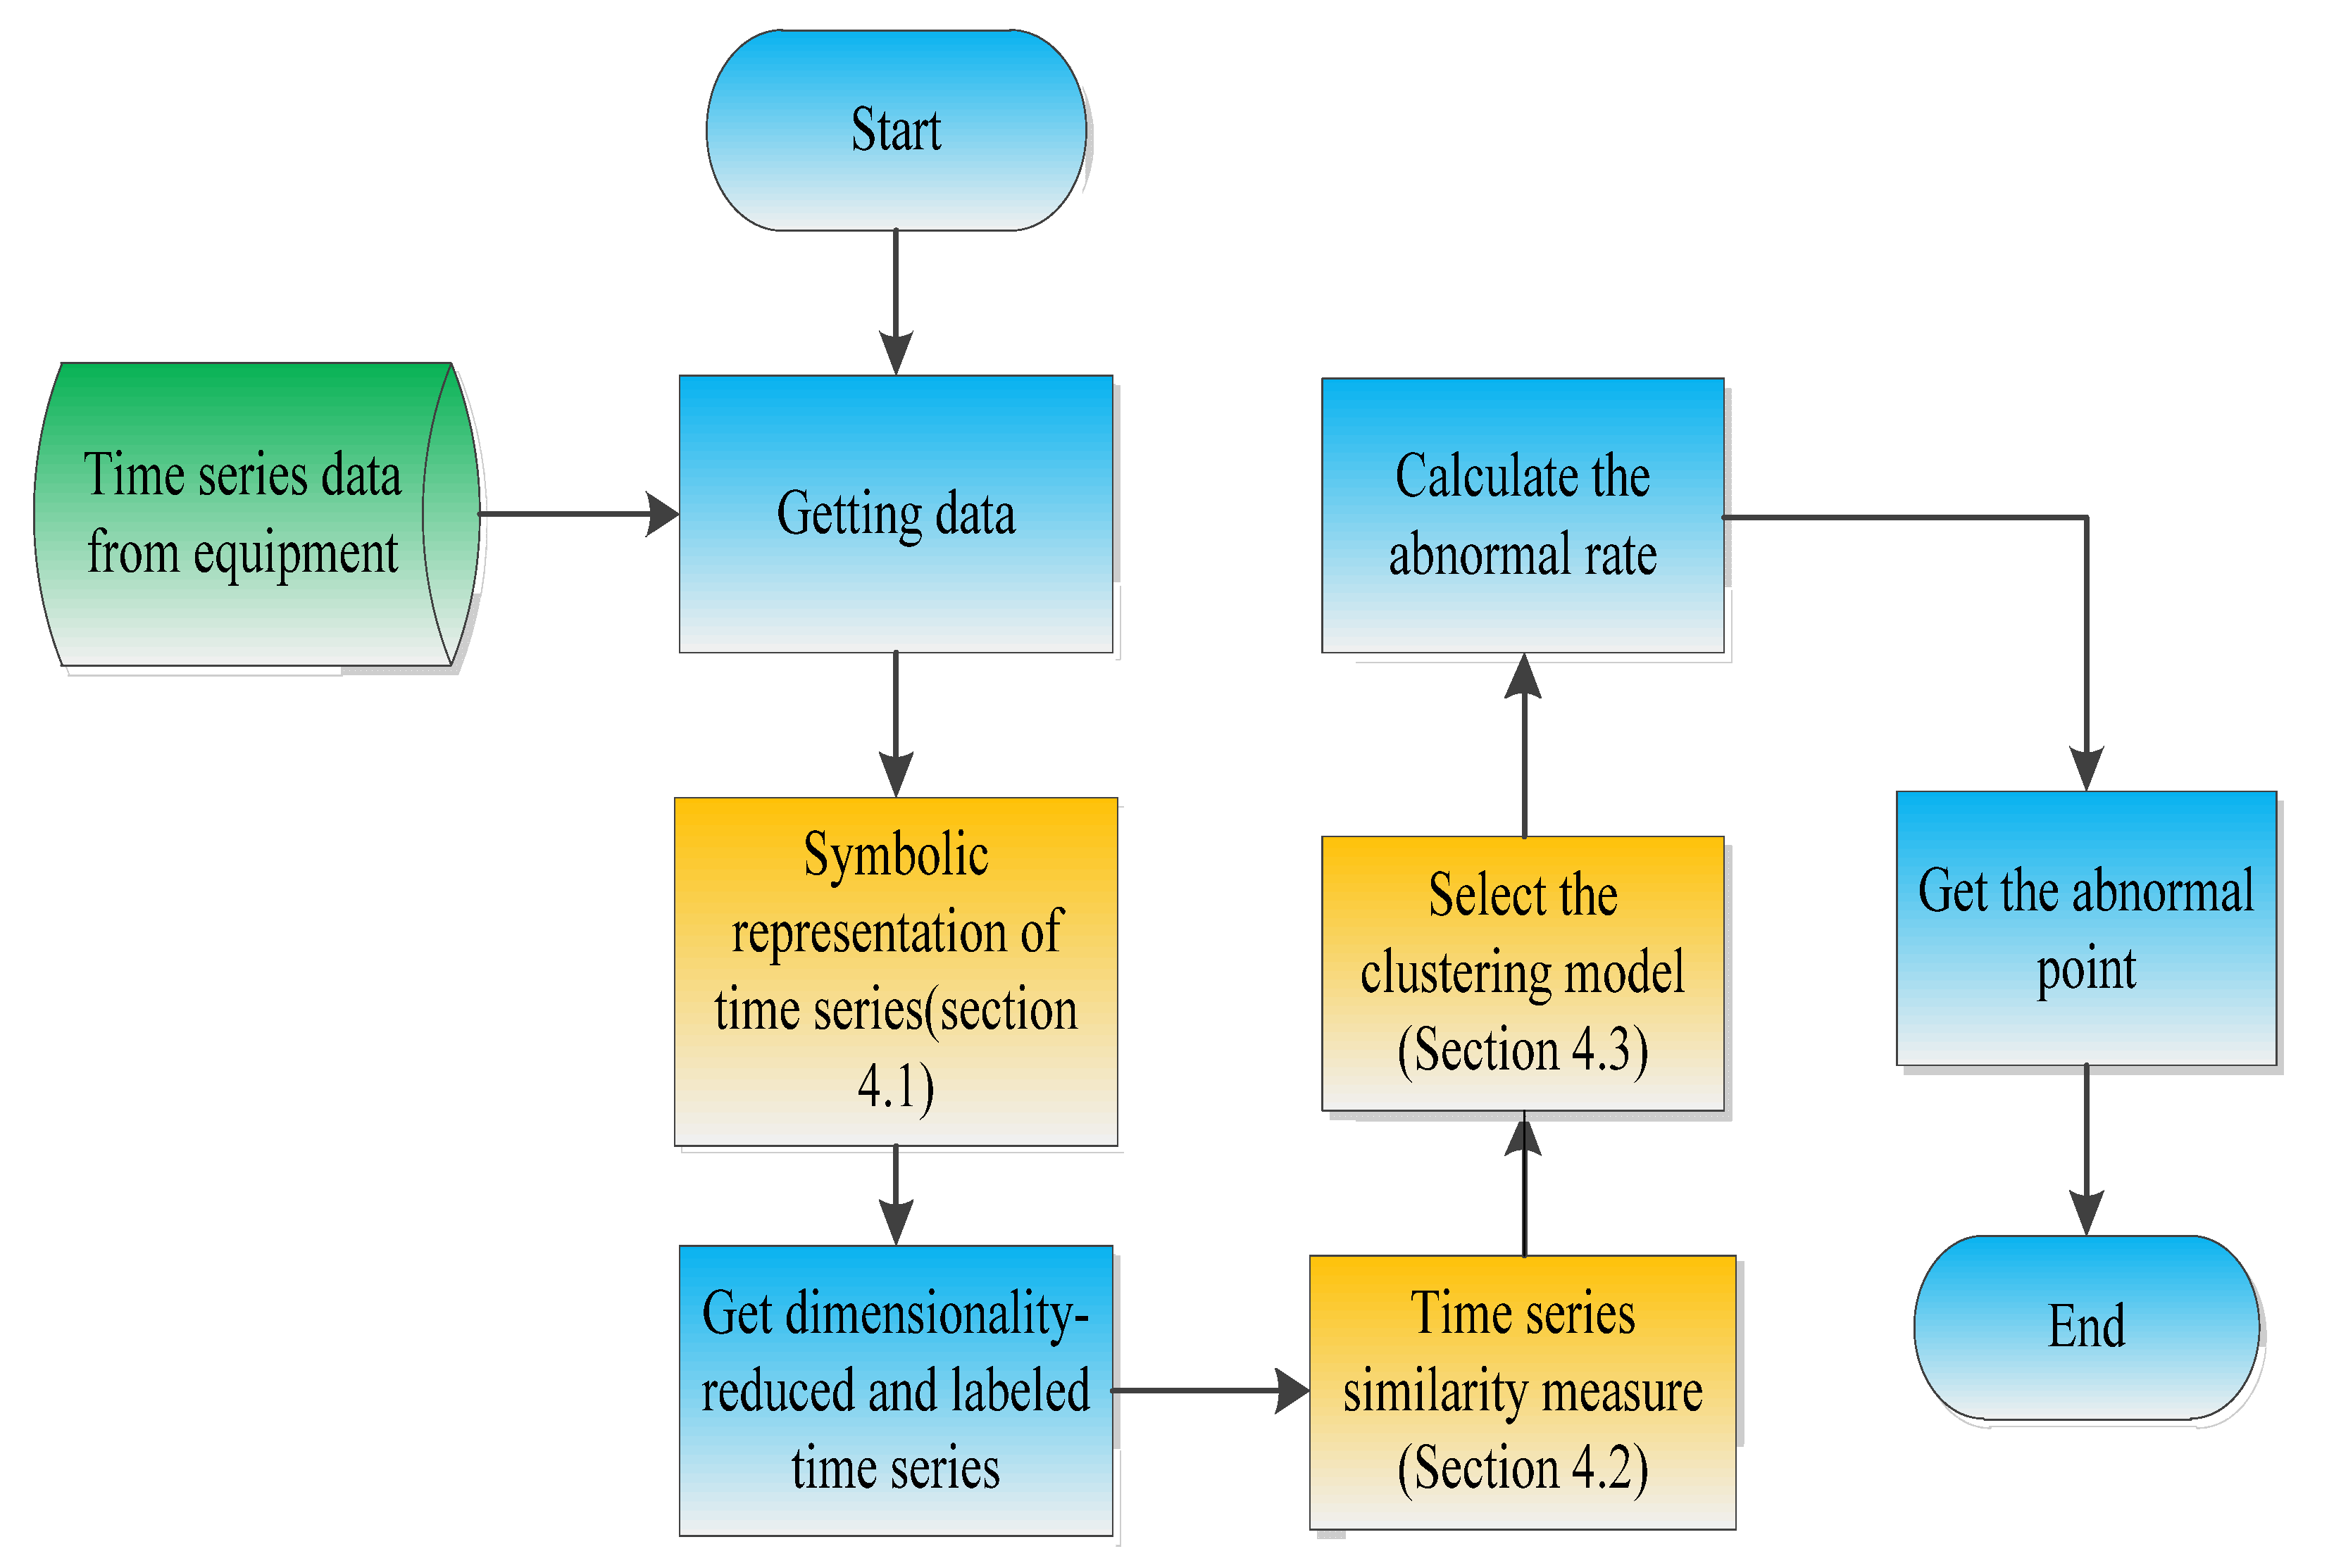
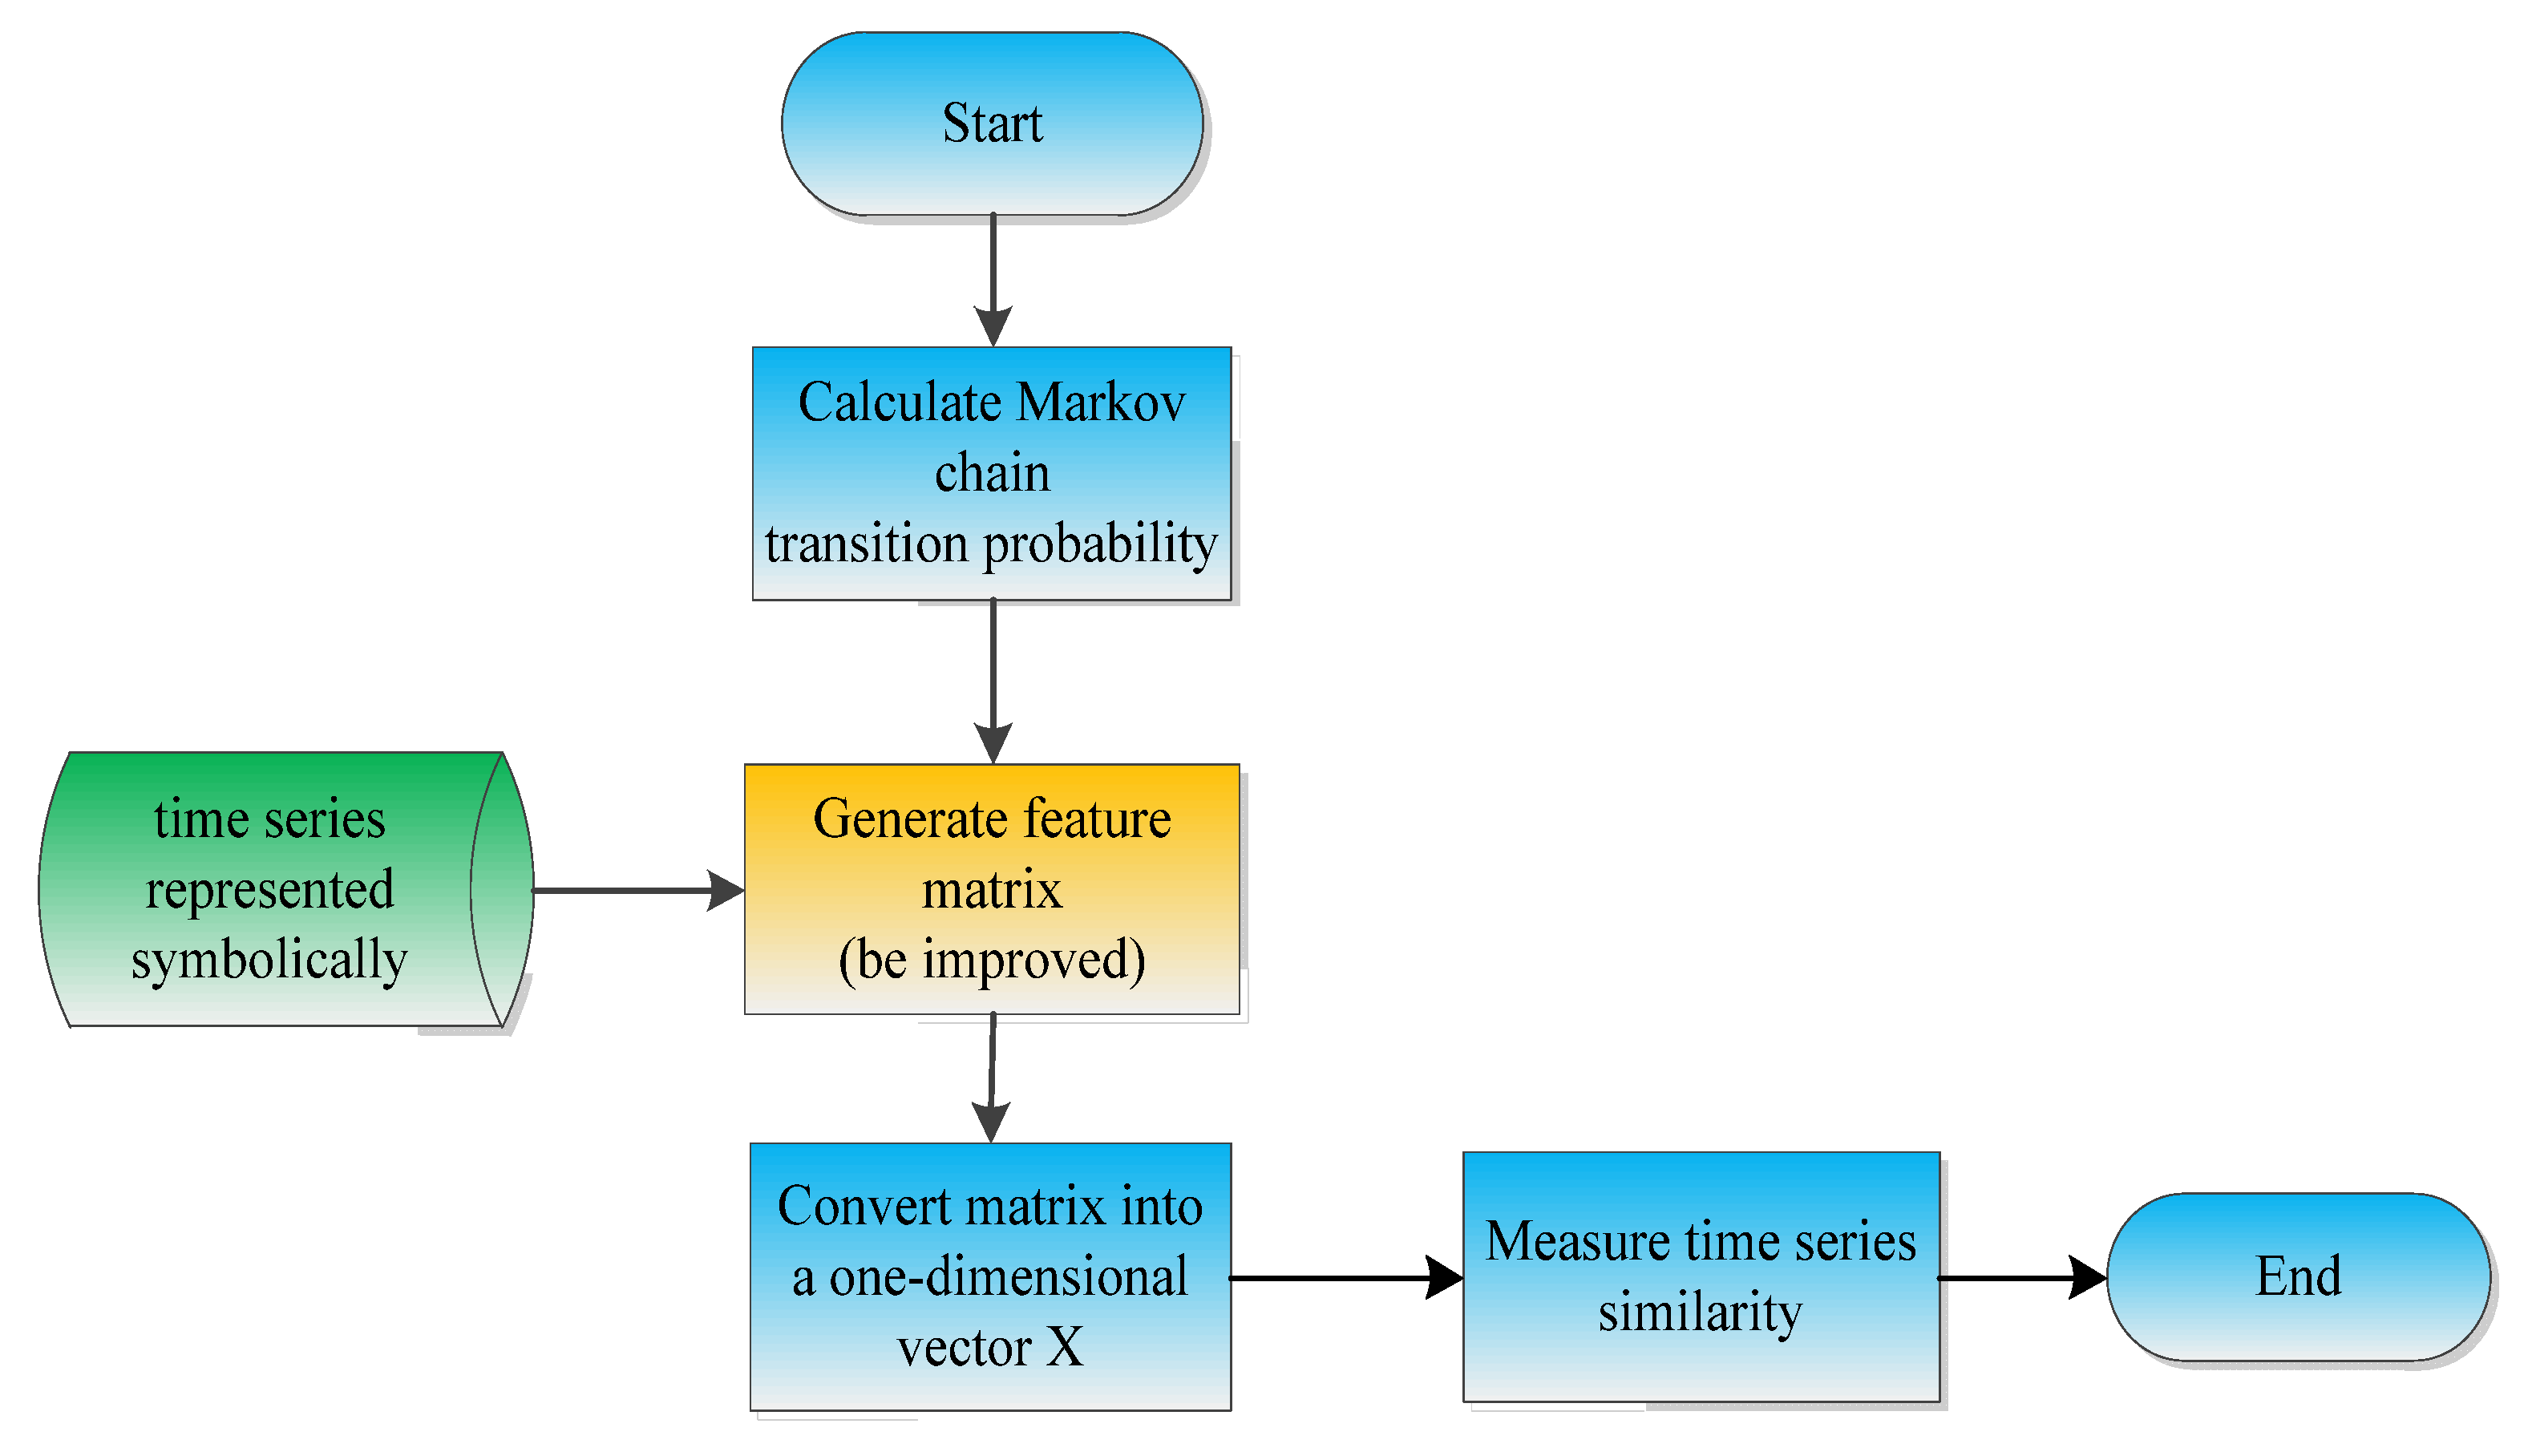
To solve the problems mentioned above, we designed a multi-sensor fault diagnosis method based on time series, as shown in Figure 1.

Figure 1.
Flow chart.
First, the time series data of the autonomous unmanned system are collected, and the time series is dimensionally reduced by the symbolic representation method. Second, the similarity calculation is performed on the symbolized time series. Third, based on the similarity calculation results, a clustering algorithm is selected to identify abnormal data. In the end, we provide answers to questions Q1–3. The key techniques are as follows:
- (1)
- When extracting and classifying time series, the characteristics of multi-unmanned system time series are first analyzed: high dimensionality and unknown distribution. The high dimensionality determines that we must represent the time series symbolically in order to achieve the purpose of dimensionality reduction. In the choice of the time series symbolization method, this paper proposes a symbolic time series classification method based on Gaussian mixture clustering (in Section 4.1.).
- (2)
- The measurement of time series similarity is the core of cluster-based fault diagnosis algorithms. Whether the two time series are similar mainly depends on whether their changing trends are consistent. However, time series has the characteristics of high dimension and many data types, which brings great inconvenience to the follow-up research. Therefore, for the measurement of time series similarity, the similarity measurement function is particularly important. In Section 4.2., we define a time series similarity measure based on an improved Markov chain.
4. Fault Diagnosis Method Using Improved Clustering Algorithm
4.1. Time Series Symbolic Representation Based on Gaussian Mixture Clustering
For the above problem Q1, considering the distribution characteristics of sensor data, the Gaussian mixture clustering is adopted to represent symbolically. This clustering method is used to select the segmented points of the symbol interval, which has better adaptability to the data with unknown distribution.
The Gaussian mixture model is a probability distribution model with the following form:
where is the mixed component of the -th Gaussian distribution, and is the density of the Gaussian distribution, , where are the location parameters and scale parameters of the -th Gaussian distribution corresponding to the sub-model are as follows:
The Gaussian mixture clustering algorithm is a prototype-based clustering method that uses a probability model to describe the clustering prototype. The core idea is to initialize the Gaussian mixture distribution model and then use the EM algorithm to update the model iteratively.
The Algorithm 1 is shown as follows.
| Algorithm 1 Gaussian mixture clustering algorithm |
| Input: sample set , the number of Gaussian mixture components k; Output: cluster partition ;
|
The time series symbolic representation based on Gaussian mixture clustering is to conduct Gaussian mixture clustering on all sample points and use the label obtained by clustering to symbolize the value at a certain time so as to achieve the dimensional reduction of the original time series.
This method can adapt well to the time series data provided by the autonomous unmanned system, which is subject to Gaussian mixture distribution. The model is simple and easy to understand, and the time complexity is relatively low.
4.2. Time Series Feature Engineering Using the Improved Markov Chain Model
The measurement of time series similarity is the core of clustering algorithm. The definition of time series similarity is described as follows:
For the two given time series , and given a similarity measure function. If the time series and meet the following conditions:
then, the time series and are similar, where is the threshold of time series similarity.
In the design of the time series similarity measurement method, we must consider the common characteristics of sensor data of unmanned autonomous systems. The ultimate goal of unmanned autonomous system fault diagnosis is to find out the abnormal state of the system. Through analysis, it can be found that the current state of the unmanned autonomous system is determined by the state of the previous moment, independent of other time states, and has Markov properties. Therefore, this paper proposes a similarity measurement method for time series based on Markov chain models.
In Section 4.1, the symbolic representations of the original space mission time series were made through the symbolic representation of time series based on Gaussian mixture clustering, and this symbolic expression can be regarded as different states of the time series, and the process of symbols change can be considered as the state transition of the time series, this transition is determined by the current state, it has the Markov property. Therefore, we regard each time series as a Markov chain, and its state space is the symbol set after the time series is symbolized. Therefore, we designed a time series similarity measurement method based on Markov chain. The specific process is shown in Figure 2.

Figure 2.
The flow of time series similarity measurement method is based on Markov chain.
Each symbolized time series satisfies Markov property, that is:
Among them, represents the corresponding state of time series at time, and the conditional transfer probability.
Thus, the transition probability between states in each symbolized time series can be obtained as follows:
The corresponding transfer probability matrix of each symbolized time series can be obtained, that is:
where and .
Since the symbolic representation method of time series is based on Gaussian mixture, clustering gives the symbol set corresponding to the time series, and the length of the symbol set is fixed. We might set the length as, then the size of the transfer probability matrix corresponding to each time series is also fixed, that is. Therefore, the method can convert the time series with variable length into the transfer probability matrix with the same size, and it also provides effective support for the similarity measure of time series. Because the transition probability matrix is a sparse matrix, the representation of triples is used to reduce the space complexity during storage.
In order to facilitate similarity measurement, the transition probability matrix is converted into a one-dimensional vector, and the transformation method is as follows:
Since the one-dimensional vector X can describe each time series S, the similarity of the two time series can be described as the Euclidean distance of the corresponding one-dimensional vector.
Because the time series data will be in a state for quite a long time when a time series is directly modeled using a Markov chain, the transition from one state to its own state will account for the majority. The proportion to other states is much smaller than this value, which leads to this method describing the proportion of different states and ignoring the changes between states. Therefore, this paper improves the time series feature engineering based on Markov chain model.
First, the state transition is divided into two part: maintaining the current state and transitioning to other states. For the part that keeps the current state, the proportion of the state in the whole time series is measured, and the state transition probability after the state transition to other states is measured by removing the state transition to itself. The specific process is as follows:
- Input: Symbolized time series , symbol set
- Output: feature matrix corresponding to the time series
- Process: Traverse the symbolized time series, count the number of transitions between states, and construct a matrix of times as follows:
Traverse the matrix and calculate the total number of times that the time series maintains its own state, as follows:
Traverse the matrix and calculate the total number of jumps to other states in the time series as follows:
Use the following formula to obtain the feature matrix corresponding to the time series
In Section 5.2, we will compare these two different feature extraction methods.
4.3. Fault Diagnosis Method Based on Clustering
There are three types of anomaly detection methods based on clustering:
- The first type of method is based on the assumption that each piece of normal data belongs to a cluster, while the abnormal data do not belong to any cluster. Generally, this type of method does not force every instance to belong to a cluster.
- The second type of method is based on the following assumption: normal data distribution is close to the center of the cluster, while abnormal data distribution is far away from the cluster’s center. In this method, the data are firstly clustered, then the anomaly is evaluated by calculating the distance from each point to the center of the corresponding cluster.
- The third method is based on the following assumptions: the samples of the cluster where the normal data are located are relatively dense, while the samples of the cluster where the abnormal data are located are relatively sparse.
Considering that the abnormal data of autonomous unmanned systems belong to the small sample data, the fault diagnosis can choose the first and third types of clustering algorithms. The first type of method mainly uses DBSCAN clustering method based on density, while the third type is based on k-means based on partition and hierarchical clustering. In this paper, we adopt the third clustering method for fault detection.
5. Experimental Results and Analysis
In order to verify the validity of the method, we carried out further experiments by using the data set of an aeronautical autonomous unmanned system.
5.1. Model Evaluation Criteria
- (1)
- Data fitting effect evaluation index
This paper uses the fitting error to measure the effect of time series coincidence. The segmentation model of time series is the set of elements composed of the start time and the end time of the subsequence, which is denoted as The element is a two-tuple, in which is the start time of the segmentation subsequence, and the end time of the segmentation subsequence.
The symbolization of time series can be regarded as the segmentation and description of time series. For time series, the segmentation mode is adopted, and the fitting error is:
where is the mean value of the -th subsequence.
Considering that the selected time series are not equally long, to measure the effect of time series symbolization better, we add a normalization factor to the fitting error to balance the length of time series, that is:
The smaller the fitting error, the better the effect of time series coincidence.
- (2)
- Clustering effect evaluation index
Considering the data confidentiality and labeling difficulties, we use internal indexes of clustering to evaluate the clustering effect. In order to better describe the index, some function definitions are given.
Function definition 1: Average distance between samples in the cluster:
Function definition 2: Maximum distance between samples in the cluster:
Function definition 3: The distance between the nearest samples between clusters:
Function definition 4: Distance of sample center point between clusters
For cluster partition, there are several common internal indexes of clustering performance measurement as follows:
Internal index 1: The Davies–Bouldin Index (DBI)
Internal index 2: Dunn Index (DI)
For clustering, if the average value between samples of each cluster is smaller, the DB index is smaller. If the distance between the cluster center points is larger, the DB index is smaller. In contrast, the Dunn exponent characterizes the ratio between the minimum of the closest distance between any two clusters and the maximum of the distance between the two furthest points within any cluster. If the minimum value of the nearest distance between any two clusters is larger, the Dunn index is larger; if the maximum value of the distance between the two furthest points in any cluster is smaller, the Dunn index is larger.
5.2. Test Results and Analysis
- (1)
- Experiment results of time series symbolization
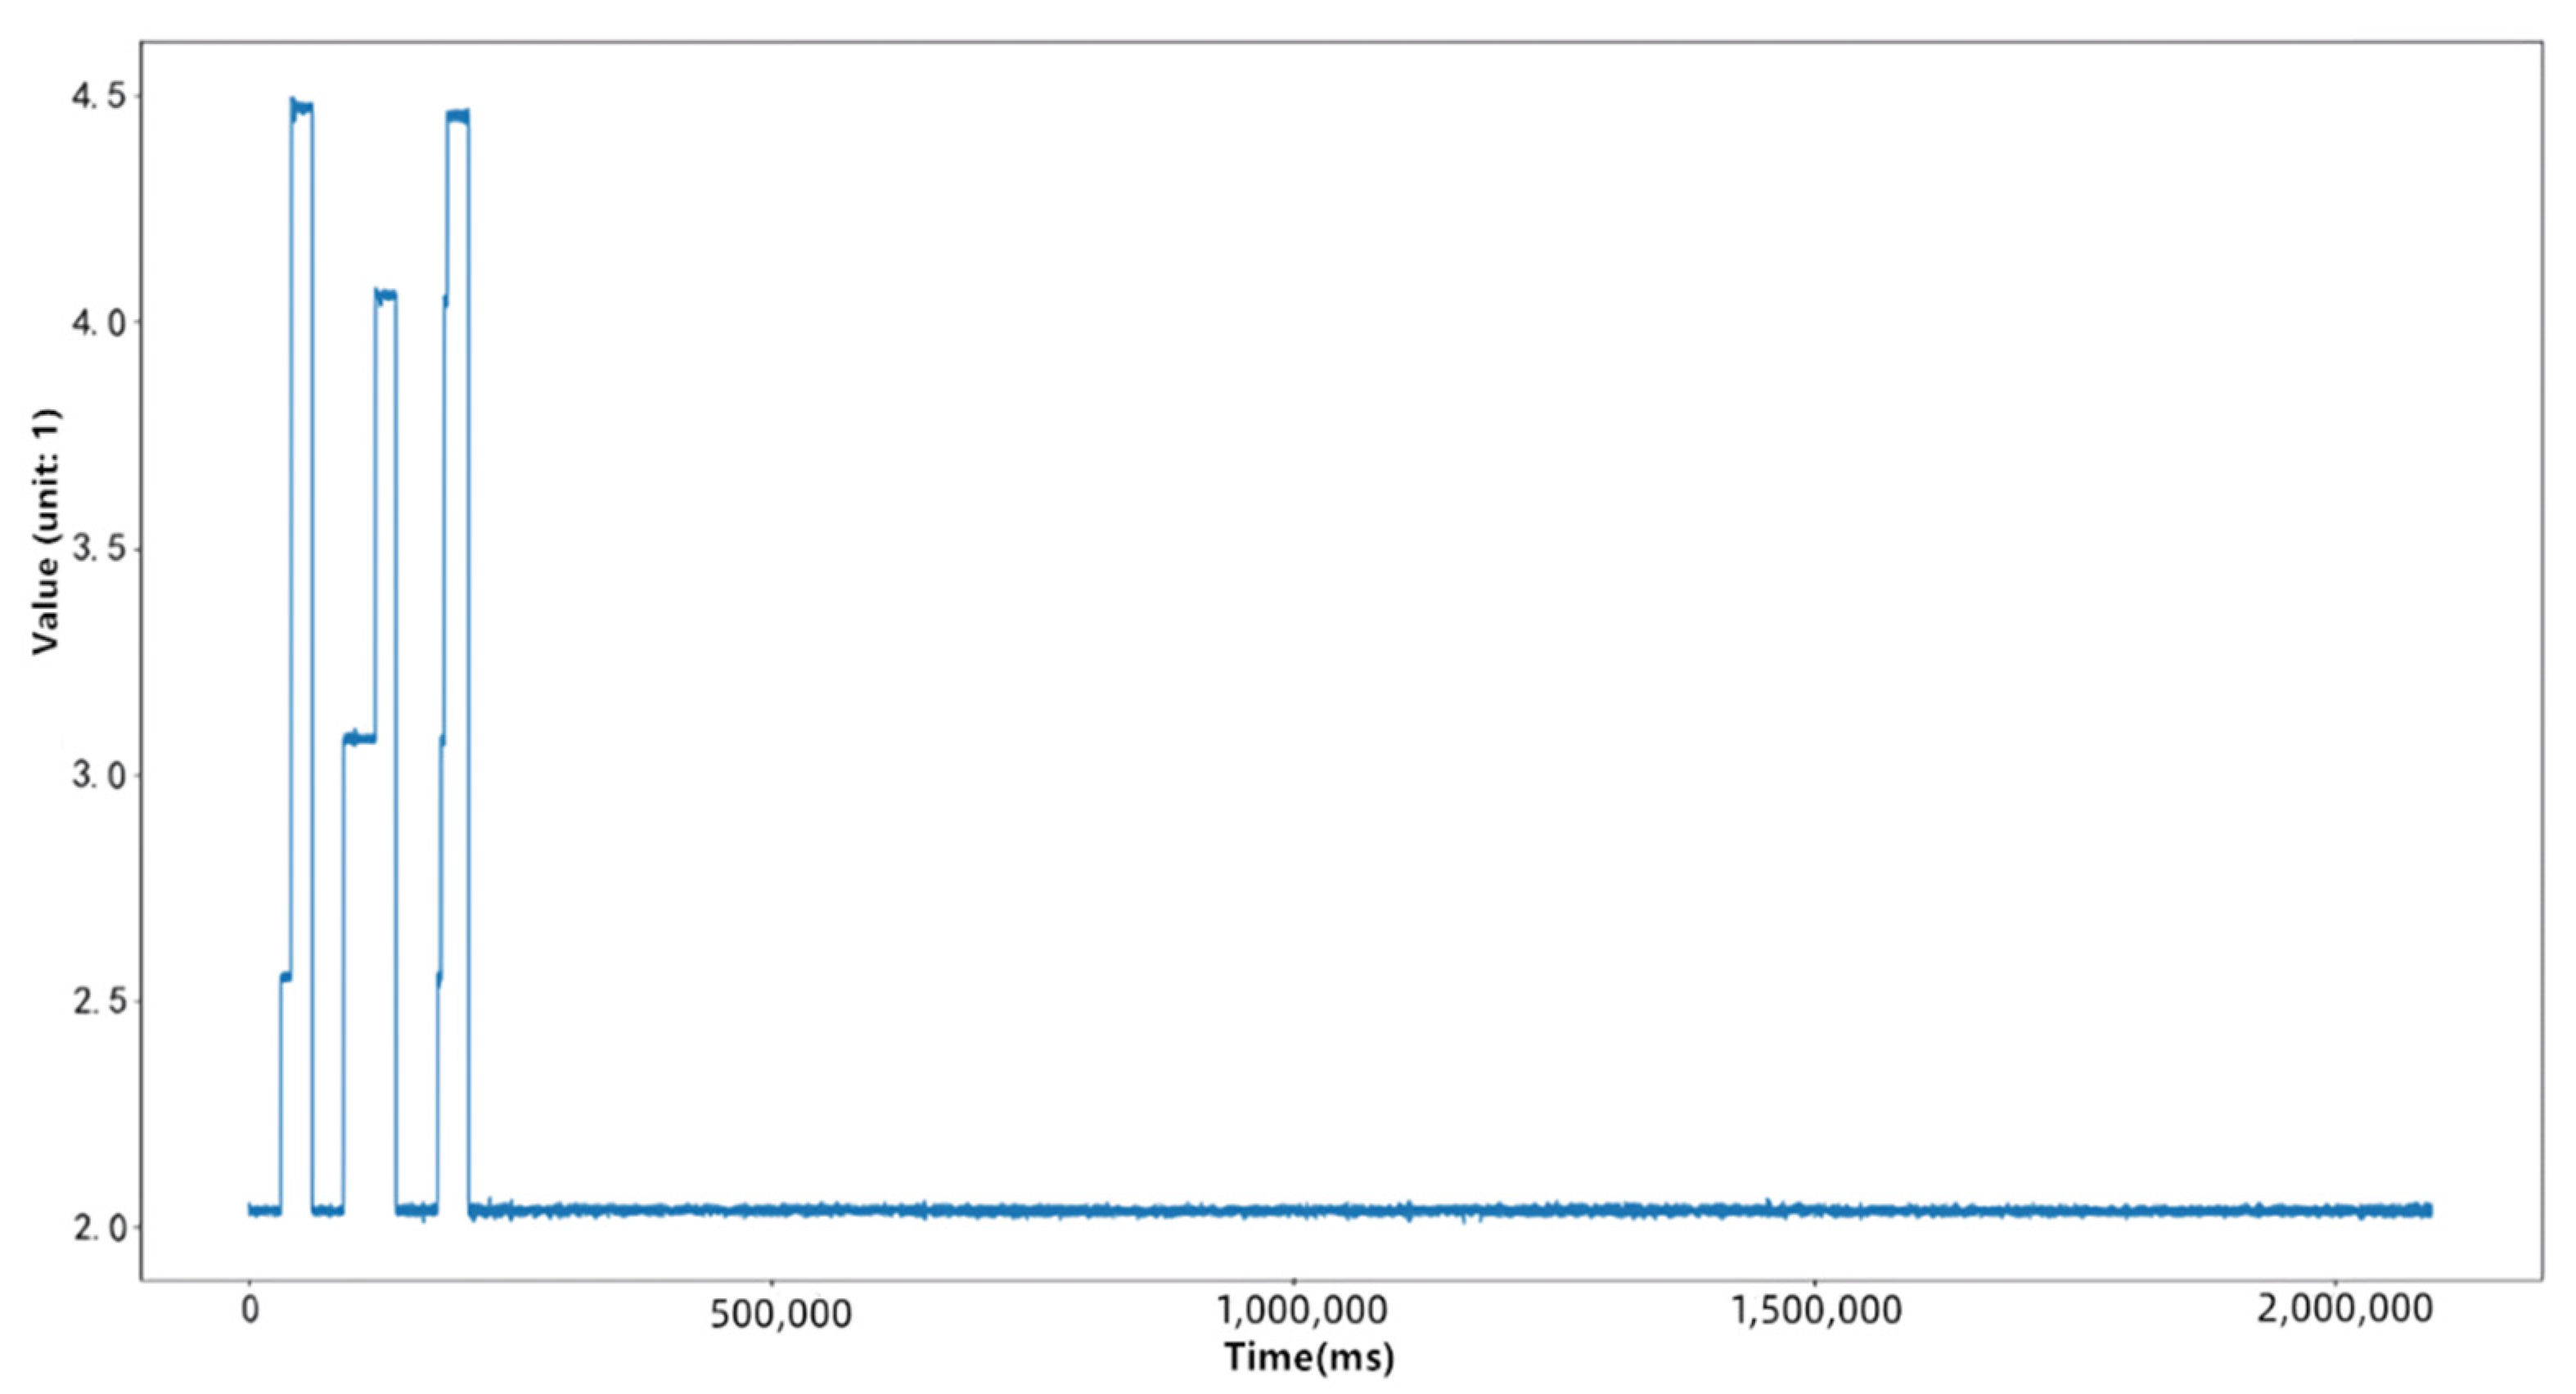
Each value of all time series is taken as a sample to train the Gaussian mixture clustering model, and the clustering label of each sample is successively obtained as its corresponding symbol thus each time series is symbolized, as shown in the figure below:
The series is symbolized, as shown in Figure 3 below:
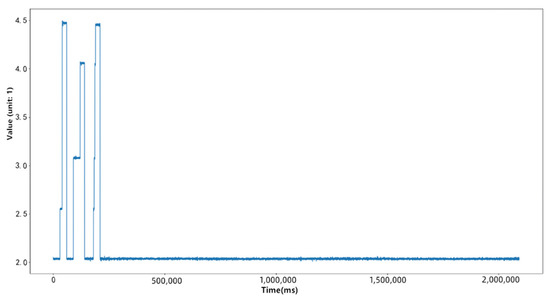
Figure 3.
Original time series.
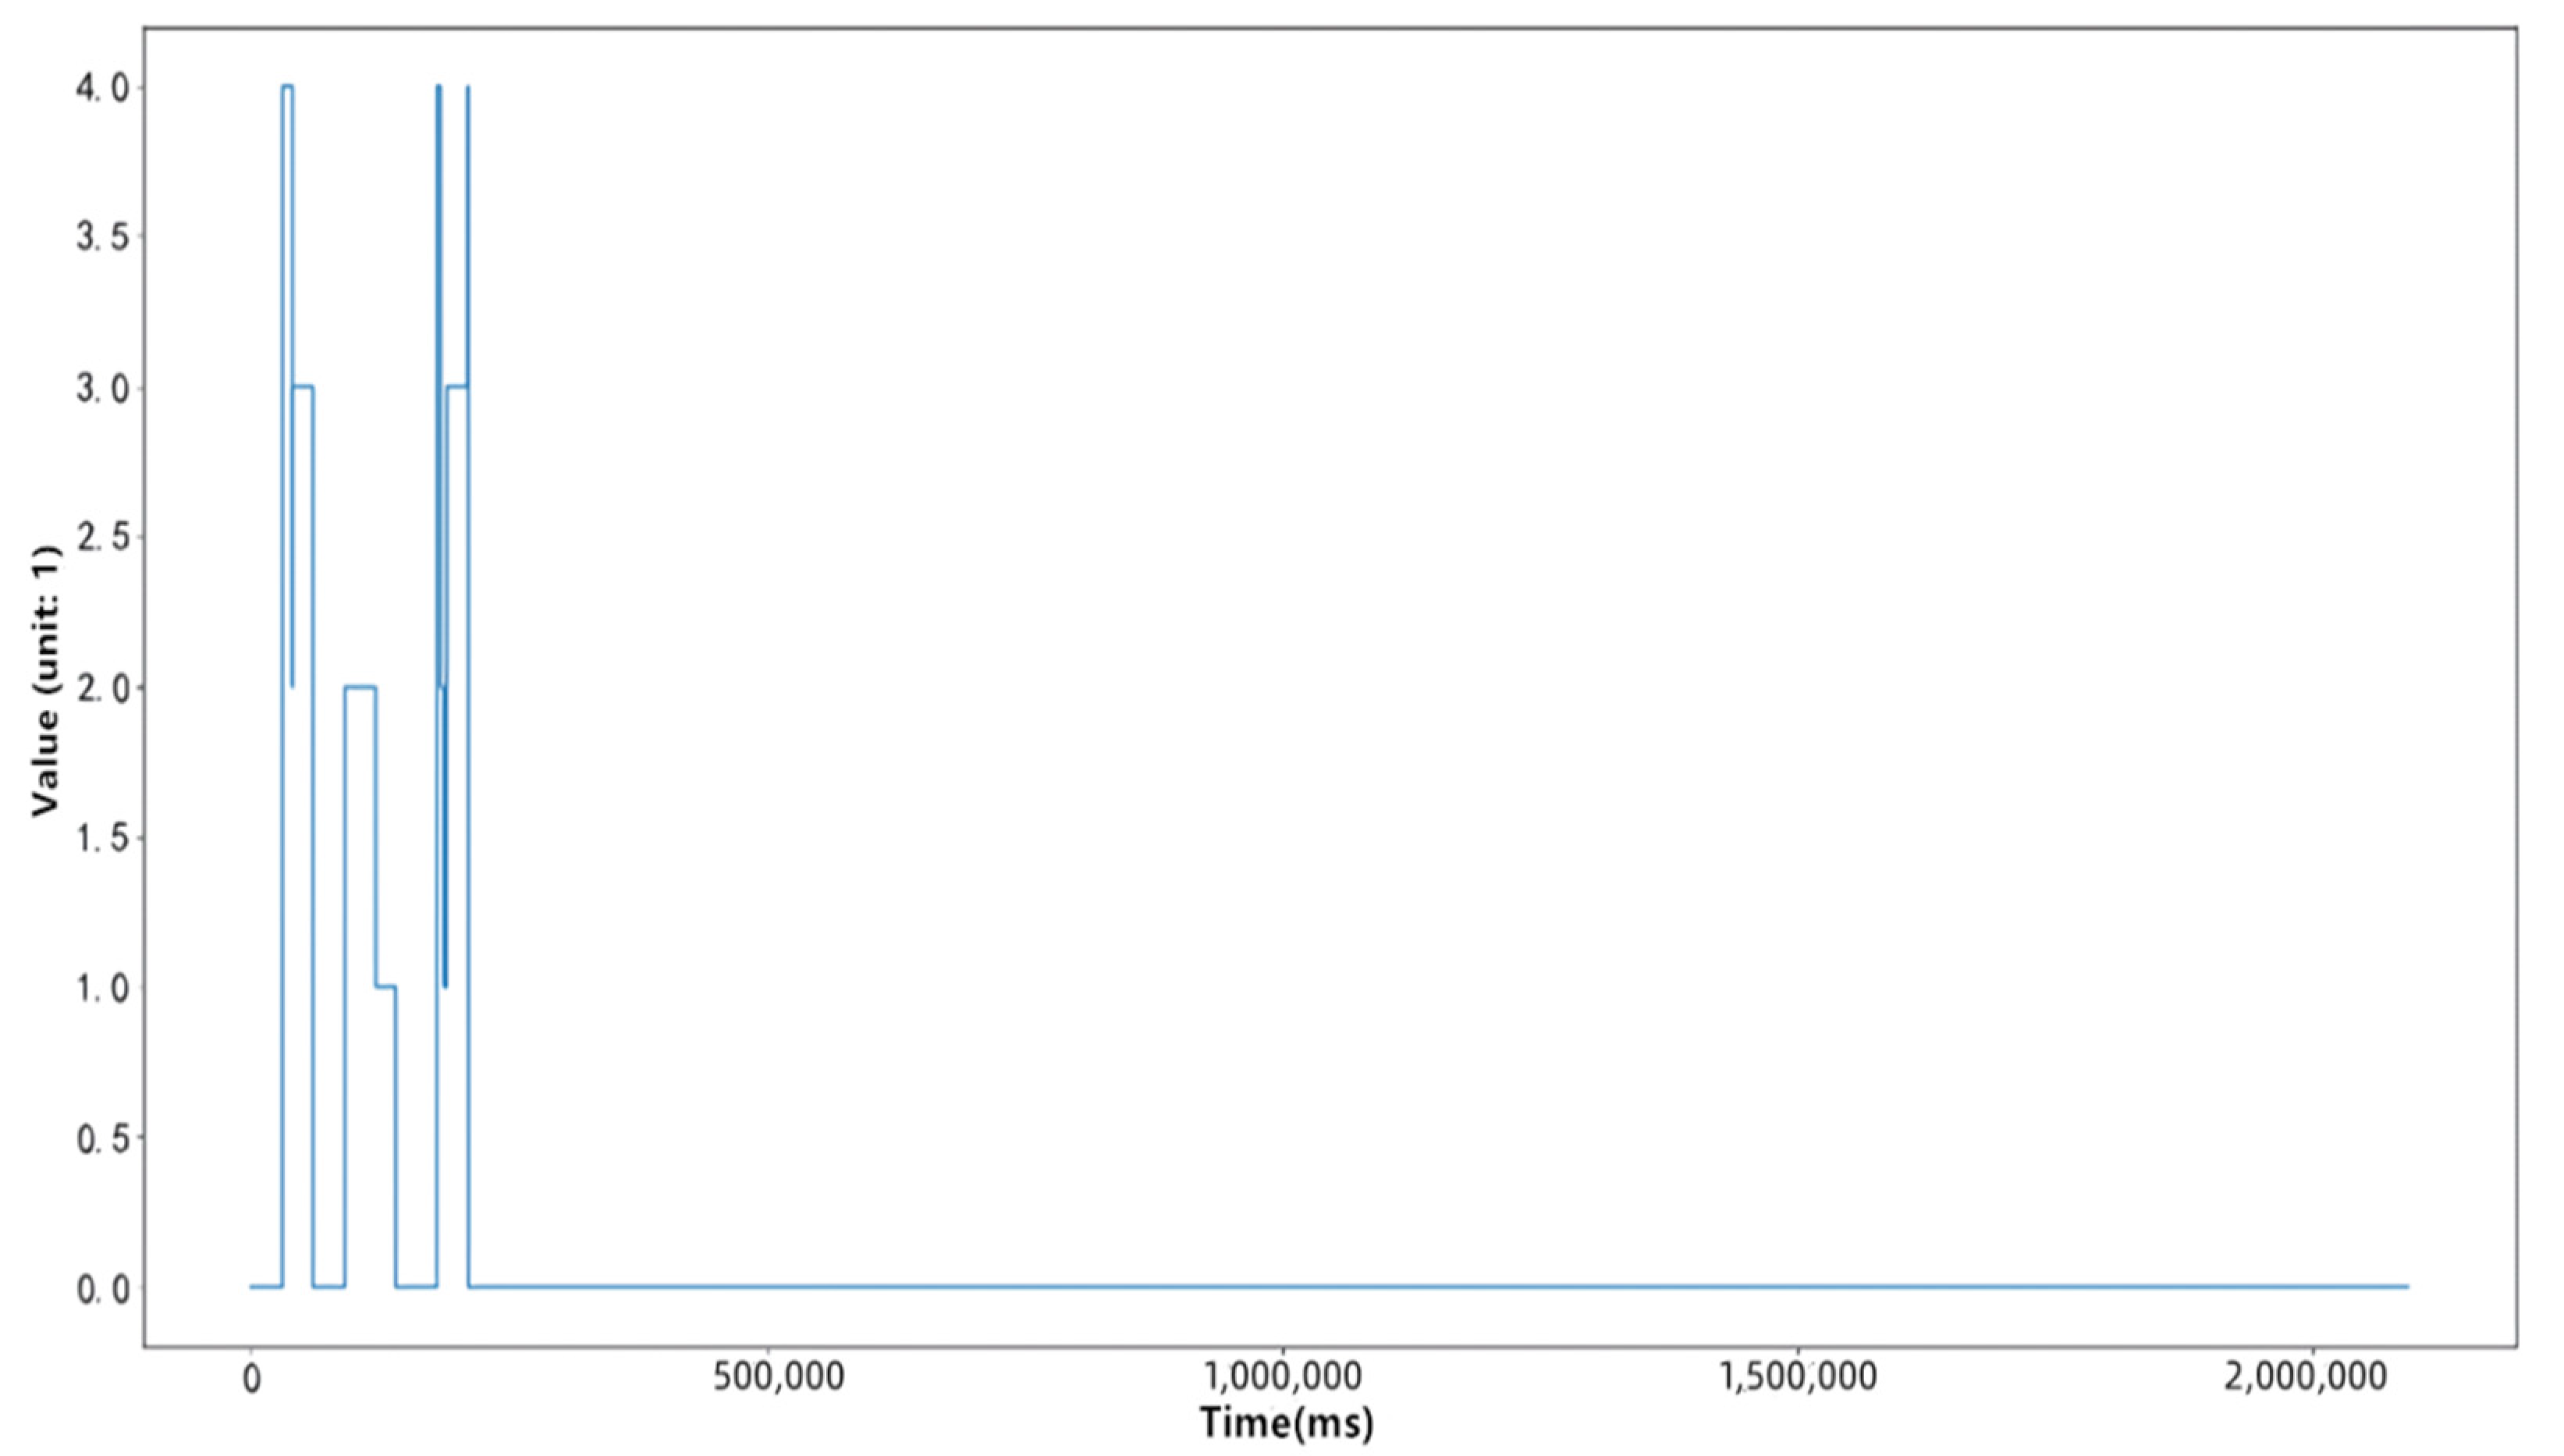
Figure 4 and Figure 5 respectively compress a time series in the data set with the traditional symbolic representation method of time series and the symbolic representation method of time series based on Gaussian mixture clustering proposed in this paper. These two algorithms use the same compression ratio, and it can be seen that the symbolic representation method of time series based on Gaussian mixture clustering proposed in this paper can better describe the fluctuation of the original time series.
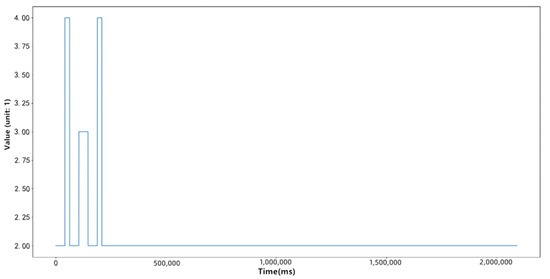
Figure 4.
Time series after SAX dimensionality reduction compression.
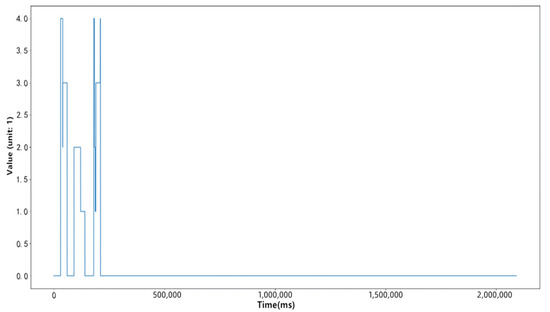
Figure 5.
Time series of SAX dimensionality reduction compression based on gaussian mixture clustering.
We used the above formula to calculate 408 time series in the data set for experiments, and the results are shown in Table 1.

Table 1.
Comparison between the symbolic representation method of time series based on Gaussian mixture clustering and the traditional method.
As can be seen from the above table, the fitting error of the time series symbolized representation method based on Gaussian mixture clustering is smaller than that of the traditional time series symbolized representation method. From this perspective, this method can describe the original time series relatively well.
- (2)
- Clustering experiment results based on improved similarity measurement method
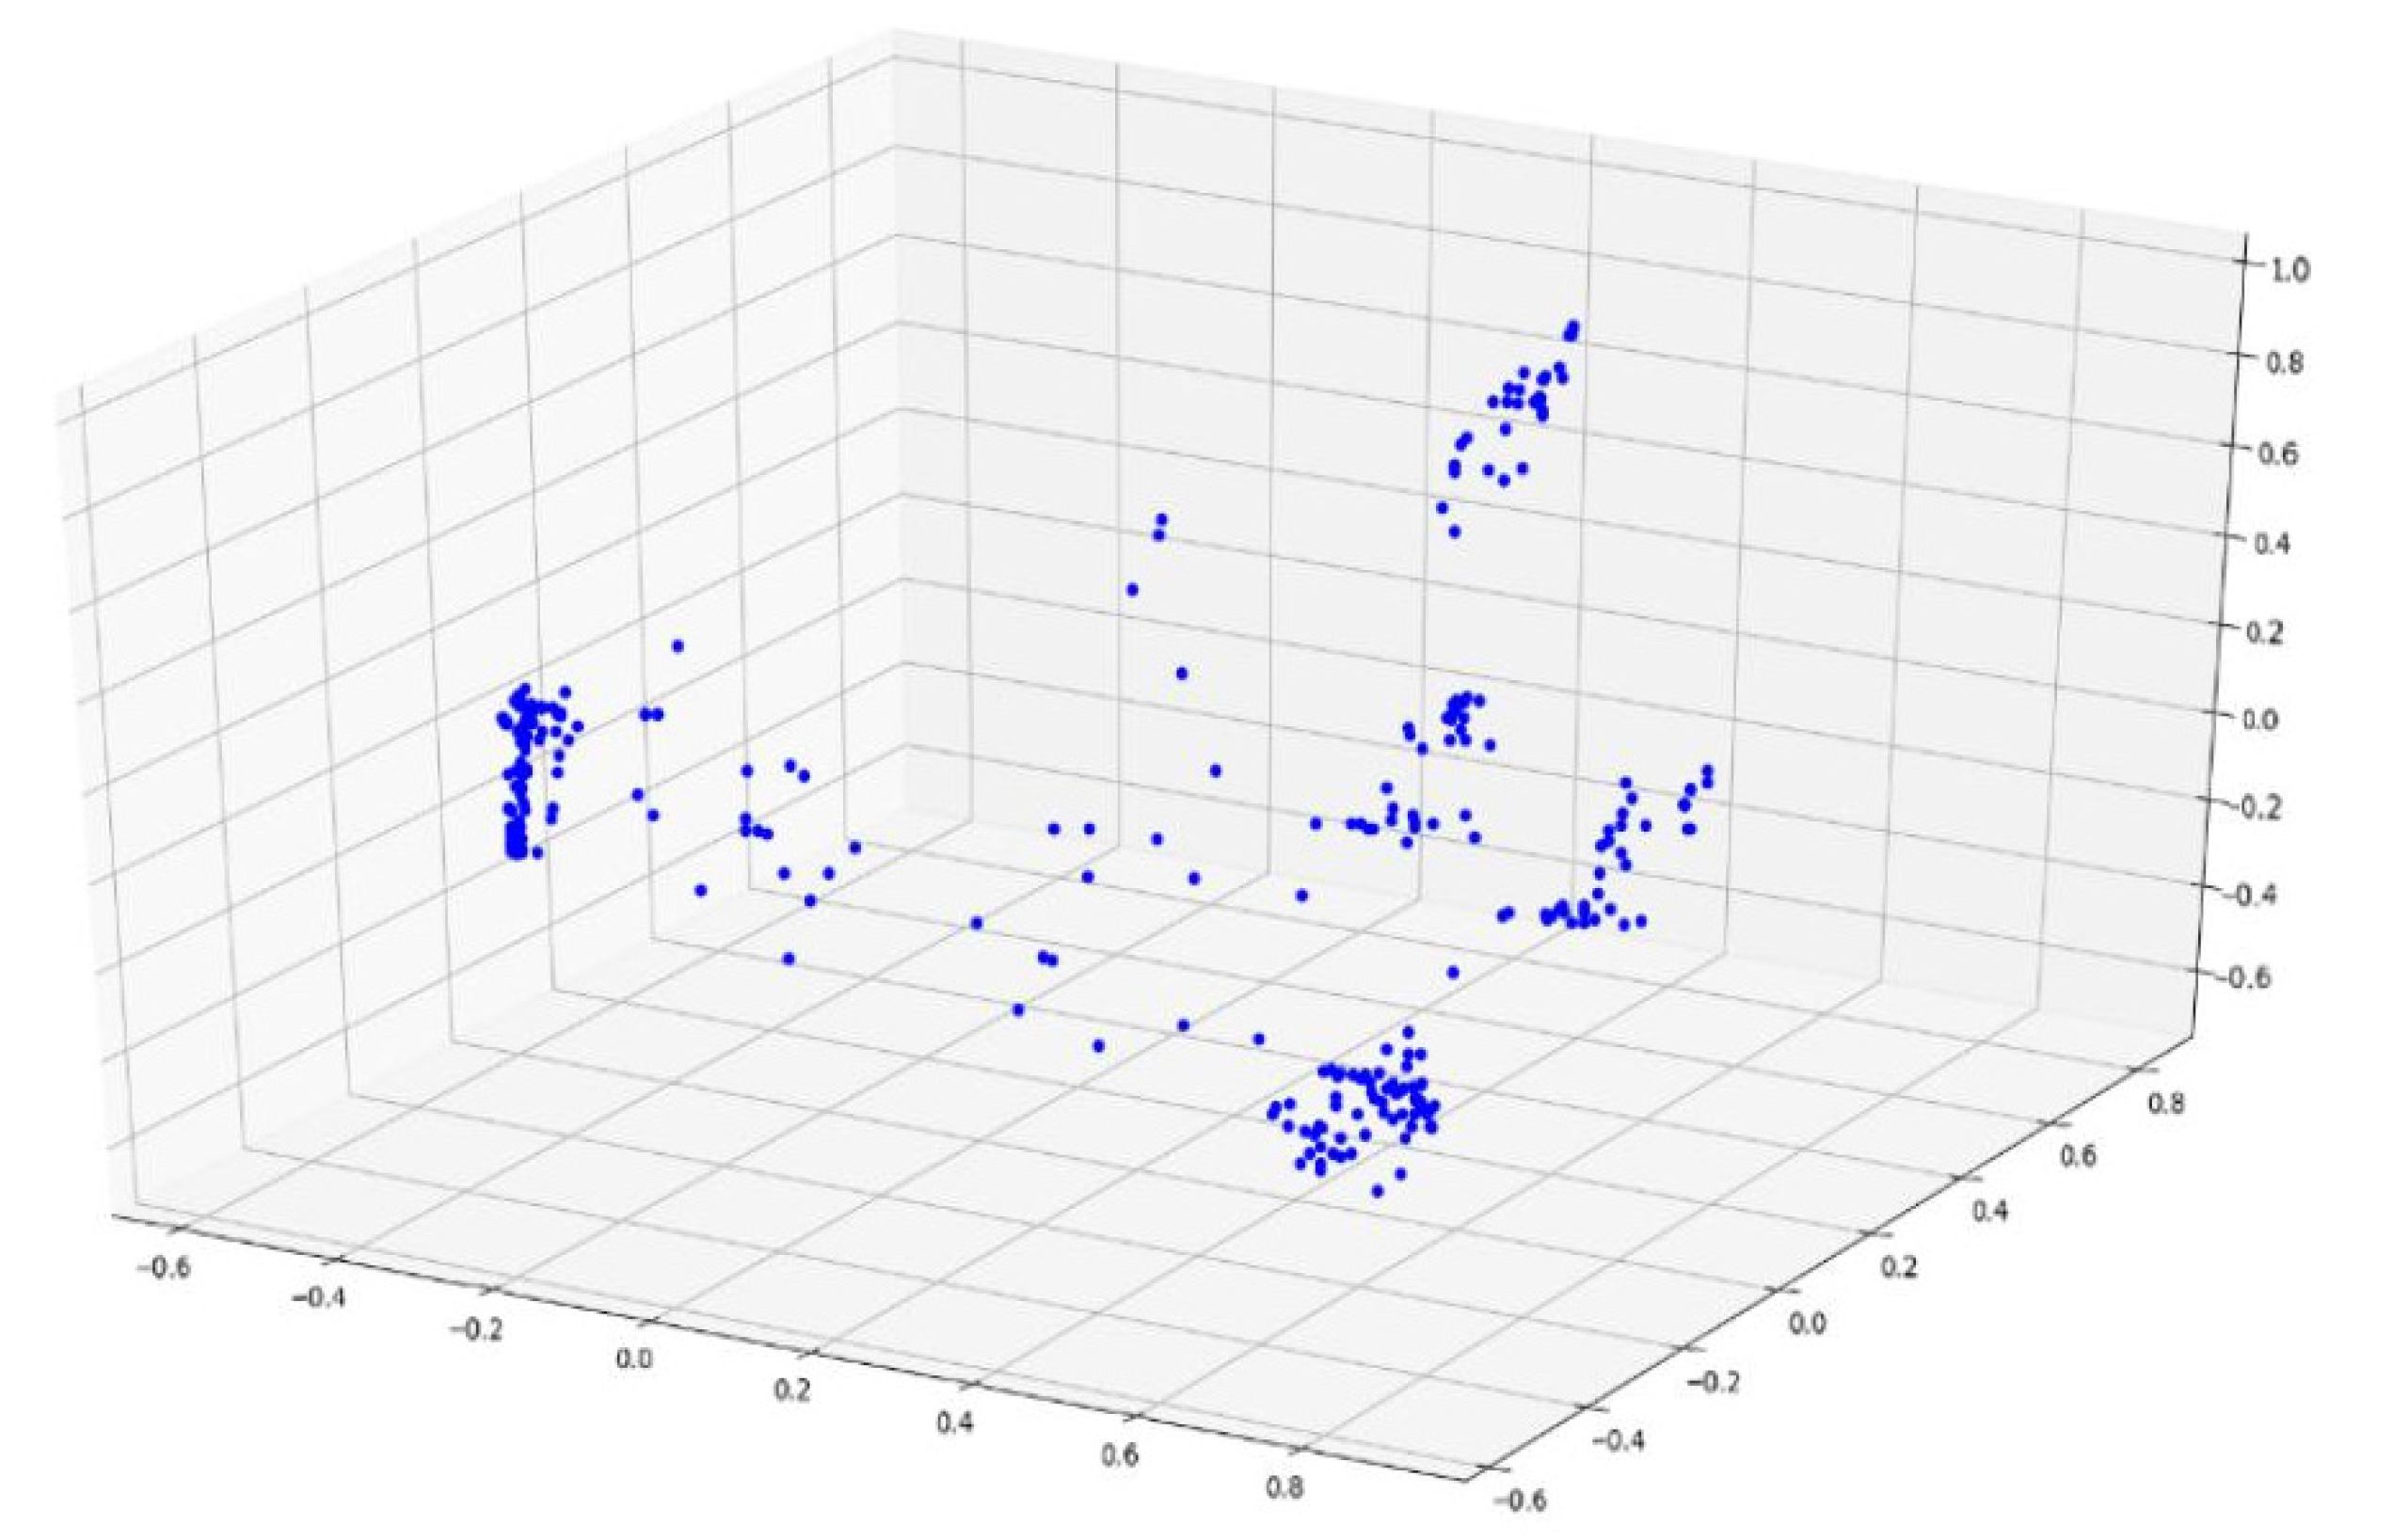
According to Section 4.2., an improved Markov chain model is used to model the time series. For example, all of the time-series data are converted into a state transition matrix and converted into a vector of length 100, as described in this chapter. Based on using the principal component analysis to reduce data dimension for the vector visualization, Figure 6 shows the sample distribution based on the Markov chain feature engineering, Figure 7 shows the sample distribution after based on the improved Markov chain feature engineering (A blue dot in Figure 6 and Figure 7 represents a data sample).
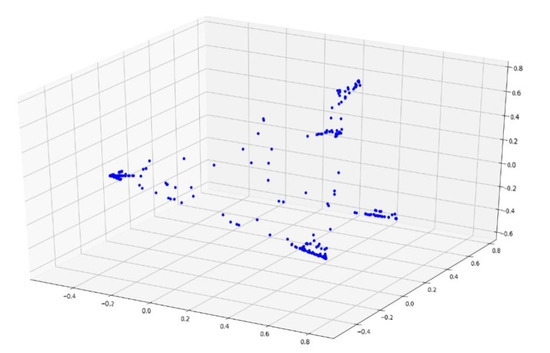
Figure 6.
Sample distribution based on the Markov chain feature engineering.
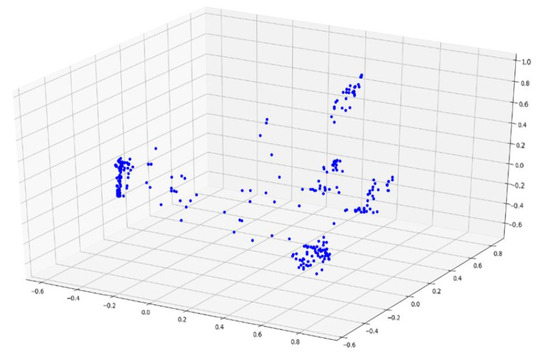
Figure 7.
Sample distribution based on the improved Markov chain feature engineering.
It can be observed that the discrimination between the samples based on the improved Markov chain feature engineering is more prominent, which is conducive to the following clustering analysis.
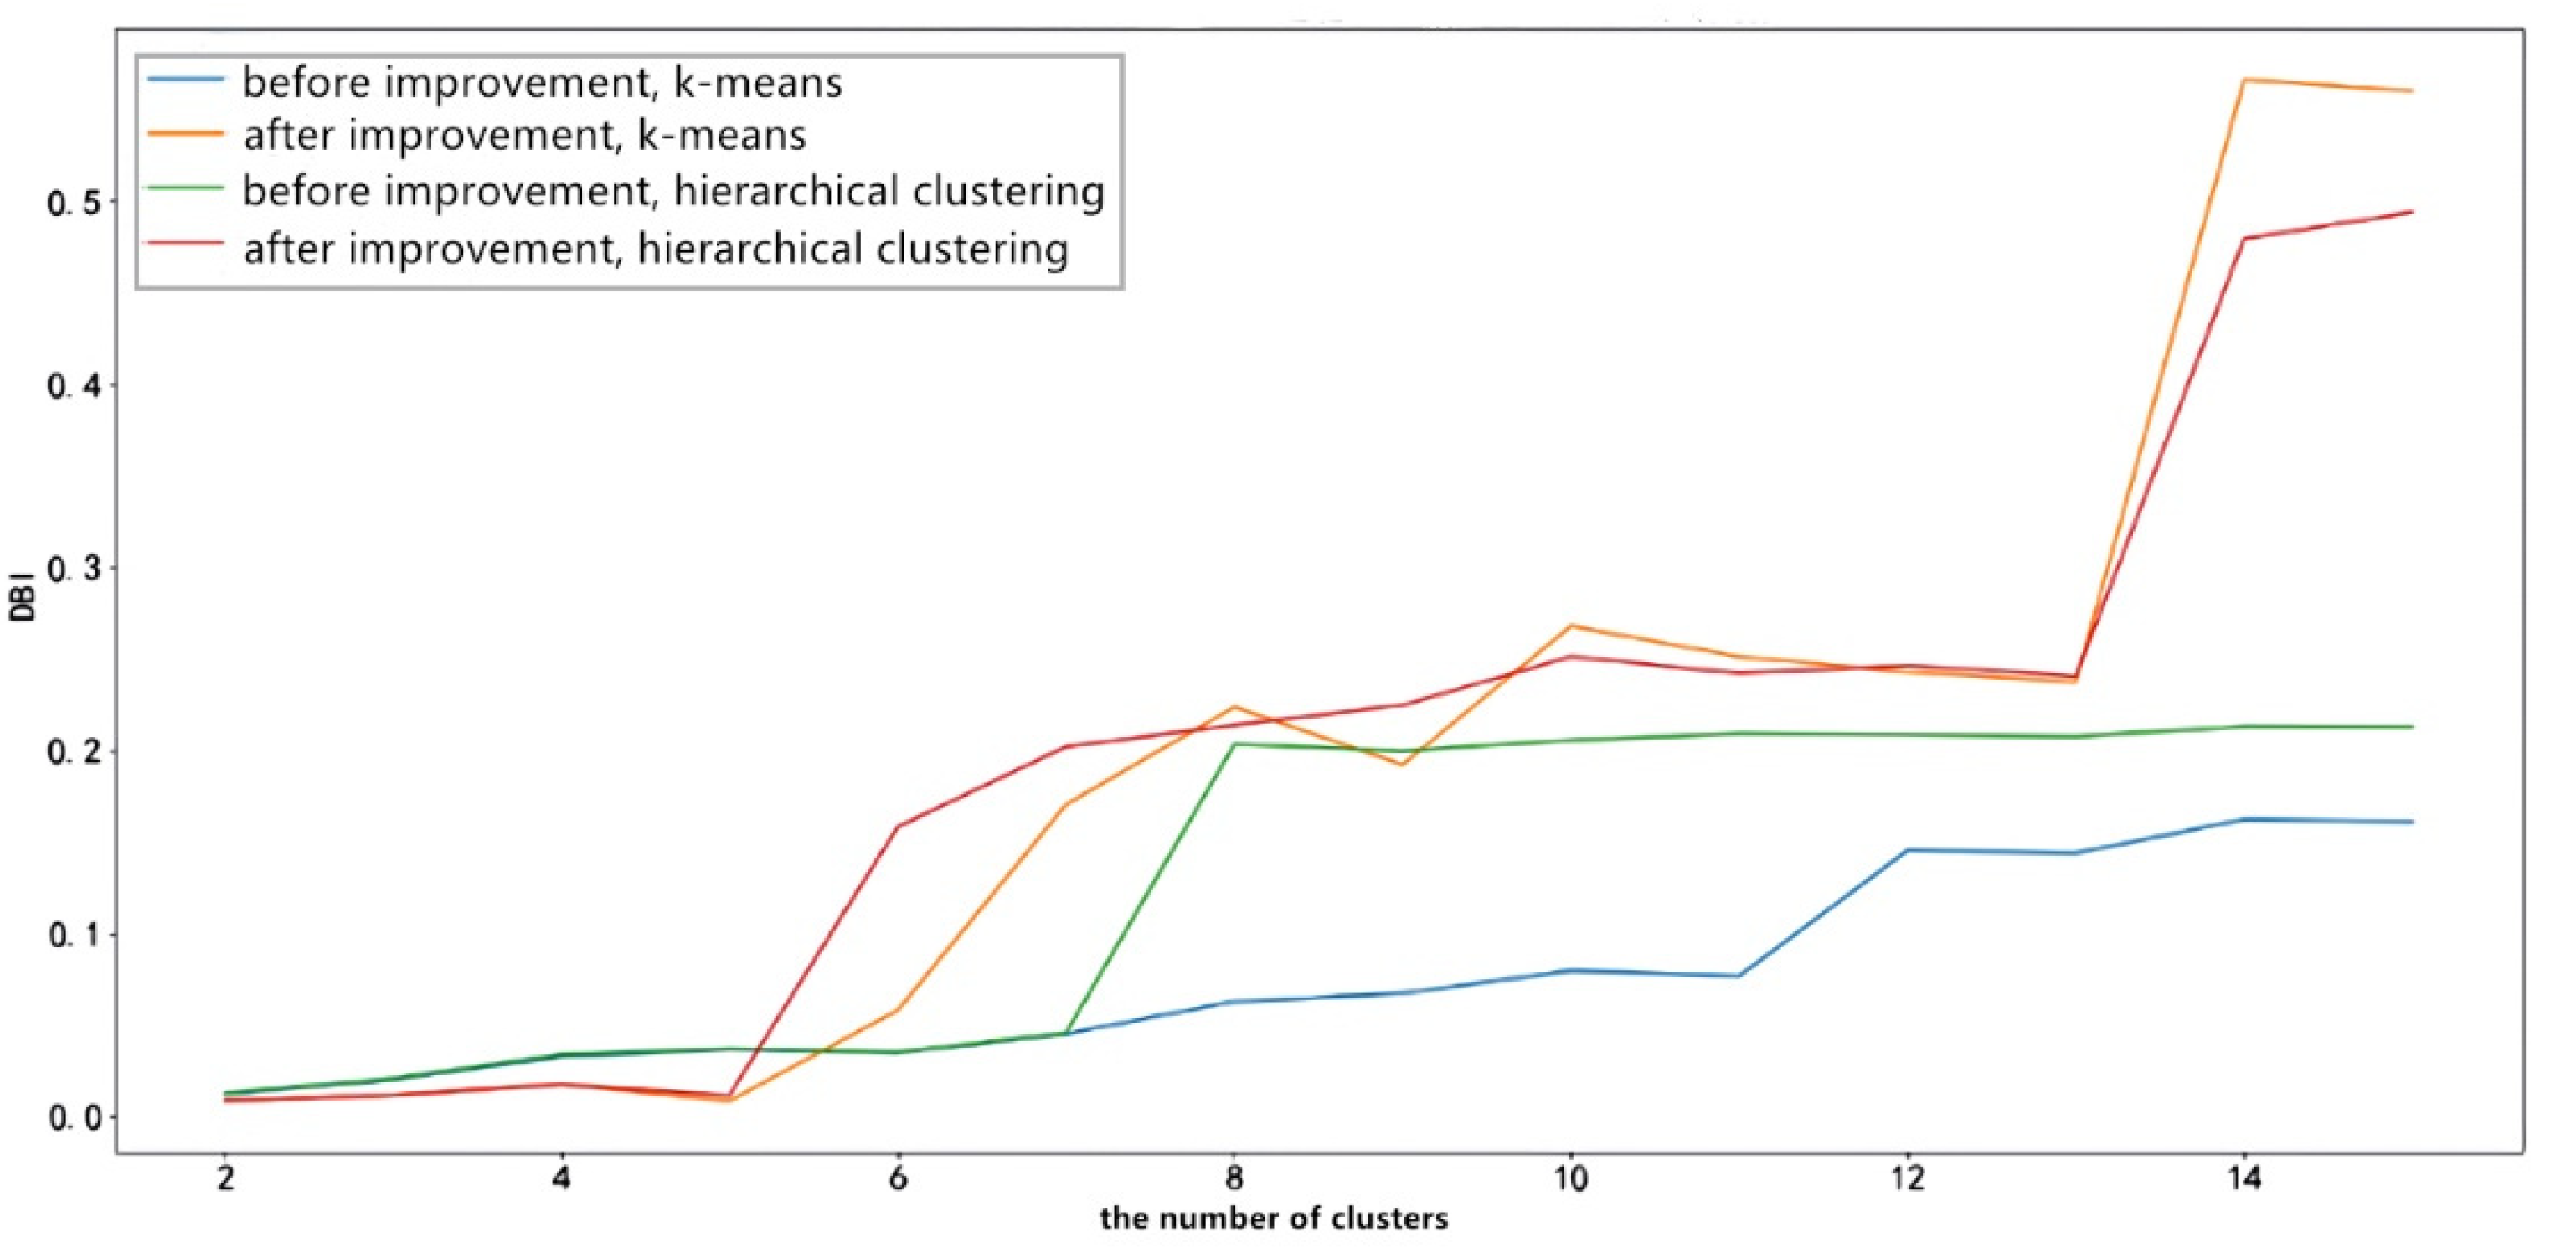
The DBI indices of different clustering algorithms based on the Markov feature engineering and the improved Markov feature engineering are obtained by calculation, as shown in Figure 8:

Figure 8.
Comparison diagram of clustering DBI index before and after improvement.
In general, when the number of clusters exceeds 5, the DBI of the improved Markov feature engineering under any clustering method is much smaller than the DBI before the improvement. The effect is more apparent when the number of clusters increases.
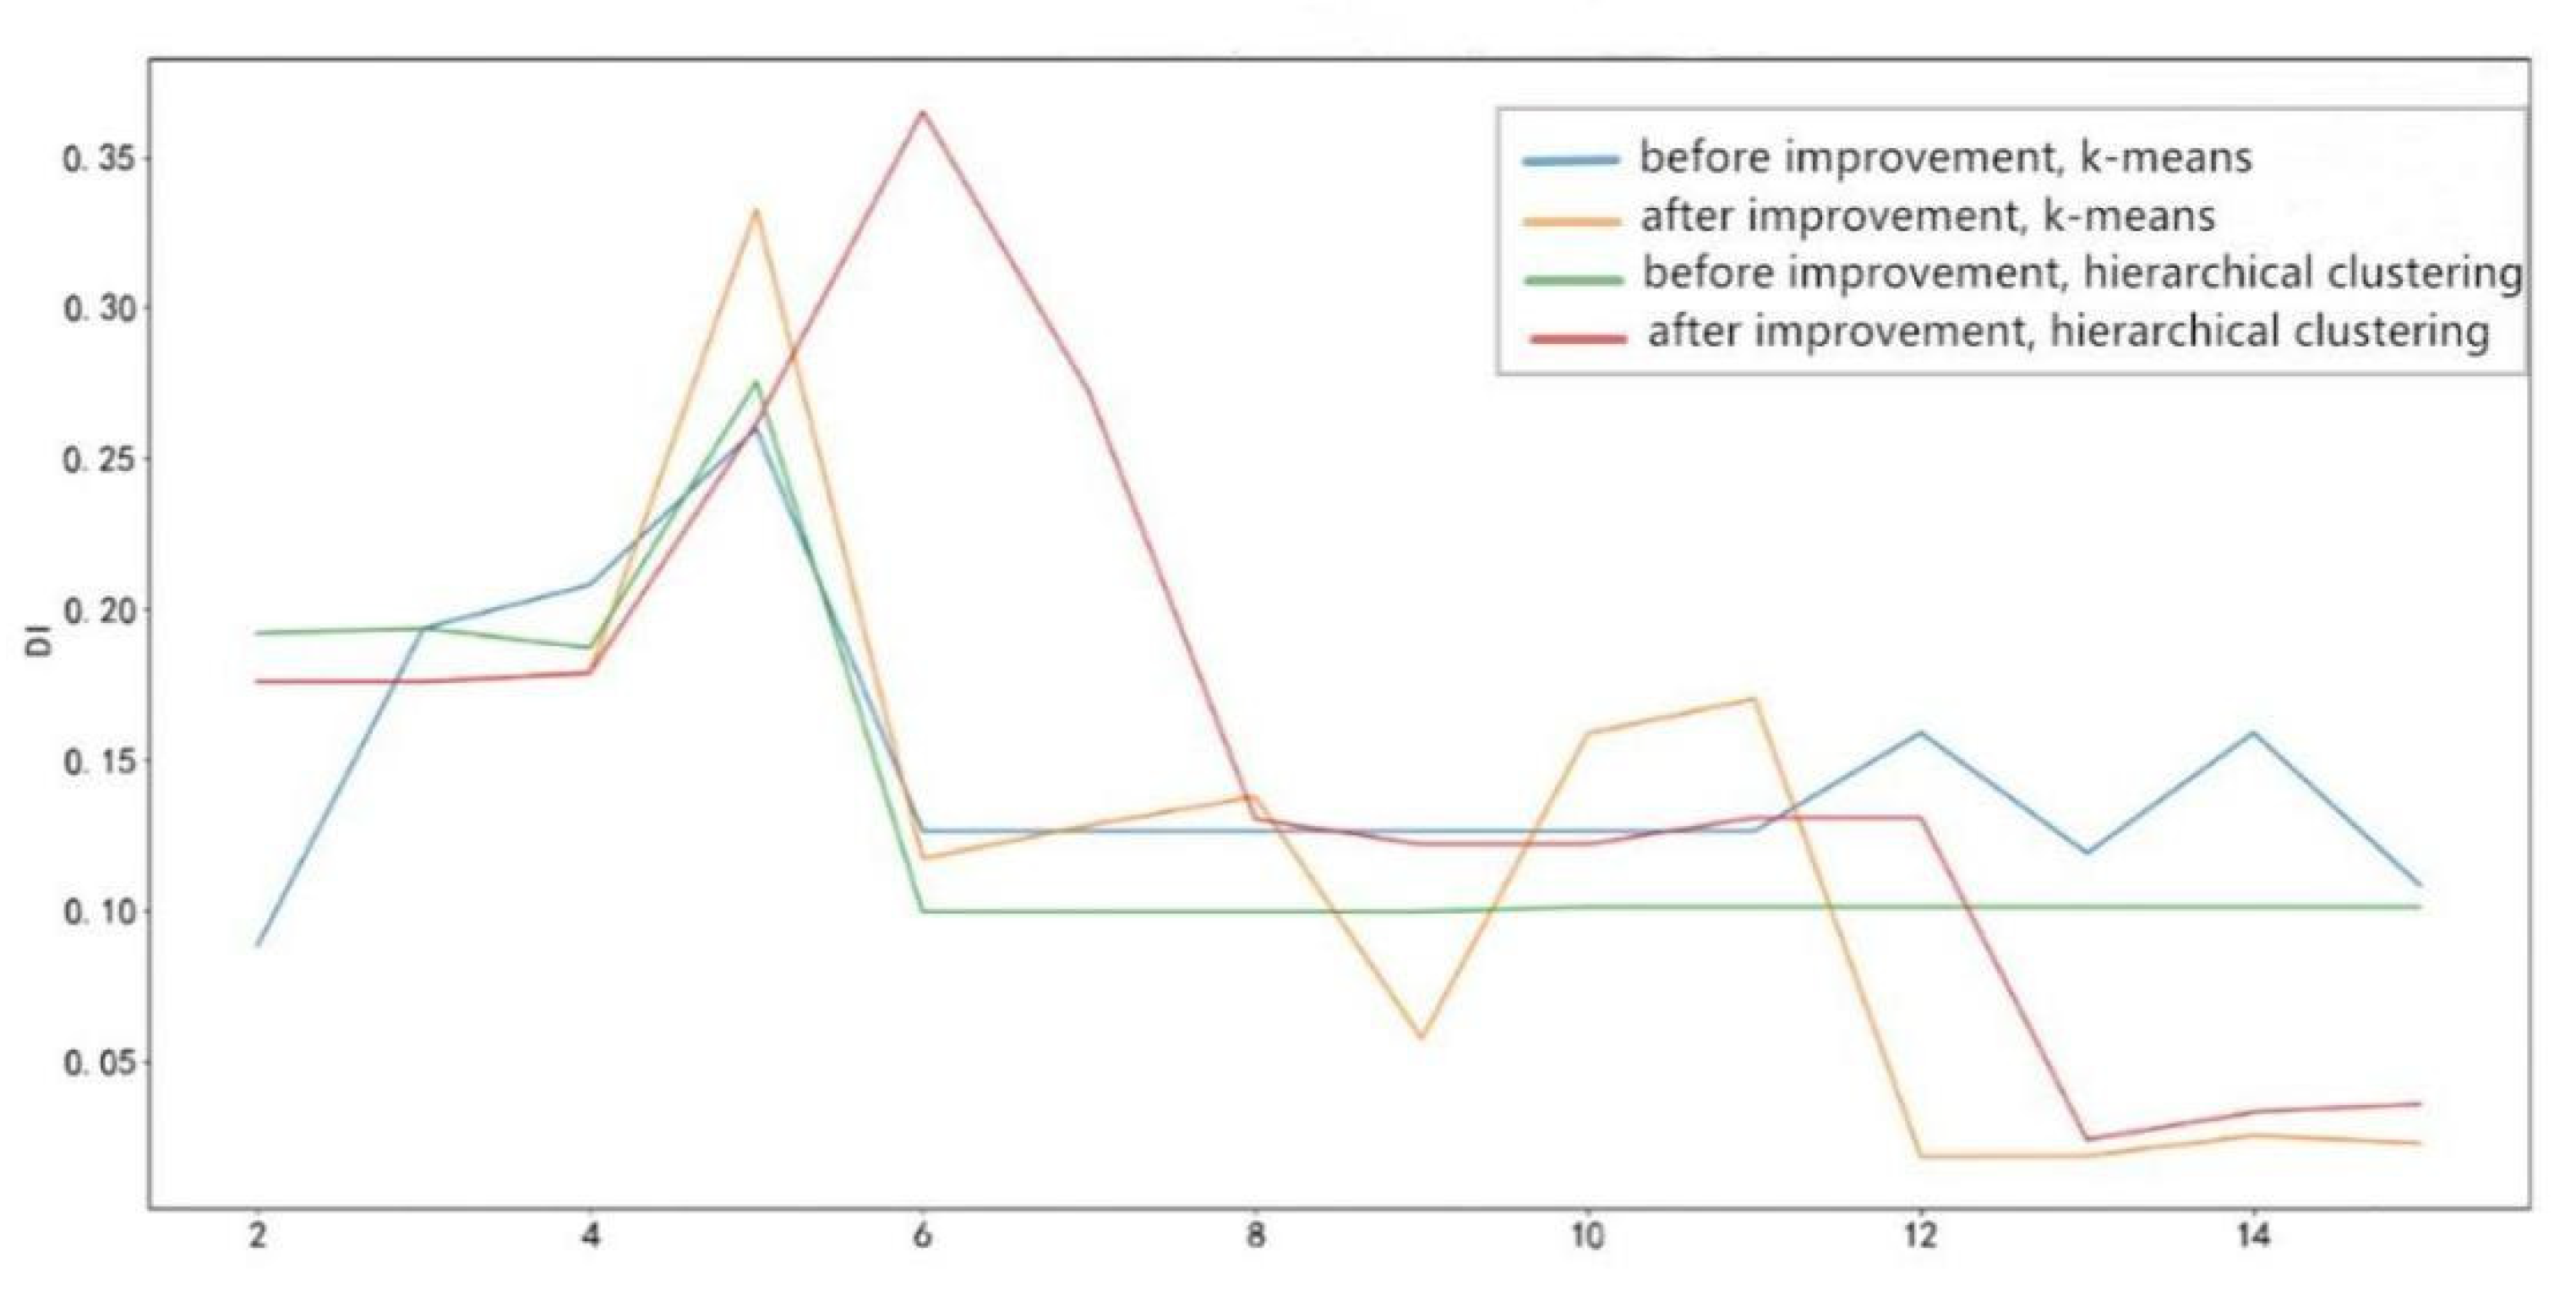
The DI of different clustering algorithms based on the Markov feature engineering and the improved Markov feature engineering is obtained by calculation, as shown in Figure 9.

Figure 9.
Comparison diagram of clustering DI index before and after improvement.
It can be found from the figure that when the number of clusters is between 2 and 7, the DI increases, but after that, the DI starts to decrease. When the number of clusters is greater than 11, the DI of the improved feature engineering is still relatively stable. In contrast, the DI of the pre-improvement feature engineering is very small under any algorithm, and the clustering effect becomes generally poor.
- (3)
- Abnormal sample detection results
Two example of fault diagnosis based on the improved k-means clustering algorithm are shown in Figure 10 and Figure 11 (Different colors are used to represent different clusters in the diagram).
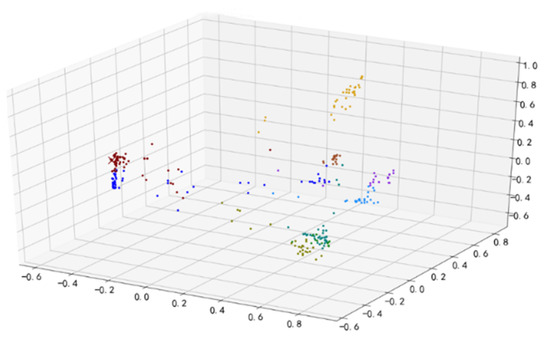
Figure 10.
Cluster distribution under k-means (normal sample).
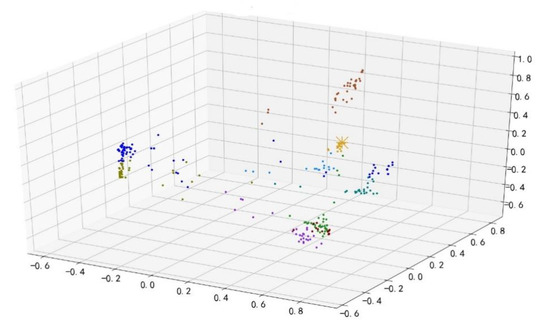
Figure 11.
Cluster distribution under k-means (abnormal sample).
The sample anomaly rate is defined as follows in this paper:
is the total number of samples, is the number of elements in the cluster where the current sample is located. In order to compare the accuracy of samples and enhance the robustness of the algorithm, a normalization factor is introduced to the normality of samples
is the normalization factor that is used to normalize the function, which the following formula can obtain:
Then, the abnormal rate of the sample is:
The experiment result (Figure 10) shows a normal sample using the improved clustering algorithm. In this case, there are 10 clusters, and the cluster in which the sample is located is number 2. No. 2 cluster has 55 samples. The total number of samples is 480, the smallest cluster has 10 samples, and the largest cluster has 73 samples. The abnormal rate of this sample is 28.75%.
The experiment result (Figure 11) shows an abnormal sample using the improved clustering algorithm. In this case, there are 10 clusters, and the cluster in which the sample is located is number 5. No. 5 cluster has 17 samples. The total number of samples is 481, the smallest cluster has 10 samples, and the largest cluster has 73 samples. The abnormal rate of this sample is 88.89%.
The larger the value is, the fewer elements in the cluster, and the greater the possibility of abnormality.
6. Conclusions
In the research of fault detection algorithm of the autonomous unmanned system, most researchers focus on the use of fault detection algorithm of a specific device and the lack of a unified fault detection method for multiple devices in the system. The specific work is as follows:
- Based on the time series data of unmanned autonomous system and the time series data of various devices, a fault diagnosis algorithm based on time series and clustering is proposed. This method can be applied to a variety of devices.
- A time series symbolic representation method based on Gaussian mixture clustering is proposed. By symbolizing the time series to perform dimensionality reduction operations on the data, it can reduce the complexity of clustering calculations and reduce the impact of noise data on autonomous data. Compared with other time series symbolization methods, this method has better fitting effect and is more convenient for subsequent clustering operations.
- A method for measuring the similarity of time series based on Markov chain model is proposed. This method further improves the original method and performs different probability calculations for the transition between states and the transition of the state itself to further optimize the clustering effect.
- Through experiments, we found that the improved clustering algorithm can better detect abnormal data.
Author Contributions
Conceptualization, Z.X. and Q.L.; methodology, Z.X. and M.W.; writing—original draft preparation, Z.X.; project administration, L.Q. All authors have read and agreed to the published version of the manuscript.
Funding
This work was supported in part by The 4th project “Research on the Key Technology of Endogenous Security Switches” (2020YFB1804604) of the National Key R&D Program “New Network Equipment Based on Independent Programmable Chips” (2020YFB1804600), the 2020 Industrial Internet Innovation and Development Project from Ministry of Industry and Information Technology of China, the Fundamental Research Fund for the Central Universities (30918012204, 30920041112), the 2019 Industrial Internet Innovation and Development Project from Ministry of Industry and Information Technology of China.
Data Availability Statement
The data presented in this study are available from the corresponding authors. The data cannot be made public as it relates to ongoing projects.
Conflicts of Interest
We declare that we have no financial and personal relationships with other people or organizations that can inappropriately influence our work, and there is no professional or other personal interest of any nature or kind in any product, service and/or company that could be construed as influencing the position presented in, or the review of this manuscript.
References
- Liu, M.; Ke, Y.; Wang, A.; Liu, Z.; Li, J. Fault-tolerant control approach for multi-agent systems with multiple failures. J. Hangzhou Dianzi Univ. (Nat. Sci.) 2022, 42, 7. [Google Scholar]
- Qian, M.; Xiong, K. Fault tolerant control scheme design for formation flight control system of multiple unmanned aerial vehicles. Trans. Nanjing Univ. Aeronaut. Astronaut. 2018, 35, 693–701. [Google Scholar]
- Li, X.; Li, W.; Yang, Q.; Yan, W.; Zomaya, A.Y. An unmanned inspection system for multiple defects detection in photovoltaic plants. IEEE J. Photovolt. 2020, 10, 568–576. [Google Scholar] [CrossRef]
- Du, C.; Zhang, X.; Zhong, R.; Li, F.; Yu, F.; Rong, Y.; Gong, Y. Unmanned aerial vehicle rotor fault diagnosis based on interval sampling reconstruction of vibration signals and a one-dimensional convolutional neural network deep learning method. Meas. Sci. Technol. 2022, 33, 065003. [Google Scholar] [CrossRef]
- Gao, T.; Sheng, W.; Yin, Y.; Du, X. A transfer learning based unmanned aerial vehicle mems inertial sensors fault diagnosis method. J. Phys. Conf. Ser. 2021, 1852, 042084. [Google Scholar] [CrossRef]
- Zhu, D.; Sun, B. Information fusion fault diagnosis method for unmanned underwater vehicle thrusters. IET Electr. Syst. Transp. 2013, 3, 102–111. [Google Scholar] [CrossRef]
- Yuan, X.; Peng, J.; Yang, D.; Hao, R.S. Research on automatic monitoring and fault diagnosis system of unmanned cabin. EPH Int. J. Sci. Eng. 2017, 3, 1–7. [Google Scholar]
- Martínez-Morales, J.D.; Palacios-Hernández, E.R.; Campos-Delgado, D.U. Multiple-fault diagnosis in induction motors through support vector machine classification at variable operating conditions. Electr. Eng. 2018, 100, 59–73. [Google Scholar] [CrossRef]
- Cheng, G.; Chen, X.H.; Shan, X.L.; Liu, H.G.; Zhou, C.F. A new method of gear fault diagnosis in strong noise based on multi-sensor information fusion. J. Vib. Control 2016, 22, 1504–1515. [Google Scholar] [CrossRef]
- Othman, M.S.; Nuawi, M.; Mohamed, R. Vibration and acoustic emission signal monitoring for detection of induction motor bearing fault. Int. J. Eng. Res. Technol. 2015, 4, 924–929. [Google Scholar]
- Seshadrinath, J.; Singh, B.; Panigrahi, B.K. Investigation of vibration signatures for multiple fault diagnosis in variable frequency drives using complex wavelets. IEEE Trans. Power Electron. 2013, 29, 936–945. [Google Scholar] [CrossRef]
- Estima, J.O.; Cardoso, A.J.M. A new algorithm for real-time multiple open-circuit fault diagnosis in voltage-fed pwm motor drives by the reference current errors. IEEE Trans. Ind. Electron. 2013, 60, 3496–3505. [Google Scholar] [CrossRef]
- Martinez-Herrera, A.L.; Ferrucho-Alvarez, E.R.; Ledesma-Carrillo, L.M.; Mata-Chavez, R.I.; Lopez-Ramirez, M.; Cabal-Yepez, E. Multiple fault detection in induction motors through homogeneity and kurtosis computation. Energies 2022, 15, 1541. [Google Scholar] [CrossRef]
- Liu, Z.; Guo, W.; Tang, Z.; Chen, Y. Multi-sensor data fusion using a relevance vector machine based on an ant colony for gearbox fault detection. Sensors 2015, 15, 21857–21875. [Google Scholar] [CrossRef] [PubMed] [Green Version]
- Xiong, G.; Shi, D.; Chen, J.; Lin, Z.; Duan, X. Divisional fault diagnosis of large-scale power systems based on radial basis function neural network and fuzzy integral. Electr. Power Syst. Res. 2013, 105, 9–19. [Google Scholar] [CrossRef]
- Yu, C.; Ma, S.; Wen, X. Application of natural gradient algorithm for the aircraft engine vibration signal separation and fault diagnosis. J. Converg. Inf. Technol. 2012, 7, 382–388. [Google Scholar]
- Li, P.; Chai, Y.; Cen, M.; Qiu, Y.; Zhang, K. Multiple fault diagnosis of analog circuit using quantum hopfield neural network. In Proceedings of the 25th Chinese Control and Decision Conference (CCDC), Guiyang, China, 25–27 May 2013; pp. 4238–4243. [Google Scholar]
- Guo, X.-G.; Tian, M.-E.; Li, Q.; Ahn, C.K.; Yang, Y.-H. Multiple-fault diagnosis for spacecraft attitude control systems using rbfnn-based observers. Aerosp. Sci. Technol. 2020, 106, 106195. [Google Scholar] [CrossRef]
- Keogh, E.; Chakrabarti, K.; Pazzani, M.; Mehrotra, S. Dimensionality reduction for fast similarity search in large time series databases. Knowl. Inf. Syst. 2001, 3, 263–286. [Google Scholar] [CrossRef]
- Lin, J.; Keogh, E.; Lonardi, S.; Chiu, B. A symbolic representation of time series, with implications for streaming algorithms. In Proceedings of the 8th ACM SIGMOD Workshop on Research Issues in Data Mining and Knowledge Discovery, San Diego, CA, USA, 13 June 2003; Association for Computing Machinery: San Diego, CA, USA, 2003; pp. 2–11. [Google Scholar]
- Muhammad Fuad, M.M. Modifying the symbolic aggregate approximation method to capture segment trend information. In Modeling Decisions for Artificial Intelligence; Torra, V., Narukawa, Y., Nin, J., Agell, N., Eds.; Springer International Publishing: Cham, Switzerland; pp. 230–239.
- Bai, X.; Xiong, Y.; Zhu, Y.; Zhu, H. Time series representation: A random shifting perspective. In Proceedings of the 14th International Conference on Web-Age Information Management, Beidaihe, China, 14–16 June 2013; Springer: Beidaihe, China, 2013; pp. 37–50. [Google Scholar]
- Malinowski, S.; Guyet, T.; Quiniou, R.; Tavenard, R. 1d-sax: A novel symbolic representation for time series. In Advances in Intelligent Data Analysis XII; Tucker, A., Höppner, F., Siebes, A., Swift, S., Eds.; Springer: Berlin/Heidelberg, Germany; pp. 273–284.
- Yin, H.; Yang, S.-Q.; Zhu, X.-Q.; Ma, S.-D.; Zhang, L.-M. Symbolic representation based on trend features for knowledge discovery in long time series. Front. Inf. Technol. Electron. Eng. 2015, 16, 744–758. [Google Scholar] [CrossRef]
- Pham, N.D.; Le, Q.L.; Dang, T.K. Two novel adaptive symbolic representations for similarity search in time series databases. In Proceedings of the 2010 12th International Asia-Pacific Web Conference, Buscan, Korea, 6–8 April 2010; pp. 181–187. [Google Scholar]
- Barnaghi, P.M.; Bakar, A.A.; Othman, Z.A. Enhanced symbolic aggregate approximation method for financial time series data representation. In Proceedings of the 2012 6th International Conference on New Trends in Information Science, Service Science and Data Mining (ISSDM2012), Taipei, Taiwan, 23–25 October 2012; pp. 790–795. [Google Scholar]
- dos Santos Passos, H.; Teodoro, F.G.S.; Duru, B.M.; de Oliveira, E.L.; Peres, S.M.; Lima, C.A.M. Symbolic representations of time series applied to biometric recognition based on ecg signals. In Proceedings of the 2017 International Joint Conference on Neural Networks (IJCNN), Anchorage, AL, USA, 14–19 May 2017; pp. 3199–3207. [Google Scholar]
- Lin, J.; Khade, R.; Li, Y. Rotation-invariant similarity in time series using bag-of-patterns representation. J. Intell. Inf. Syst. 2012, 39, 287–315. [Google Scholar] [CrossRef] [Green Version]


Publisher’s Note: MDPI stays neutral with regard to jurisdictional claims in published maps and institutional affiliations. |
© 2022 by the authors. Licensee MDPI, Basel, Switzerland. This article is an open access article distributed under the terms and conditions of the Creative Commons Attribution (CC BY) license (https://creativecommons.org/licenses/by/4.0/).