Abstract
Existing object detection methods with many parameters and computations are not suitable for deployment on devices with poor performance in agricultural environments. Therefore, this study proposes a lightweight crop pest detection method based on convolutional neural networks, named YOLOLite-CSG. The basic architecture of the method is derived from a simplified version of YOLOv3, namely YOLOLite, and k-means++ is utilized to improve the generation process of the prior boxes. In addition, a lightweight sandglass block and coordinate attention are used to optimize the structure of residual blocks. The method was evaluated on the CP15 crop pest dataset. Its detection precision exceeds that of YOLOv3, at 82.9%, while the number of parameters is 5 million, only 8.1% of the number used by YOLOv3, and the number of computations is 9.8 GFLOPs, only 15% of that used by YOLOv3. Furthermore, the detection precision of the method is superior to all other commonly used object detection methods evaluated in this study, with a maximum improvement of 10.6%, and it still has a significant edge in the number of parameters and computation required. The method has excellent pest detection precision with extremely few parameters and computations. It is well-suited to be deployed on equipment for detecting crop pests in agricultural environments.
1. Introduction
The traditional crop pest monitoring system relies on observation and analysis by the administrator [1]. Incorrect judgments occur frequently. With the rise of machine learning technology, detecting pests using machine learning techniques has become common [2]. Chu et al. [3] developed an automated pest monitoring system. The system uses a drone to capture images and extracts the histogram of oriented gradient (HOG) features of grayscaled images to feed into a support vector machine (SVM) to identify pests. The system’s detection precision of 88.9% on a self-built dataset exceeds that of methods using other feature descriptors, indicating that HOG can extract high-quality features. This process of first extracting features from images and then inputting them into a machine learning classifier is used by many pest monitoring systems [4]. Following this standard process, Shah et al. [5] designed a pest detection system for sticky traps. The system uses k-means to segment the pest images captured by sticky traps and converts the color space to HSI, which is more suitable for use in the detection task to extract features such as the mean and standard deviation. In the classification stage, the authors evaluated the performance of the K-nearest neighbor (KNN) and the decision tree. The KNN outperformed the decision tree in several metrics such as precision and recall, largely because KNN can classify pests with reference to past knowledge. In addition, the application of color space and image segmentation in the system provides new tools for building pest detection systems. Additionally, using these tools, Gutierrez et al. [6] used image processing methods such as color space transformation and threshold segmentation from the HALCON library to segment the original pest images and extract the features that are used for classifying pests in a machine learning classifier. It is worth mentioning that this pest detection method uses a Multilayer Perceptron (MLP) that performs better than common machine learning classifiers such as KNN in the classification stage, and achieves a far superior precision in the ten-fold cross-validation. This is mainly due to the deeper structure of the MLP, which can learn more complex mapping relationships. Pest detection methods based on machine learning techniques rely on the artificial selection and extraction of visual features, which limits the generalization ability of feature representation, resulting in such methods being susceptible to interference from background changes, morphological changes, and other factors, as well as the instability of detection precision [7].
The rise of convolutional neural networks has greatly improved the generalization of feature representations and improved the performance of learning systems in various tasks. Dalai et al. [8] used cameras fixed in farmland to take pictures of the pests and diseases, and enhanced the quality of the original data by image processing methods such as color space conversion and threshold segmentation. These images were finally fed into Single Shot MultiBox Detector (SSD), Faster R-CNN, and Mask R-CNN to detect pests. Thanks to the more complex network structure, Faster R-CNN achieved the best results on most classes. Kang et al. [9] evaluated various convolutional neural networks such as ResNet and Visual Geometry Group (VGG), and built a garbage classification system with ResNet-34, as well as introducing multiplex feature fusion, a feature reuse mechanism and new activation functions to improve the classification performance. The results of the ablation experiment show the effectiveness of the improvements. The final precision achieved was 99.9%, which fully demonstrated the powerful performance of convolutional neural networks. Mujahid et al. [10] pioneered the application of YOLOv3, an object detection method based on convolutional neural networks, in the field of gesture recognition and trained a YOLOv3-based gesture recognition model using a gesture dataset constructed from videos. The model obtained a detection precision of up to 97.68% and also worked well in low-resolution and complex environments. Awan et al. [11] focused on optimizing hyperparameters such as the optimizer, activation function, and loss function to improve the performance of U-Net in the anterior cruciate ligament (ACL) segmentation on magnetic resonance imaging (MRI) images, and finally adopted the Adam optimizer, sigmoid activation function, and loss function combining binary cross entropy and dice loss. The experimental results on the ACL MRI image dataset show that the improved U-Net obtains stable and outstanding results in several metrics such as precision and intersection over union (IoU), which provide valuable experience for improving other learning systems based on convolutional neural networks.
Object detection methods based on convolutional neural networks are also widely used for crop pest detection [12]. According to division by the number of detection stages, this type of object detection method can be classified as either two-stage or one-stage [13]. Two-stage object detection methods split the detection process into the generation and detection of candidate boxes, while one-stage object detection methods detect objects directly through an end-to-end regression process. Two-stage object detection methods such as Mask R-CNN [14] were earlier applied to crop pest detection. Rong et al. [15] designed a field pest detection method based on Mask R-CNN. To determine the proportion of semantic and spatial information in different levels of feature fusion, learnable weight coefficients were introduced for the feature fusion process of the Feature Pyramid Network (FPN) structure [16]. The method achieves up to 80.2% mAP, which is an improvement of 0.6% compared to the original Mask R-CNN, and far exceeds other methods such as Faster R-CNN. Such results fully demonstrate the importance of the reasonable fusion of semantic and spatial information. The FPN structure is widely used by learning systems in crop pest detection tasks to fuse features. Wang et al. [17] similarly improved the FPN structure to expand the receptive field in the low layer and introduced bilinear interpolation for RoI pooling. These two improvements improved the detection of tiny pests. Meanwhile, Convolutional Block Attention Module (CBAM) was introduced into the backbone network to increase the targeting of feature extraction. The detection precision of the method is significantly improved compared with the original method, reaching up to 87.7% and demonstrating the effectiveness of the improvements. The complex structure of two-stage object detection methods leads to high training difficulty and slow inference, leading some researchers to turn to one-stage object detection methods such as SSD for crop pest detection. Based on the idea of feature fusion, widely used in two-stage object detection methods, Lyu et al. [18] designed a module for the SSD method that fuses semantic and spatial information between high and low layers to solve the problem of feature loss for small targets. Meanwhile, k-means clustering is used to generate more matching prior boxes for the self-constructed pest dataset. Experimental results on the dataset show that the improved SSD method has absolute advantages in terms of precision and speed, which demonstrates the improved effect of feature fusion and k-means. Silveira et al. [19] trained a YOLOv3 [20] model for detecting soybean pests. This model also used the FPN structure for feature fusion and k-means to generate better prior boxes. The model finally obtained a high precision of 95.15% and an F-score of 84.35% on the self-built INSECT12C soybean pest dataset, which can be used for practical soybean pest detection. The above CNN-based detection methods rely on prior boxes, and the generalizability is limited by the different requirements of prior boxes for different datasets. To release themselves from the reliance on prior boxes, the researchers proposed detection methods without prior boxes, such as CornerNet [21] and CenterNet [22], and detected objects by related points. However, the lack of prior knowledge leads to poor results in crop pest detection tasks [23], and there is less related research.
Object detection methods based on convolutional neural networks show significant improvements in generalization ability and detection precision, and have become the preferred methods for crop pest detection. However, this type of method has more parameters and requires more computations, which limits its practical deployment in agricultural environments. In recent years, researchers have proposed some more lightweight object detection methods [24]. YOLOv3-tiny and YOLOv4-tiny are representative works, which are widely used for crop pest detection. Chen et al. [25] deployed YOLOv3-tiny on the embedded platform of a small unmanned aerial vehicle (UAV) for detecting pests. The detection results were fed to an edge computing server to plan the flight path of the pesticide spraying UAV and to guide accurate pesticide spraying. The experimental results show that the inference speed of YOLOv3-tiny is three times faster than that of YOLOv3. However, there is a significant decrease in the detection precision. Based on this idea of deploying detection methods on an embedded platform, Pham et al. [26] designed a sticky trap containing an optical camera and a Raspberry Pi Board, and deployed YOLOv4-tiny, SSD-MobileNetV1 and SSD-MobileNetV2 on Raspberry Pi. However, the quality of the actual detection boxes was poor. The detection precision decreased significantly after increasing the IoU threshold. Genaev et al. [27] extended the platform on which the detection method was deployed. They trained YOLOv4-tiny based on synthetic images of fruit flies to build a crop pest detection model that predicts the sex of fruit flies and counts them. The model was deployed in an android application, which had some detection effect, and yet was still inferior to the detection precision of human experts. Fewer parameters and computations are the main reasons for the significantly decreased precision of crop pest detection with this type of object detection methods.
The device performance in agricultural environments is usually low, which makes it difficult to meet the computational performance and storage performance requirements of regular-size object detection methods. Meanwhile, the detection precision of lightweight object detection methods proposed in recent years has significantly decreased, which is not conducive to the detection of crop pests. There is an urgent need to build a high-precision crop pest detection method with fewer parameters and less computation. Therefore, aiming to meet these requirements while ensuring high detection precision in pest detection tasks, this study proposes a lightweight crop pest detection method based on convolutional neural networks, named YOLOLite-CSG.
We first simplify the YOLOv3 method by adjusting the number of channels and the number of residual blocks to obtain a more lightweight object detection method, YOLOLite, which has approximately one-fifth of the number of parameters and computational requirements of YOLOv3, but only a small decrease in detection precision. This reduction in parameters and computation is important for building lightweight detection methods. Meanwhile, this study innovatively uses k-means++ to generate the prior boxes, which is one of the novelties of this study. Compared with k-means, the prior box generated by k-means++ has a wider distribution and a higher degree of matching with the dataset, which is crucial to enhance the pest detection effectiveness of the detection method at multiple sizes. In addition, a lightweight sandglass block named LightSandGlass is proposed in this study, which is another important point of novelties in this study. This lightweight sandglass block creatively uses group convolution to significantly reduce the number of parameters and the level of computation. Meanwhile, the channel shuffle operation is introduced to compensate for the insufficient inter-channel information fusion caused by group convolution. The lightweight sandglass block also uses a better loss function, . The number of parameters of the lightweight sandglass block is almost one-third of that of the original sandglass block, and the number of computations is also significantly reduced, while still having a strong ability to extract spatial and channel information. As one of the main building blocks, the reduction in the number of parameters and computations in the sandglass block is important to maintain its light weight. Finally, we introduce a coordinate attention [28] mechanism for both classical residual blocks and lightweight sandglass blocks. The environment in which crop pests live is more complex. The coordinate attention mechanism can guide the feature extraction process and suppress the interference of noisy information, which can help extract a better feature representation. With the above improvements, this study builds a crop detection method with an extremely low number of parameters and computations, and high pest detection precision. Experimental results on the CP15 dataset demonstrate the advantages of the method in terms of the number of parameters, the number of computations and detection accuracy, meeting the requirements of pest detection tasks in agricultural environments. The method can be used to build lightweight and highly accurate crop pest detection systems in agricultural environments, such as being deployed in sticky traps to detect pests. The method can also be embedded in android applications to build a pest detection gadget. The basic building sequence of the method proposed in this study is the overall structure, the generation method of the prior boxes, and the feature extraction process. This clear sequence can be used as a reference for researchers to build task-specific detection methods and accelerate the progress of detection method research. Moreover, the method of reducing the number of parameters and computations adopted in the overall structure and building blocks can guide the following research on lightweight object detection methods.
2. Materials and Methods
2.1. Dataset and Data Augmentation
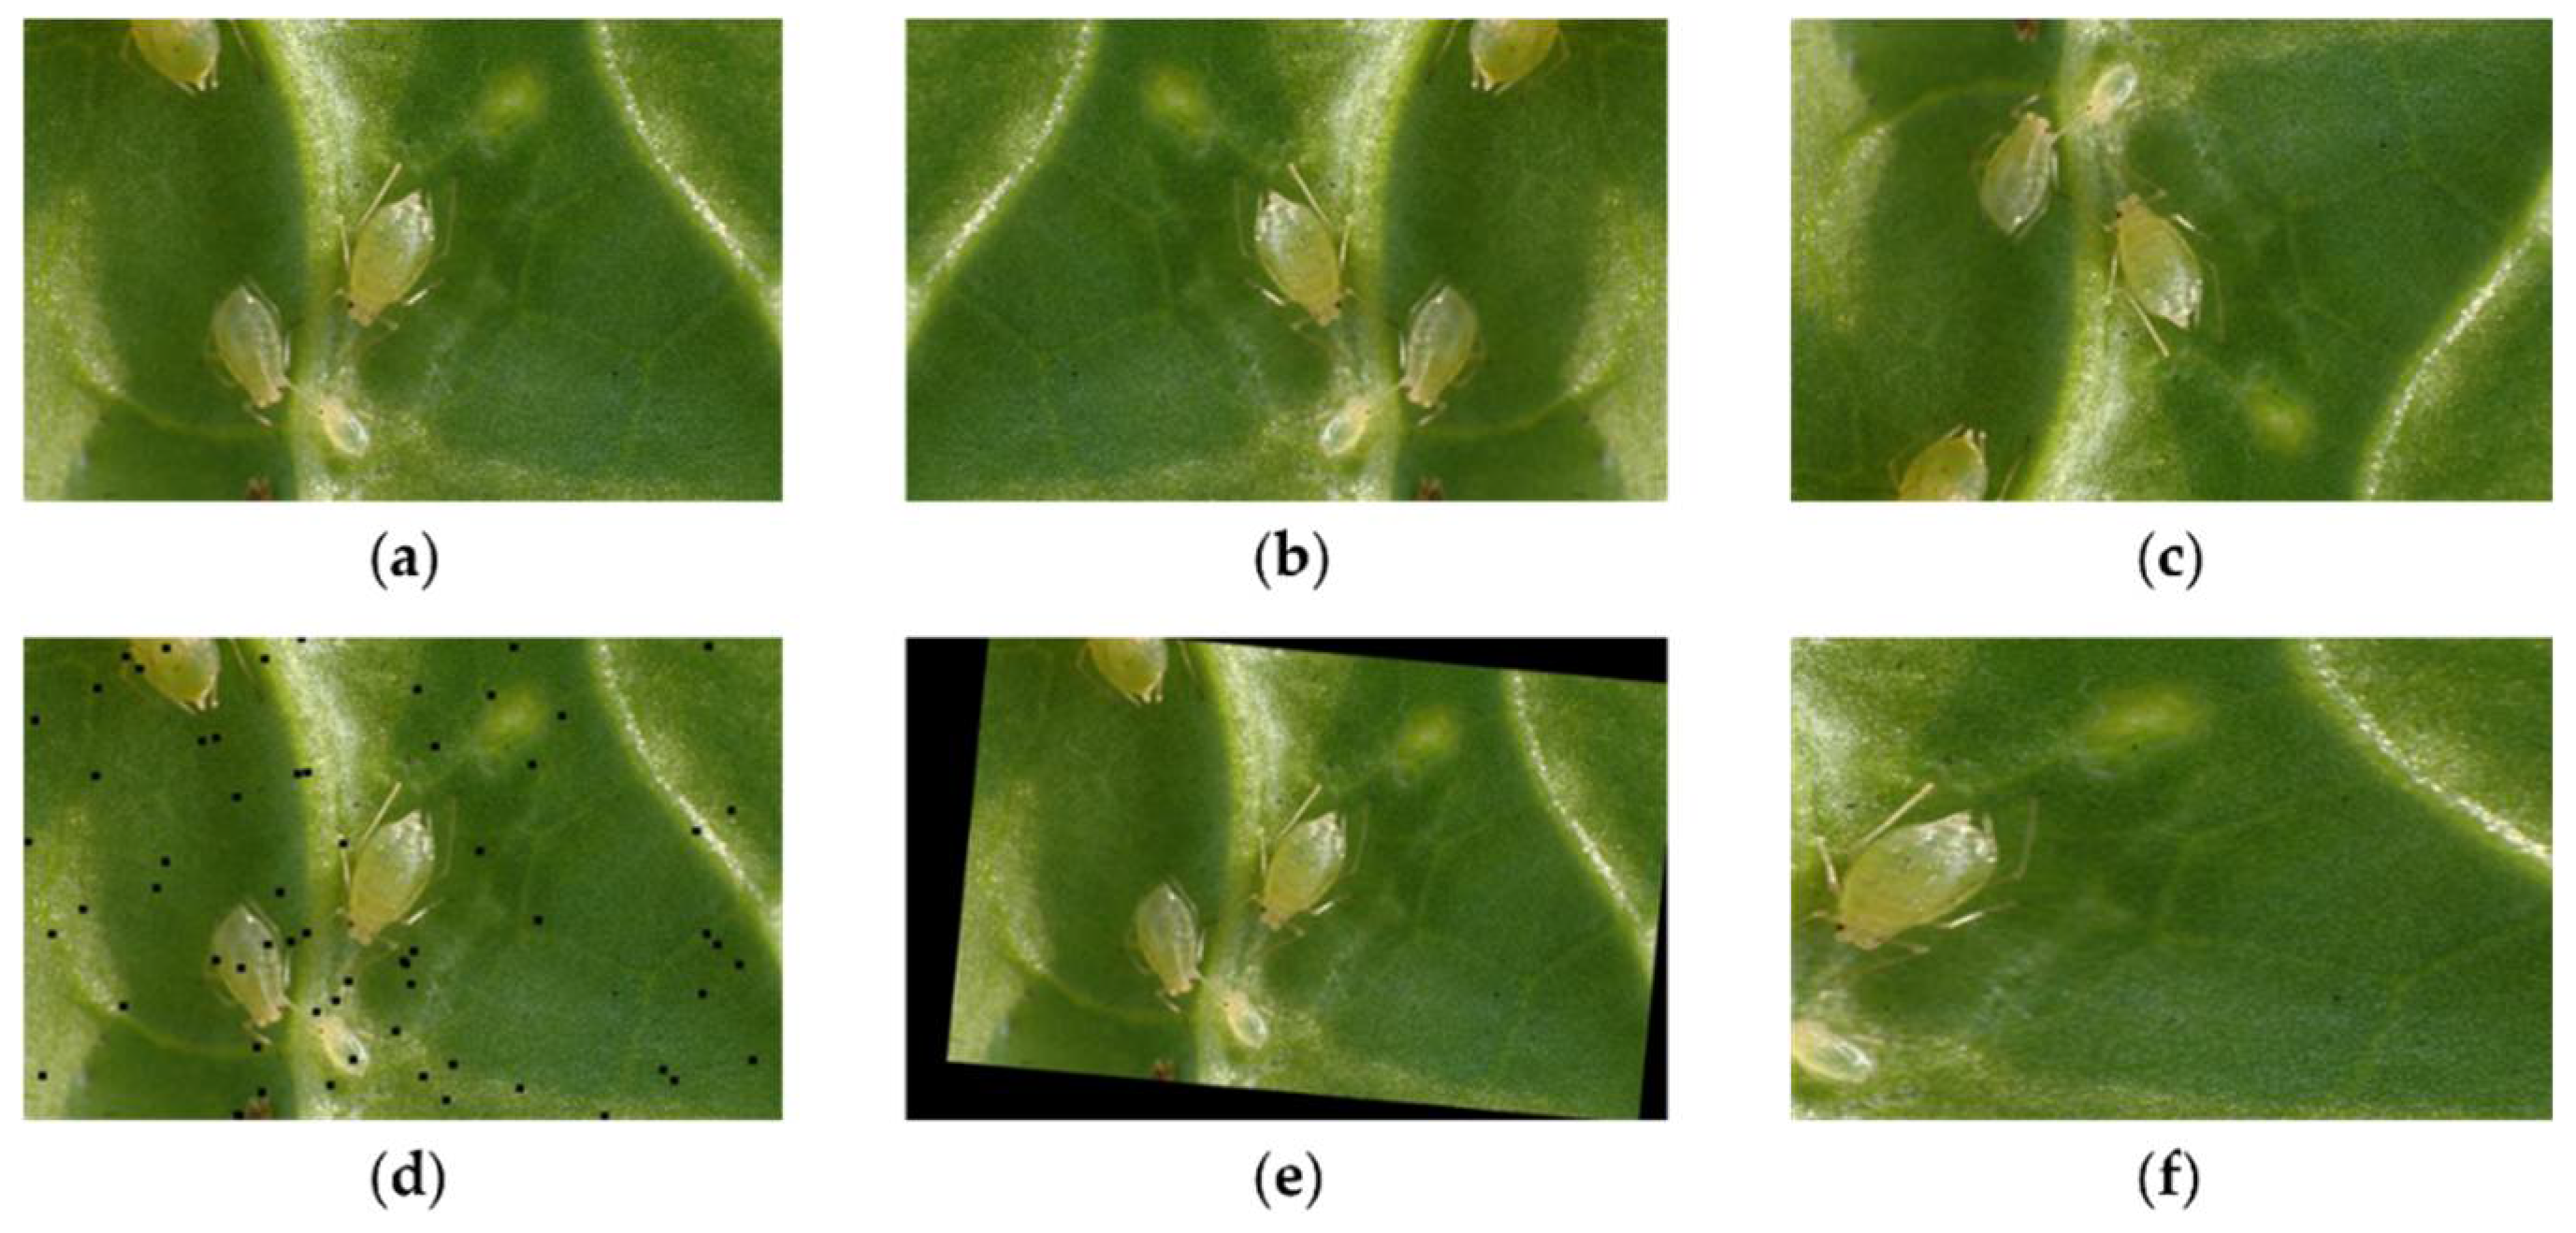
The original dataset was provided by an agricultural research institution. The dataset contains images of crop pests manually captured using a DSLR in agricultural environments. Due to duplicate images and label errors, this study recalibrated the labels of the original dataset and removed images in which no pests were visible, or pest objects were too blurred. Meanwhile, the original dataset was processed using data augmentation methods such as HorizontalFlip, VerticalFlip and Cutout [29] from the Albumentations data augmentation library to ensure the class balance of the dataset and to prevent overfitting. The data augmentation methods used in the study are shown in Figure 1.
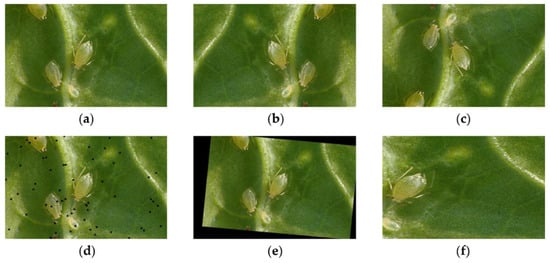
Figure 1.
All data augmentation methods used in the study: (a) original image; (b) HorizontalFlip; (c) VerticalFlip; (d) cutout; (e) ShiftScaleRotate; and (f) RandomResizedCrop.
The crop pest images, after undergoing the above processing, comprised the dataset used in this study, named CP15. The CP15 dataset consists of 3000 selected images of crop pests. These images are divided into 15 classes, each class containing 200 images. This number balance between the classes is mainly due to the data augmentation methods we used. Each image contains a number of pests ranging from a few to several hundred. The distribution density depends on the size and species habitat. We used open-source data labeling software called labelImg to label the pests in these images. The labels contain the pest classes and the pest coordinates. Since the class names of the pests are too long, we used the class ids as the labels of the classes. The class ids start from 0. The format of the pest coordinates mainly depends on the format of the data labels. To ensure compatibility for subsequent studies, we used the most widely used VOC data label format. Additionally, we converted the data labels from the VOC format to YOLO format by encoding a conversion program to ensure support for the method proposed in this study. The full CP15 dataset consists of 3000 pest images and the text label files corresponding to these images. The detailed class information of the CP15 dataset is shown in Table 1.

Table 1.
The details of the CP15 dataset.
2.2. Structural Optimization of YOLOv3
YOLOv3 is a CNN-based object detection method, which directly regresses the location and size of the object through convolutional neural networks. The one-stage detection process significantly improves the inference speed of YOLOv3. However, the deeper network structure and higher number of channels cause YOLOv3 to require excessive parameters and computations.
The residual blocks are the main building blocks of most detection methods based on convolutional neural networks, including YOLOv3. Most of the parameters and computations of YOLOv3 come from the residual blocks. For reducing the number of parameters and computations of YOLOv3, the number setting of residual blocks in the backbone network is adjusted to [2, 3, 6, 3, 2]. The five numbers denote the number of residual blocks used after the five downsamplings contained in the backbone network. Meanwhile, the number of convolution operations and residual blocks in the three branches is reduced correspondingly, and the number of feature map channels passed between all layers is reduced by half. The final simplified version of YOLOv3 is named YOLOLite in this study. The number of residual blocks, convolutions and channels can be easily modified by modifying the yaml file, which is responsible for building YOLOv3. The detailed structure of YOLOLite is shown in Table 2.
Table 2.
The detailed structure of YOLOLite.
2.3. Generate Prior Boxes with K-Means++
The prediction box generation method used in this study is derived from YOLOv3, and the elements required in the process of generating the prediction boxes for a pest are shown in Figure 2. Here, are the coordinates of the grid that contains the pest, and are the size of the prior box, are the coordinates of the center point of the prediction box, and and are the size of the prediction box.
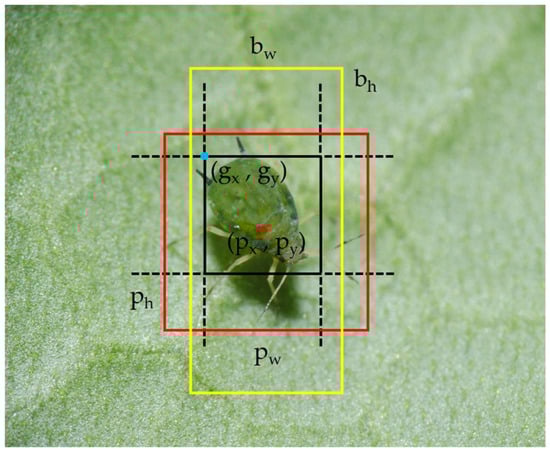
Figure 2.
The process of generating prediction boxes.
The detailed process of adjusting the yellow prior box and generating the red prediction box is shown in Equations (1)–(4), where is the offset metric output from the bounding box regression part of the detection method, and is the logistic activation function. The center-point coordinates , and the size represented by and in the prediction box can be calculated by adjusting the coordinates of the upper left corner point in the grid that contains the pest, and the size represented by and of the prior box with the offset metric. Then, the detection result is the output.
It is clear that the prior boxes play a decisive role in the detection effect. Many traditional object detection methods adopt artificially designed prior boxes, which cannot guarantee their applicability to different datasets. Setting unsuitable prior boxes will cause the bounding box regression to drastically oscillate in the early stage, slowing down the convergence of the model and leading to a decrease in the detection precision. Therefore, YOLOv3 adopts the k-means to cluster the sizes of the crop pests contained in the dataset and takes the final clustering centers as the prior boxes. The process of generating prior boxes for YOLOv3 is as follows:
- Select k initial clustering centers randomly from the size set C composed of the crop pest sizes contained in the dataset labels.
- Assign the class of each sample in size set C to the class that the nearest clustering center belongs to.
- The sample mean is calculated in each class cluster as the new clustering center.
- Repeat step 2 and step 3 until the clustering process converges.
The k-means method clusters with randomly selected initial clustering centers, and finally tends towards becoming trapped in the local optimum, making it difficult to achieve the global optimum.
Therefore, this study uses the k-means++ as a replacement for the k-means to optimize the prior box generation process and improve the quality of the prior boxes. The basic idea of k-means++ for selecting the initial clustering center is that samples further away from the existing clustering center are preferentially selected as the next clustering center. The detailed process is as follows:
- Randomly select an initial clustering center from the size set C, composed of the crop pest sizes contained in the dataset labels.
- Calculate the minimum distance of each sample in the size set C from the existing clustering centers.
- Calculate the probability of each sample being selected as the next initial clustering center, as shown in Equation (5), and select the next initial clustering center with the roulette wheel method.
- Repeat step 2 and step 3 until k initial clustering centers are selected.
To perform k-means++ clustering for the pest sizes contained in the dataset labels, we first coded a script that reads the xml label files in VOC format. The script used the xml python library to read the coordinates of the pests contained in the xml label files. Then, the pest coordinates are converted to pest sizes by another python script. Finally, the initial clustering center selection process and the clustering process of the k-means++ method is completed with the numpy library in the third python script. It must be noted that the k-means++ method uses the same clustering process as the k-means method.
The above three scripts were designed as a continuous workflow to cluster the pest sizes contained in the dataset labels. The nine prior boxes were generated by this workflow. Since the more distant samples from the existing clustering centers occupy a larger cumulative probability interval, the initial clustering centers selected with the roulette wheel method are more widely distributed in the size space of the samples. Hence, the prior boxes generated by k-means++ clustering are better matched with the dataset, which is beneficial for improving the crop pest detection precision in multiple sizes.
2.4. Lightweight Sandglass Block
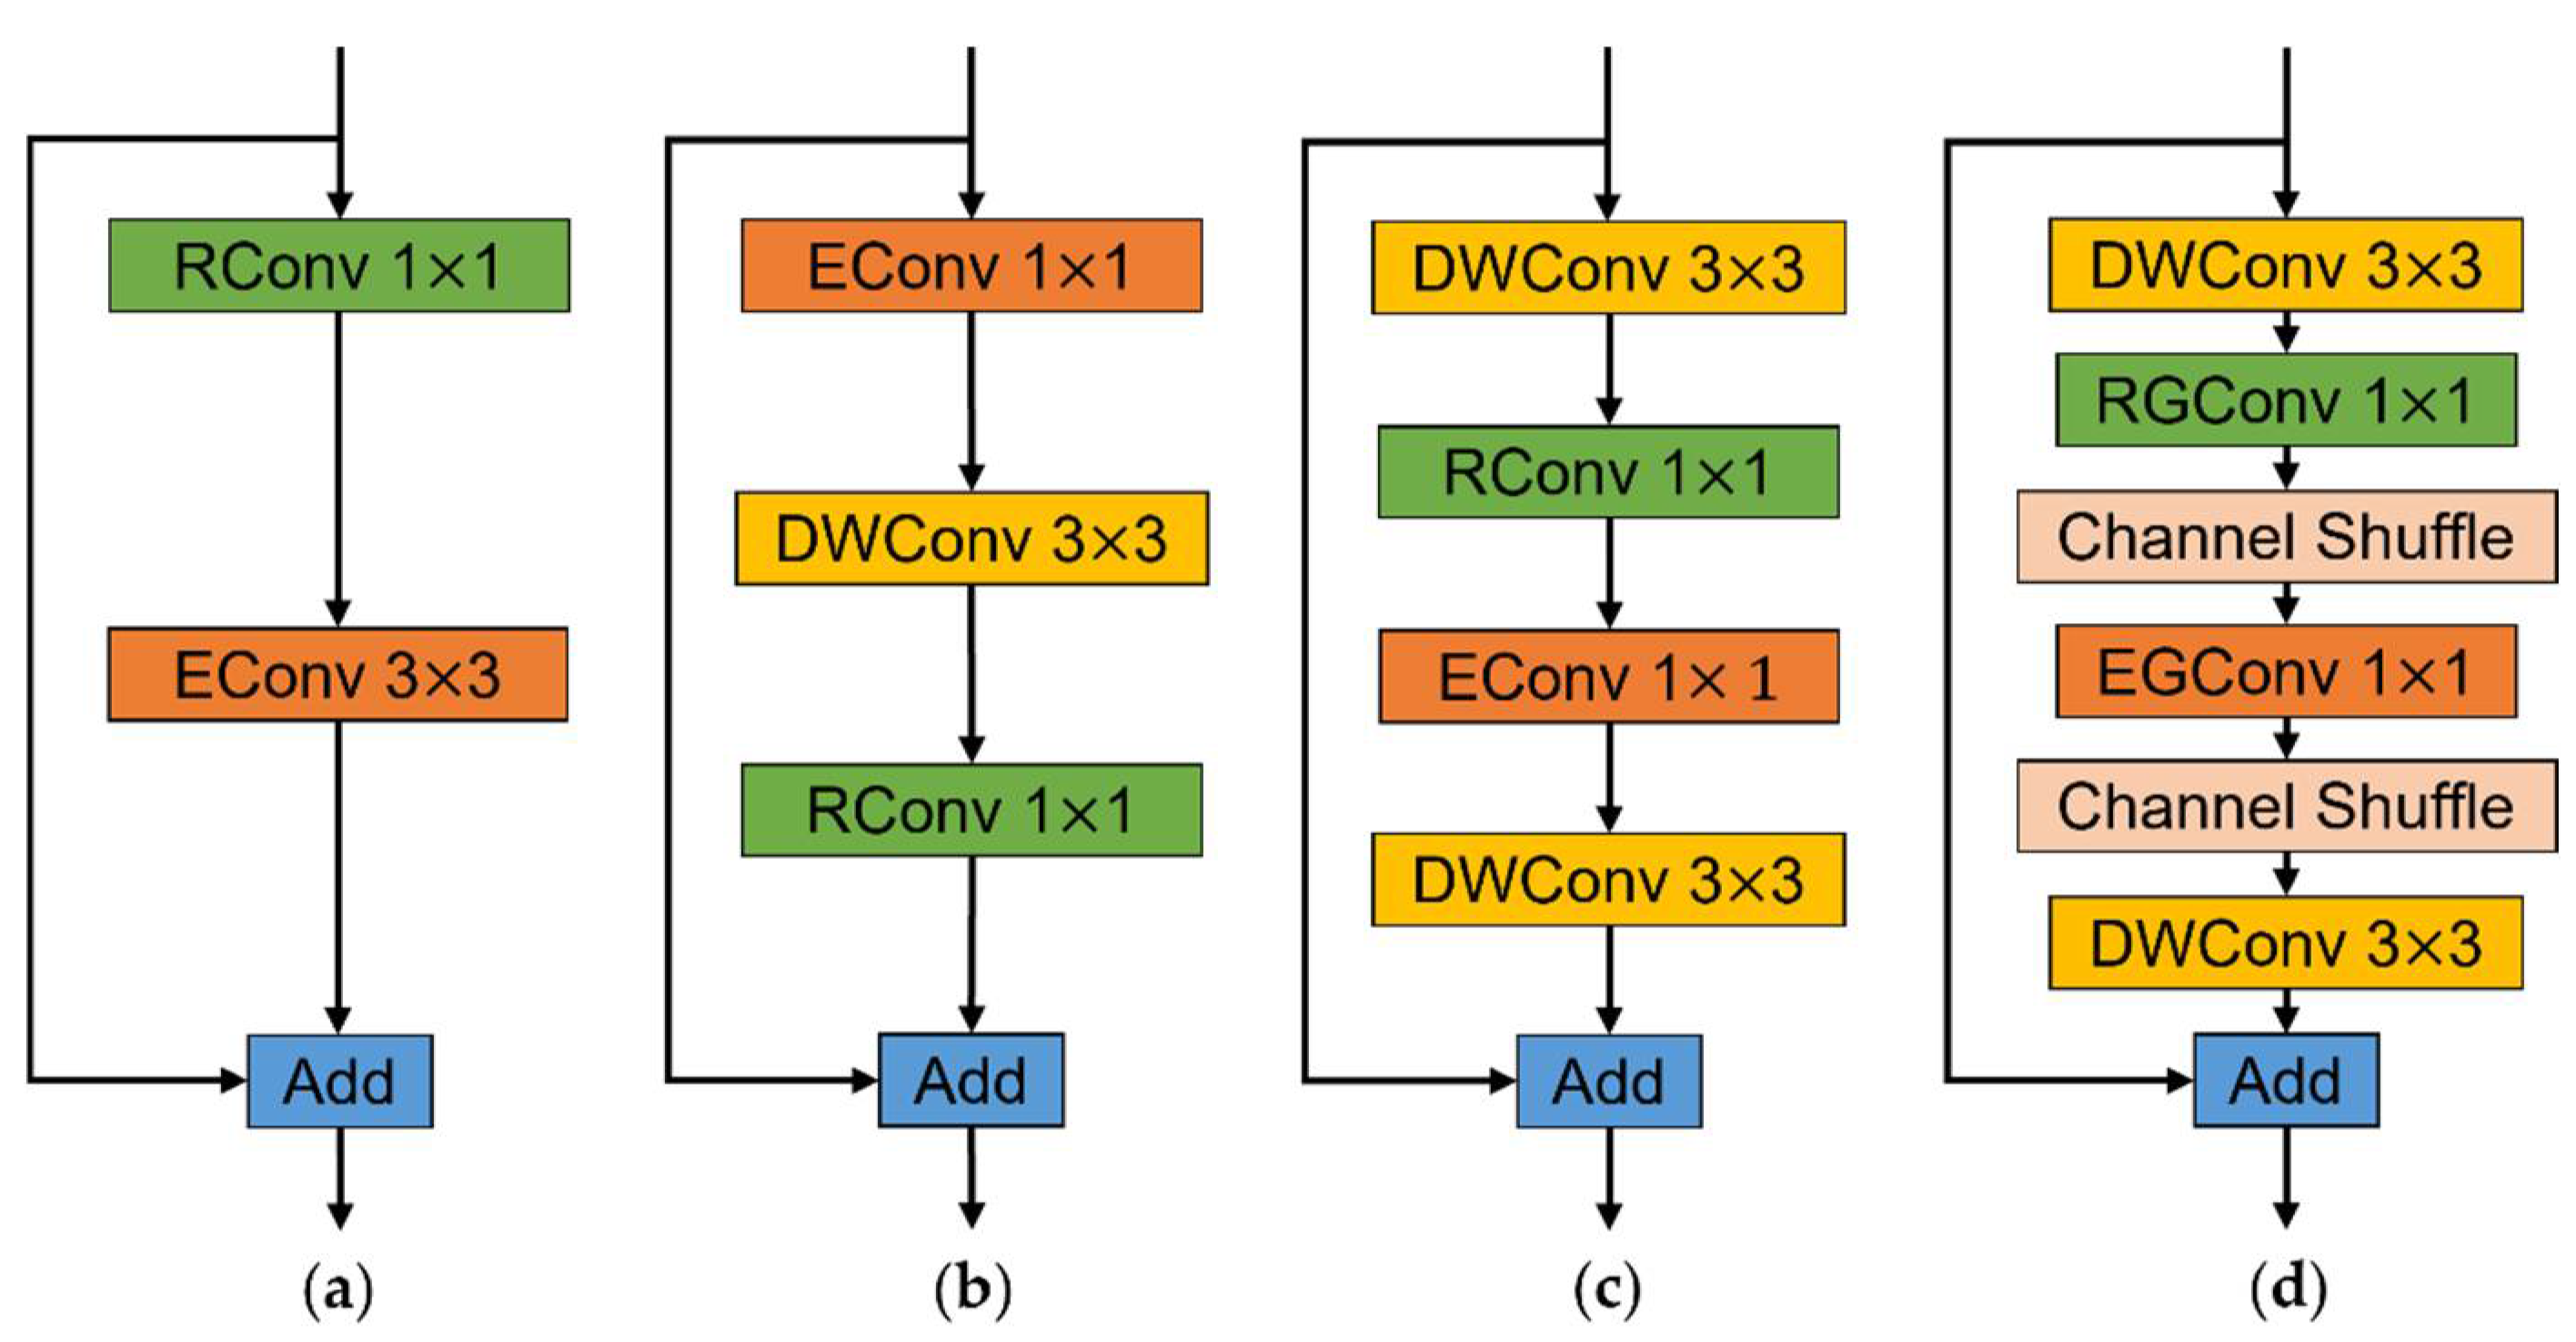
The classic residual block [30] is a basic building block that is used to design the convolutional neural network structure. The structure of the classic residual block is shown in Figure 3a, where RConv and EConv denote the convolution used for dimension reduction and dimension expansion, respectively, and Add denotes the element-wise sum. The classic residual block has more parameters and greater computation and is not suitable for building lightweight crop pest detection methods. The inverted residual block proposed in MobileNetv2 [31] has fewer parameters and less computation due to the depthwise separable convolution and the smaller number of input channels. The structure of the inverted residual block is shown in Figure 3b, where DWConv denotes the depthwise convolution. However, the identity mapping in the inverted residual block is built between low-dimensional features, and the feature compression is prone to information loss, while the lower feature dimension causes the backpropagation to be susceptible to the gradient confusion interference. MobileNeXt [32] solved the problem of information loss and gradient confusion caused by low-dimensional features with a well-designed sandglass block, the structure of which is shown in Figure 3c. The sandglass block adopts the channel dimension adjustment order of reducing first and then expanding as the classic residual block, and moves the bottleneck structure to the middle of the sandglass block. The high-dimensional features passed between the sandglass blocks reduce the risk of information loss and gradient confusion. Meanwhile, depthwise convolution is added at both ends of the sandglass block for extracting more spatial information. Furthermore, the sandglass block adds an activation layer after the first depthwise convolution and the second pointwise convolution ( convolution), following the linear bottleneck idea in the inverted residual block.

Figure 3.
The residual blocks mentioned in this paper: (a) classic residual block; (b) inverted residual block; (c) sandglass block; and (d) LightSandGlass, proposed in this study.
The pointwise convolution is used to fuse information from all channels in the sandglass block. However, according to the conclusion drawn in a previous paper on ShuffleNet [33], pointwise convolution occupies the majority of the parameters and computation in the building blocks, including the sandglass block. Therefore, we introduced group convolution for the original pointwise convolution to reduce the number of parameters and computations in the sandglass block. The process of group convolution is shown in Figure 4, which divides the input and output channels into the same number of groups, and the input channels of the corresponding group were convolved to produce the output channels of the corresponding group. With this decomposition of the convolution process, the number of parameters and computations of the group pointwise convolution were dramatically reduced compared to the original pointwise convolution, which naturally leads to a significant decrease in the number of parameters and computations of the sandglass block.
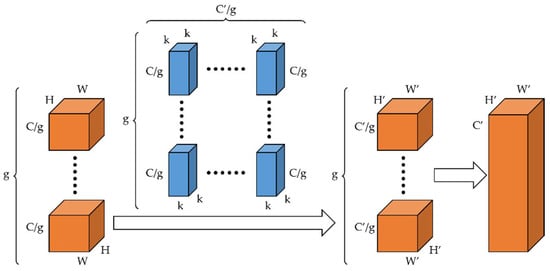
Figure 4.
The process of group convolution.
The introduction of group convolution also presents a problem. The function of fusing the inter-channel information of feature maps in the original pointwise convolution is partially broken by group convolution. The group pointwise convolution can only fuse the channel information within each group, and the channel information between these groups cannot interact. Therefore, a channel shuffle operation is added after the group pointwise convolution to keep the function of fusing inter-channel information. The detailed process of the channel shuffle operation is as follows:
- The size of the feature map is transformed from to , where is the number of groups defined by the group pointwise convolution, and is the number of channels in each group.
- Transposing the first two dimensions, the output feature map dimension is .
- Merging the first two dimensions, the output feature map dimension is .
It can be seen from the above process that if the output feature map is divided into the same number of groups as the input feature map, the information fusion between the channels of different groups can be completed in the next group convolution. Therefore, the channel shuffle can effectively solve the problem of the inadequate fusion of information between channels caused by group convolution.
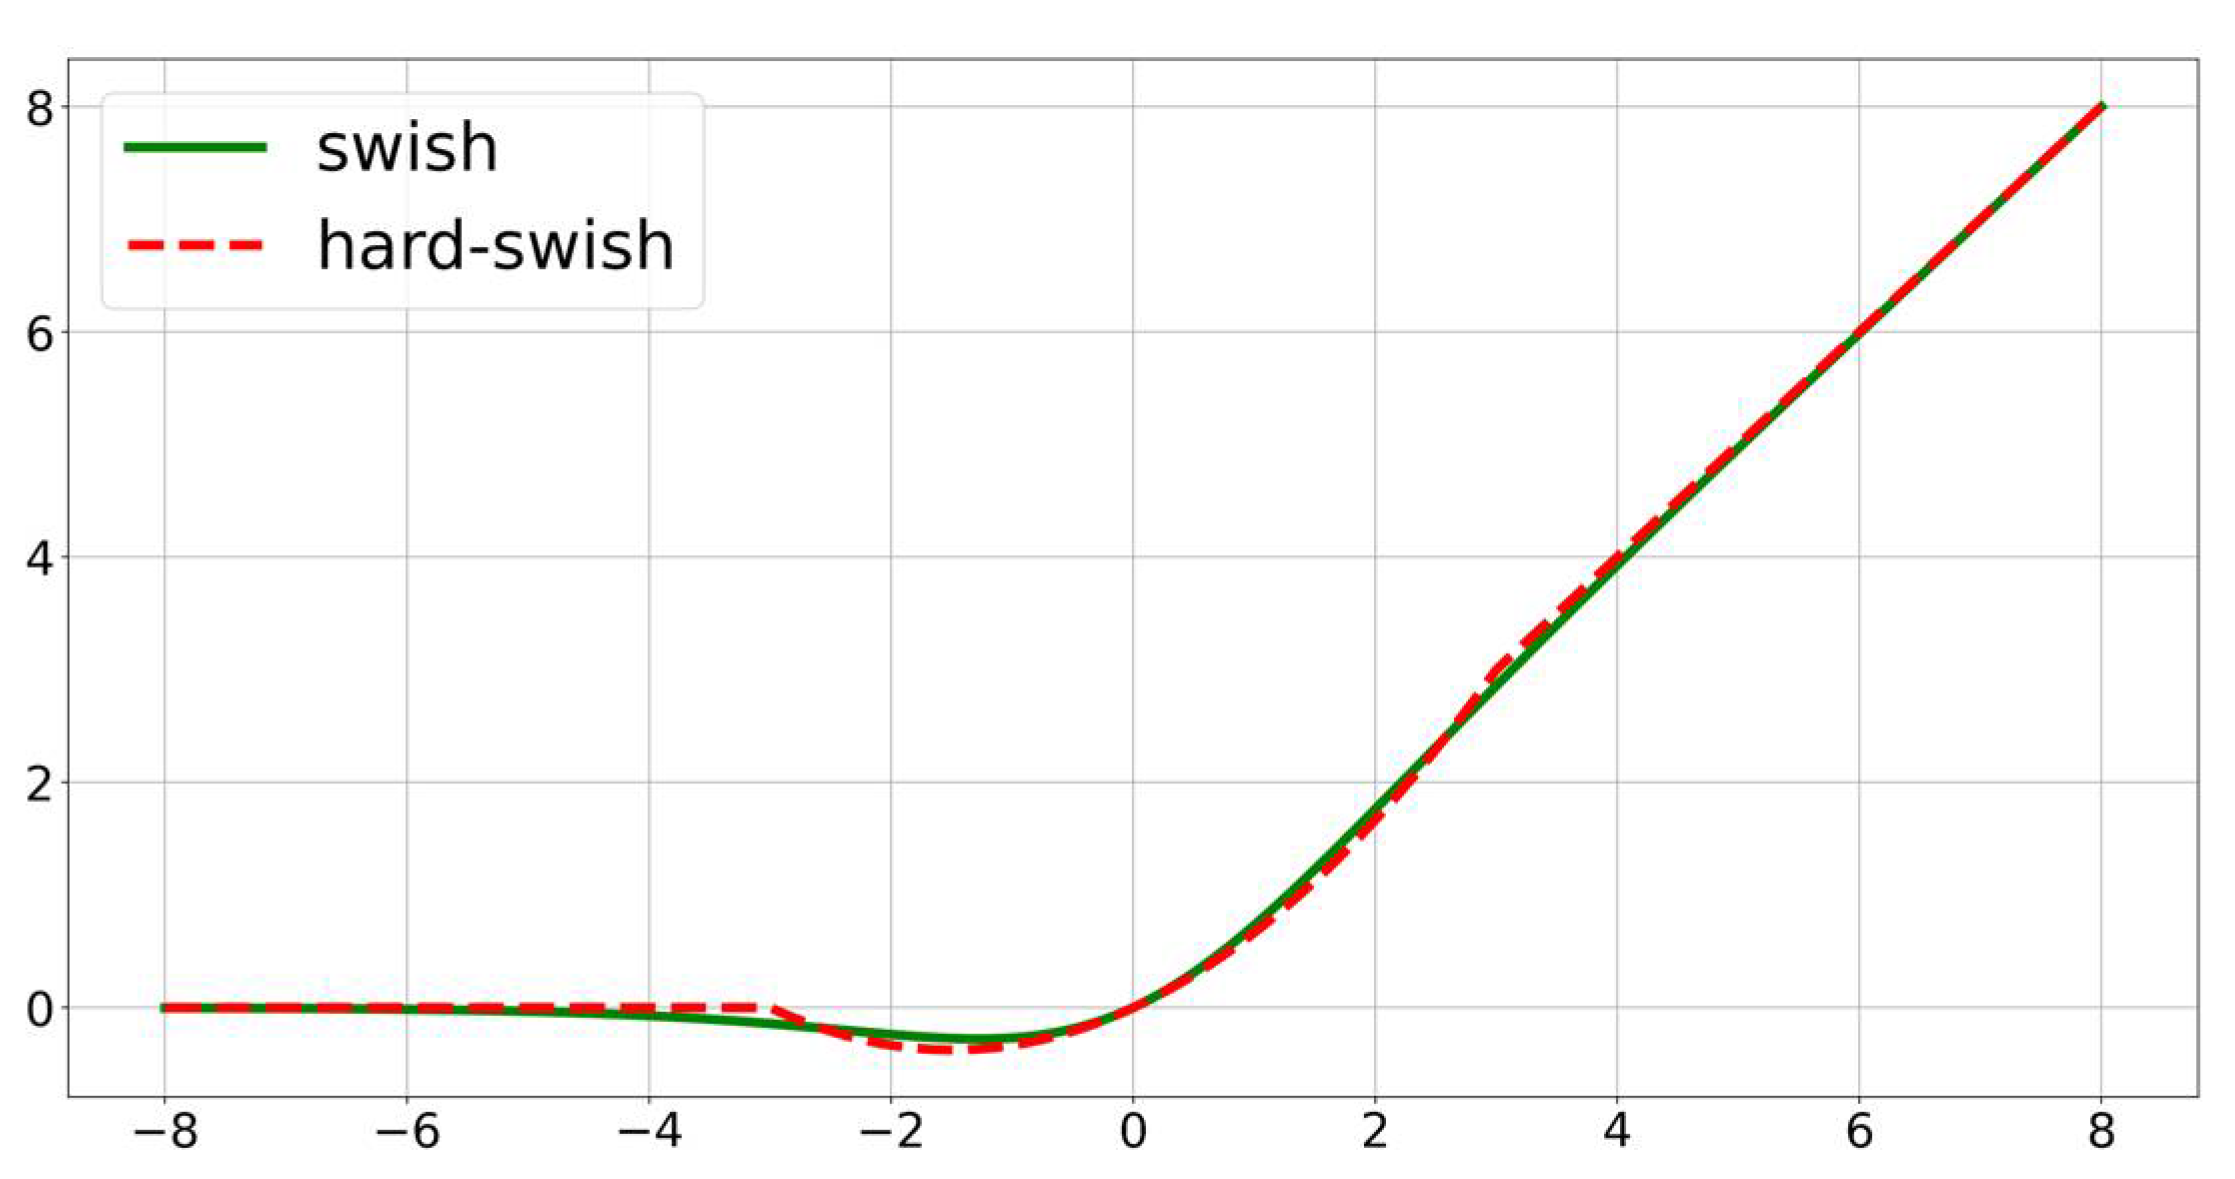
Furthermore, this study adopted in the sandglass block. The from the automatic search technique is an activation function with better performance, and a previous paper [34] on showed that its performance is better than that of ReLU on deeper models. However, subsequent studies found that the function results in more computational consumption. Therefore, researchers proposed [35], a hard analog of the . The does not differ significantly from in terms of performance, but is less computationally consuming. Therefore, we adopt the activation function in the sandglass block. The and activation functions are shown in Equations (6) and (7), respectively, and their function curves are compared, as shown in Figure 5. The function curves of and almost overlap, which indicates that they can play almost identical roles.
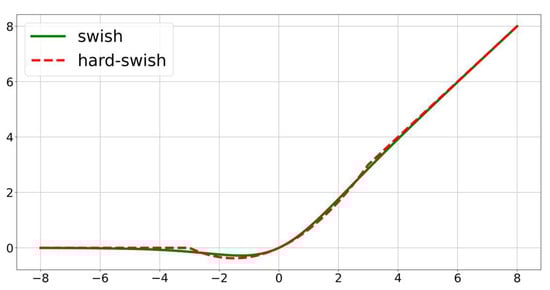
Figure 5.
Comparison of and function curves.
This study adopts the above-described group convolution, channel shuffle, and activation function to build a lightweight sandglass block with better performance, fewer parameters and less computation, named LightSandGlass. The structure of LightSandGlass is shown in Figure 3d, where RGConv and EGConv denote the group pointwise convolution used for dimension reduction and dimension expansion. Considering that too many group convolutions will increase the memory access consumption [36] and that performs better in deeper network layers, this study only replaces the residual blocks in the deep part of the network with LightSandGlass.
2.5. Coordinate Attention
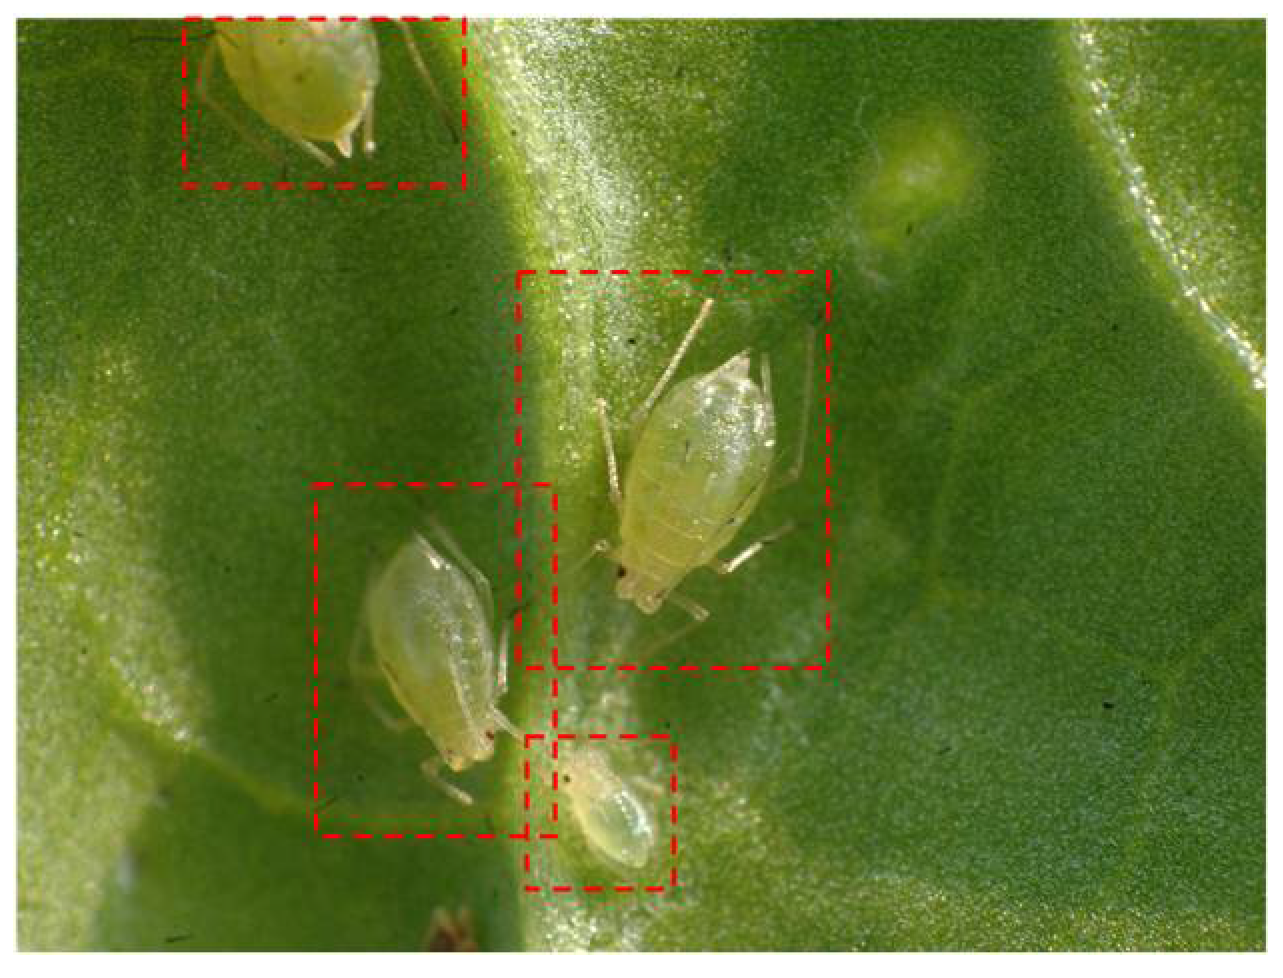
The attention mechanism is a common optimization method for lightweight network structure design, and it can make the feature extraction process more focused and suppress the adverse effects of irrelevant or harmful features on the task. Existing attention methods provide poor guidance for spatial information. For example, SENet [37] only pays attention to channel information, and convolutional block attention module (CBAM) [38] generates the attention maps of spatial information through convolution, but it is difficult to capture spatial information containing long-distance dependencies. However, pest objects in crop pest detection tasks are usually located in the complex environment, and the body of the pest usually has protective colors, as shown in Figure 6. The high degree of noise information in the environment makes it a challenging task to extract pest features from the global features. Therefore, it is particularly important to apply attention mechanisms containing more spatial information to guide the feature extraction process in crop pest detection tasks.

Figure 6.
Pests with protective colors in the natural environment.
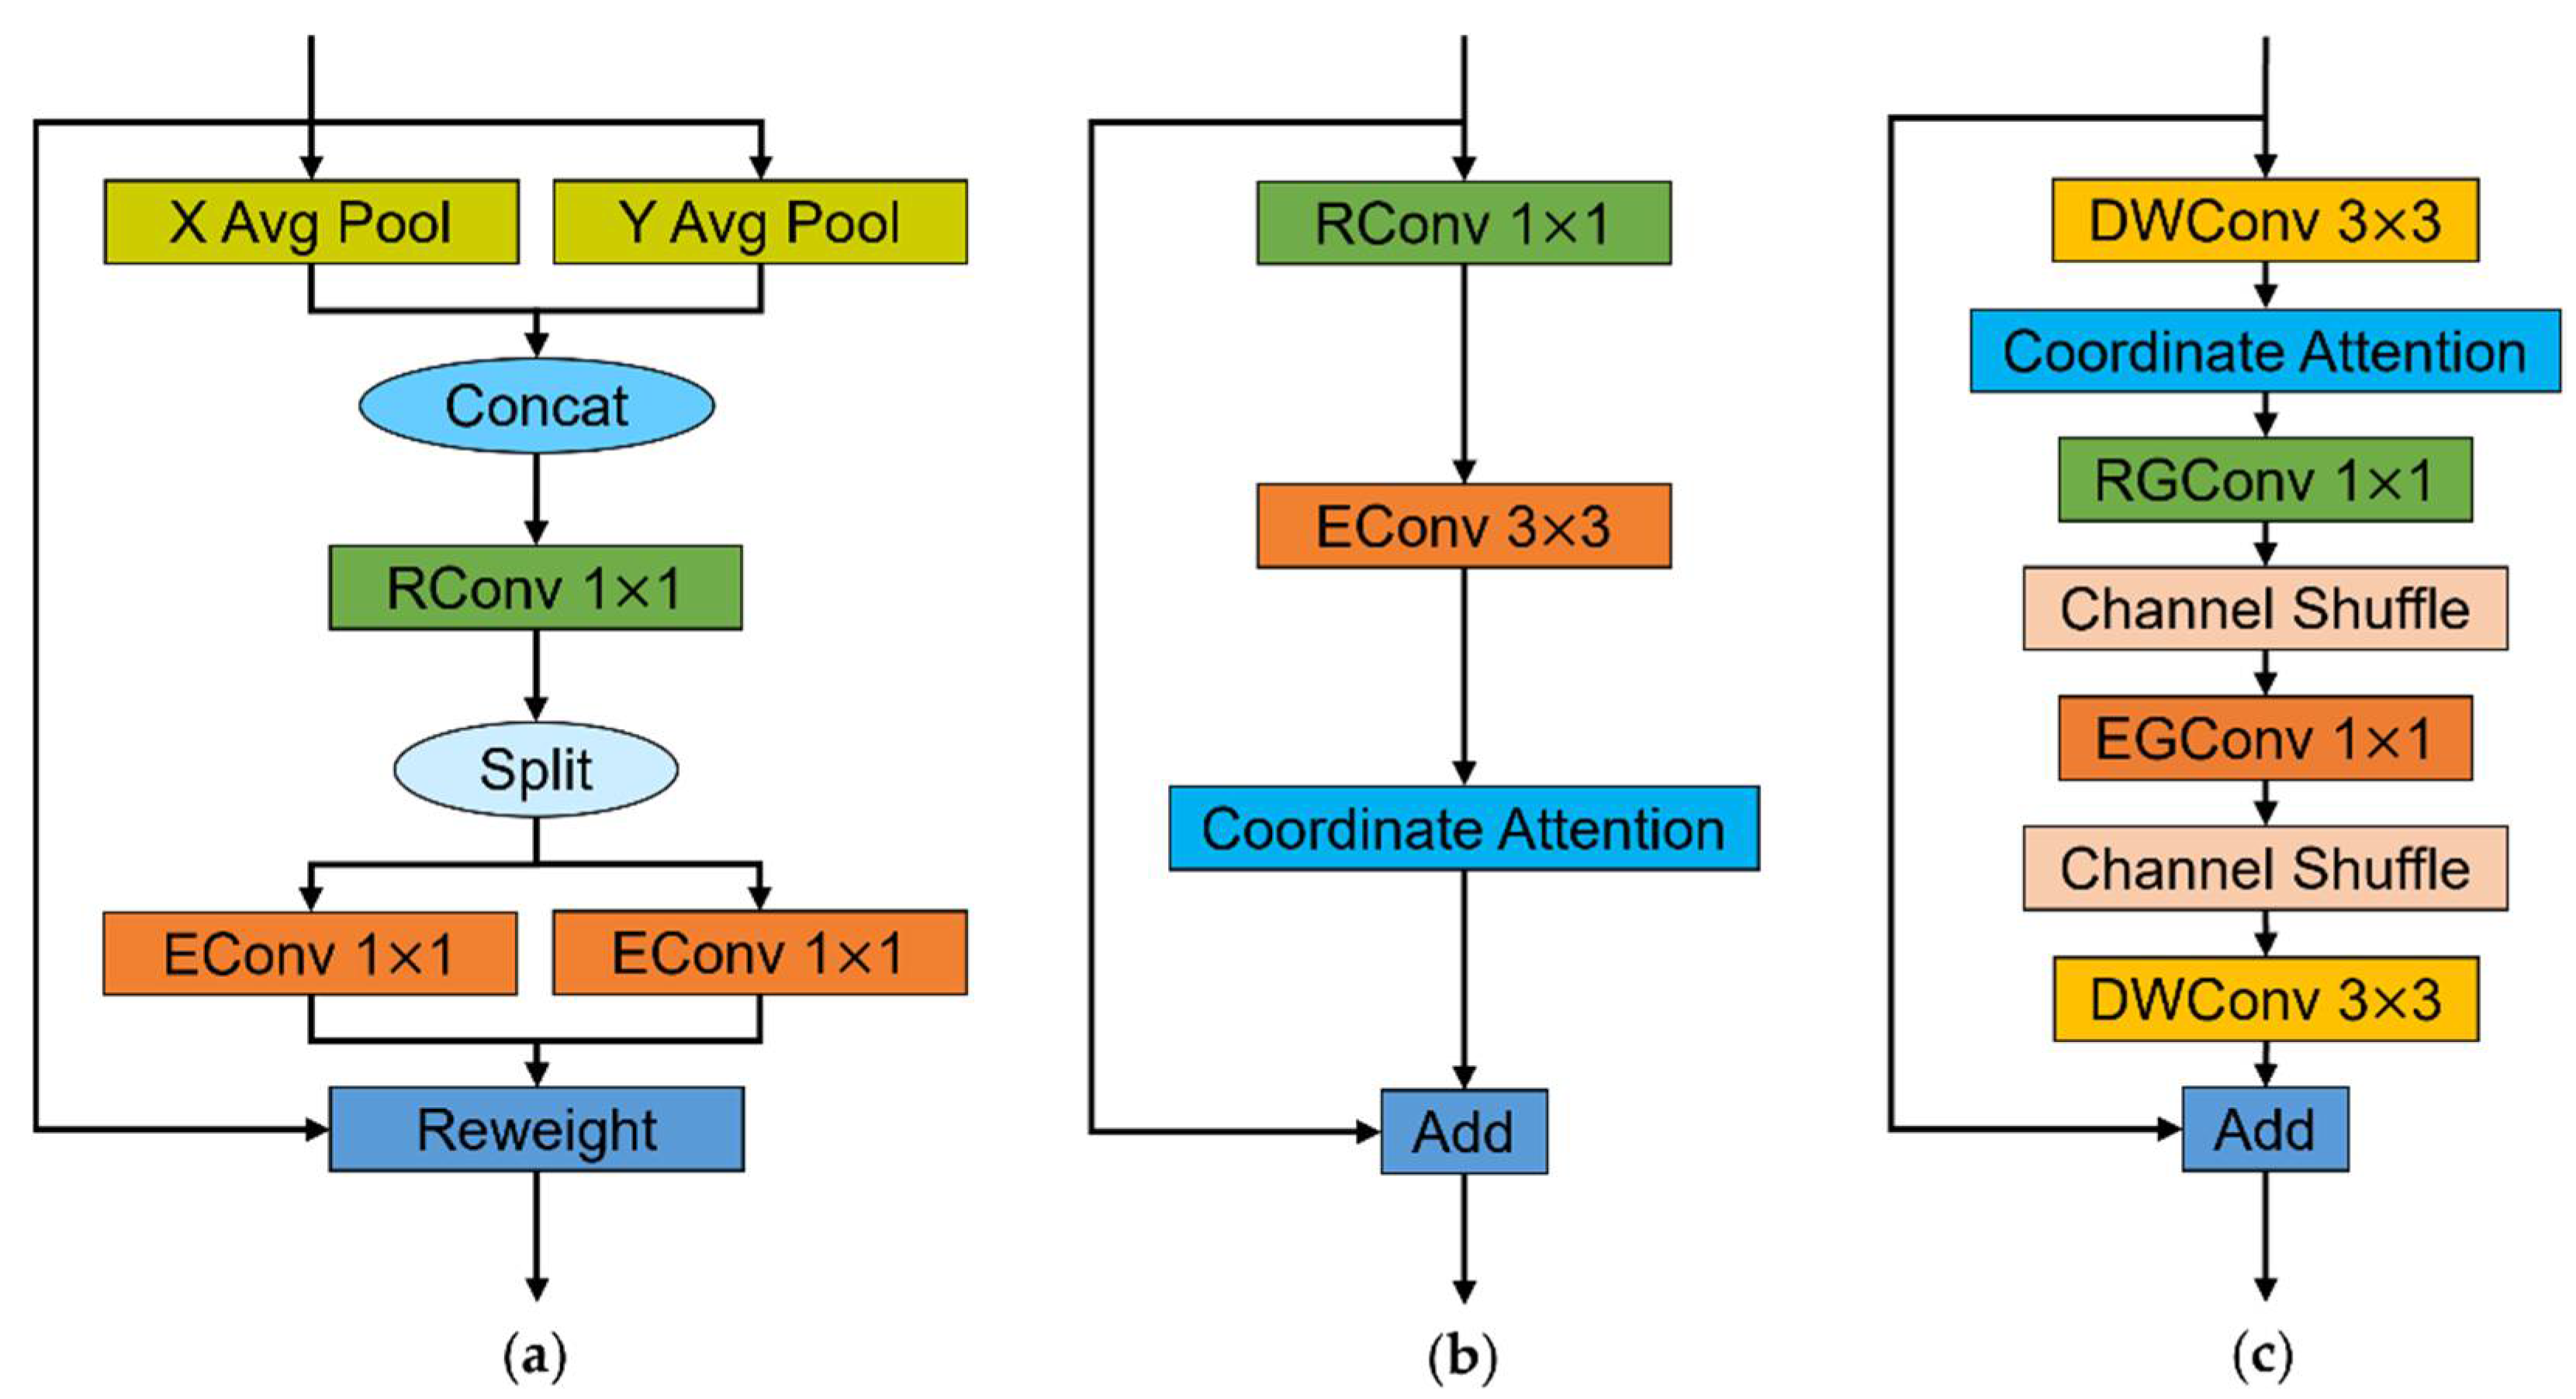
Therefore, we introduce coordinate attention for the feature extraction process. In coordinate attention, the modeling process of channel attention is factorized into two pooling operations to embed more spatial information while capturing channel information. The structure of coordinate attention is shown in Figure 7a. The attention map built by coordinate attention contains channel information and spatial information, which can guide feature extraction in both the channel dimension and spatial dimension. In addition, benefiting from the pooling that acts on the spatial locations, the coordinate attention can effectively capture the long-distance dependence between spatial locations.

Figure 7.
The coordinate attention block and the two types of residual blocks containing the coordinate attention block: (a) coordinate attention; (b) bottleneck-CA; and (c) LightSandGlass-CA.
For the input feature map , coordinate attention uses horizontal and vertical pooling in each channel to encode the spatial information and channel information, as well as capture the long-distance dependence between spatial locations. The detailed process is shown in Equations (8) and (9), where is the input value at the specified channel and spatial location, is the output at the specified channel and height after pooling, and is the output at the specified channel and width after pooling.
After completing the above encoding of the spatial and channel information channel by channel, the feature map and feature map are generated. Then, the dependency relationship between the channel dimension and spatial dimension is modeled, as shown in Equations (10)–(12). Firstly, and are connected and denotes the connecting feature maps. Then, is split into and along the spatial dimension after the convolution completes the dimension reduction. Finally, the number of channels of and are adjusted to be the same as the input with two convolutional transforms, and , respectively. and are the nonlinear activation functions, and and are the direction-aware attention maps. The attention map is derived from the channel information and height information, and the attention map is derived from the channel information and width information. With the two attention maps, the detection method can obtain guidance for feature extraction in both the channel dimension and the spatial dimension.
Finally, the input is reweighted using the attention maps and . The detailed reweighting process is shown in Equation (13), where denotes the output value of the specified spatial location in each channel, denotes the weight for the input value at the specified channel and height, and denotes the weight for the input value at the specified channel and width.
The horizontal and vertical pooling operations described above are implemented by the AdaptiveAvgPool2d function in the pytorch library. The rest of the operations of the coordinate attention are implemented using common operators in the pytorch framework. We embed the coordinate attention process into all classical residual blocks and lightweight sandglass blocks in our crop pest detection method to guide the feature extraction process and better learn the feature representation. To ensure that the coordinate attention process obtains sufficiently rich pest features to play a more accurate guiding role, the coordinate attention block is embedded after the convolution used for dimension expansion in the classic residual block. Meanwhile, following the description of coordinate attention, the coordinate attention is embedded after the first depthwise convolution in the lightweight sandglass block. The classic residual block and the lightweight sandglass block with the embedded coordinate attention block are named Bottleneck-CA and LightSandGlass-CA, respectively, and their structures are shown in Figure 7b,c.
2.6. YOLOLite-CSG
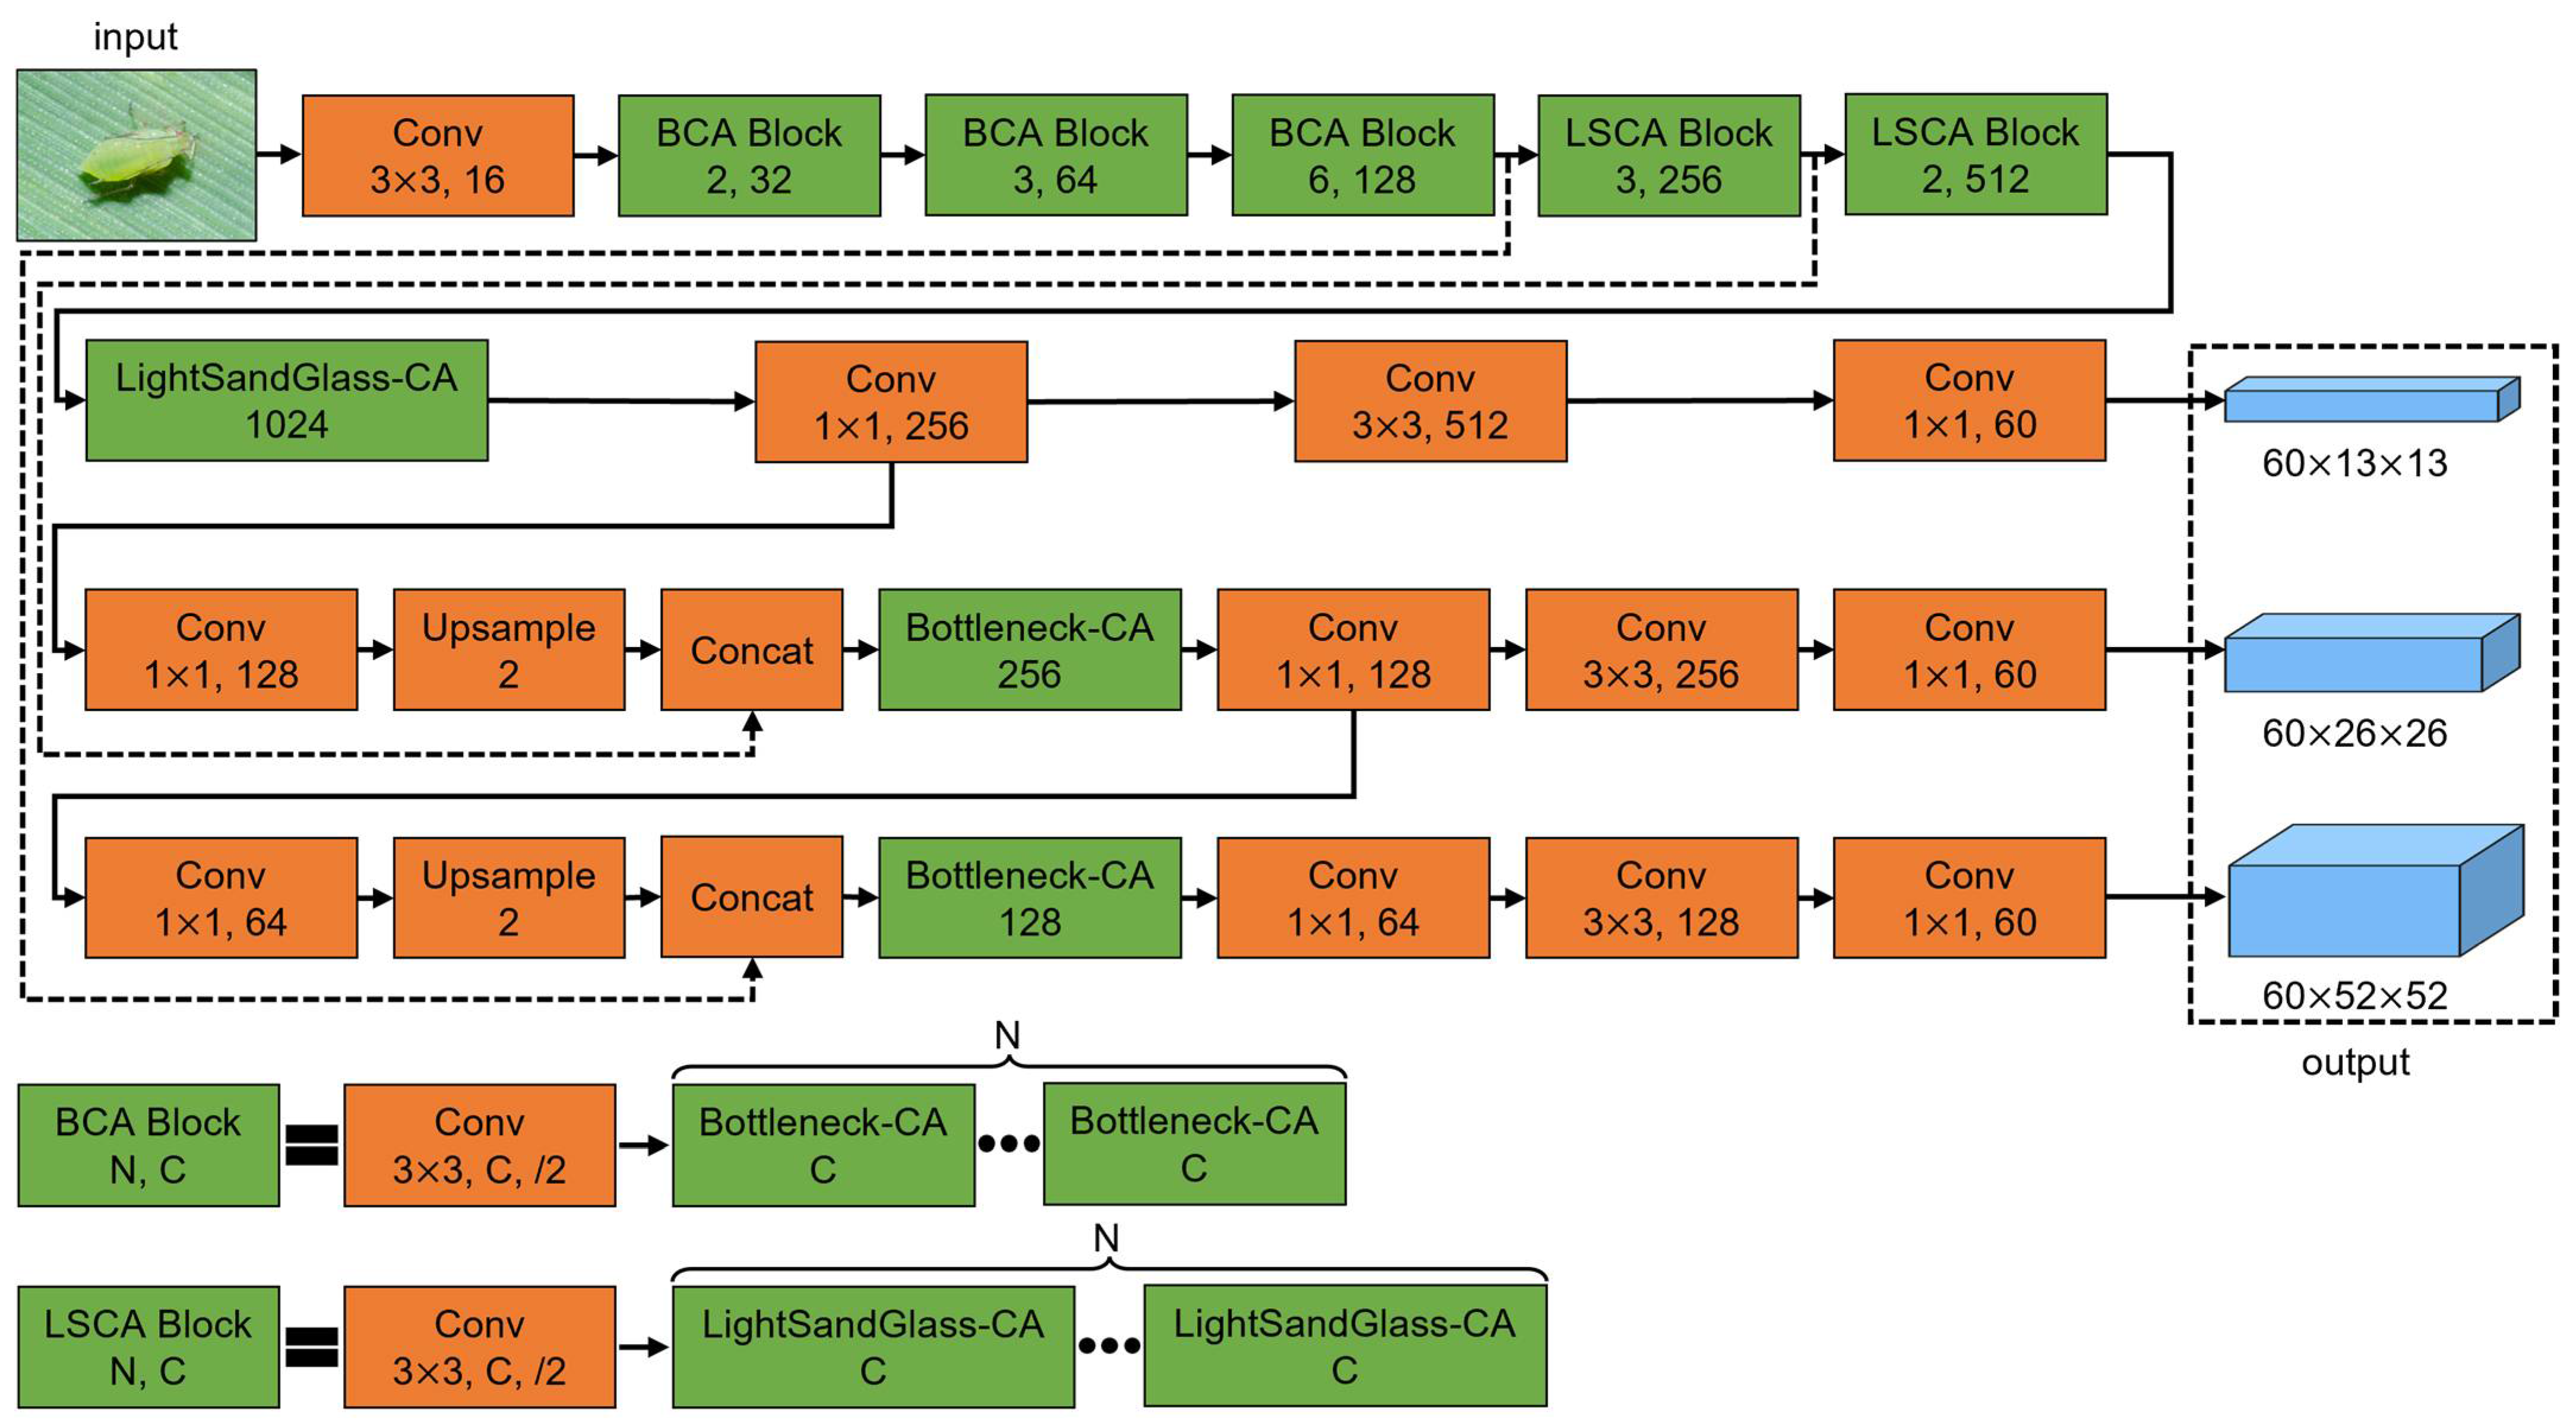
This study proposes a lightweight crop pest detection method based on convolutional neural networks. Firstly, a detection method named YOLOLite with fewer parameters and less computation is built by optimizing the structure of YOLOv3. Secondly, k-means++ is adopted to generate the prior boxes and improve their degree of matching. Then, the classic residual blocks for processing the feature maps with high channel numbers are replaced by the lightweight sandglass blocks to reduce the number of parameters and computations in the detection method. Finally, coordinate attention is introduced into the classic residual block and the lightweight sandglass block to guide the feature extraction process. The final method is named YOLOLite-CSG, and its structure is shown in Figure 8.
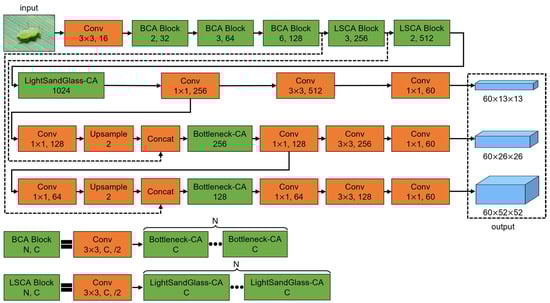
Figure 8.
The structure of YOLOLite-CSG. The detailed structures of Bottleneck-CA and LightSandGlass-CA are shown in Figure 7b,c.
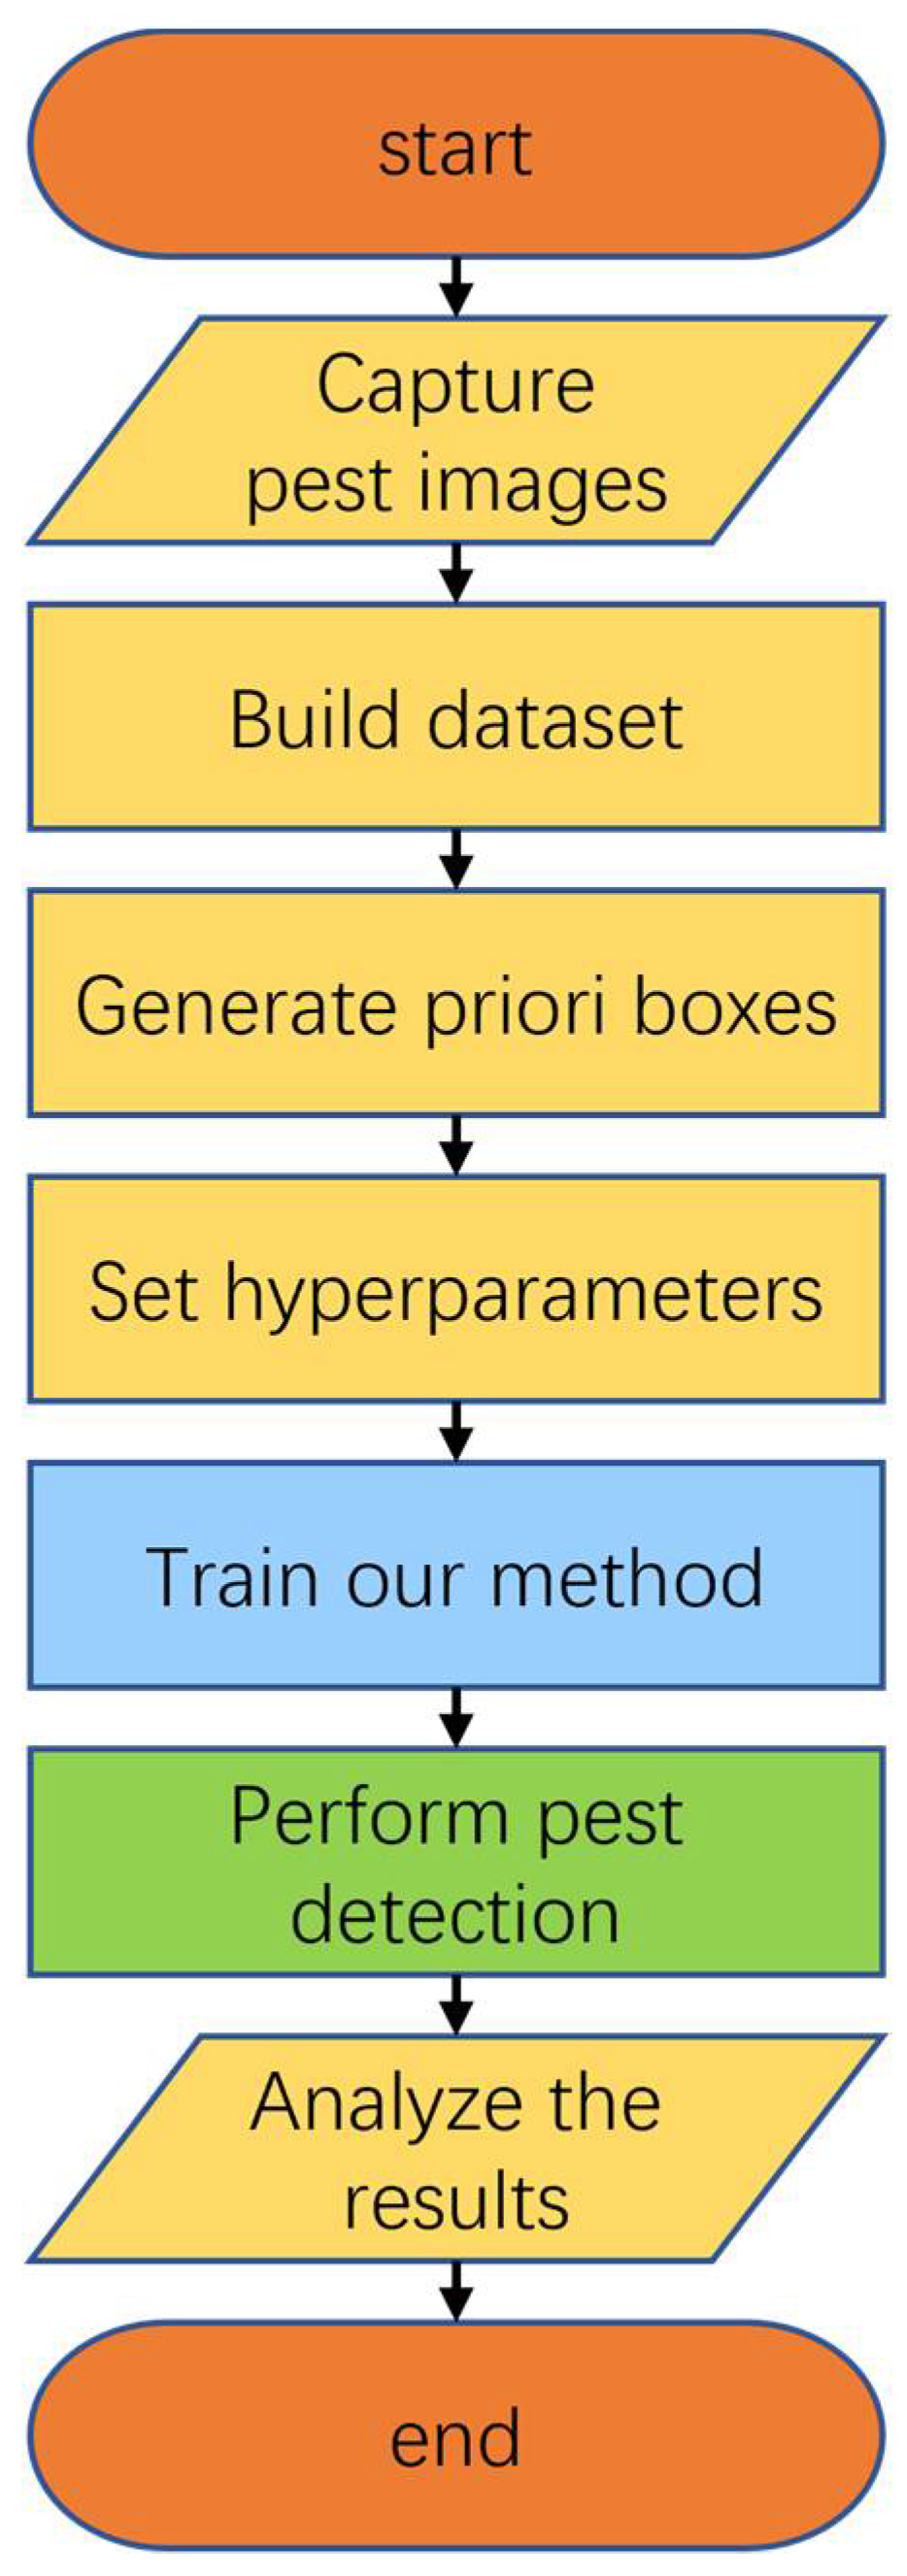
Described above are the core methods of our crop pest detection research. The complete architecture for crop pest detection using this method is shown in Figure 9, divided into seven steps. The first step is to capture pest images. Pest images can be manually captured using a camera, or by using a drone or sticky trap. The second step is to build the dataset. This step includes selecting the pest images, performing data augmentation, and labeling the data. These above two steps determine the quality of the final dataset used for training our method and are crucial for the later pest detection results. The third step is the generation process of the prior boxes. Different datasets contain different sizes of pests, which have different requirements of the prior boxes. The prior boxes must be generated to match the dataset. The fourth step is to set the hyperparameters. In order to obtain global optimal results, reasonable hyperparameters should be set in this step, such as input resolution and batch size. The fifth step is to train our method. This step trains the proposed method in this paper using the constructed dataset, predefined prior boxes and hyperparameters. Our method learns the knowledge and information contained in the dataset through the training process. The sixth step is to perform pest detection. The trained model can be deployed in an unmanned aerial vehicle (UAV) or sticky trap to detect crop pests. The seventh step is to analyze the detection results. The detection results should be carefully analyzed in order to develop a reasonable pest control plan.
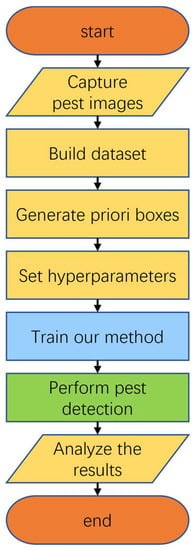
Figure 9.
The complete architecture for crop pest detection using our method.
3. Results
3.1. Model Training Process
All experiments were performed on an ubuntu system with NVIDIA RTX A4000 and Intel Xeon Gold 5320. The system had 32 GB of RAM. Python 3.8.13 and pytorch 1.10.1 were used to implement the source code.
In order to avoid drastic oscillations of the model during training, this study uses the Adam optimizer with an initial learning rate of 0.001, beta1 of 0.937 and beta2 of 0.999. The input resolution during training is , the batch size is 32 and the training epoch is 200 rounds. We enabled 12 threads to read the data to reduce the IO time by as much as possible.
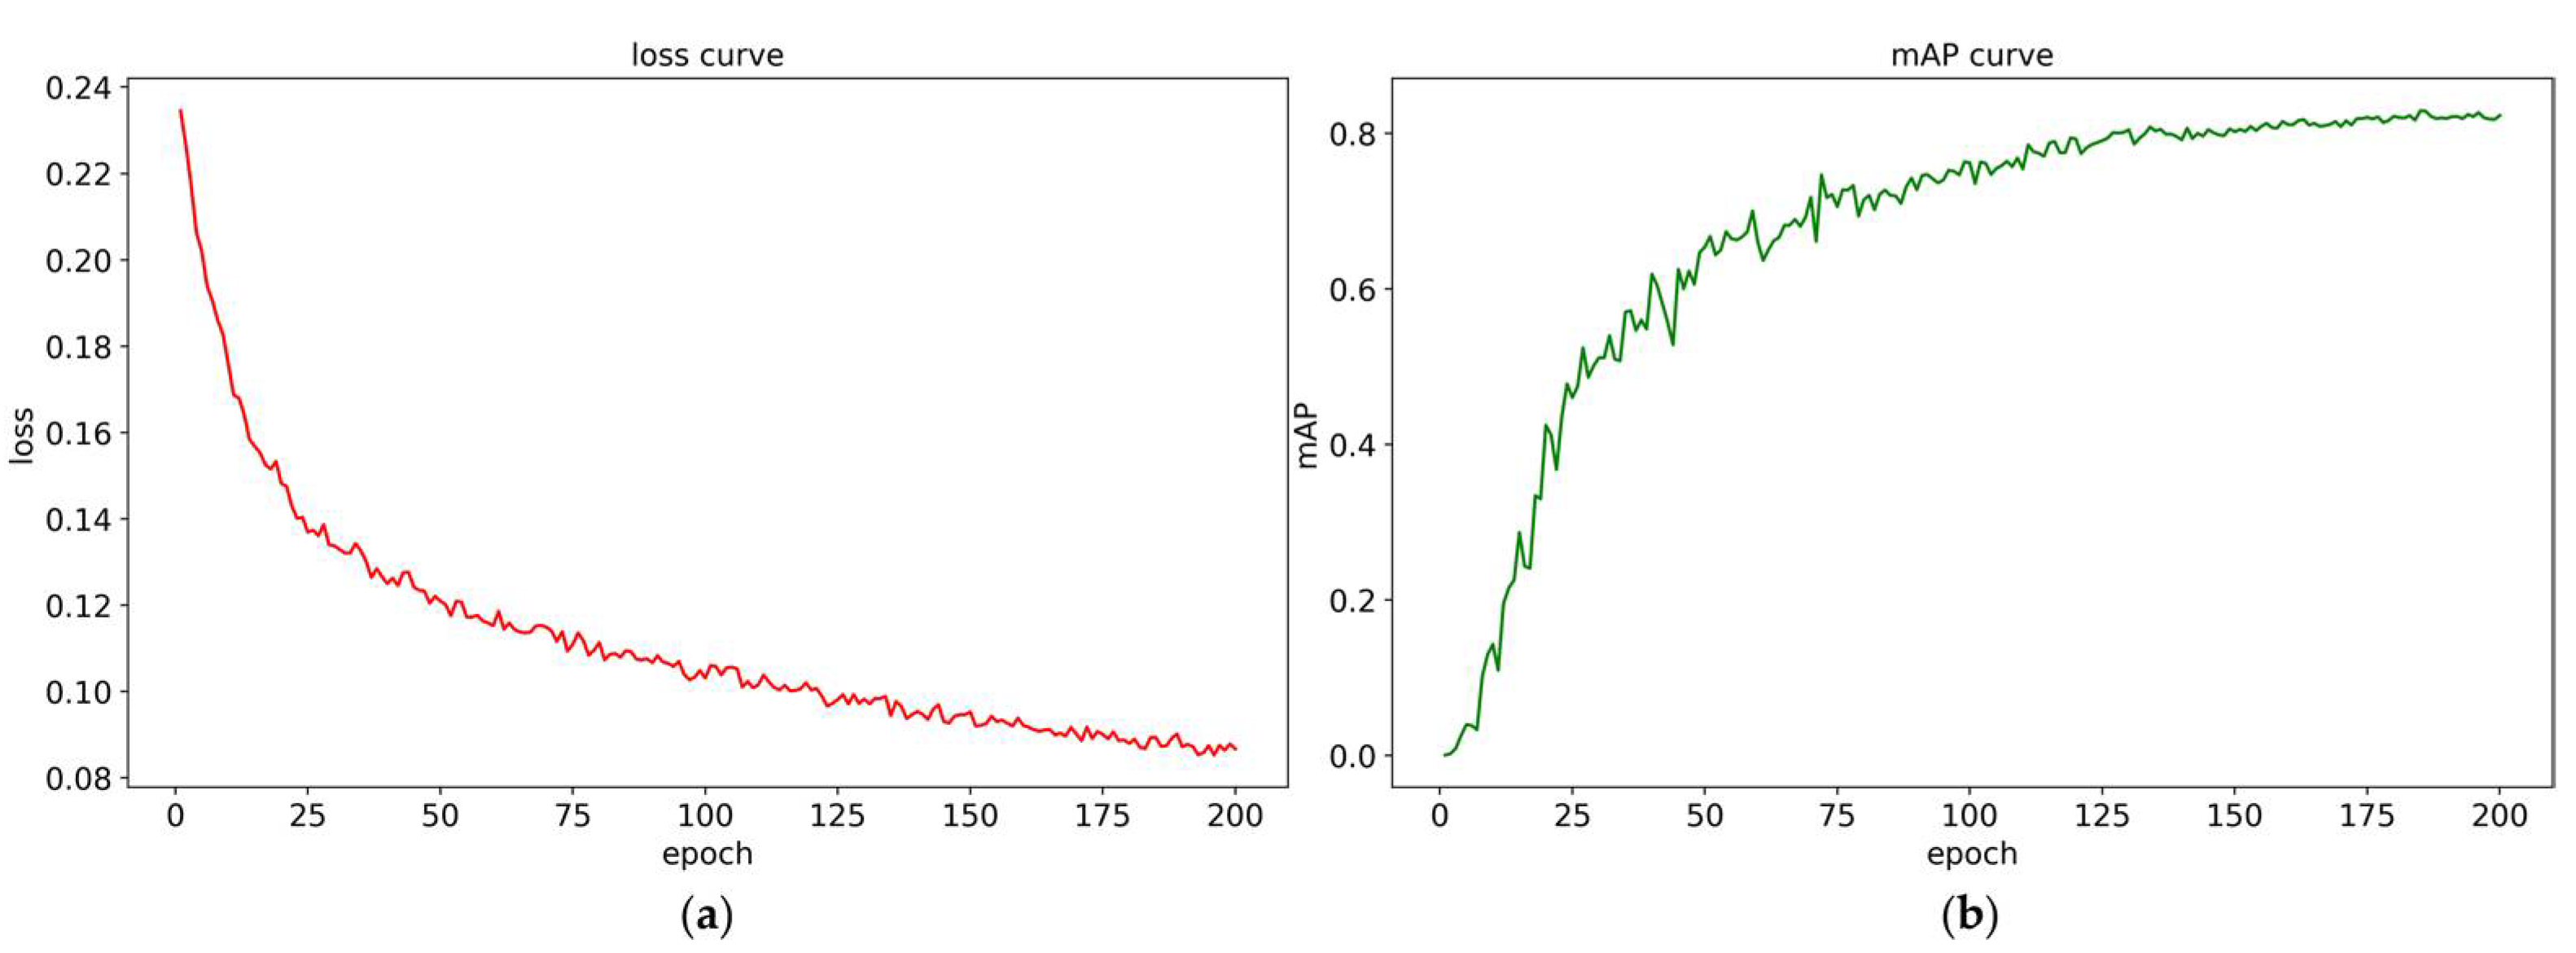
The loss changes and mAP changes of the training process are shown in Figure 10. The trend of the loss curve and mAP curve shows that there is no large model oscillation during the training process. Especially in the later period, the two curves are smoother, which is largely due to the fact that the Adam optimizer can dynamically adjust the learning rate. From an overall perspective, the model tends to converge after 50 epochs, and finally reaches a stable convergence state near 190 epochs.
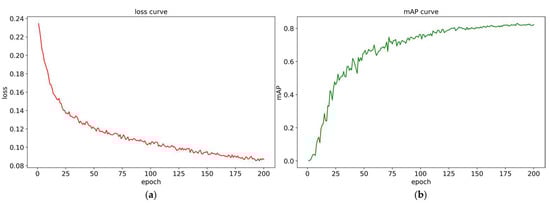
Figure 10.
The (a) loss curve and (b) mAP curve during the training process.
3.2. Comparison Experiment of the Prior Boxes Generated by Different Clustering Methods
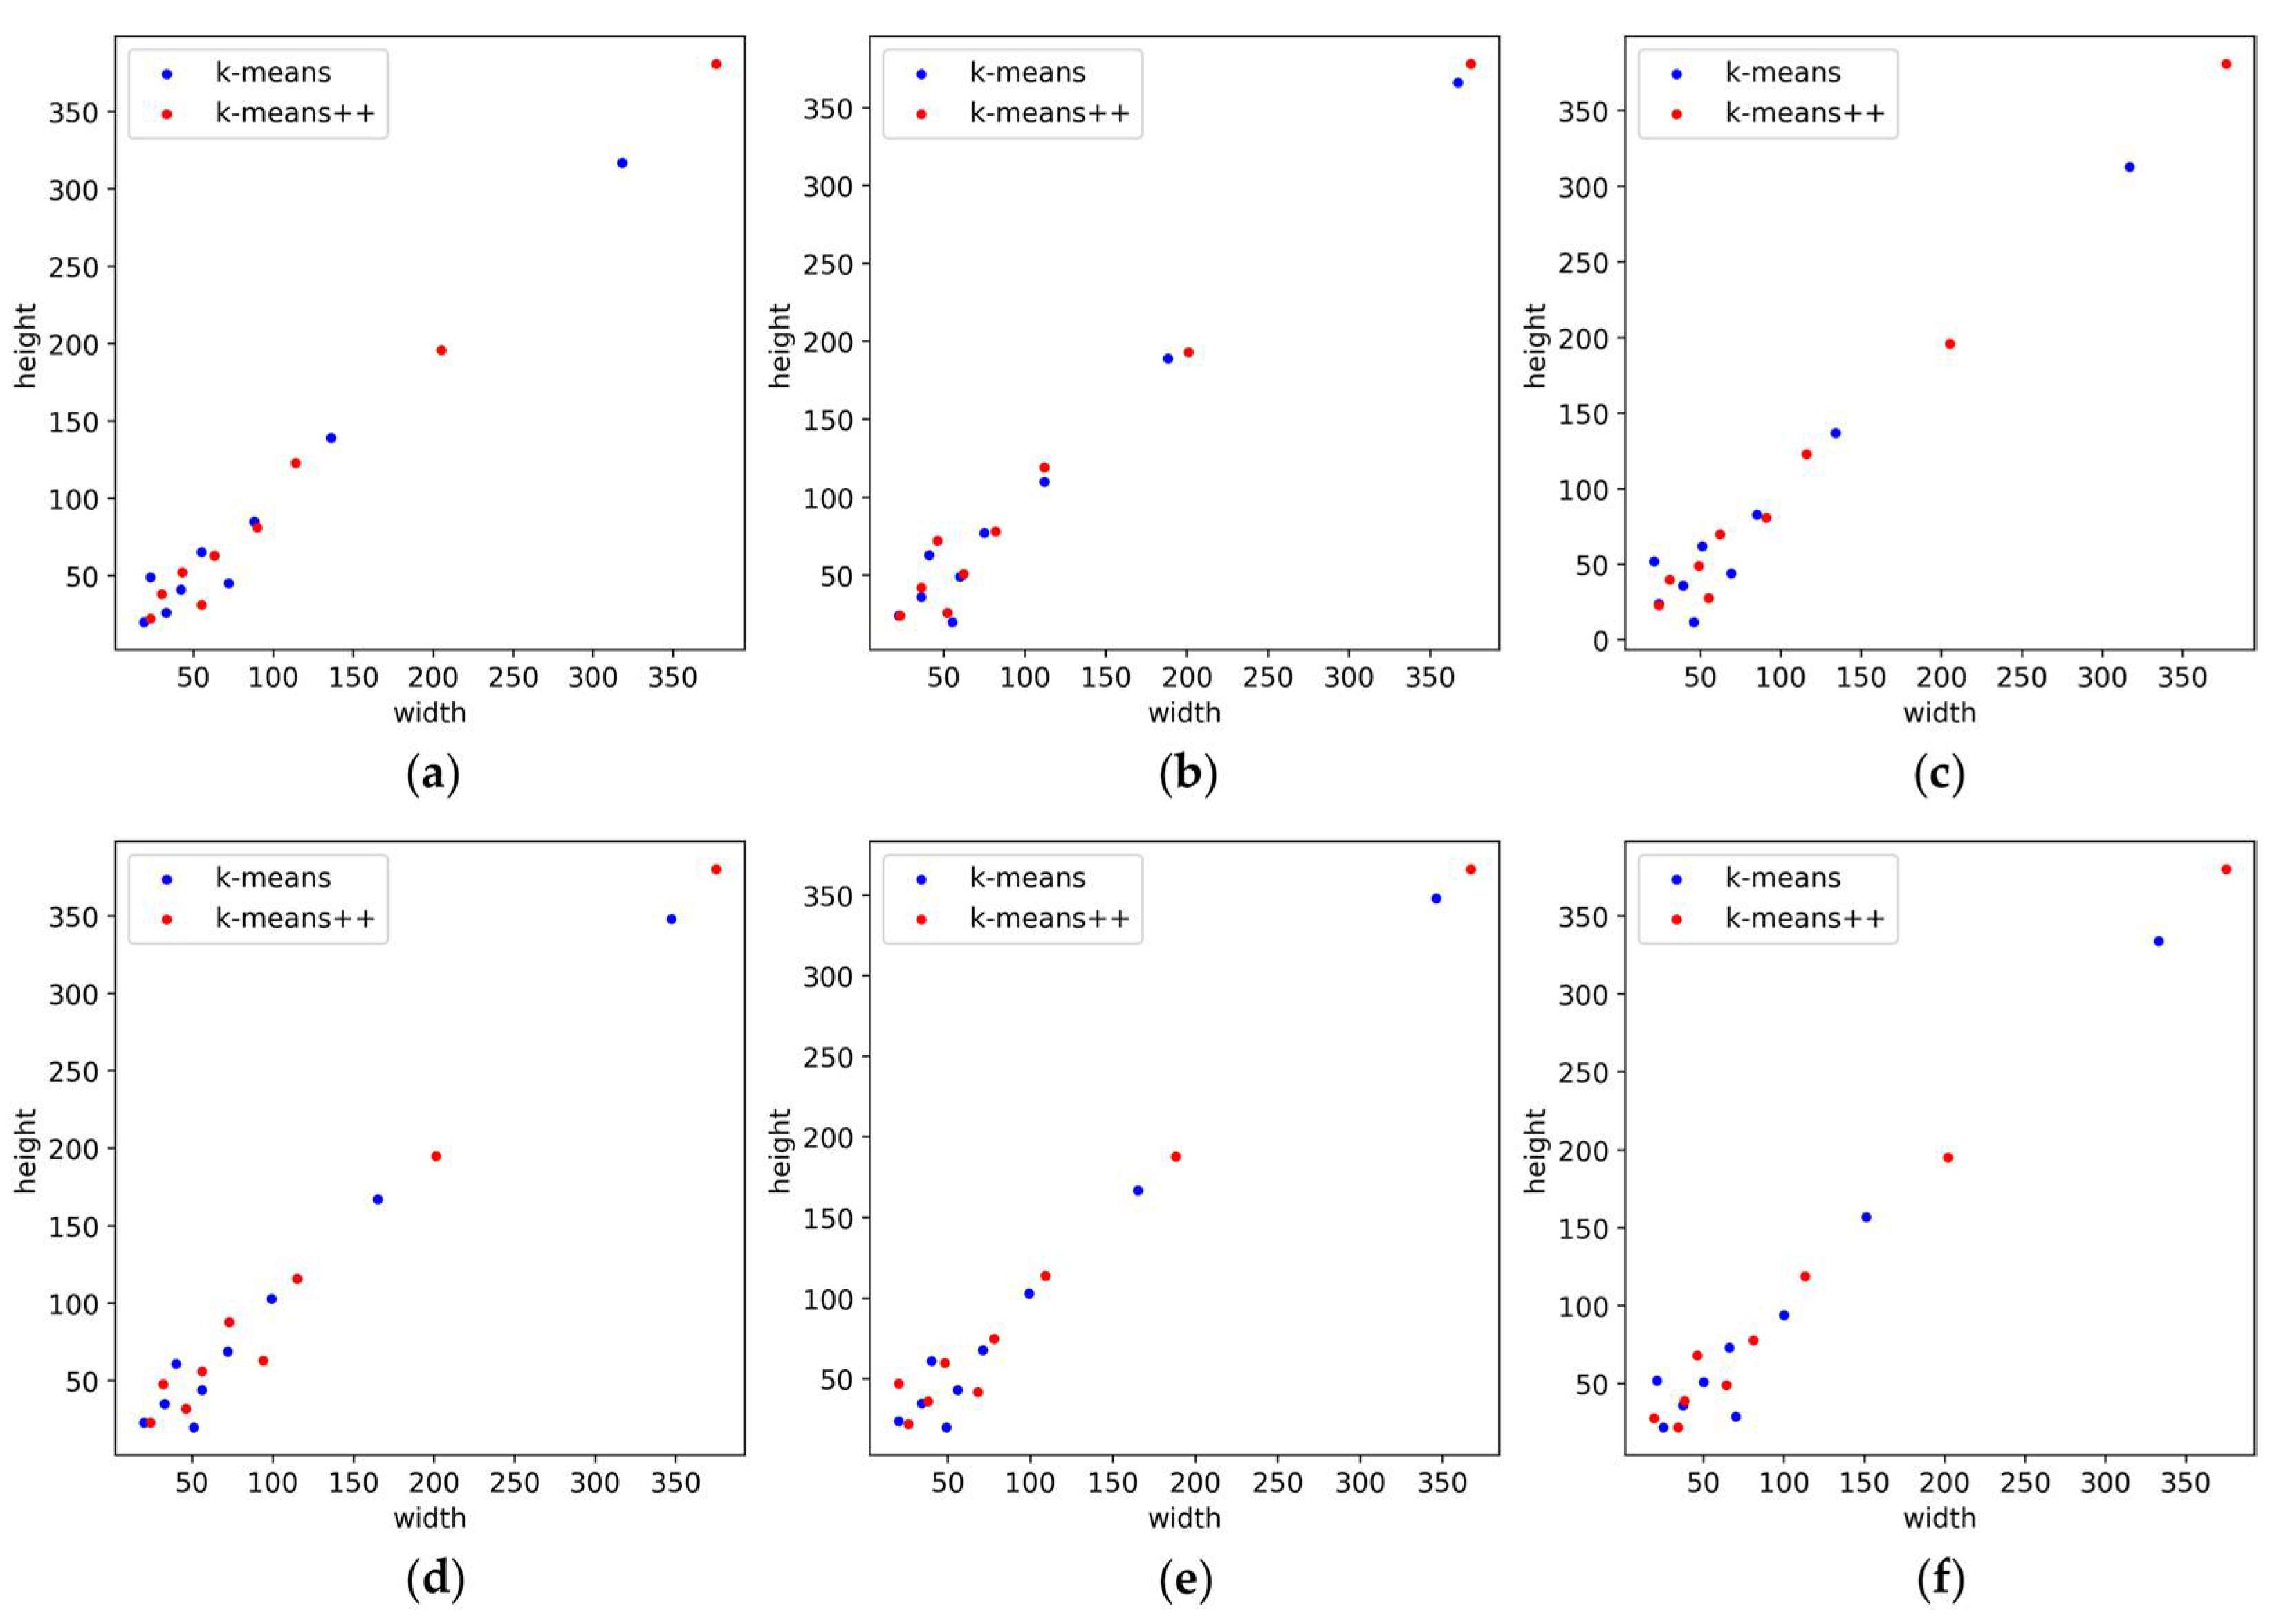
For comparing the performance of the two clustering methods used in the generation process of the prior boxes, this experiment compared the relevant metrics of six groups of prior boxes, and the results are shown in Table 3. The intersection over union (IoU) is the ratio of the intersection and union of two boxes, and Avg_IoU is the average IoU of all labels in the CP15 dataset with the prior boxes, which objectively shows the degree of matching of the prior boxes generated by different clustering methods with the CP15 dataset. This experiment also shows the size distribution range of the prior boxes with the width range and height range. It can be seen from the experimental results in Table 3 that the prior boxes generated by k-means++ in all six groups of experiments have a wider size distribution, which can help crop pest detection methods capture pest objects of multiple sizes. The visualization of the size distribution of the prior boxes in Figure 11 also shows the superiority of the size distribution range of the prior boxes generated by k-means++. Meanwhile, the prior boxes generated by the k-means++ method in all six groups of experiments also have higher Avg_IoU, indicating that the prior boxes are better matched with the CP15 dataset. Such experimental results demonstrate that the k-means++ method has the advantage of a consistent and stable performance in the generation of the prior boxes, which is more beneficial for detecting crop pests.
Table 3.
The degree of matching and the distribution range of the prior boxes.
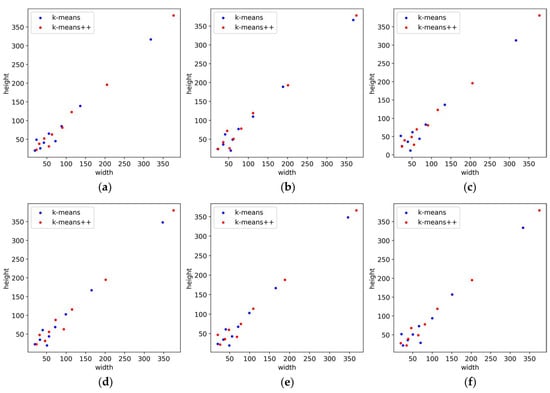
Figure 11.
The visualization of the size distribution of six groups of a priori boxes: (a) Group 1; (b) Group 2; (c) Group 3; (d) Group 4; (e) Group 5; and (f) Group 6.
3.3. Ablation Experiment
For demonstrating the effectiveness of the improvements proposed in this study, the ablation experiments were carried out on the CP15 dataset. It can be seen from the experimental results in Table 4 that the number of parameters and computations of YOLOLite are only approximately one-fifth of that of YOLOv3, while the precision is only reduced by 1.5%, which is more suitable for practical deployment. The mAP of YOLOLite was improved by 0.2% after replacing k-means with k-means++ for the prior box generation, indicating that the k-means++ method can generate the prior box with a higher quality to enhance the effectiveness of pest detection. Moreover, the addition of the lightweight sandglass block improves the mAP by 0.5% and further reduces the number of parameters and computations, which demonstrates that the lightweight sandglass block outperforms the classic residual block. Finally, the mAP was improved by 1.3% by introducing the coordinate attention into the classic residual block and the lightweight sandglass block, while only slightly increasing the number of parameters and computations, and demonstrating the importance of the attention mechanism in the crop pest detection task. The above results show that the improvements we adopted effectively improve the performance of our method in terms of accuracy, number of parameters and number of computations.
Table 4.
The results of the ablation experiment for the proposed improved methods.
3.4. Comparison with Existing Major Object Detection Methods
In order to evaluate the performance of our method, we compared our method with some existing regular-size and lightweight object detection methods. The comparison experiment was performed on the CP15 dataset. In this experiment, YOLOv3, YOLOv5m, CenterNet, and Faster R-CNN were selected to represent regular-size object detection methods, and YOLOv3-tiny, Nanodet-plus-m-1.5x, and YOLOv5s were selected to represent lightweight object detection methods.
The results of the comparison experiment in Table 5 show that the detection accuracy of our method, YOLOLite-CSG, is 0.3% higher than that of YOLOv5m, the best-performing regular-size object detection method chosen for this study. Moreover, our method has an absolutely huge advantage in terms of the number of parameters and computations. Furthermore, our method outperforms all lightweight object detection methods in terms of detection accuracy with a maximum improvement of 10.6%, and has the lowest number of parameters and a comparable number of computations to lightweight object detection methods. These experimental results fully demonstrate that our method YOLOLite-CSG achieves state-of-the-art pest detection performance with high detection accuracy and an extremely low number of parameters and computations.
Table 5.
Performance comparison of the YOLOLite-CSG with existing major object detection methods for crop pest detection tasks.
4. Discussion
Pests cause huge losses to agriculture across the world every year. Research on crop pest detection methods is one of the hottest study fields at present. In related studies, object detection methods based on convolutional neural networks are often used to detect crop pests. However, these methods cannot meet the requirements of high accuracy, fewer parameters and fewer computations for pest detection tasks in agricultural environments. Therefore, we propose a lightweight and high-accuracy crop pest detection method based on YOLOv3. We carried out the relevant experiments on the CP15 dataset, and the experimental results show that our method achieves the best accuracy with extremely few parameters and computations, being better across all metrics than the other methods evaluated in this study.
Since the prior boxes are the foundation for subsequent research on pest detection methods, this study first compared the prior boxes generated by different clustering algorithms, and the results are shown in Table 3. The experimental results clearly show that the prior boxes generated by k-means++ have a better match with the dataset and a wider size distribution. This performance advantage is mainly due to the fact that the k-means++ method does away with the random selection of initial cluster centers used in the k-means methods. The random selection of initial clustering centers implies that the k-means method is sensitive to initialization, and inappropriate initialization can easily lead to the clustering process being trapped in a local optimum. Celebi et al. [39] and Fränti et al. [40] also highlighted this point in their studies. Moreover, it has been experimentally demonstrated in these studies that the performance of k-means clustering can be improved by using proper initialization methods. Thus, k-means++ improves the performance of clustering by using samples that are far from the existing clustering centers as the next clustering centers, producing better quality prior boxes in our experiments.
For each improvement proposed in this study, we carried out an ablation experiment, and the results are shown in Table 4. Inspired by the work [41] of Zha et al., this study simplified the original YOLOv3 by adjusting the number of residual blocks and the number of channels and built YOLOLite. The experiment results demonstrate that the number of parameters and the number of computations of YOLOLite are significantly reduced. This is mainly because the reduction in the number of residual blocks and channels greatly reduces the number of convolutional operations and the number of parameters for convolution. Meanwhile, the experiment results show that the k-means++ method effectively improves the detection accuracy, which is consistent with the description of the advantages of this method given above. In addition, the introduction of lightweight sandglass blocks further reduces the number of parameters and computations because the depthwise separable convolutions and group convolution decompose the convolution operations. This result is consistent with the work of Chen et al. [42]. Moreover, the higher performance as a result of being used in the lightweight sandglass block leads to a significant improvement in detection accuracy as well. Finally, the introduction of coordinate attention substantially improves the detection accuracy with only a small increase in the number of parameters and computations. This is mainly because there is an implicit correlation between the features belonging to the same object at different spatial locations, and capturing this correlation to enhance features belonging to the same object can improve the accuracy of the pest detection task. The beneficial effect of spatial location information on the vision task is also explained in the work of Wang et al. [43]. The coordinate attention also uses channel attention to enhance the feature extraction process. The channel attention is often used in pest detection tasks and can produce a stable gain effect.
Furthermore, this study compares the proposed YOLOLite-CSG with existing regular-size and lightweight object detection methods, and the results of the experiment are shown in Table 5. The regular-size object detection methods usually adopt a complex network structure to enhance the detection effect [44]. This greatly increases the number of parameters and computations of these methods. However, the experiment results show that our method not only surpasses the regular-size object detection methods evaluated in this study in terms of accuracy, but is also more efficient in terms of parameters and computations. This is mainly attributed to our simplification of the network structure and the lightweight sandglass blocks used. The network structure simplification is more common in crop pest detection tasks [45], but often does not yield better results in terms of accuracy. Our method obtains better results in terms of accuracy, number of parameters, and computation, which provides a greater advantage for practical applications. This advantage is even more evident in the comparison with the lightweight object detection methods. Compared with the lightweight object detection methods evaluated in this study, our method achieves up to a 10.6% improvement in detection accuracy. Moreover, our method has a lower number of parameters and a comparable number of computations. Such excellent results were not obtained in previous studies [46]. However, there are some shortcomings in this study. Due to the limitations of this device, we did not perform the actual effect evaluation in UAVs or sticky traps. In subsequent studies, we should focus more on the practical effectiveness of crop pest detection methods in agricultural environments and further optimize our methods.
5. Conclusions
The existing object detection methods have a high number of parameters and computations, which is not favorable for practical application in the agricultural environment. Therefore, this study proposes a lightweight crop pest detection method based on convolutional neural networks, named YOLOLite-CSG.
The baseline model of the method proposed in this study is YOLOLite, built by optimizing the YOLOv3 structure. To optimize the performance of the method in terms of precision and the number of parameters and computations, this study introduces k-means++ for YOLOLite to improve the quality of the prior box, and embeds lightweight sandglass blocks to further reduce the parameters and computations and to extract more spatial information. In addition, coordinate attention was introduced to guide the feature extraction process.
The experimental results on the CP15 dataset show that the crop pest detection precision of the method proposed in this study is higher than that of existing object detection methods, and the number of parameters and computations are lower, which is better for practical applications. Future research should focus on exploring more methods to optimize the actual performance of crop pest detection methods, so as to migrate the method proposed in this study to UAVs or other embedded devices in the agricultural environment for efficient crop pest detection.
Author Contributions
Conceptualization, Z.C. and R.Q.; methodology, Z.C. and R.H.; software, R.H.; validation, R.H., W.D. and J.Z.; formal analysis, R.H.; investigation, R.Q.; resources, R.Q. and R.H.; data curation, W.D.; writing—original draft preparation, R.H.; writing—review and editing, Z.C. and R.Q.; visualization, M.L.; supervision, Z.C.; project administration, J.Z. All authors have read and agreed to the published version of the manuscript.
Funding
This research received no external funding.
Institutional Review Board Statement
Not applicable.
Informed Consent Statement
Not applicable.
Data Availability Statement
The data presented in this study are available on request from the authors.
Acknowledgments
We would like to especially appreciate the support and help of the assistant editor, Zhao, during the process of submitting the paper.
Conflicts of Interest
The authors declare no conflict of interest.
References
- Preti, M.; Verheggen, F.; Angeli, S. Insect Pest Monitoring with Camera-Equipped Traps: Strengths and Limitations. J. Pest Sci. 2020, 94, 203–217. [Google Scholar] [CrossRef]
- Ebrahimi, M.A.; Khoshtaghaza, M.H.; Minaei, S.; Jamshidi, B. Vision-Based Pest Detection Based on SVM Classification Method. Comput. Electron. Agric. 2017, 137, 52–58. [Google Scholar] [CrossRef]
- Chu, H.; Zhang, D.; Shao, Y.; Chang, Z.; Guo, Y.; Zhang, N. Using HOG Descriptors and UAV for Crop Pest Monitoring. In Proceedings of the Chinese Automation Congress, Xi’an, China, 30 November–2 December 2018; pp. 1516–1519. [Google Scholar]
- Durgabai, R.P.; Bhargavi, P. Pest Management Using Machine Learning Algorithms, A Review. Int. J. Comput. Sci. Eng. Inf. Technol. Res. 2018, 8, 13–22. [Google Scholar] [CrossRef]
- Nasser Shah, N.A.; Osman, M.K.; Othman, N.A.; Ahmad, F.; Ahmad, A.R. Identification and Counting of Brown Planthopper in Paddy Field Using Image Processing Techniques. Procedia Comput. Sci. 2019, 163, 580–590. [Google Scholar] [CrossRef]
- Gutierrez, A.; Ansuategi, A.; Susperregi, L.; Tubío, C.; Rankić, I.; Lenža, L. A Benchmarking of Learning Strategies for Pest Detection and Identification on Tomato Plants for Autonomous Scouting Robots Using Internal Databases. J. Sens. 2019, 2019, 5219471. [Google Scholar] [CrossRef]
- Yang, R.; Lu, X.; Huang, J.; Zhou, J.; Jiao, J.; Liu, Y.; Liu, F.; Su, B.; Gu, P. A Multi-Source Data Fusion Decision-Making Method for Disease and Pest Detection of Grape Foliage Based on ShuffleNet V2. Remote Sens. 2021, 13, 5102. [Google Scholar] [CrossRef]
- Dalai, R.; Senapati, K.K. An Intelligent Vision Based Pest Detection System Using RCNN Based Deep Learning Mechanism. In Proceedings of the 2019 International Conference on Recent Advances in Energy-Efficient Computing and Communication (ICRAECC), Nagercoil, India, 7–8 March 2019; pp. 1–4. [Google Scholar]
- Kang, Z.; Yang, J.; Li, G.; Zhang, Z. An Automatic Garbage Classification System Based on Deep Learning. IEEE Access 2020, 8, 140019–140029. [Google Scholar] [CrossRef]
- Mujahid, A.; Awan, M.J.; Yasin, A.; Mohammed, M.A.; Damaševičius, R.; Maskeliūnas, R.; Abdulkareem, K.H. Real-Time Hand Gesture Recognition Based on Deep Learning YOLOv3 Model. Appl. Sci. 2021, 11, 4164. [Google Scholar] [CrossRef]
- Awan, M.J.; Rahim, M.S.M.; Salim, N.; Rehman, A.; Garcia-Zapirain, B. Automated Knee MR Images Segmentation of Anterior Cruciate Ligament Tears. Sensors 2022, 22, 1552. [Google Scholar] [CrossRef]
- De Cesaro Júnior, T.; Rieder, R. Automatic Identification of Insects from Digital Images: A Survey. Comput. Electron. Agric. 2020, 178, 105784. [Google Scholar] [CrossRef]
- Sultana, F.; Sufian, A.; Dutta, P. A Review of Object Detection Models Based on Convolutional Neural Network. Intell. Comput. Image Process. Based Appl. 2020, 1157, 1–16. [Google Scholar] [CrossRef]
- He, K.; Gkioxari, G.; Dollar, P.; Girshick, R. Mask R-CNN. In Proceedings of the IEEE International Conference on Computer Vision, Venice, Italy, 22–29 October 2017; pp. 2961–2969. [Google Scholar]
- Rong, M.; Wang, Z.; Ban, B.; Guo, X. Pest Identification and Counting of Yellow Plate in Field Based on Improved Mask R-CNN. Discrete Dyn. Nat. Soc. 2022, 2022, 1913577. [Google Scholar] [CrossRef]
- Lin, T.-Y.; Dollár, P.; Girshick, R.; He, K.; Hariharan, B.; Belongie, S. Feature Pyramid Networks for Object Detection. In Proceedings of the IEEE Conference on Computer Vision and Pattern Recognition, Honolulu, HI, USA, 21–26 July 2017; pp. 2117–2125. [Google Scholar]
- Wang, Z.; Qiao, L.; Wang, M. Agricultural Pest Detection Algorithm Based on Improved Faster RCNN. In Proceedings of the 2021 International Conference on Computer Vision and Pattern Analysis, Guangzhou, China, 19–21 November 2021; pp. 104–109. [Google Scholar]
- Lyu, Z.; Jin, H.; Zhen, T.; Sun, F.; Xu, H. Small Object Recognition Algorithm of Grain Pests Based on SSD Feature Fusion. IEEE Access 2021, 9, 43202–43213. [Google Scholar] [CrossRef]
- Silveira, F.A.G.D.; Tetila, E.C.; Astolfi, G.; Costa, A.B.D.; Amorim, W.P. Performance Analysis of YOLOv3 for Real-Time Detection of Pests in Soybeans. In Proceedings of the Brazilian Conference on Intelligent Systems, Virtual Event, 29 November–3 December 2021; Springer: Cham, Switzerland; pp. 265–279. [Google Scholar]
- Redmon, J.; Farhadi, A. Yolov3: An Incremental Improvement. arXiv 2018, arXiv:1804.02767. [Google Scholar] [CrossRef]
- Law, H.; Deng, J. Cornernet: Detecting Objects as Paired Keypoints. In Proceedings of the European Conference on Computer Vision, Munich, Germany, 8–14 September 2018; pp. 734–750. [Google Scholar]
- Zhou, X.; Wang, D.; Krähenbühl, P. Objects as Points. arXiv 2019, arXiv:1904.07850. [Google Scholar] [CrossRef]
- Li, K.; Zhu, J.; Li, N. Lightweight Automatic Identification and Location Detection Model of Farmland Pests. Wirel. Commun. Mob. Comput. 2021, 2021, 9937038. [Google Scholar] [CrossRef]
- Godinho de Oliveira, B.A.; Ferreira, F.M.F.; Martins, C.A.P. da S. Fast and Lightweight Object Detection Network: Detection and Recognition on Resource Constrained Devices. IEEE Access 2018, 6, 8714–8724. [Google Scholar] [CrossRef]
- Chen, C.-J.; Huang, Y.-Y.; Li, Y.-S.; Chen, Y.-C.; Chang, C.-Y.; Huang, Y.-M. Identification of Fruit Tree Pests With Deep Learning on Embedded Drone to Achieve Accurate Pesticide Spraying. IEEE Access 2021, 9, 21986–21997. [Google Scholar] [CrossRef]
- Pham, D.A.; Le, A.D.; Pham, D.T.; Vo, H.B. AlertTrap: On Designing An Edge-Computing Remote Insect Monitoring System. In Proceedings of the 2021 8th NAFOSTED Conference on Information and Computer Science (NICS), Hanoi, Vietnam, 21–22 December 2021; pp. 323–328. [Google Scholar]
- Genaev, M.A.; Komyshev, E.G.; Shishkina, O.D.; Adonyeva, N.V.; Karpova, E.K.; Gruntenko, N.E.; Zakharenko, L.P.; Koval, V.S.; Afonnikov, D.A. Classification of Fruit Flies by Gender in Images Using Smartphones and the YOLOv4-Tiny Neural Network. Mathematics 2022, 10, 295. [Google Scholar] [CrossRef]
- Hou, Q.; Zhou, D.; Feng, J. Coordinate Attention for Efficient Mobile Network Design. In Proceedings of the IEEE/CVF Conference on Computer Vision and Pattern Recognition, Nashville, TN, USA, 19–25 June 2021; pp. 13708–13717. [Google Scholar]
- DeVries, T.; Taylor, G.W. Improved Regularization of Convolutional Neural Networks with Cutout. arXiv 2017, arXiv:1708.04552. [Google Scholar] [CrossRef]
- He, K.; Zhang, X.; Ren, S.; Sun, J. Deep Residual Learning for Image Recognition. In Proceedings of the IEEE Conference on Computer Vision and Pattern Recognition, Las Vegas, NV, USA, 26 June–1 July 2016; pp. 770–778. [Google Scholar]
- Sandler, M.; Howard, A.; Zhu, M.; Zhmoginov, A.; Chen, L.-C. MobileNetV2: Inverted Residuals and Linear Bottlenecks. In Proceedings of the IEEE Conference on Computer Vision and Pattern Recognition, Salt Lake City, UT, USA, 18–22 June 2018; pp. 4510–4520. [Google Scholar]
- Zhou, D.; Hou, Q.; Chen, Y.; Feng, J.; Yan, S. Rethinking Bottleneck Structure for Efficient Mobile Network Design. In Proceedings of the European Conference on Computer Vision, Newcastle, UK, 23–28 August 2020; pp. 680–697. [Google Scholar]
- Zhang, X.; Zhou, X.; Lin, M.; Sun, J. ShuffleNet: An Extremely Efficient Convolutional Neural Network for Mobile Devices. In Proceedings of the IEEE Conference on Computer Vision and Pattern Recognition, Salt Lake City, UT, USA, 18–22 June 2018; pp. 6848–6856. [Google Scholar]
- Ramachandran, P.; Zoph, B.; Le, Q.V. Searching for Activation Functions. arXiv 2017, arXiv:1710.05941. [Google Scholar] [CrossRef]
- Howard, A.; Sandler, M.; Chen, B.; Wang, W.; Chen, L.-C.; Tan, M.; Chu, G.; Vasudevan, V.; Zhu, Y.; Pang, R.; et al. Searching for MobileNetV3. In Proceedings of the IEEE/CVF International Conference on Computer Vision, Seoul, Korea, 27 October–2 November 2019; pp. 1314–1324. [Google Scholar]
- Ma, N.; Zhang, X.; Zheng, H.-T.; Sun, J. Shufflenet v2: Practical Guidelines for Efficient Cnn Architecture Design. In Proceedings of the European Conference on Computer Vision, Munich, Germany, 8–14 September 2018; pp. 116–131. [Google Scholar]
- Hu, J.; Shen, L.; Sun, G. Squeeze-and-Excitation Networks. In Proceedings of the IEEE Conference on Computer Vision and Pattern Recognition, Salt Lake City, UT, USA, 18–22 June 2018; pp. 7132–7141. [Google Scholar]
- Woo, S.; Park, J.; Lee, J.-Y.; Kweon, I.S. Cbam: Convolutional Block Attention Module. In Proceedings of the European Conference on Computer Vision, Munich, Germany, 8–14 September 2018; pp. 3–19. [Google Scholar]
- Celebi, M.E.; Kingravi, H.A.; Vela, P.A. A Comparative Study of Efficient Initialization Methods for the K-Means Clustering Algorithm. Expert Syst. Appl. 2013, 40, 200–210. [Google Scholar] [CrossRef] [Green Version]
- Fränti, P.; Sieranoja, S. How Much Can K-Means Be Improved by Using Better Initialization and Repeats? Pattern Recognit. 2019, 93, 95–112. [Google Scholar] [CrossRef]
- Zha, M.; Qian, W.; Yi, W.; Hua, J. A Lightweight YOLOv4-Based Forestry Pest Detection Method Using Coordinate Attention and Feature Fusion. Entropy 2021, 23, 1587. [Google Scholar] [CrossRef] [PubMed]
- Chen, T.; Zhang, R.; Zhu, L.; Zhang, S.; Li, X. A Method of Fast Segmentation for Banana Stalk Exploited Lightweight Multi-Feature Fusion Deep Neural Network. Machines 2021, 9, 66. [Google Scholar] [CrossRef]
- Wang, X.; Girshick, R.; Gupta, A.; He, K. Non-Local Neural Networks. In Proceedings of the IEEE Conference on Computer Vision and Pattern Recognition, Salt Lake City, UT, USA, 18–22 June 2018; pp. 7794–7803. [Google Scholar]
- Wang, R.; Jiao, L.; Xie, C.; Chen, P.; Du, J.; Li, R. S-RPN: Sampling-Balanced Region Proposal Network for Small Crop Pest Detection. Comput. Electron. Agric. 2021, 187, 106290. [Google Scholar] [CrossRef]
- Dong, S.; Zhang, J.; Wang, F.; Wang, X. YOLO-Pest: A Real-Time Multi-Class Crop Pest Detection Model. In Proceedings of the International Conference on Computer Application and Information Security (ICCAIS 2021), Wuhan, China, 18–19 December 2022; p. 41. [Google Scholar]
- Wang, X.; Liu, J.; Zhu, X. Early Real-Time Detection Algorithm of Tomato Diseases and Pests in the Natural Environment. Plant Methods 2021, 17, 43. [Google Scholar] [CrossRef]


Publisher’s Note: MDPI stays neutral with regard to jurisdictional claims in published maps and institutional affiliations. |
© 2022 by the authors. Licensee MDPI, Basel, Switzerland. This article is an open access article distributed under the terms and conditions of the Creative Commons Attribution (CC BY) license (https://creativecommons.org/licenses/by/4.0/).