Article

Data-Driven Decision Making in Maintenance Service Delivery Process: A Case Study

Department of Management, Information and Production Engineering, University of Bergamo, Viale Marconi, 5, 24044 Dalmine, BG, Italy
*
Author to whom correspondence should be addressed.
Appl. Sci. 2022, 12(15), 7395; https://doi.org/10.3390/app12157395
Submission received: 4 July 2022 / Revised: 21 July 2022 / Accepted: 22 July 2022 / Published: 22 July 2022

Abstract

:
Data availability is changing the way companies make decisions at various levels (e.g., strategical and operational). Researchers and practitioners are exploring how product–service system (PSS) providers can benefit from data availability and usage, especially when it comes to making decisions related to service delivery. One of the services that are expected to benefit most from data availability is maintenance. Through the analysis of the asset health status, service providers can make informed and timely decisions to prevent failures. Despite this, the offering of data-based maintenance service is not trivial, and requires providers to structure themselves to collect, analyze and use historical and real-time data properly (e.g., introducing suitable information flows, methods and competencies). The paper aims to investigate how a manufacturing company can re-engineer its maintenance service delivery process in a data-driven fashion. Thus, the paper presents a case study where, based on the Dual-perspective, Data-based, Decision-making process for Maintenance service delivery (D3M), an Italian manufacturing company reengineered its maintenance service delivery process in a data-driven fashion. The case study highlights the benefits and barriers coming with this transformation and aims at helping manufacturing companies in understanding how to address it.

1. Introduction

In recent decades, manufacturing companies have been experiencing a critical transformation due to the spread of new business models based on the offering of bundles of products and services—namely, Product Service Systems (PSS) [1]—and the introduction of Industry 4.0 technologies, which has contributed to the progressive digitalization of production and management processes [2,3]. Digitalization allows companies to collect increasing quantities of data to support decision-making [4] in both product and service domains.
The introduction of new service-oriented business models and digital technologies is not trivial for manufacturing companies, since they need to change their relationships with customers (traditionally short-termed and based on products sale) [5] and, consequently, the way processes are managed and services delivered (e.g., new situations to handle or new technologies, resulting in increased complexity and risks) [6]. Complexity further increases when dealing with services since they require facing all the stakeholders’ peculiar characteristics [7], such as customers’ preferences, behaviors, and attitudes, the way stakeholders interact, the skills available, and others [3,8]. Over the past few years, researchers and practitioners have started investigating the benefits achievable by combining PSS with Industry 4.0 technologies in the manufacturing companies’ processes. Maintenance is, among others, the service that can benefit the most from digitalization, since the acquisition and processing of data from the field can substantially improve the way maintenance service is delivered [9]. Leveraging the case of an Italian manufacturing company, this paper contributes to the understanding of how a maintenance service delivery process can be re-engineered in a data-driven fashion thanks to the guidance of the Dual-perspective, Data-based, Decision-making process for Maintenance service delivery (D3M) framework proposed by [10]. Based on the D3M framework, this paper shows how the company has identified weaknesses in its original process and has coped with them by selecting and customizing activities and methods to support the newer-engineered, data-driven, maintenance service delivery process. It is important to clarify that the D3M framework should not be intended as a novel IT architecture, but rather as a framework to support companies in understanding how their decision-making processes can be improved by combining new activities related to data collection and processing (e.g., improved collection of data during maintenance service delivery and following analysis, analysis of fault trends to identify the necessity for redesign components), shifting from pure experience-based decision-making to a mix of data and experience.
Thus, this paper seeks to answer the research question: “How can a manufacturing company re-engineer its maintenance service delivery process in a data-driven fashion through the D3M framework?”
The paper is structured as follows. Section 2 provides a literature background. Section 3 briefly presents the D3M framework. Section 4 describes the research methodology. Section 5 describes the case study, showing how the transformation of Company Beta took place. Section 6 discusses the results, while Section 7 concludes the paper by delineating future developments.

2. Literature Background

The literature on PSS, Industry 4.0, maintenance, and decision-making shows that these themes are strongly connected if analyzed from a service-oriented perspective. The transition towards economically sustainable PSS offerings requires the definition of processes able to fulfill customer requests and, contemporarily, to manage company resources [11] to be efficient and avoid economic losses [12,13]. To improve efficiency in service delivery, companies must rethink their internal processes and manage them throughout the whole PSS lifecycle [14], building them on strengths and tackling weaknesses [15] (e.g., by exploiting collaboration networks [8]). The fourth industrial revolution contributes significantly to improving service delivery [16] and, as asserted by [17], the digitalization of services will gain importance over the next years. Indeed, the possibility of gathering and processing data generated by the asset during its Middle-of-Life (MoL) stage [14] contributes to (i) generating new knowledge [18] on the asset [19], (ii) monitoring the asset’s health status [20,21], (iii) better scheduling the maintenance activities to prevent failures and downtimes [22,23], and (iv) improving the sustainability of the PSS offering [24]. In this sense, data processing becomes a value-added activity for a company only when data are converted into usable knowledge. In any case, data processing is not a trivial activity and requires structured processes for data collection, management, and analysis [25,26]. For this purpose, it is important to establish well-defined goals and strategies [27] and pursue them properly. Authors like Mahlamäki et al. [28] clarify that errors during data collection influence the following analyses and may lead to wrong decisions affecting maintenance outcomes. Besides issues in data collection, customers’ willingness to share operational data with the maintenance service provider also emerges as critical for generating new knowledge and value for the stakeholders [29]. The main benefit of gathering asset MoL data is that it can feed data-driven decision-making tools and methods, representing a growing research field in maintenance service delivery [30,31]. He, Guo, and Jiang [32] affirm that the presence of a Decision-Support System (DSS) in a manufacturing environment is fundamental to support operations and activities along the product lifecycle. Despite this, in manufacturing companies, decisions are predominantly made by humans grounded on their expertise rather than on field data [33].
To support companies in introducing DSS, Oluyisola et al. [34] discuss the importance of designing suitable DSS to allow “dynamic and near real-time actions”. Some authors proposed classifications for DSSs to facilitate their selection [35,36] in support of human decision-making. As Dong and Srinivasan [35] affirm, it is necessary to distinguish between specific DSS, built to handle specific decisions and with high reliability in their domain of competence, from the more general ones, which can be applied to different domains at the cost of lower reliability. In this perspective, the improvement of PSS performance and, specifically, the maintenance service delivery processes are strongly linked to how decision-support and data-processing methods are selected and integrated inside companies [37], as well as how companies decide to study and reuse knowledge previously generated [38,39]. This link becomes even more evident when the operational perspective is adopted, where data availability and suitable decision-making instruments influence daily performance [40]. The availability of such instruments, able to manage the integration between service and asset-related information and handle domain-specific data, is questioned by authors like Dahmani et al. [41], Gopalakrishnan et al. [33], and Rondini et al. [7], who clarify the necessity for such tools to improve the PSS and service-related decision-making.
From this literature background, it emerges that there is a necessity for guidance in terms of data collection and usage processes, as well as the availability of decision-making tools for the companies dealing with maintenance-based services and exploiting the Industry 4.0 technologies [8,19,38,42]. Other authors proposed data-driven approaches and case studies for maintenance delivery (e.g., [24,43,44,45]), focusing on specific instruments aimed at supporting problem identification or resolution, but none adopt the comprehensive perspective proposed in [10] at a theoretical level. In [24,43,44], the use of FMECA is suggested to handle the definition of the criticality of the asset, and [43] uses BPMN2.0 to describe the maintenance-related process. What emerges is that [10] provides a more general perspective on the process, devoting attention to both the maintenance service and the asset monitoring (as will be better explained in the next section), providing suggested methods to handle each phase of the process.
As an answer, this paper, through a case study, describes how the maintenance service delivery process of an Italian manufacturing company has been re-engineered in a data-driven fashion according to the D3M framework, showing how processes need to be reshaped, adapted, and upgraded to manage a data-driven approach. The following section describes the structure of the D3M framework.

3. The D3M Framework

This paper wants to present a case study where a manufacturing company re-engineered its maintenance service delivery process in a data-driven fashion following the approach proposed by the D3M framework, first presented in [10]. The novelty of the paper resides in the first complete application of the D3M framework, previously only theoretically discussed. As shown in Figure 1, the D3M framework is made of three main streams. Two of them are parallel (i.e., the service stream and the industrial asset stream), while the third one combines the information collected and elaborated by the previous ones to make decisions related to the maintenance delivery (i.e., the maintenance delivery stream).
The Service stream, composed of three stages, is related to the analysis of the maintenance service performance, and aims at:
  • Supporting the identification of the company’s maintenance service offering. Through the process mapping, it is possible to clarify the components of the maintenance service delivery process in terms of actors, activities, decisions, and information flow.
  • Defining a strategy for the service data collection and analysis. Knowing the process, it is possible to define which maintenance service data to collect and analyze to assess performance.
  • Analyzing the data collected to define the service performance. This allows the companies to monitor the strengths and weaknesses of their service process and then favor selecting the maintenance service offering portfolio.
The Industrial Asset stream comprises four stages. They guide the company in:
  • Identifying the most critical components. This phase can be executed following different approaches, some more structured (e.g., the FMECA) and others less (e.g., the Open Review Meetings). When using structured approaches, components criticality can be defined using the Risk Priority Number (RPN), which can be a function of repairing costs, failure frequency, and repairing time and can be kept updated through the Dynamic FMECA [39]. In less structured approaches, criticality may be defined following a discussion between the participants at the meetings. The components’ criticality allows (re)defining the list of components necessary to monitor and, thus, updating the data collection list.
  • Defining a strategy for data collection. Given the output of the previous phase, the aim is to define aspects such as the sensor selection, trade-off evaluation, and selection of the algorithms for the analyses. It is performed by selecting, among the algorithms considered, the one that performs better according to the company’s interests.
  • Collecting the data and categorizing them to favor the analysis. This is a continuous activity performed daily while the asset is working.
  • Analyzing the data to identify the health status of the asset. Based on the results of the analyses, maintenance-related decisions (e.g., maintenance required, wait) can be made.
The two streams merge into the Maintenance Delivery stream, composed of three stages aimed at:
  • Cross analyzing the data incoming from the previous streams as well as the data related to the available service resources (e.g., technicians, schedules, skills) and the customer (e.g., location, contractual clauses, skills). This step allows matching the service requests with the resources, proposing, at the same time, a tentative schedule for the service execution.
  • Making decisions related to service delivery. Based on the resolution proposal defined in the previous phase, the actors decide on the service delivery.
  • Collecting data during the service execution that will be analyzed and used to capture deviations from the expected trends in terms of failures or service execution and, thus, as an input for improvement activities related to the Industrial Asset or the Service.
Although being focused on operational decisions (e.g., maintenance task allocation), when aggregating data, the D3M framework can support strategic (e.g., acquisition of skills and technologies for maintenance improvement) and tactical (e.g., maintenance policies definition) decisions. Moreover, the D3M framework proposes a set of methods to support decision-making that could be integrated with others depending on the necessities of the user. As will be shown in Section 5, the D3M framework can act as a guide for defining the data flow and process structure in data-driven maintenance service delivery processes.

4. Research Methodology

The case study results from a 3-year collaboration with Company Beta, an Italian manufacturing company producing balancing machines, aimed at reengineering its maintenance service delivery process in a data-driven fashion. As suggested by Yin [46], the case study approach was selected to explore empirically and illustrate a specific phenomenon in a real context, trying to understand its motivations; the longitudinal case study approach [47] was selected to observe the transformation of the company over a long period.
Multiple semi-structured interviews were organized based on the research scope, and participants were selected accordingly. The investigation covered the activities executed during the maintenance service delivery, data collected, methods used, decisions that actors had to deal with, and if and how the knowledge generated during the process was reused. The presence of employees from the product and service departments allowed considering multiple perspectives and necessities and using them during the reengineering, guiding the methods’ selection and customization.
While the semi-structured interviews pursued a qualitative research approach [48], the customization of some methods required a more quantitative approach [49], based on the formulation of mathematical hypotheses and the adoption of optimization instruments to deal with the specific needs of the company. This being a longitudinal case study, the authors had the chance to observe the transformation of Company Beta’s processes over time, proposing adjustments based on the necessities.

5. Case Study

Company Beta, traditionally characterized by a product-centric portfolio, offers its customers corrective and preventive maintenance, warranty, help desk, and spare parts distribution services. Recently, leveraging on the Industry 4.0 potentialities, Beta started a transformation in support of the preventive maintenance service by transforming corrective maintenance contracts into preventive ones (both cyclical and condition-based).
The case study describes how Beta transformed some of the activities characterizing the maintenance service delivery process by leveraging the D3M framework and highlights how the introduction of data-driven processes required a profound discussion around the data to collect and use. The aim was to create the conditions to improve resources management as well as to lay the foundations to build maintenance engineering knowledge, allowing to strengthen the preventive maintenance offering at the expense of corrective interventions.

5.1. The Service Stream

5.1.1. Service Identification

The first step required identifying the services offered and mapping them with the BPMN2.0 notation. Beta’s offering consisted mainly of corrective maintenance, with few preventive contracts, and the company did not have a comprehensive picture of its processes. The adoption of BPMN2.0 allowed identifying of all the activities, decisions, actors, data, and tools characterizing each service process. To do so, company employees were interviewed and, from the analysis of the process maps, multiple useful information and criticalities were highlighted.
Different issues characterized the original maintenance service delivery processes. For instance, an unstructured trial-and-error activity based on the technician’s experience was carried out at the beginning of the maintenance intervention to identify the assets’ problems, or the customers frequently required discounts on the billing price proposed by Beta at the end of the intervention, increasing the time and the effort needed to finalize the transition. Furthermore, even if Beta was used to fill service reports after each maintenance intervention, it realized that most of these data were unstructured and some important information was missing (e.g., components worked, spare parts used).

5.1.2. Definition of the Strategy for Service Data Collection and Analysis

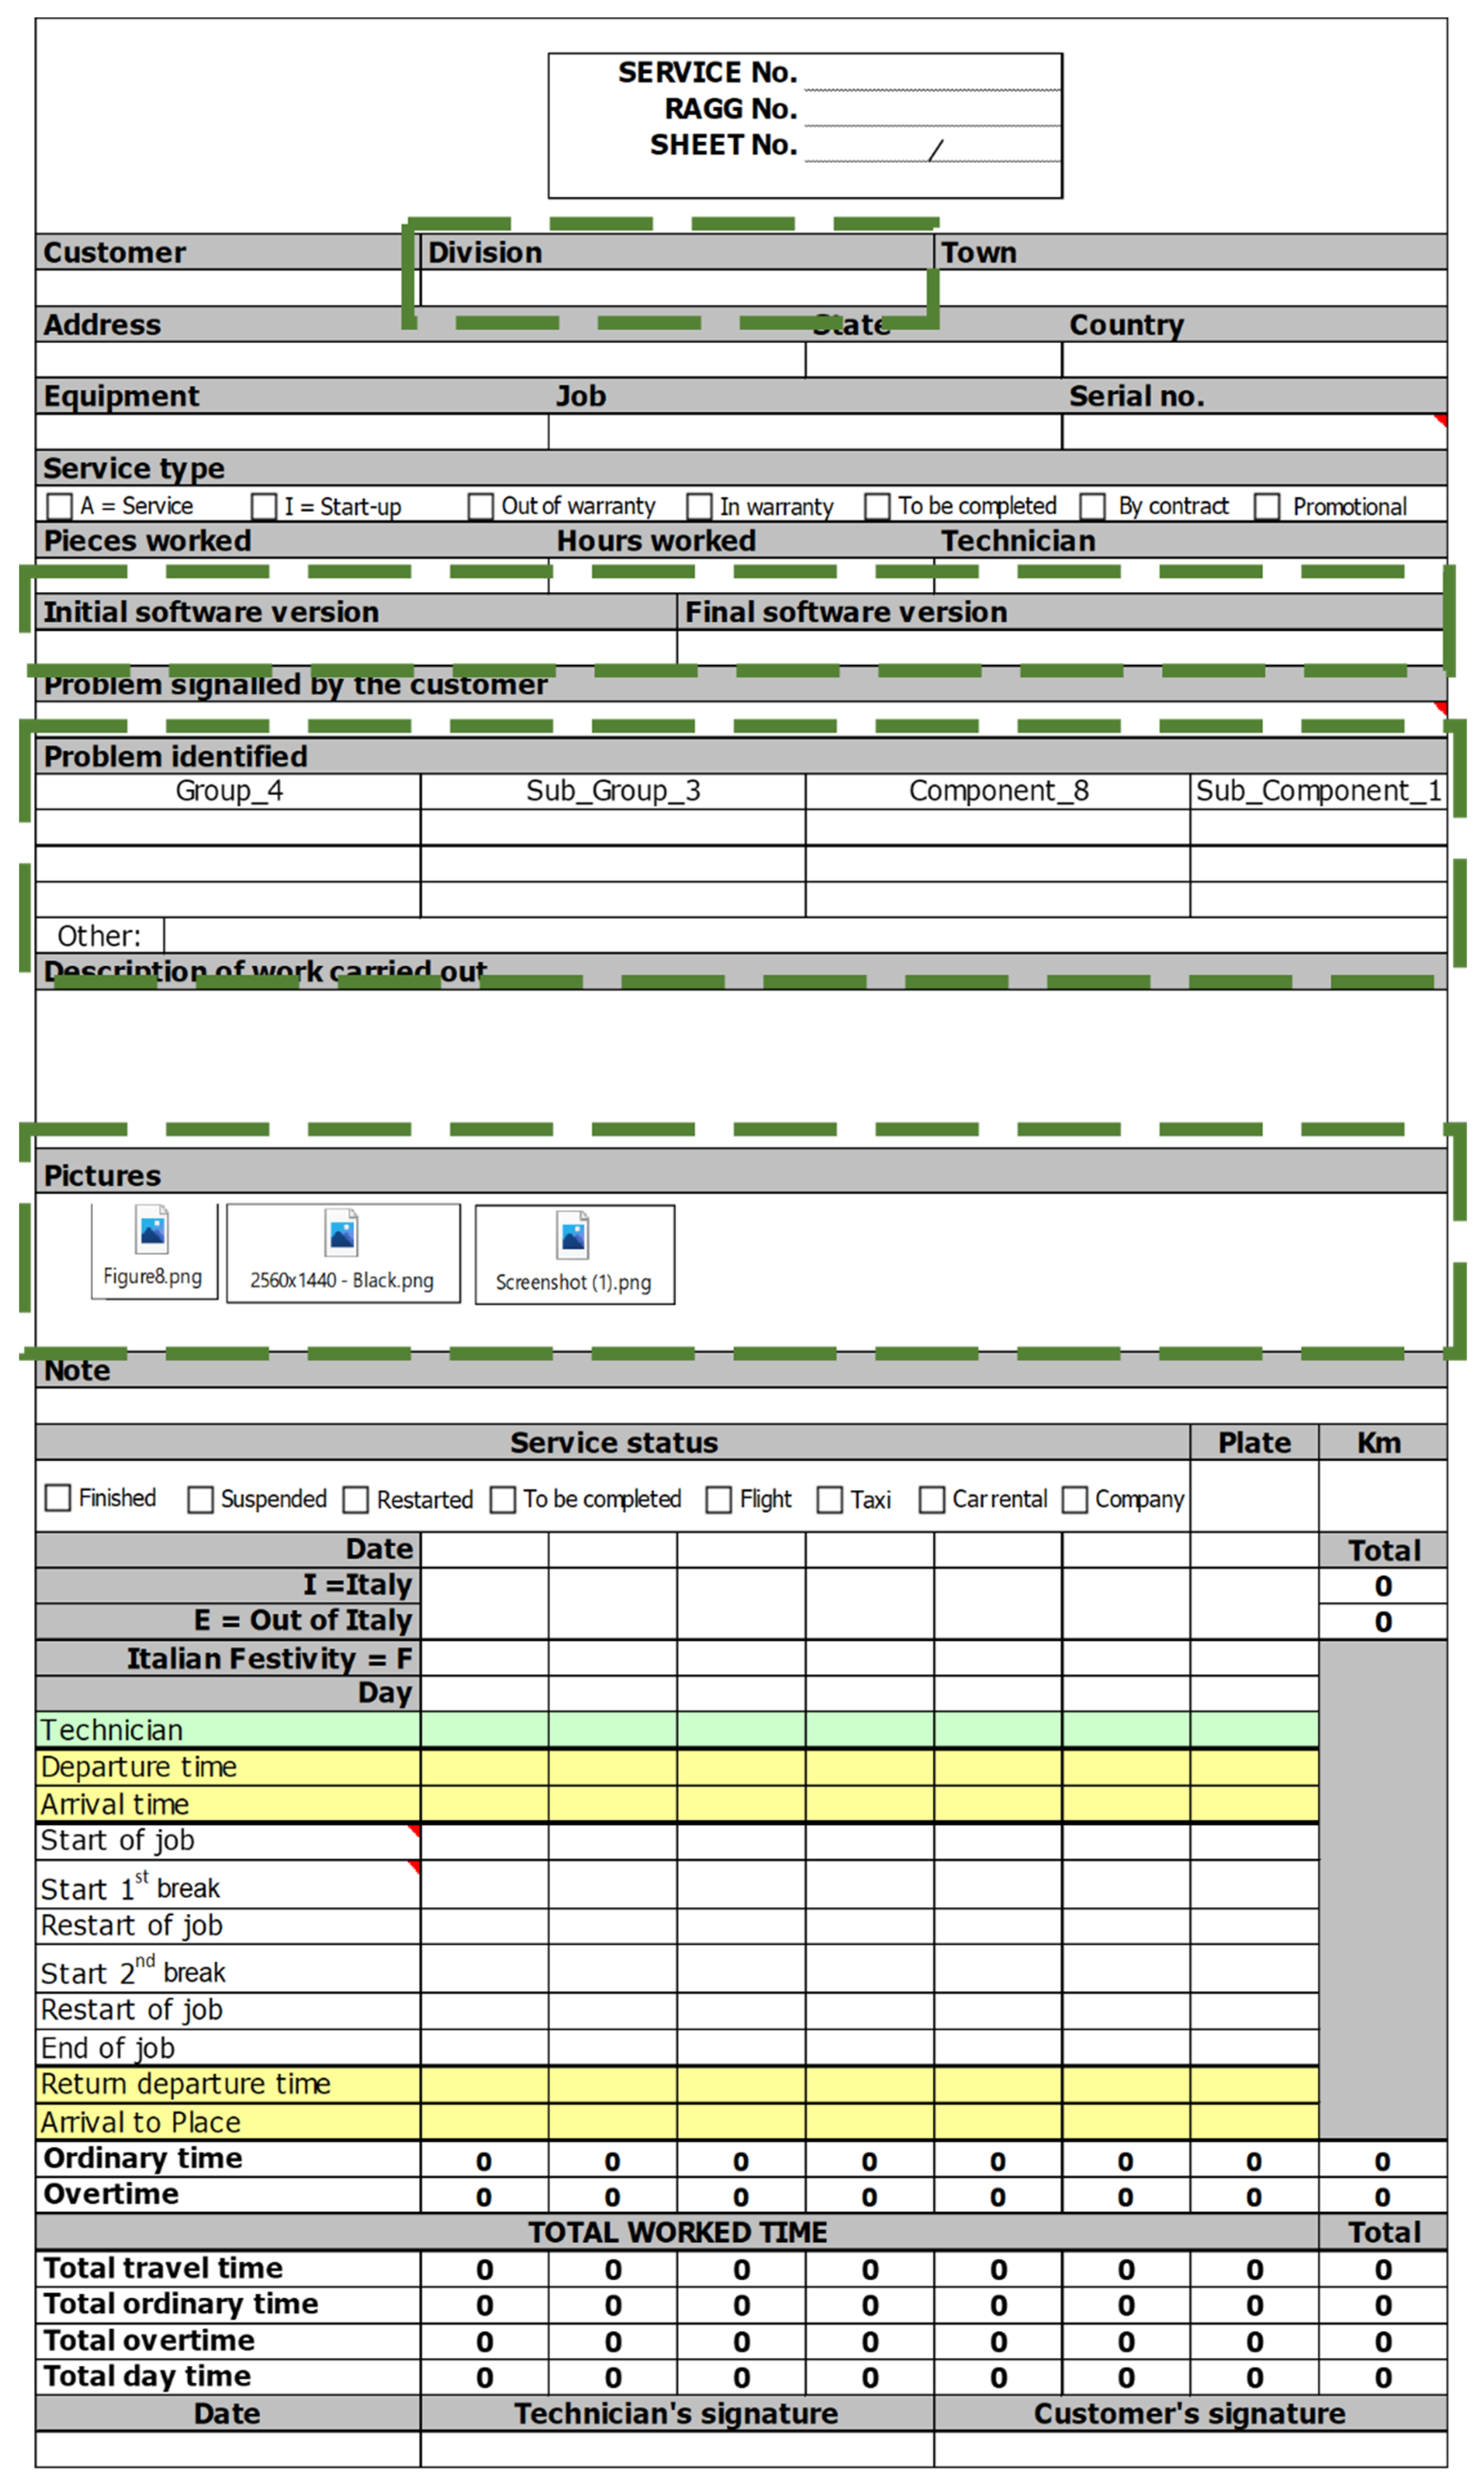
As mentioned above, Beta was already collecting data while providing maintenance. Despite this, the data were usually unstructured (i.e., free text), incomplete (i.e., reports were seldomly fully completed), challenging to interpret and, thus, time-consuming to analyze. For Beta, this was one of the main limitations preventing it from improving its maintenance performance. Therefore, Beta decided to update the content of the service report to cope with the gaps identified and allow a more valuable data analysis. As part of the reengineering strategy, Beta decided to upgrade the original service report with new features to guide the filling phase instead of introducing a completely new instrument. This decision followed the intention of not revolutionizing the workflow of the technicians used to deal with Excel-based reports. Beta decided to simplify its filling (e.g., introducing drop-down menus, showing warnings in case of empty fields) so that the technicians would have been able to handle the changes immediately, without the need for specific training sessions. Among the changes, one can highlight the presence of:
  • New fields (e.g., software version) are important to describe problems.
  • Drop-down menus allow one to select the failed component and also guarantee uniformity in the vocabulary.
  • The possibility to include pictures of the failure to integrate the textual description.
  • The creation of a link between the spare part used, the failure, and the asset requiring the part.
All these improvements were introduced in the scope of favoring the data extraction and automating the analyses using Microsoft Excel® macros or external means (e.g., Python code). After the improvements, Beta was able to extract information related to the failure typology, frequency, geographical distribution, spare parts consumption, and others.
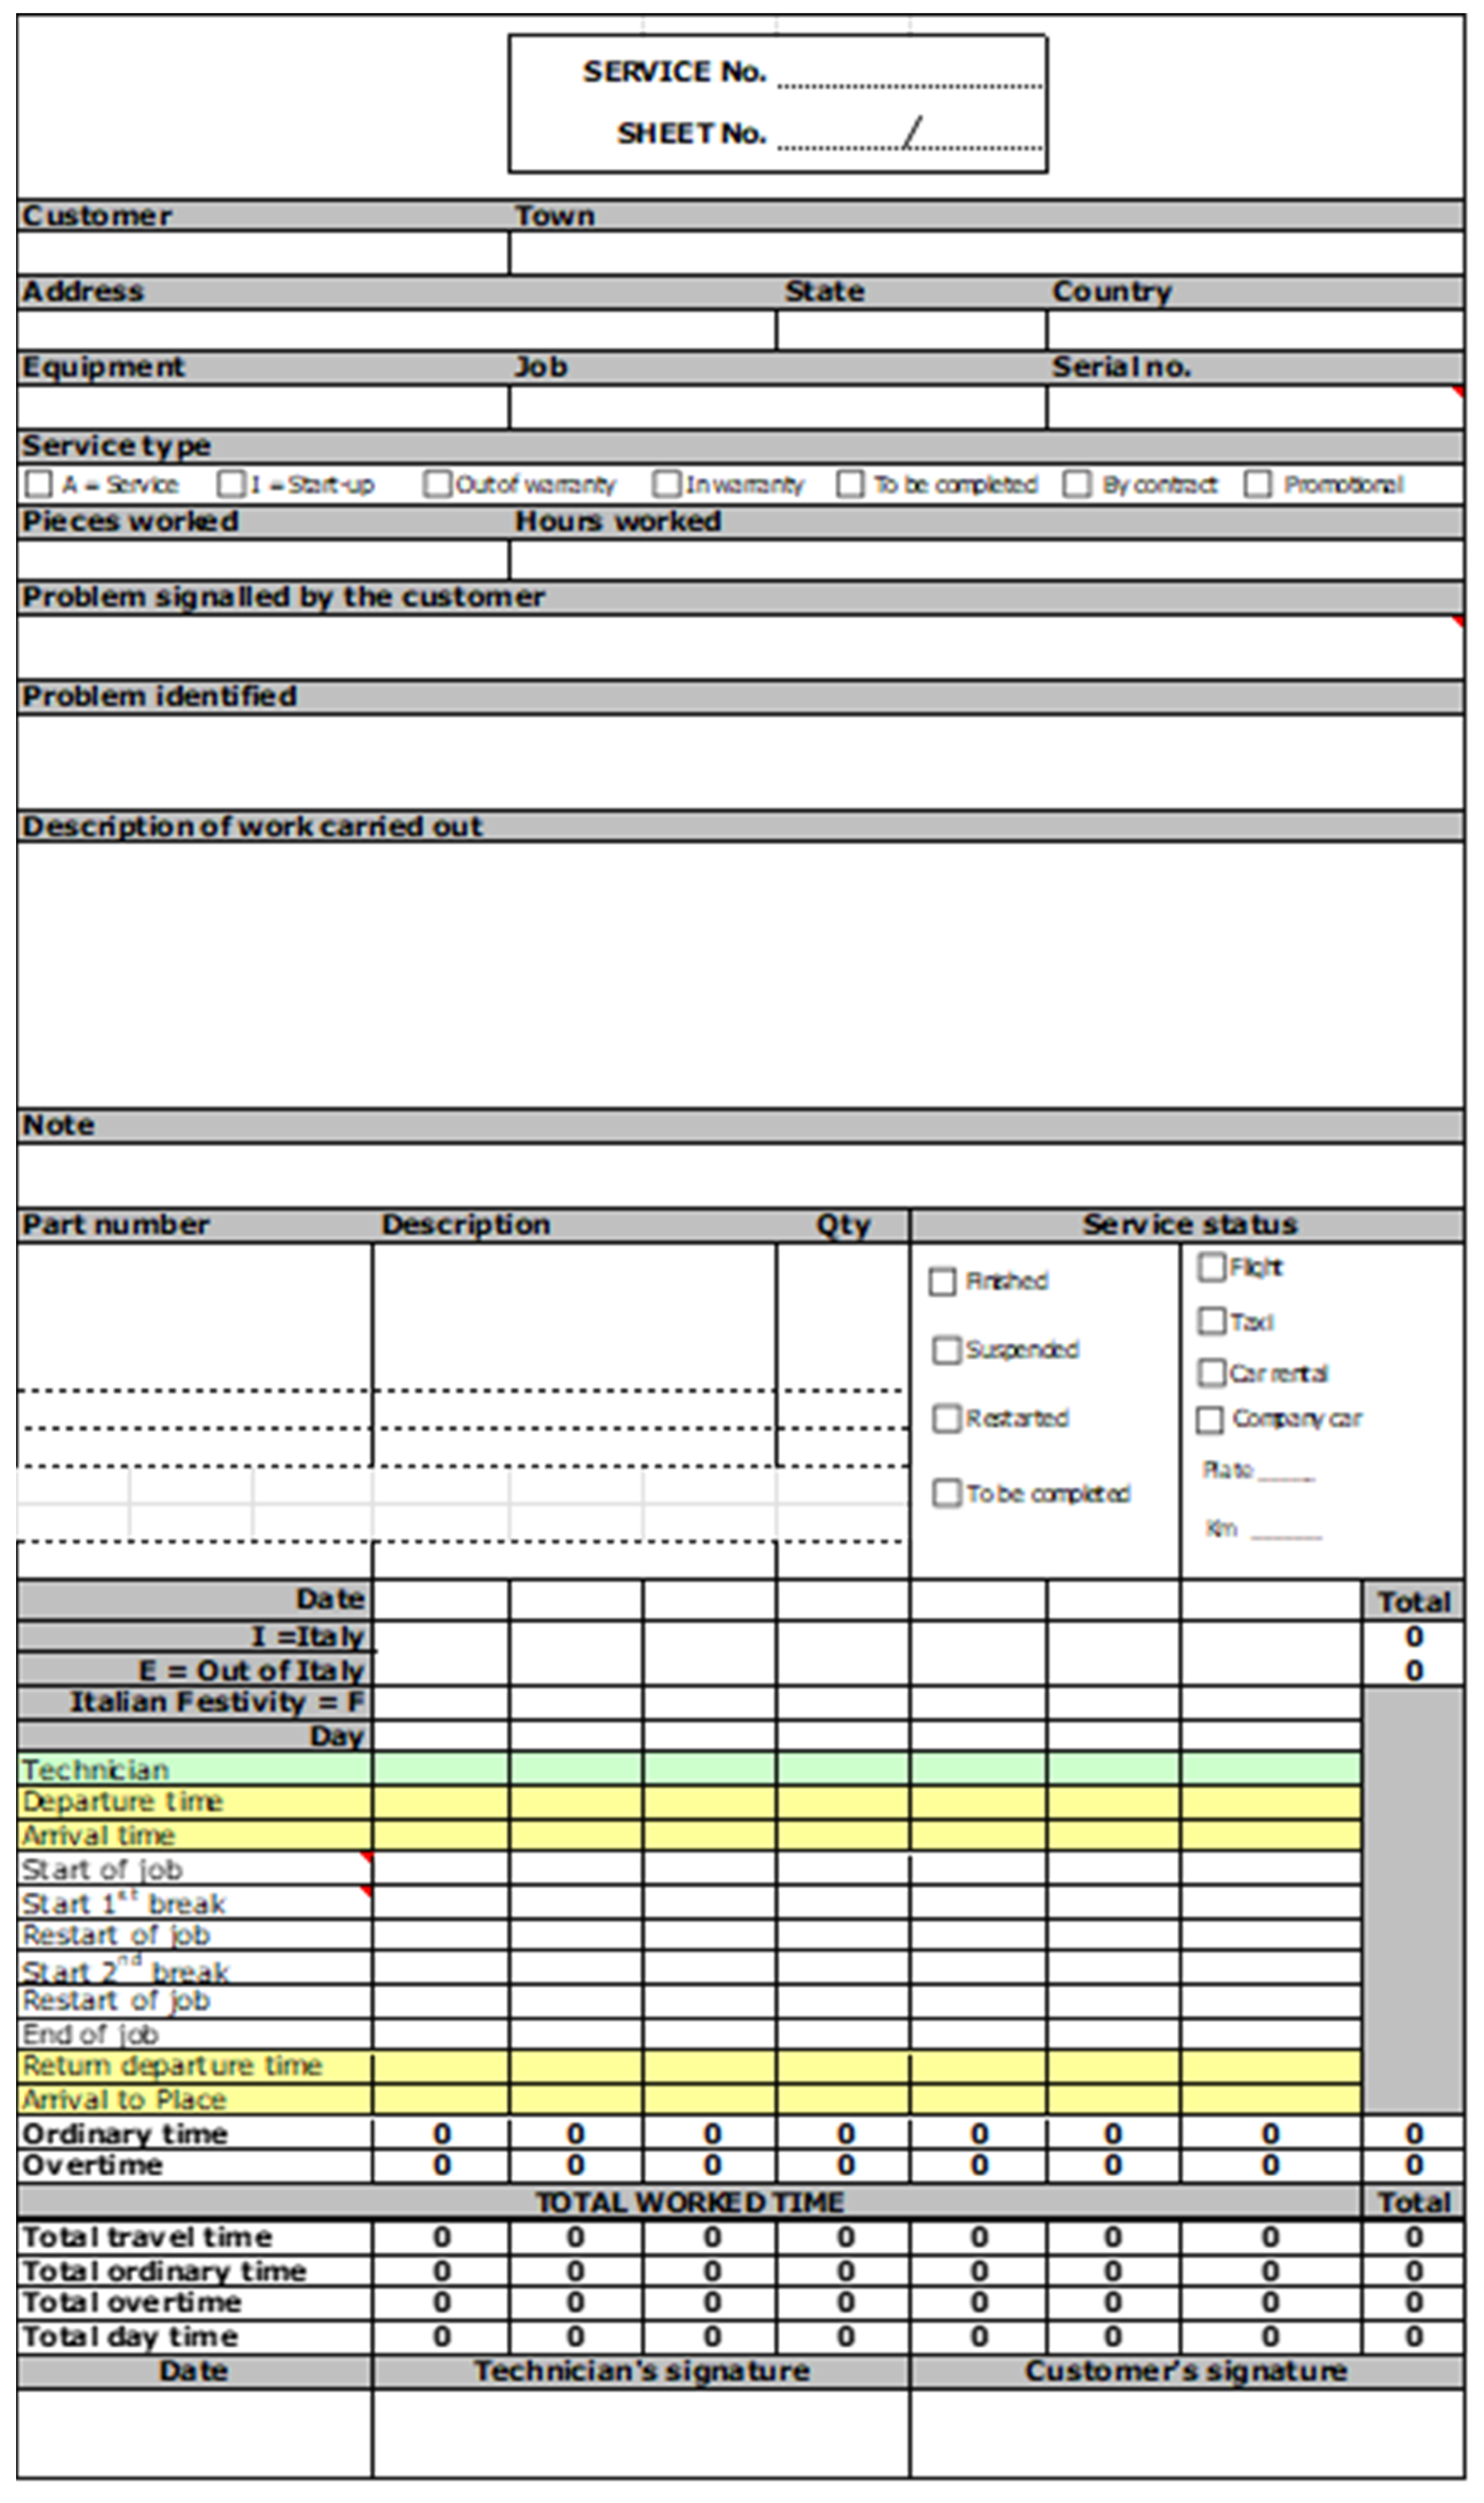
Additionally, Beta decided to adopt Natural Language Processing (NLP) to analyze the free-text fields in the reports. The knowledge reported in the free-text fields could be used to infer correlations between a failure and its cause (e.g., the bad behavior of component X may cause the failure of component Y), as well as depict important hints for its resolution. With the introduction of NLP on top of the traditional analyses (extended by the new data collected), Beta can have a better overview of the service performance, understand the most effective resolution approaches (e.g., in terms of resolution time), the technicians most skilled for an intervention, and other information connected to maintenance execution. Figure 2 and Figure 3 show a comparison between the original service report and the new one.
Beta decided to tackle the problem related to the unstructured trial-and-error attempts carried out by technicians to identify the failure, using the knowledge acquired during previous maintenance interventions to define a list of issues and possible solutions. Furthermore, to address the several negotiation cycles at the end of the maintenance delivery process due to the requests for discounts made by customers, Beta, on the one hand, introduced a checklist in the service report to share with the customer all the activities performed, and, on the other hand, it decided to introduce maintenance contracts to allow the customer to know in advance the price of the intervention. The maintenance contracts offered by Beta consisted of pre-established checks and interventions defined in advance and executed at time-fixed intervals. Two types of intervention were provided with the contract. The first typology focused on the general check of the asset(s) status, while the second one required a more profound analysis and a prolonged stop of the asset(s) to fix all the identifiable problems and put in place preventive measures.

5.1.3. Service Data Analysis

In this phase, the service delivery process data analysis previously defined (e.g., NLP, statistical analysis of structured data) were (and are) constantly applied to the data collected to extract new knowledge, monitor service performance, and introduce improvements.

5.2. The Industrial Asset Stream

5.2.1. Critical Components Identification

In the Industrial Asset Stream, the analysis initially focused on studying one of the company’s assets to identify the most critical components and make decisions about the methods and countermeasures to adopt to avoid failures.
The analysis was carried out applying the FMECA methodology [50], which allowed one to decompose the asset into smaller components and associate an RPN with each one, thus defining the criticality of each one. The RPN is usually computed through the multiplication of three values:
  • Severity (S) evaluates the consequences of a failure in terms of costs or time, or other indicators depending on the company’s interest.
  • Occurrence (O) evaluates the probability of occurrence of a failure.
  • Detectability (D) expresses the possibility of detecting a failure happening to the object of analysis.
All these values may be computed based on the experience of the experts or historical data collected by the company. Beta was already using FMECA to identify criticalities in its assets, but only in the design phase. The novelty brought by the D3M framework consisted of using a Dynamic FMECA [51] and periodically updating the RPNs based on the operational and maintenance data of the asset. Indeed, the traditional FMECA, created during the asset design, did not consider the possible misuses of the customer that could lead to unexpected failures. Using the Dynamic FMECA, the company adapted maintenance policies (advised or sold to the customer) to the actual use of the asset, increasing their effectiveness.

5.2.2. Definition of the Strategy for Asset Data Collection and Analysis

Beta used to collect data from the asset without a specific strategy. Before the D3M adoption, analyses were run on the data collected using traditional statistical approaches, without considering the adoption of Machine Learning (ML) algorithms to identify hidden patterns. Considering the outcome of the FMECA, Beta decided to carry out an analysis of the moving belts belonging to one of the axes of the asset by collecting data on the power absorption and current consumption. Beta clarified that a deviation of the power absorption or electricity consumption from the expected might be caused by a wrong tensioning of the belt, and thus, it would be possible to establish a connection between the operational behavior of an asset and its health status. Beta started collecting power absorption data, and current consumption with the belt tensioned in the wrong way to identify the thresholds that determine the asset health status. Beta, following the D3M framework proposal, decided to analyze the data collected with four ML algorithms selected using the Machine Learning Algorithm Selection Model (MLASM), presented in [52] and developed to guide the users in the selection of ML algorithms to be used for data analysis. To perform the selection, the MLASM considers the analysis scope (e.g., learning typology and activity) and the dataset’s characteristics (e.g., data typology, dataset dimension) and proposes a set of algorithms able to deal with these drivers. The algorithms were compared to identify which one could perform better in determining the status of the component under analysis. Table 1 reports the performance of the algorithms that have been compared, showing that, in this case, the Neural Network proved to be the most suitable one. Thus, Beta adopted this algorithm to analyze power absorption and current consumption data from assets to monitor deviations from normal behavior.
Similar analyses for all other critical components of the company assets should be carried out to identify data to collect, algorithms to implement, thresholds for maintenance interventions, etc.

5.2.3. Asset Data Collection

Once the strategy for data collection and analysis was defined, Beta started collecting data from the assets to monitor their health status. For instance, Beta used the results obtained in the previous phase to monitor the status of the belt at the customer’s place and make maintenance decisions based on the outcome of the data processed with the Neural Networks algorithm developed.

5.2.4. Asset Data Analysis

By matching the results of the data analysis with the thresholds previously identified, Beta was able to determine the health status of the asset. The algorithms and the thresholds will change according to the asset under analysis in the future. In this way, Beta increased the reliability of the decisions, making it possible to intercept, in a short time, deviations from the normal behavior and intervene. In addition, the FMECA of the assets can be updated, with a defined frequency, based on operational and maintenance-related data.

5.3. The Maintenance Service Delivery Stream

5.3.1. Cross Analysis

An optimization model, customized to Beta’s necessities, was developed in this phase. The need for such a solution stemmed from three factors:
  • too long time required to execute the scheduling,
  • the necessity to involve two resources (i.e., an administrative employee and a technician) in the scheduling process: the administrative employee used to have skills in travel organization but not on technical problems and, therefore, the presence of a technician was always required
  • suboptimal results achieved by Beta in carrying out maintenance scheduling in the original setting (e.g., intervention length wrongly esteemed and guided only by the human experience), affecting at business level Beta, who had to pay penalties for each intervention executed not respecting contractual clauses (e.g., intervention granted to be executed before a certain due date).
Beta classified technicians into two categories: the ones able to deal with all the failures (mechanical and electronic) and the ones only able to deal with the electronic ones. The technicians’ allocation task was not structured: if a technician who worked on the asset in the past was unable to intervene, the first one available was assigned to the request, even if not with the required competencies. In such a case, another technician, unable to travel, supported the selected technician remotely.
The optimization model development was based on the idea that allocating the interventions to skilled technicians would result in a better, shorter execution of the intervention, and improved management of the resources.
Following the analysis of historical service reports, two databases were created:
  • A database summarizing the typology of interventions usually executed by the technicians of Beta with the average execution time.
  • A database containing the skills required to execute the intervention according to the resolution typology (e.g., remote, on-field).
These databases should be constantly updated with new data and are used to feed the optimization model and match the intervention to be executed with the technician of Beta and the best resolution strategy (e.g., skills required, resolution approach, the technician assigned). Additionally, for Beta, they can be used to establish skill-based improvement plans for the technicians, allowing them to cover gaps and widen competencies. Since costs cover an important part of the decision-making process in the model, the objective function minimizes the total costs (e.g., intervention, travel, and penalty). Moreover, the new model overcomes one of the main limitations of the previous one by allocating multiple interventions in the same window (i.e., the time periods where a technician is free and, thus, available to execute it also considering the traveling time).
The notation in the following was used to model the problem discussed hereabove:
  • R: the set of intervention requests received by Beta.
  • M r : the set of modes that can be used to fulfill the intervention request r R .
  • T: the set of available technicians.
  • S: the set of skills required by mode m M r .
  • W: the set of windows available for each technician. Each window delimitates the period where the technician is available to execute the intervention.
The problem desired to be modeled consisted in assigning an intervention request r R to be executed in a specific mode m M r to a specific window w   W , associated with a single technician t T simultaneously minimizing the number of tardy jobs executed. Other assumptions that characterized the model:
  • Each technician t T owns a set of skills that define its competencies and the intervention modes they can execute. Skillsets influence the technician’s ability to deal with certain requests, resolution typologies (e.g., on-field vs. remote), and execution length.
  • When allocating the intervention, the technician’s schedule is not blank. There are availability windows for all the technicians.
  • Each time an on-field intervention is performed, the technician leaves from (and returns to) the headquarter before executing the following one. This is a realistic assumption since the technicians need to take the equipment and tools for the next intervention.
The following equations describe the optimization model:
m i n Z = r R , m M r , t T , w W   ( C o t I N T t r m t I N T + C o r m T O P t r m T O P + C o r m S S t r S S ) x r m t w + r R ( p e n a l t y r U r )
s.t.
m M r , t T , w W : θ w m i n w ( t r m t I N T } x r m t w = 1         r   R
C r m M r , t T , w W ( s w + t r m t I N T + m a x ( t r m T O P ; t r S S ) )         r R
C r m M r , t T , w W ( e w t r m T O P )         r R
r R , m M r , t T ( t r m t I N T + t r m T O P 2 ) x r m t w θ w         w W
x r m t w M r m s S ( δ r m s ω m t s )         r R , m M r , t T , w W
C r D D r + b i g M U r         r R
U r 0 , 1
x r m t w 0 , 1         r R , m M r , t T , w W
C r 0         r   R
The objective function (1) minimizes the value Z, which represents the total cost of the interventions considering the hourly technician cost ( C o t I N T ), the time required for the intervention ( t r m t I N T ), the travel cost for the technician ( C o r T O P ), its travel time ( t r m T O P ), the travel cost for the spare parts ( C o r m S S ) with their travel time ( t r S S ) (when needed) and the penalty cost ( p e n a l t y r ) due to the tardy interventions ( U r ). Such an objective is relevant in the considered case because it minimizes the cost to execute the maintenance service and the costs that must be paid due to the late resolution of the customer problems. In this modeling, the penalty cost is fully sustained independently from the fact that the intervention began before the due date and finishes after or that it starts already after the due date expiration.
Constraint set (2) stipulates that each intervention request ( x r m t w ) is allocated exactly once.
Constraint sets (3) and (4) define the completion time ( C r ) of the intervention executed through the mode m M r , assuring that the intervention starts after the beginning of the availability window ( s w ) and concludes before its end ( e w ), leaving the technician the time to execute the intervention ( t r m t I N T ) and travel back to the headquarter ( t r m T O P ).
Constraint set (5) verifies that, if multiple interventions ( x r m t w ) are allocated to the same window w   W , then the technician t   T has enough time ( θ w = e w s w ) to go back and forth from the headquarter ( t r m T O P 2 ) in all the cases and execute all the interventions ( t r m t I N T ).
Constraint set (6) defines the match between technician and intervention mode based on the skills required (by the mode— M r m ) and owned (by the technician— δ r m s ω m t s ).
Constraint set (7) introduces the decision variable U r that assumes the value U r = 1 only if the intervention is tardy, which means that completion time ( C r ) is higher than the due date ( D D r ), otherwise U r = 0 , which means that the intervention satisfied the condition of being completed before the due date ( C r   D D r ). The parameter ( b i g M ) allows keeping the constraints satisfied in any condition.
Finally, constraint sets from (8) to (10) define the domains of the variables.
The application of the optimization model is set to reduce the time required to perform the intervention allocation saving the resources’ time for other tasks. The benefits of implementing the optimization model could be evaluated through a set of KPIs.

5.3.2. Service Delivery Decision

In the new setting, based on the outcome of the previous phase, the planner had to confirm the schedule proposed by the optimization model or change it according to new information emerging or external constraints that may vary the proposed schedule. The optimization model could be run using as input one intervention request at a time or with batches of requests. Thanks to the enhancements described in the previous section, the model allowed one to allocate multiple interventions in the same availability window, facilitating the definition of the final schedule.
It is important passively to underline that the planner still plays a fundamental role in this phase and is not required to accept the model proposal. For instance, the planner must prioritize the execution of the interventions allocated by the model in the same window (e.g., because they have the same due date and, thus, a clear priority cannot be established). At the moment, the model is not able to reschedule interventions. Due to this, when problems in the schedule emerge or the planner is not satisfied with the output, the planner is required to execute a manual setup, moving one or more interventions from the list of the ones already scheduled to the list of the ones to be scheduled. By doing so, the model can execute the reschedule and optimize the maintenance calendar according to the new requests and context. Of course, before confirming moving a scheduled intervention to a new date, it is necessary to have the customer’s agreement.

5.3.3. Collection of Service and Asset Data during Maintenance

This phase saw the adoption of the new service report developed following the analysis described in Section 5.1.2.

6. Discussion

The case study allowed one to show how the maintenance service delivery process of a manufacturing company could be re-engineered thanks to the introduction of a systematic approach aimed at improving the data collection and utilization in support of the decision-making.
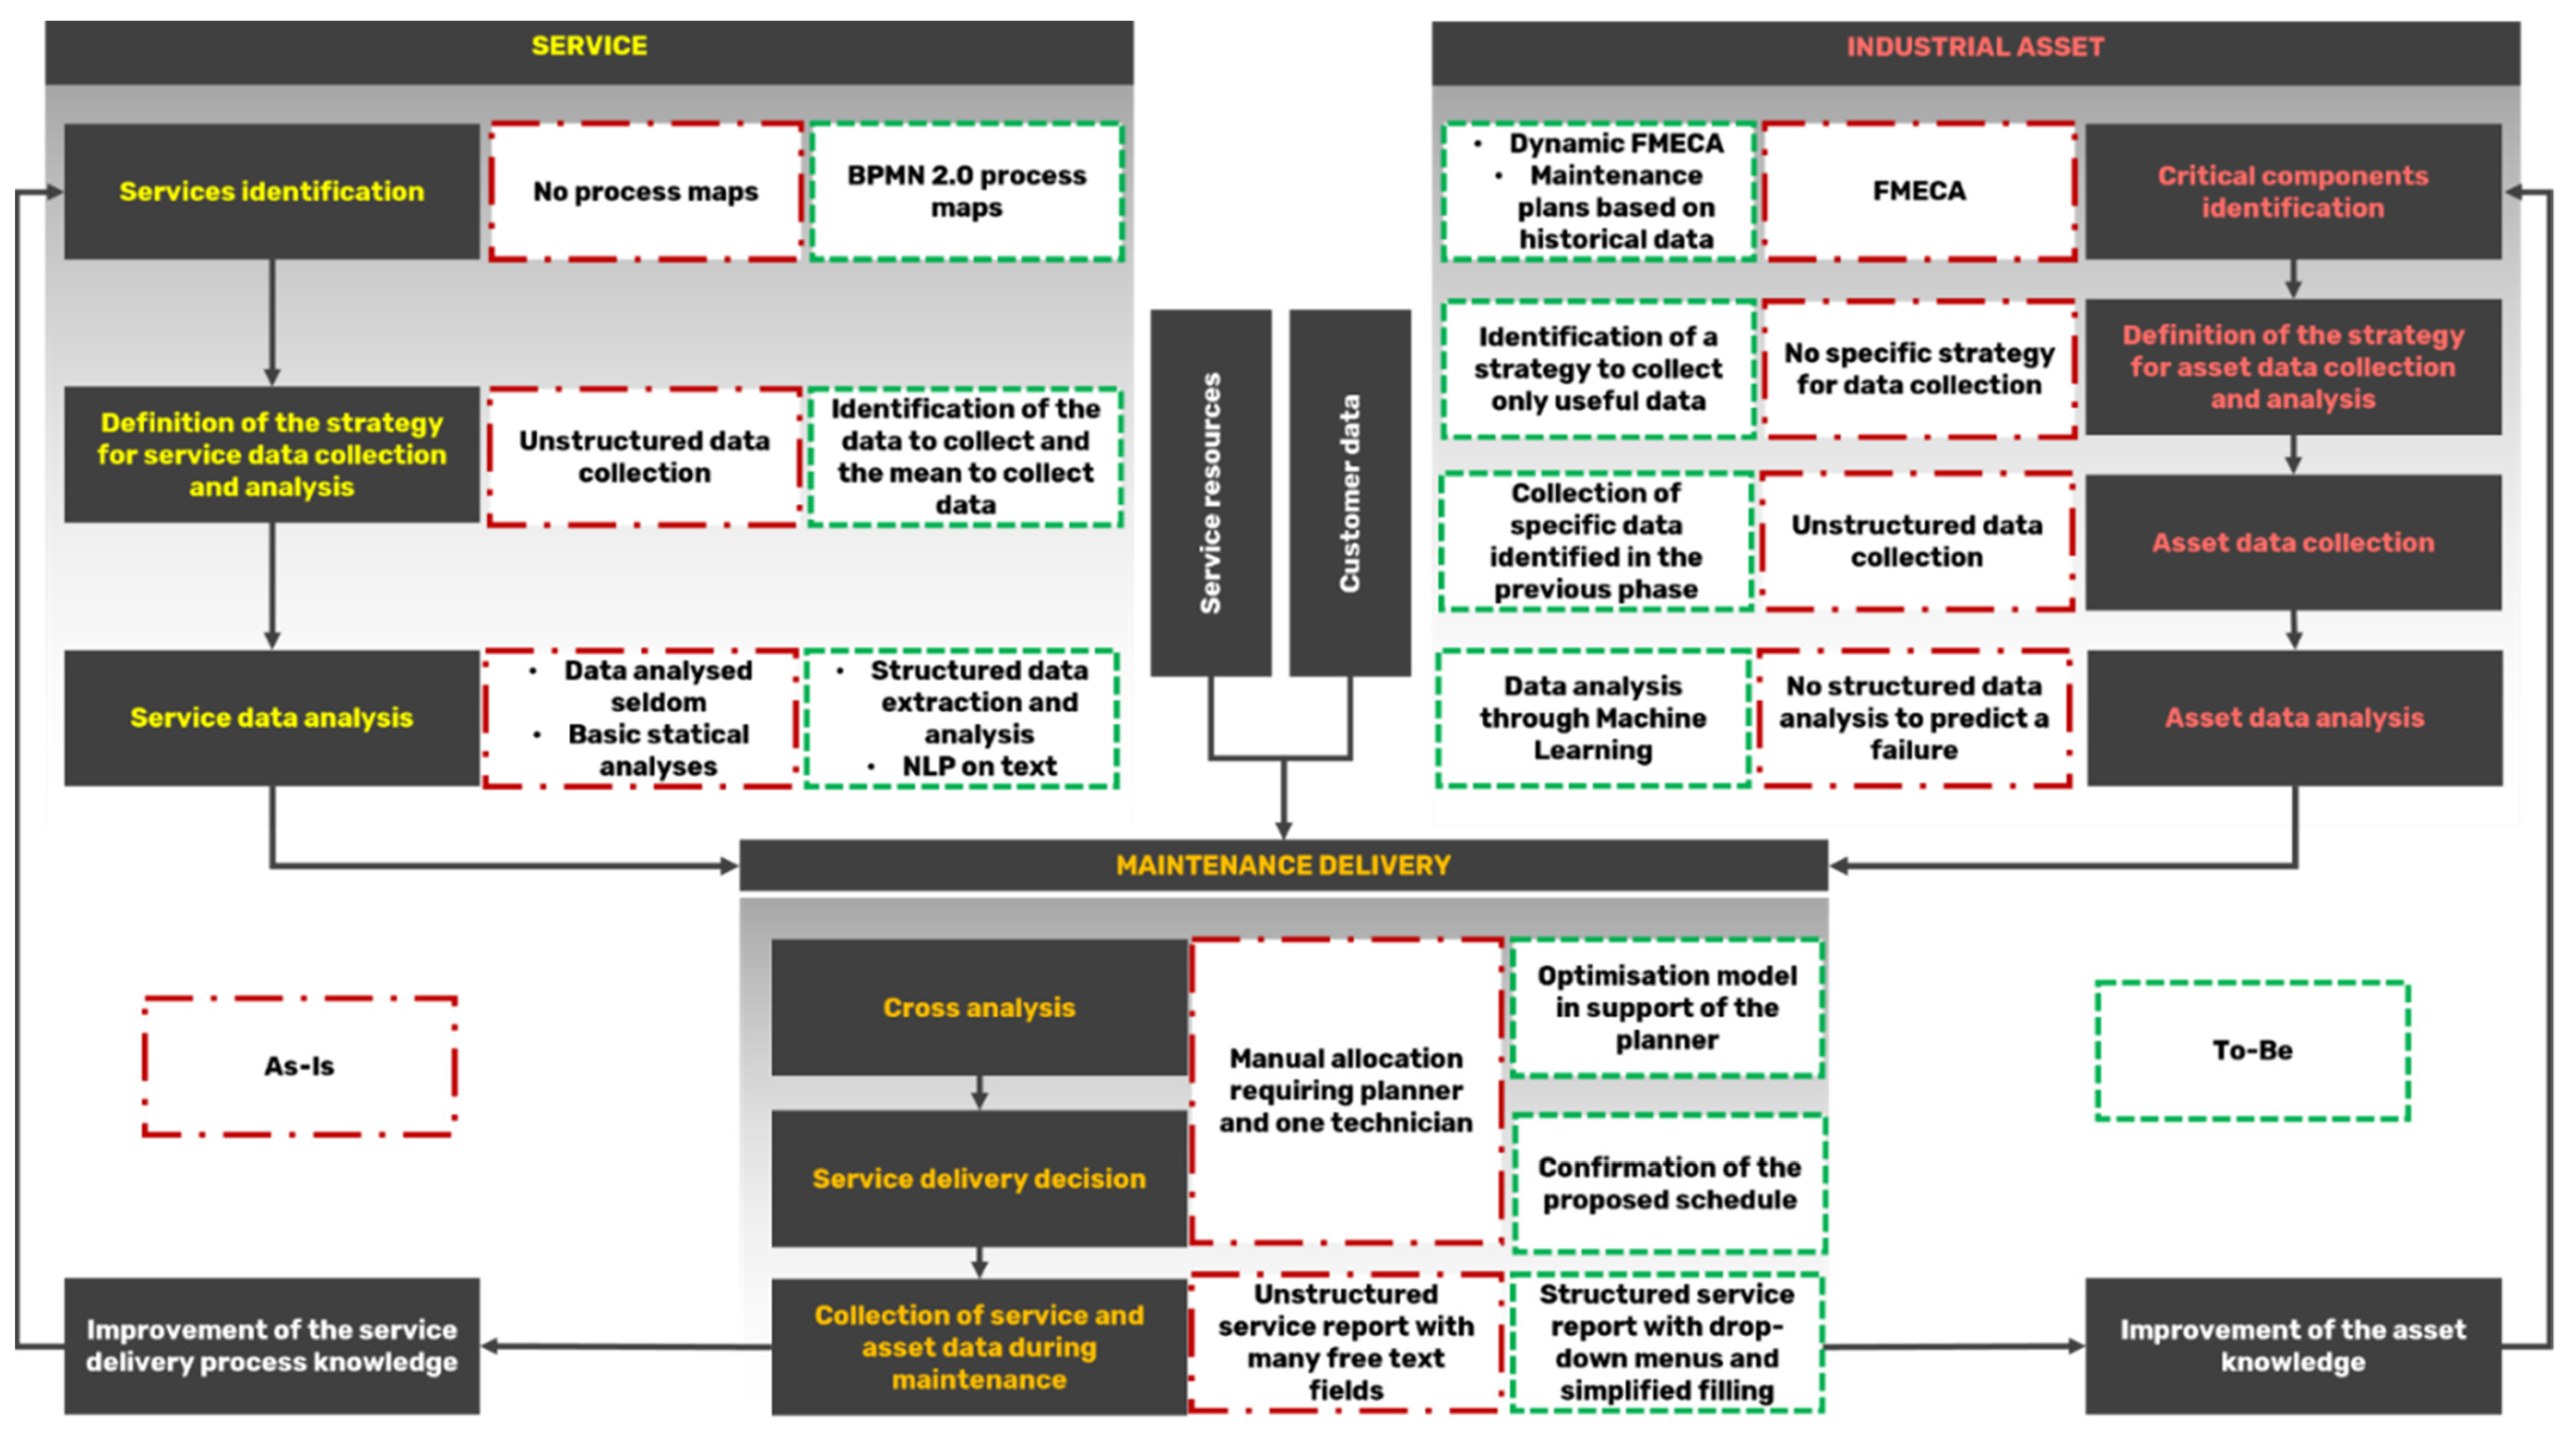
Through the D3M framework, companies will be able to identify their weaknesses and define improvement plans based on increased knowledge of the assets and the maintenance service delivery process. Figure 4 uses the D3M framework as a canvas to compare the Beta maintenance service delivery process management before and after the implementation of the framework, highlighting the shift from a complete experience-based approach toward more data-driven decision-making.

6.1. Benefits of the D3M Framework Introduction

While the D3M framework and the methods are mainly focused on the exploitation of data to support operational decision-making, the aggregated information could be used to make decisions at the strategical (e.g., dimensioning the service resources) and tactical (e.g., update the maintenance policies) levels, thus shifting the perspective from short-term towards medium- and long-term impact. Indeed, the D3M framework aims at favoring dialogue among the departments involved in the PSS delivery (e.g., service and asset design) to create new knowledge that Beta used to improve the asset and the service, change the maintenance policy previously associated with them, deciding to acquire new internal skills (e.g., both in terms of maintenance execution and data management for decision-making), defining new spare parts refilling policies, and proposing new services tailored to the customer needs (e.g., training).
In terms of assets, the new knowledge allowed Beta to improve management of the asset stream (e.g., to design or redesign components, update maintenance policies through the dynamic FMECA), strengthen the preventive maintenance offering, and reduce the corrective interventions.
Another aspect that could be considered is the increased awareness that the company had of its capability to manage and respond promptly to maintenance requests, which was used to define the details of the maintenance contracts with the customers. Following the D3M framework implementation, Beta gained knowledge on the number, length, content, and frequency of the interventions, and this, in combination with the adoption of the optimization model, led to an improved schedule of the maintenance activities. The analysis of the intervention executed also contributed to better defining the instruments required for the execution of each intervention typology as well as, in the future, defining the most efficient and effective countermeasures for each failure in terms of execution time and procedure. By analyzing the maintenance execution procedures and timing, skill-based improvement plans for the technicians were defined, allowing them to cover their gaps and making them more efficient.
Regarding the intervention planning, in the medium term, Beta expects benefits in terms of the time required to schedule an intervention between 10–15%. Such reduction would affect the downtime (DT) of the asset (10–15%) and the Mean Time To Repair (MTTR) (10–15%), which can benefit from both a prompt allocation of the request and from the selection of skilled technicians to execute it.
Such improvements would also be connected to reducing the number of corrective interventions (also due to the update of the maintenance policies) and reducing penalties paid for contractual clauses not respected (e.g., interventions executed after the contractual due date) by around 5–10%. This will also positively impact the number of preventive contracts subscribed by customers, availability of the assets, and others.
The analysis of the spare part used during the intervention contributed to better defining the stocking policies as well as their consumption rates, which, in the future, will allow one to also achieve benefits in terms of sustainability (both in economic and environmental terms).
Furthermore, the data analysis opens new business opportunities (e.g., offering tailored services). In this case, the analysis of data from previous interventions allowed the company to offer tailored maintenance programs and contracts to customers, as well as training programs allowing them to use the assets better increasing not only productivity but also reducing unexpected failures.

6.2. Possible Barriers to the D3M Framework Introduction

The introduction of the D3M framework is not trivial and requires the involvement of personnel with proper skills for data management and decision-making. The readiness and interests of the company should be evaluated to adapt the D3M framework proposal and establish an implementation plan. In fact, in some cases, the full implementation of the D3M framework might require a profound reorganization involving many processes from various departments. In addition, it would require the availability of an infrastructure able to collect and transfer all the necessary data, which is not always available.
Another limit might be related to the partial implementation of the D3M framework, which may lead one to focus only on a specific stream (e.g., a company may be only interested in improving one of the streams or one specific phase), which may have effects on the benefits achievable.
In addition, sharing data with another company may be harmful for privacy reasons (e.g., the volume of production must remain secret) or the allocation of the maintenance costs (e.g., the responsibility for the failure of a component). In this sense, the benefits deriving from applying the D3M framework may be reduced if too many constraints limit data sharing.

7. Conclusions

The D3M framework proposes a data-driven process supporting the decision-making of maintenance service while generating new knowledge to be shared and reused inside the company for improvement purposes. A longitudinal case study set in an Italian manufacturing company demonstrated the advantage of adopting the D3M framework. The paper demonstrated how the process of Beta improved in terms of structure, methods, and decision-making, showing how Beta’s processes were reshaped for the new approach.
From a practical point of view, the case study presented in the paper allowed touching upon various aspects required by a data-driven transformation considering a process perspective. Specifically, discussions related to the kind of data to collect, manage, and analyze were carried out, allowing for evaluation of each improvement step, and selecting the proper instrument to support the data-driven transition for each phase of the process (i.e., knowing the data initially available, the data that would have been useful to have, and the methods and instruments necessary to collect and analyze the data). In particular, the structure of the process was built in the scope of favoring the information flow between the actors involved in the process, allowing each one to have a complete overview of the operating context and driving decisions based on that. A reflection on how the newly introduced methods would act in the process was carried out, also allowing one to understand how they would support the user and the information to communicate to drive the users’ decisions.
Business implications in terms of benefits and barriers for the introduction of the D3M framework were presented. New opportunities for service offering were identified as well as barriers and limitations deriving from the partial introduction of the D3M framework in the company operations as well as partial availability of the data required, which is a condition related to the willingness of the customers to share data with the provider.
Because of the COVID-19 pandemic, the company started receiving more frequent remote support requests to substitute the on-field interventions. Due to this, this kind of service should be better studied, and its weaknesses identified, so that it would be possible for the company to improve its offering. For instance, the means used to collect data on the field—the service report—may request a redesign to fit the characteristics of remote support interventions, as well as the means to retrieve the knowledge to support such interventions. Future research will go in this direction.

Author Contributions

Conceptualization, R.S., F.P. and G.P.; methodology, R.S. and S.C.; validation, R.S., F.P. and G.P.; formal analysis, R.S.; investigation, R.S.; resources, R.S.; data curation, R.S., F.P. and G.P.; writing—original draft preparation, R.S., F.P., G.P. and S.C.; writing—review and editing, R.S., F.P., G.P. and S.C.; visualization, R.S., F.P. and G.P.; supervision, R.S. and S.C.; project administration, R.S., F.P. and G.P. All authors have read and agreed to the published version of the manuscript.

Funding

This research received no external funding.

Institutional Review Board Statement

Not applicable.

Informed Consent Statement

Not applicable.

Data Availability Statement

Not applicable.

Conflicts of Interest

The authors declare no conflict of interest.

References

  1. Cavalieri, S.; Pezzotta, G. Product–Service Systems Engineering: State of the art and research challenges. Comput. Ind. 2012, 63, 278–288. [Google Scholar] [CrossRef]
  2. Oztemel, E.; Gursev, S. Literature review of Industry 4.0 and related technologies. J. Intell. Manuf. 2020, 31, 127–182. [Google Scholar] [CrossRef]
  3. Wang, X.; Wang, Y.; Tao, F.; Liu, A. New Paradigm of Data-Driven Smart Customisation through Digital Twin. J. Manuf. Syst. 2021, 58, 270–280. [Google Scholar] [CrossRef]
  4. Vassakis, K.; Petrakis, E.; Kopanakis, I. Big Data Analytics: Applications, Prospects and Challenges. In Mobile Big Data. Lecture Notes on Data Engineering and Communications Technologies; Springer: Cham, Switzerland, 2018; Volume 10, pp. 3–20. [Google Scholar]
  5. Zeiler, P.; Bertsche, B. Simulation-Based Risk Management of Product-Service Systems. In Proceedings of the Annual Reliability and Maintainability Symposium, Colorado Springs, CO, USA, 27–30 January 2014; Institute of Electrical and Electronics Engineers Inc.: New York, NY, USA, 2014. [Google Scholar]
  6. Tupa, J.; Simota, J.; Steiner, F. Aspects of Risk Management Implementation for Industry 4.0. Procedia Manuf. 2017, 11, 1223–1230. [Google Scholar] [CrossRef]
  7. Rondini, A.; Tornese, F.; Gnoni, M.G.; Pezzotta, G.; Pinto, R. Hybrid simulation modelling as a supporting tool for sustainable product service systems: A critical analysis. Int. J. Prod. Res. 2017, 55, 6932–6945. [Google Scholar] [CrossRef]
  8. Liu, X.; Deng, Q.; Gong, G.; Lv, M.; Jiang, C. Service-oriented collaboration framework based on cloud platform and critical factors identification. J. Manuf. Syst. 2021, 61, 183–195. [Google Scholar] [CrossRef]
  9. Karki, B.R.; Porras, J. Digitalization for sustainable maintenance services: A systematic literature review. Digit. Bus. 2021, 1, 100011. [Google Scholar] [CrossRef]
  10. Sala, R.; Bertoni, M.; Pirola, F.; Pezzotta, G. Data-based decision-making in maintenance service delivery: The D3M framework. J. Manuf. Technol. Manag. 2021, 32, 122–141. [Google Scholar] [CrossRef]
  11. Chiu, M.-C.; Tsai, C.-H. Design a personalised product service system utilising a multi-agent system. Adv. Eng. Inform. 2020, 43, 101036. [Google Scholar] [CrossRef]
  12. Gebauer, H.; Fleisch, E.; Friedli, T. Overcoming the Service Paradox in Manufacturing Companies. Eur. Manag. J. 2005, 23, 14–26. [Google Scholar] [CrossRef]
  13. Suh, E.S. Product Service System Availability Improvement through Field Repair Kit Optimization: A Case Study. Appl. Sci. 2019, 9, 4272. [Google Scholar] [CrossRef] [Green Version]
  14. Wiesner, S.; Freitag, M.; Westphal, I.; Thoben, K.-D. Interactions between Service and Product Lifecycle Management. Procedia CIRP 2015, 30, 36–41. [Google Scholar] [CrossRef]
  15. Khan, M.A.; West, S.; Wuest, T. Midlife upgrade of capital equipment: A servitization-enabled, value-adding alternative to traditional equipment replacement strategies. CIRP J. Manuf. Sci. Technol. 2020, 29, 232–244. [Google Scholar] [CrossRef]
  16. Ardolino, M.; Rapaccini, M.; Saccani, N.; Gaiardelli, P.; Crespi, G.; Ruggeri, C. The role of digital technologies for the service transformation of industrial companies. Int. J. Prod. Res. 2017, 56, 2116–2132. [Google Scholar] [CrossRef]
  17. Barravecchia, F.; Franceschini, F.; Mastrogiacomo, L.; Zaki, M. Research on product-service systems: Topic landscape and future trends. J. Manuf. Technol. Manag. 2021, 32, 208–238. [Google Scholar] [CrossRef]
  18. Åkerman, M.; Lundgren, C.; Bärring, M.; Folkesson, M.; Berggren, V.; Stahre, J.; Engström, U.; Friis, M. Challenges Building a Data Value Chain to Enable Data-Driven Decisions: A Predictive Maintenance Case in 5G-Enabled Manufacturing. Procedia Manuf. 2018, 17, 411–418. [Google Scholar] [CrossRef]
  19. Chang, F.; Zhou, G.; Zhang, C.; Xiao, Z.; Wang, C. A service-oriented dynamic multi-level maintenance grouping strategy based on prediction information of multi-component systems. J. Manuf. Syst. 2019, 53, 49–61. [Google Scholar] [CrossRef]
  20. Carvalho, T.P.; Soares, F.A.A.M.N.; Vita, R.; Francisco, R.D.P.; Basto, J.P.; Alcalá, S.G.S. A systematic literature review of machine learning methods applied to predictive maintenance. Comput. Ind. Eng. 2019, 137, 106024. [Google Scholar] [CrossRef]
  21. Pollak, A.; Temich, S.; Ptasiński, W.; Kucharczyk, J.; Gąsiorek, D. Prediction of Belt Drive Faults in Case of Predictive Maintenance in Industry 4.0 Platform. Appl. Sci. 2021, 11, 10307. [Google Scholar] [CrossRef]
  22. Celen, M.; Djurdjanovic, D. Operation-dependent maintenance scheduling in flexible manufacturing systems. CIRP J. Manuf. Sci. Technol. 2012, 5, 296–308. [Google Scholar] [CrossRef]
  23. Hajej, Z.; Nyoungue, A.C.; Abubakar, A.S.; Ali, K.M. An Integrated Model of Production, Maintenance, and Quality Control with Statistical Process Control Chart of a Supply Chain. Appl. Sci. 2021, 11, 4192. [Google Scholar] [CrossRef]
  24. Turner, C.; Okorie, O.; Emmanouilidis, C.; Oyekan, J. Circular production and maintenance of automotive parts: An Internet of Things (IoT) data framework and practice review. Comput. Ind. 2022, 136, 103593. [Google Scholar] [CrossRef]
  25. Karim, R.; Westerberg, J.; Galar, D.; Kumar, U. Maintenance Analytics–The New Know in Maintenance. IFAC-PapersOnLine 2016, 49, 214–219. [Google Scholar] [CrossRef]
  26. Jwo, J.-S.; Lin, C.-S.; Lee, C.-H.; Zhang, L.; Huang, S.-M. Intelligent System for Railway Wheelset Press-Fit Inspection Using Deep Learning. Appl. Sci. 2021, 11, 8243. [Google Scholar] [CrossRef]
  27. Bumblauskas, D.; Gemmill, D.; Igou, A.; Anzengruber, J. Smart Maintenance Decision Support Systems (SMDSS) based on corporate big data analytics. Expert Syst. Appl. 2017, 90, 303–317. [Google Scholar] [CrossRef]
  28. Mahlamäki, K.; Niemi, A.; Jokinen, J.; Borgman, J. Importance of Maintenance Data Quality in Extended Warranty Simulation. Int. J. COMADEM 2016, 19, 3–10. [Google Scholar]
  29. Ajaegbu, A.; Uren, V.; Schroeder, A. A Capability-Based Framework of Utilising Data-in-Use to Create Business Value in Integrated Solutions, Advanced Service, or PSS. In Proceedings of the EurOMA Conference 2020, Warwick, UK, 29–30 June 2020. [Google Scholar]
  30. Lu, Y.; Li, Y. A novel data-driven method for maintenance prioritization of circuit breakers based on the ranking SVM. Int. J. Electr. Power Energy Syst. 2021, 129, 106779. [Google Scholar] [CrossRef]
  31. Antomarioni, S.; Ciarapica, F.E.; Bevilacqua, M. Data-driven approach to predict the sequence of component failures: A framework and a case study on a process industry. Int. J. Qual. Reliab. Manag. 2022. [Google Scholar] [CrossRef]
  32. He, L.; Guo, W.; Jiang, P. A decision-making model for knowledge collaboration and reuse through scientific workflow. Adv. Eng. Inform. 2021, 49, 101345. [Google Scholar] [CrossRef]
  33. Gopalakrishnan, M.; Bokrantz, J.; Ylipää, T.; Skoogh, A. Planning of Maintenance Activities–A Current State Mapping in Industry. Procedia CIRP 2015, 30, 480–485. [Google Scholar] [CrossRef] [Green Version]
  34. Oluyisola, O.E.; Bhalla, S.; Sgarbossa, F.; Strandhagen, J.O. Designing and developing smart production planning and control systems in the industry 4.0 era: A methodology and case study. J. Intell. Manuf. 2021, 33, 311–332. [Google Scholar] [CrossRef]
  35. Dong, C.-S.J.; Srinivasan, A. Agent-enabled service-oriented decision support systems. Decis. Support Syst. 2013, 55, 364–373. [Google Scholar] [CrossRef]
  36. Power, D.J. Specifying An Expanded Framework for Classifying and DescribingDecision Support Systems. Commun. Assoc. Inf. Syst. 2004, 13, 13. [Google Scholar] [CrossRef]
  37. Mi, S.; Feng, Y.; Zheng, H.; Wang, Y.; Gao, Y.; Tan, J. Prediction maintenance integrated decision-making approach supported by digital twin-driven cooperative awareness and interconnection framework. J. Manuf. Syst. 2021, 58, 329–345. [Google Scholar] [CrossRef]
  38. Kamsu-Foguem, B.; Wandji, Y.F.; Tchuenté-Foguem, G.; Tchoffa, D. Experienced knowledge for the description of maintenance packages. J. Manuf. Syst. 2015, 37, 448–455. [Google Scholar] [CrossRef] [Green Version]
  39. Belkadi, F.; Boli, N.; Usatorre, L.; Maleki, E.; Alexopoulos, K.; Bernard, A.; Mourtzis, D. A knowledge-based collaborative platform for PSS design and production. CIRP J. Manuf. Sci. Technol. 2020, 29, 220–231. [Google Scholar] [CrossRef]
  40. Magnanini, M.C.; Tolio, T.A. A model-based Digital Twin to support responsive manufacturing systems. CIRP Ann. 2021, 70, 353–356. [Google Scholar] [CrossRef]
  41. Dahmani, S.; Boucher, X.; Peillon, S.; Besombes, B. A reliability diagnosis to support servitization decision-making process. J. Manuf. Technol. Manag. 2016, 27, 502–534. [Google Scholar] [CrossRef]
  42. Erozan, İ. A fuzzy decision support system for managing maintenance activities of critical components in manufacturing systems. J. Manuf. Syst. 2019, 52, 110–120. [Google Scholar] [CrossRef]
  43. Ma, Z.; Ren, Y.; Xiang, X.; Turk, Z. Data-driven decision-making for equipment maintenance. Autom. Constr. 2020, 112, 103103. [Google Scholar] [CrossRef]
  44. Morant, A.; Larsson-Kråik, P.-O.; Kumar, U. Data-driven model for maintenance decision support: A case study of railway signalling systems. Proc. Inst. Mech. Eng. Part F J. Rail Rapid Transit 2014, 230, 220–234. [Google Scholar] [CrossRef] [Green Version]
  45. Gopalakrishnan, M.; Subramaniyan, M.; Skoogh, A. Data-driven machine criticality assessment—Maintenance decision support for increased productivity. Prod. Plan. Control 2020, 33, 1–19. [Google Scholar] [CrossRef]
  46. Yin, R.K. Case Study Research: Design and Methods; Applied Social Research Methods, 4th ed.; SAGE Publications: Thousand Oaks, CA, USA, 2009; ISBN 978-1-4129-6099-1. [Google Scholar]
  47. Leonard-Barton, D. A Dual Methodology for Case Studies: Synergistic Use of a Longitudinal Single Site with Replicated Multiple Sites. Organ. Sci. 1990, 1, 248–266. [Google Scholar] [CrossRef]
  48. Ritchie, J.; Lewis, J.; Nicholls, C.M.; Ormston, R. Qualitative Research Practice: A Guide for Social Science Students and Researchers; SAGE Publications: Thousand Oaks, CA, USA, 2013. [Google Scholar]
  49. Kothari, C.R. Research Methodology: Methods and Techniques, 2nd ed.; New Age International: New Delhi, India, 2004. [Google Scholar]
  50. Chen, Y.; Ye, C.; Liu, B.; Kang, R. Status of FMECA Research and Engineering Application. In Proceedings of the IEEE 2012 Prognostics and System Health Management Conference, Beijing, China, 23–25 May 2012; pp. 1–9. [Google Scholar]
  51. Colli, M.; Sala, R.; Pirola, F.; Pinto, R.; Cavalieri, S.; Wæhrens, B.V. Implementing a dynamic FMECA in the digital transformation era. IFAC-PapersOnLine 2019, 52, 755–760. [Google Scholar] [CrossRef]
  52. Sala, R.; Zambetti, M.; Pirola, F.; Pinto, R. How to Select a Suitable Machine Learning Algorithm: A Feature-Based, Scope-Oriented Selection Framework. In Proceedings of the Summer School Francesco Turco, Palermo, Italy, 12–14 September 2018; pp. 87–93. [Google Scholar]
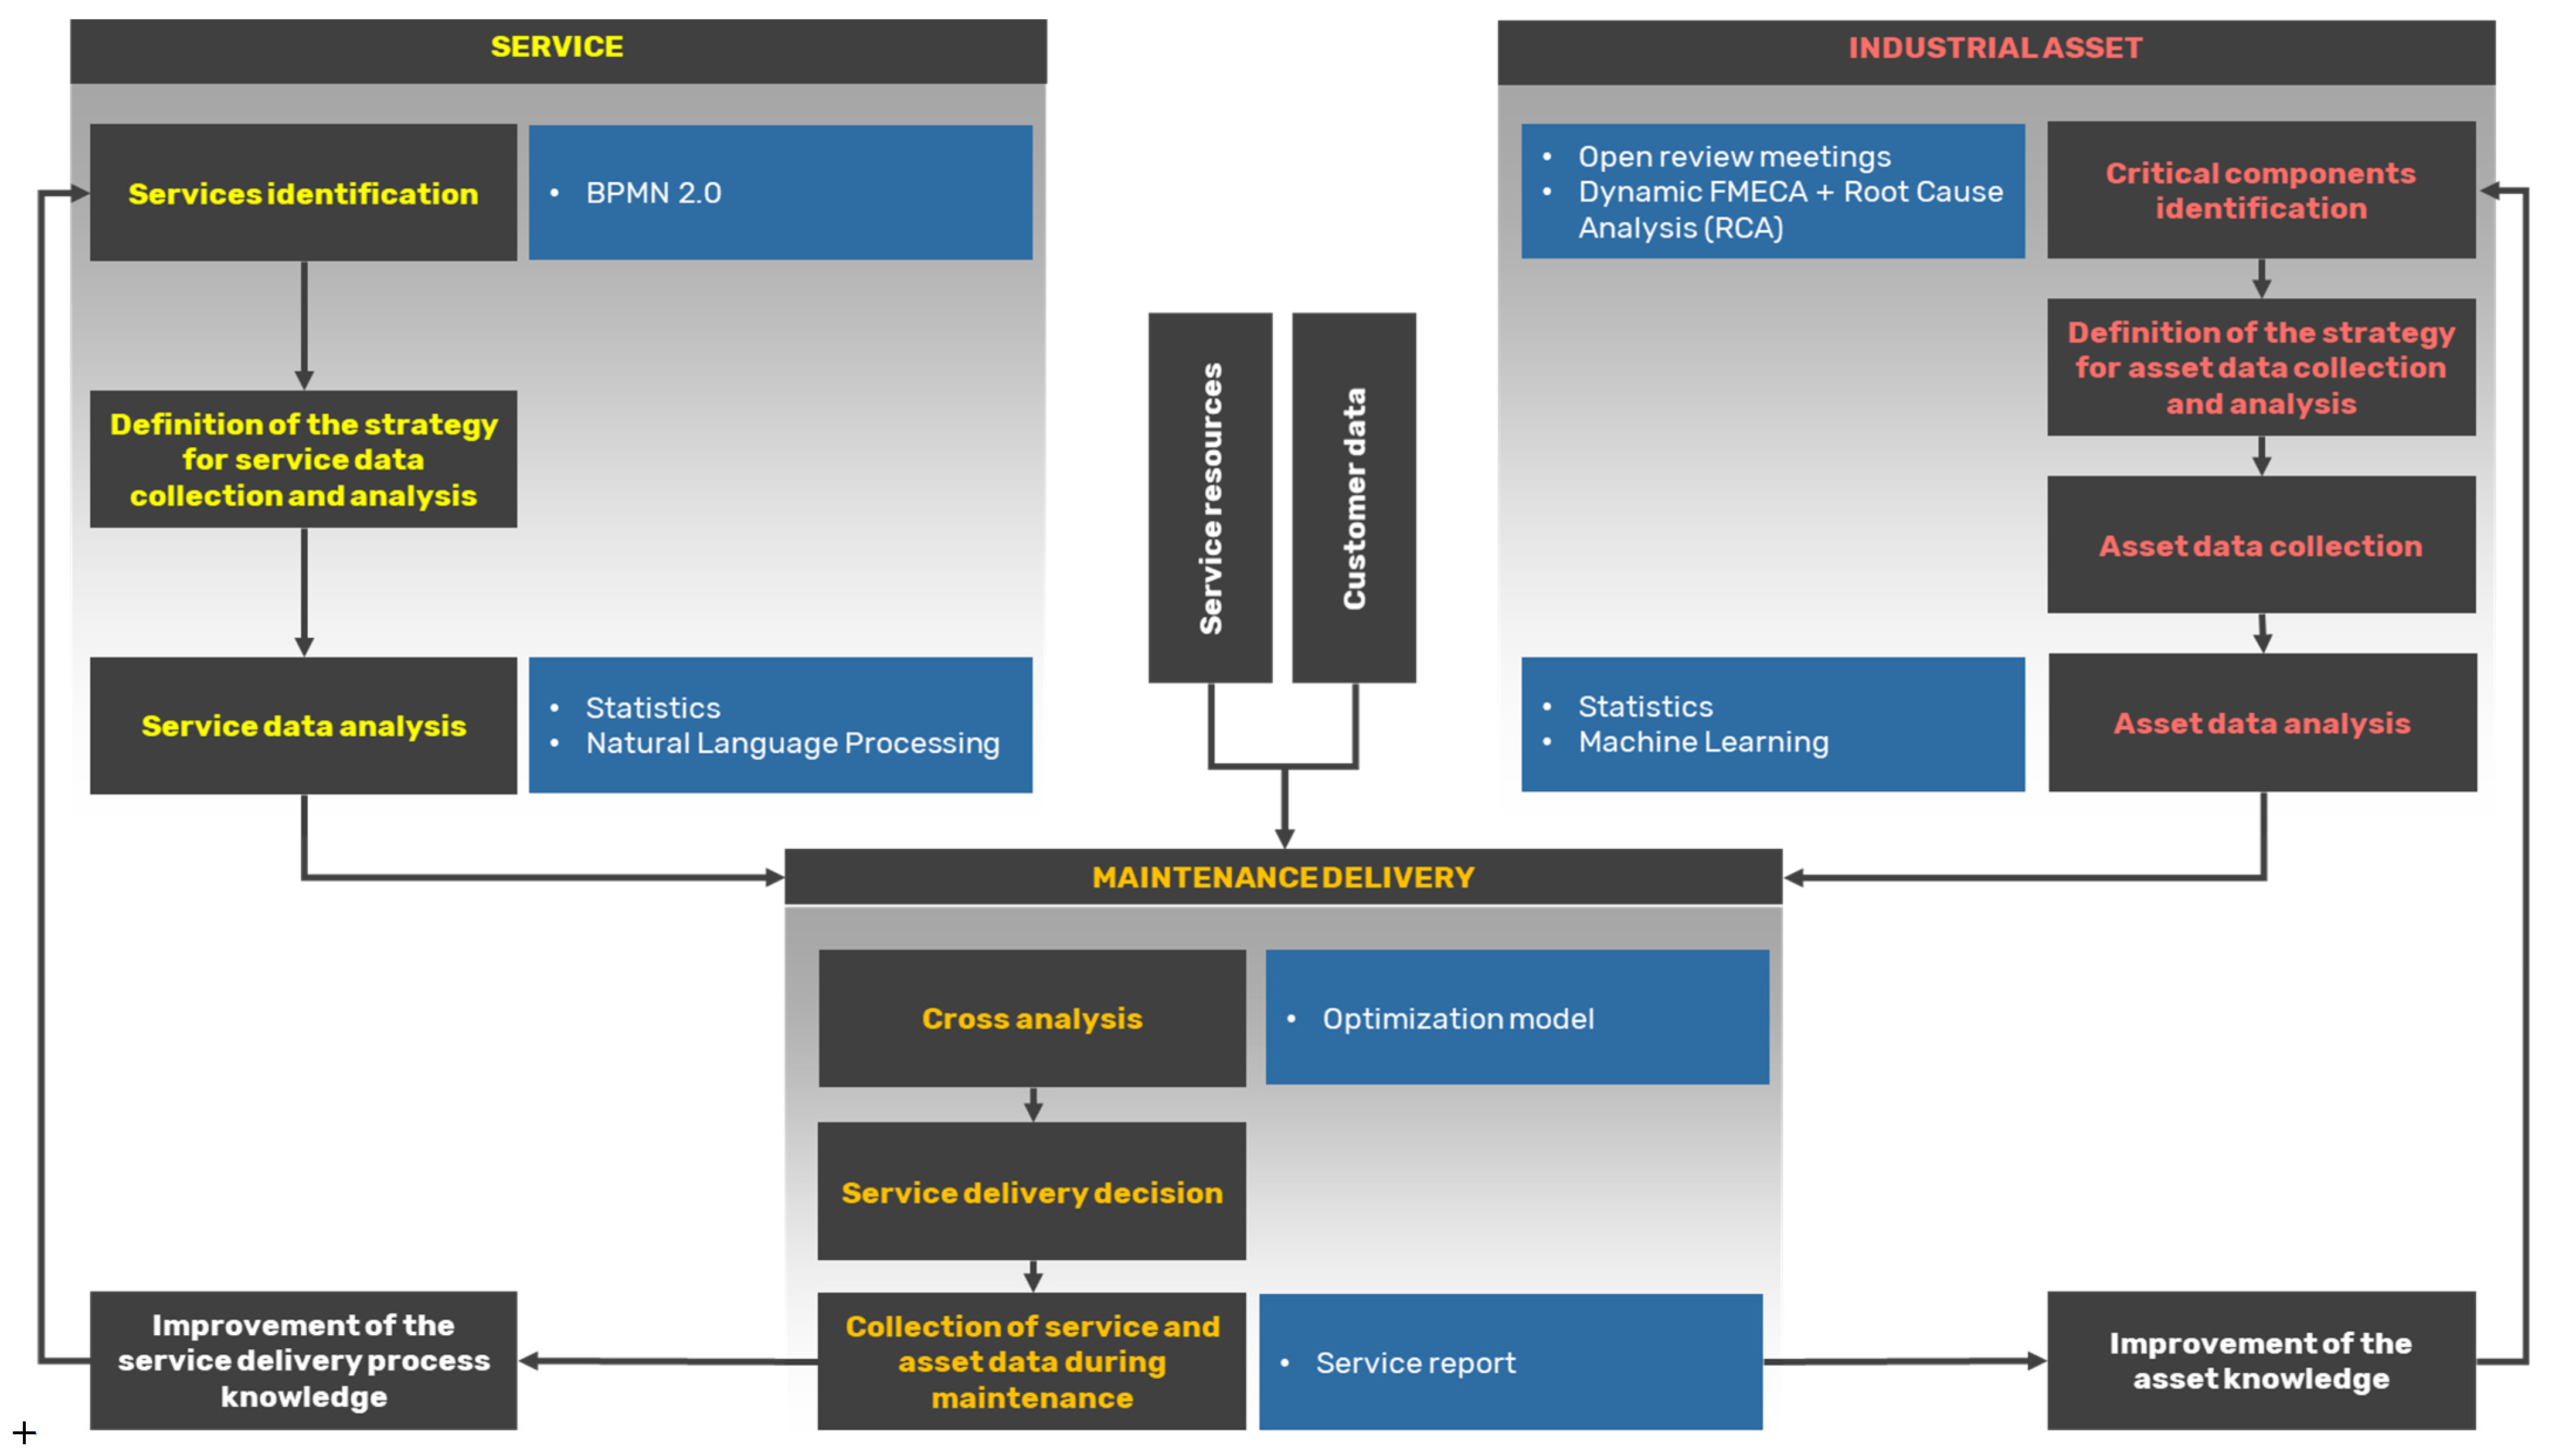
Figure 1. The D3M framework [10].
Applsci 12 07395 g001
Figure 2. The original Service Report. The figure is elaborated by the authors.
Applsci 12 07395 g002
Figure 3. The new service report. Changes are highlighted in green rectangles. The figure is elaborated by the authors.
Applsci 12 07395 g003
Figure 4. Company Beta pre- (red rectangles) and post- (green rectangles) D3M implementation.
Applsci 12 07395 g004
Table 1. Comparison of the models.
K-Nearest NeighborDiscriminant AnalysisNeural NetworkMultinomial Logistic Regression
Training time~6.8 s~1.6 s~0.6 s~0.02 s
Accuracy100%94.1%100%94.1%
Publisher’s Note: MDPI stays neutral with regard to jurisdictional claims in published maps and institutional affiliations.