1. Introduction
The keyword “Industry 4.0” describes a new way of production that is distinguished from others through digitization of working processes and increasing integration and modularization of intelligent machines, products, and resources [
1,
2]. Industry 4.0 was introduced in Germany in 2011, and one of its goals is to merge the physical and digital worlds. This new paradigm enables continuous resource productivity and efficiency gains to be delivered across the entire value network. Today, there is a worldwide trend in some of the most advanced economies seeking to improve productivity and efficiency in industrial manufacturing by incorporating the latest advances in information and communications technology (ICT). Such a trend concerns the adoption of concepts such as the Internet of Things (IoT) and services (IoS), Cyber-Physical Systems (CPS) and human–robot collaboration [
3,
4], Artificial Intelligence [
5], industrial automation, continuous connectivity, cybersecurity, semantic technologies, industrial big data, with the aim of improving the overall performance of the manufacturing systems [
6,
7,
8]. All these technologies allow a remotely sensed, real-time monitoring and control of devices and cyber-physical production elements across network infrastructures and therefore provide a more direct integration and synchronization from the physical to the virtual world [
9,
10]. Large amounts of data are processed, analyzed, and evaluated by simulation and optimization tools in order to be able to make them available for supporting decision makers in an efficient way. In this challenging context, the use of the Digital Model concept is spreading considerably. It “is a digital representation of an existing or planned physical object that does not use any form of automated data exchange between the physical object and the digital object” [
11]. It is different from the Digital Twin (DT), which represents today a very broad concept [
12] and is defined as virtual representation of multiple manufacturing elements such as workforce, processes, assets, and products, which is continuously updated as the physical counterpart changes, with the aim of representing in real-time working conditions and the resources state [
13]. According to Qi and Tao [
14], three main concepts are part of the DT: the process of interaction between the virtual and reality, the virtualization of physical entities, and the materialization of virtual processes.
At the same time, the recent COVID-19 pandemic has highlighted and is highlighting the fragility of the supply chains of various industrial sectors and consequently, of the manufacturing systems [
15]. Basically, in recent years, the scientific community has been intensifying studies on the concept of resilience, with the aim of understanding how to help Industry 4.0-driven ecosystems to be better prepared for possible COVID-like crisis. However, there is still no research work capable of exploiting the potential of Digital Models combined with simulation approaches along the entire lifecycle of a manufacturing system, from its design to the assessment of the impact of disruptive events and the formulation & evaluation of possible response strategies. Therefore, this paper aims to propose and test a simulation-based framework, aimed at: (1) supporting the design of a manufacturing system, (2) evaluating its resilience in the face of unexpected and disruptive events, (3) estimating the goodness of possible response strategies to face COVID-like crises. The usefulness of the proposed framework is proved through a real-life case study in the wood sector.
The remainder of this paper is organized as follows.
Section 2 reviews the literature around the concept of Modeling & Simulation (M&S) and the resilience of manufacturing systems confronted with unexpected and disruptive events. In
Section 3, our simulation-based framework for manufacturing design and resilience assessment is introduced and explained.
Section 4 contains all the information about the case study, while in
Section 5, the experimental campaign is explained in detail. Conclusions and possible future developments are in
Section 6.
2. Literature Review
2.1. Digital Models and Simulation-Based Approaches
The digitalization of manufacturing systems today represents a great opportunity to reach significant levels of productivity and be competitive on the market. In this context, the Digital Twin is one of the most promising paradigms [
16,
17,
18], with applications in several domains such as smart factory control [
19,
20], fault diagnosis [
21], additive manufacturing [
22,
23], production optimization [
24]. As pointed out by Kritzinger et al. [
11], the term Digital Twin, in the sense of “digital counterpart of physical object”, is often used as a synonym of Digital Model and Digital Shadow. Therefore, it is necessary to make a differentiation between these 3 concepts, based on the level of data integration between physical and digital world. The Digital Model does not presuppose any automated exchange of data between physical object and digital object. Then, there is no real-time synchronization. The Digital Shadow, on the other hand, is characterized by an automated one-way data flow from physical object to digital object. Basically, any change in the physical world implies a real-time change in the digital world, not vice versa. Finally, the Digital Twin is characterized by a real-time synchronization between the physical world and the digital world, with an automated exchange of data in both directions [
11]. Through the digitalization of the real world, it is possible to perform simulations, which enable the optimization of the plans in the virtual world, which are then delivered to the real world with high probability of success. Basically, the analysis of different scenarios makes possible the identification of any errors in advance, to avoid their occurrence within the real manufacturing system, minimizing waste and maximizing returns. In this paper, the focus is on the Digital Model concept combined with simulation, following the paradigm of Modeling & Simulation for manufacturing [
25]. There are several successful simulation-based approaches in the literature. Some examples are given below. Terkaj et al. [
26] present an approach where an ontology-based virtual factory is continuously integrated with the real plant. The digital object is used to conduct simulations, aimed at understanding in advance the impact of possible decisions on production and maintenance. Goodall et al. [
27] develop a data-driven simulation approach for remanufacturing operations, characterized by data coming from digital manufacturing systems. In this case, the simulation serves to support improvements in the real system, based on the results obtained in the digital counterpart. Zhou et al. [
28] propose a scheduling method based on dynamic data-driven simulation to improve the performance of a manufacturing system. The designed approach is tested through a case study on numerical control machining in the domain of cloud manufacturing, and the results demonstrate its goodness. The reader is referred to some comprehensive literature reviews for other simulation-driven approaches [
29,
30].
In recent years, the areas of use of Digital Models are becoming more and more widespread, with different connotations. Specifically, the M&S approach can be integrated within a decision support system, which is defined as “a specific class of computerized information system, enabling to manage decision-making activities” [
31]. Neto et al. [
32], through a digital twin architecture, have developed a decision support system with the aim of better scheduling preventive maintenance interventions. Bujari et al. [
33] have adopted a digital replica as a basis for a decision support system, capable of providing improvements in terms of resource optimization in a smart city scenario. Kunath and Winkler [
34] have recently integrated the Digital Twin paradigm into a decision support system to improve the order management process.
2.2. COVID-Like Crises and Manufacturing Resilience
The recent COVID-19 pandemic has impacted and is impacting significantly global supply chains and consequently, the efficiency of manufacturing systems. Recently, scholars have been focusing their attention on the concept of resilience, with the aim of evaluating the readiness of productive ecosystems to respond adequately to disruptive events. The concept of resilience has always been recognized as a critical success factor in manufacturing. Manufacturing resilience can be defined as the ability of an organization to be able to function at the desired level of performance, even in the presence of disruptions and unexpected events such as a pandemic [
35]. Overall, it is possible to distinguish between two types of studies in the literature: (1) some scholars only aim to assess the impact that the pandemic has had on some systems in different sectors (e.g., agri-food, manufacturing, healthcare, etc.), while (2) others propose strategies to try to cope with COVID-like crises. Xu et al. [
36] investigate the impacts of COVID-19 on the responsiveness of global supply chains and show that it is an unprecedented crisis in various sectors, such as pharmaceuticals, food, automotive, etc. Burgos and Ivanov [
37] leverage the Digital Supply Chain Twin concept to examine the impact of the COVID-19 pandemic on food retail supply chains, then to assess their resilience. They also provide insights to improve responsiveness to similar events. The proposed model exploits the benefits of discrete-event simulation. Badhotiya et al. [
38] design an analytical model to assess and improve the resilience of a supply chain in the face of disruptive impacts. The Interpretative Structural Modeling (ISM) is used to analyze the interdependence between several indicators together with the Bayesian Network (BN) approach. Three real-world cases from Indian manufacturing industries are used to demonstrate that the proposed approach can support decision-makers in identifying critical indicators to improve supply chain resilience. Okorie et al. [
39] study the impact of the pandemic in manufacturing through a well-structured survey. They present some important recommendations for ensuring manufacturing capabilities and operations such as building organizational flexibility, using digital technologies, enabling a rapid decision-making, which go in the same direction of this paper.
2.3. Research Gaps and Our Contribution
From our study of the literature, some significant gaps clearly emerge, which need to be filled:
Considering the very recent advent of the SARS-CoV-2 Pandemic, the exploitation of M&S approaches to deal with a COVID-like crisis is still very limited. There are some studies, which are, however, oriented to the digital model of the supply chain rather than of a manufacturing system.
There is no simulation-based decision support framework, which aims to jointly support manufacturing design and simulate the impact that possible disruptions can have on the system, and to evaluate the effectiveness of different response strategies.
Therefore, the main goal of this paper is to propose a simulation-based framework, which has multiple purposes:
to exploit the features and benefits of a Modeling & Simulation approach for supporting decision-making in manufacturing design; in this context, the useful concepts of Design of Experiment (DOE) and Full Factorial Design are adopted to identify the best production configuration, supported by the use of the Minitab tool.
to use the M&S framework, with the aim of evaluating the resilience of a manufacturing system, and therefore, its degree of preparedness in the face of unexpected events, caused by COVID-like crises;
to evaluate the effectiveness of any response strategies, through a multi-scenario approach, with the aim of increasing the readiness of the manufacturing system under study.
The goodness of the proposal is confirmed by its successful application to a real-life case study in the wood sector.
3. Proposed Simulation-Based Framework for Manufacturing Design and Resilience Assessment
As previously mentioned, the main purpose of this study is to use simulation to support the design of a manufacturing plant, evaluating its resilience and possible strategies in the face of disruptive and unexpected events. Design concerns the identification of the most profitable combination of production parameters, considering that the starting point of the decision-maker is a poor knowledge of the domain. To achieve all these objectives, a simulation-based framework is proposed, which is shown in
Figure 1.
Basically, at the beginning, the real manufacturing system is reproduced in a virtual environment in the form of a Digital Model, to carry out all the experiments and analyze the benefits and drawbacks of multiple application scenarios. However, once the production system has been designed and put into operation, this framework can continue to be used as a monitoring and control tool. This is because the tool has a cyclic structure. More precisely, the meaning of the various blocks is explained below:
Real Word represents the set of machinery and equipment of the production plant under analysis.
Data Collection is the phase in which all the real-world data are collected, which will constitute the input for the simulation model underlying the Digital Model.
Digital Model represents the system designed in a software environment in the form of a Virtual World. In this context, a simulation model must support the testing of different operational configurations, with the aim of identifying the best in terms of effectiveness and efficiency. More specifically, we refer to discrete-event simulation through the Siemens Plant Simulation.
Insights Analysis represents the step within which an evaluation of the information collected as output of the simulation model takes place. This phase is carried out through multiple tools and approaches such as Design of Experiment, Full Factorial Design, and ANOVA. Moreover, Minitab supports this step.
Decision Maker is the entity responsible for the design choices of the production plant, who exploits the information acquired through the Digital Model to identify the best possible configuration in terms of machinery, operators, re-order levels, etc.
Corrective Actions: based on the analyses carried out, the decision-maker can decide to take corrective actions on the real system. In the design phase, these corrective actions consist in making some changes about a possible configuration of the production system. However, when fully operational, these actions concern the execution of control actions on the system, once monitoring has been carried out.
The portion of the framework highlighted in orange is devoted to assessing the resilience of the manufacturing system and the effectiveness of any response strategies in the face of disruptive and unexpected events. Basically, it is possible that the real system is affected by a disruption. The effects of this event can be studied under various scenarios using the Digital Model, which outputs an assessment of the resilience of the manufacturing system. Therefore, the Decision-Maker can evaluate the validity of different response strategies on the real system. This role of the Digital Model is crucial, also considering the recent outbreak of the Covid-19 pandemic, which has highlighted all the fragility of manufacturing ecosystems and supply chains. In this context, it is really important to highlight that the different examined response strategies can be assessed through the joint use of Siemens Plant Simulation and Minitab, with the aim of carrying out multiple statistical and what-if analyses.
4. Case Study
The case study refers to a company that is willing to start the production of bookcases. Since no historical data are available about this new business, it is extremely important for the firm to have useful tools for designing the production system in terms of production parameters. Below, for clarity reasons, the entire production process is described, which goes through 4 main areas: Manufacturing, Shou Sugi Ban, Assembly, Packaging.
4.1. Manufacturing Area
The raw materials used are pine wood panels, with dimensions of (2 × 2) m
2. Basically, there are two types of panels that differ in thickness: the first type has a thickness of 30 mm, while the second type, of 25 mm. This difference is caused by the structure of the bookcase, in which the shelves are thinner than the actual frame of the product. It is important to point out that from a pair of 25 mm and 30 mm panels, all the materials necessary to obtain a bookcase are derived. The finished product is shown in
Figure 2.
Based on some technical-economic analyses, which do not represent the focus of this paper, the company wants to explore the case in which there are two production lines, as described below. In the first phase, conveyor belts are used to move the panels to the first machine used, the Cartesian panel saw. It is needed to cut the panels into the individual parts that make up the bookcase, which are then moved by the operator into specific buffers for each different part. The second work center in the process line is the drilling machine, which is used to obtain the assembly holes on each part and to make possible, in the assembly department, the pinning process, in which small hardwood cylinders, the “pins”, are used to make possible the connection between the parts.
Finally, only for the line dedicated to 30 mm thick panels, there is an additional machining center: the milling machine. This machine is useful for creating specific joints, called “dovetails”, to bind the side walls to their specific base. This creates greater mechanical resistance at critical points in the bookcase. The department ends with buffers, one for each part, which contain the parts ready to be moved to the next area.
Figure 3 represents the manufacturing department, reconstructed using Siemens Plant Simulation.
4.2. Shou Sugi Ban Area
Once the first manufacturing operations have been completed, the panels are ready to be processed in the second department, called Shou Sugi Ban (see
Figure 4). This phase is crucial to bring out the intrinsic (e.g., resistance) and extrinsic (e.g., color, grain) features of the wood. Shou Sugi Ban is an ecological treatment that prolongs the life cycle of wooden products by carbonizing their surface. The Shou Sugi Ban Area consists of a single processing line, where in the first machine, a surface carbonization and the removal of dust from the burning is carried out. Through a conveyor belt, the panels are transported to the second machine, where the aim is to color the wood fibers. Next, the panels stay inside a machine to dry the stain before entering the last and third machine, in which the semi-gloss is applied to highlight the wood grain. Finally, the panels are transported in another buffer area and are ready to move onto the third stage of the production process.
4.3. Assembly Area
In this area (see
Figure 5), the panels are assembled to create the two modules of the bookcase. Thanks to the use of conveyors, the panels are transported to the relevant machines for assembly. The main difference between the stations are the panels supplied as input to create the different parts that will make up the library. In detail, to build a shelf, it is necessary to assemble the horizontal part and the vertical part, thanks to the aid of pins. There is a similar process for the construction of the other parts but with different panels.
Once the various components that will make up the product have been assembled, the joined parts converge in a single station through conveyors, which allows the overall assembly to be completed. In conclusion, before proceeding to the final department, the bookcases pass through a Quality Gate, which allows a check to be made on all the products manufactured and assembled, so that they meet the requirements of both the company and the consumers, guaranteeing a reduction in waste downstream and increasing the expected quality.
4.4. Packaging Area
The last department is dedicated to the packaging of the finished product and connected directly to the warehouse (see
Figure 6), where the ready-made packages are organized in special racks. This is a mainly manual phase, done by specific operators. In a first phase, the packaging of the bookcase is done with the use of a package, which has the objective of protecting the product from “shocks” during transport. In a second phase, the ready-to-send package is moved to a platform to allow the forklift to hook and move it to the warehouse, which is connected to a suitable exit to facilitate shipping operations.
5. Experimental Results and Discussion
This section presents the results related to the joint use of Digital Model & Simulation as a tool for: (1) designing the manufacturing system, (2) assessing its resilience in different scenarios, (3) evaluating possible strategies to face unexpected and disruptive events.
Figure 7 summarizes all the steps adopted in the experimental phase in the form of a flow chart.
Basically, the experimental phase was based on the use of some techniques and tools well known in the literature such as DOE, Full Factorial Design, ANOVA, and Minitab [
40,
41,
42,
43].
DOE (Design of Experiments) is a mathematical method with systematic experimentation, where intentional changes are made to input variables to identify and analyze the extent to which they modify and influence output variables. The goal is to understand, through experiments, how output results are affected, and it is also important to gather as much information as possible regarding existing cause–effect relationships. The main aims of DoE are to:
optimize processes and problem solving by using fewer resources and obtaining more information;
help the decision-making, taking also into account possible risks;
determine interactions between variables through a mathematical model.
There are different types of techniques for applying DOE and each one leads to a different mathematical model. Full Factorial Design is one of the main techniques used for DOE, which consists of conducting experiments for all possible combinations between the levels of the factors to be analyzed with the aim of identifying the main effects.
ANOVA is a tool to support DOE in evaluating the relationships that exist between inputs and outputs; it consists of a set of statistical techniques that are part of inferential statistics that allow us to compare two or more groups of data by calculating and comparing the variability within these groups with the variability between the groups. Specifically, we adopted this technique through the use of Minitab software.
5.1. Manufacturing Design
First, given the absence of historical data, the simulation-based framework was used to define some fundamental parameters of the manufacturing system. With the aim of reproducing the characteristics of the real system as much as possible, the processing time of each machine was modeled through a triangular probability distribution, where the minimum and maximum values differ by 5% from the average value. The simulation model was extremely useful in finding the work configuration capable of guaranteeing production continuity as much as possible and minimizing bottlenecks. After creating the simulation model, the Full Factorial Design technique as DOE was applied. In this case, four change factors and two levels for each factor were taken into consideration. Considering that 3 replications were carried out to account for some experimental errors, the campaign included a total of 48 experiments, since there are 16 possible combinations. All the data were then collected and entered into the Minitab software, to understand the relationship between the 4 change factors and 3 fundamental objectives: Flow Time, Level of machine utilization, Productivity. The aim was to understand how the 3 objectives vary as the 4 types of input vary.
Table 1 shows the considered exchange factors and their levels.
5.1.1. ANOVA: Preliminary Acceptability Analysis
After carrying out the whole experimental campaign, first an analysis of the residual plots was performed with reference to the 3 objectives identified, in order to verify the reliability of the results obtained.
Figure 8,
Figure 9 and
Figure 10 show the residual plots, respectively, for productivity, utilization level machine, and flow time.
As it can be seen from all the graphs of Productivity, the ANOVA experiment is satisfactory as the residuals are distributed according to a Normal Distribution, and the Normal Probability Plot has a trend very similar to a linear one. As for the Utilization Level Machine, despite a less linear trend than the previous one in the Normal Probability Plot, the ANOVA can be accepted, as the residuals distribute according to a Normal Distribution and are also centered on zero. Very similar behavior can be found for the Flow Time. Overall, the preliminary acceptability analysis gave good results, in accordance with the expectations.
5.1.2. ANOVA: Experimental Results
In this section, we discuss the results obtained after applying the developed discrete-event simulation model, which acts as a digital replica of the real manufacturing system. Basically, it is shown how the 3 objectives taken into consideration (i.e., Productivity, Utilization Level Machine, Flow Time) vary, as the 4 exchange factors (i.e., number of workers, reorder level, conveyor speed, and operator’s efficiency) vary.
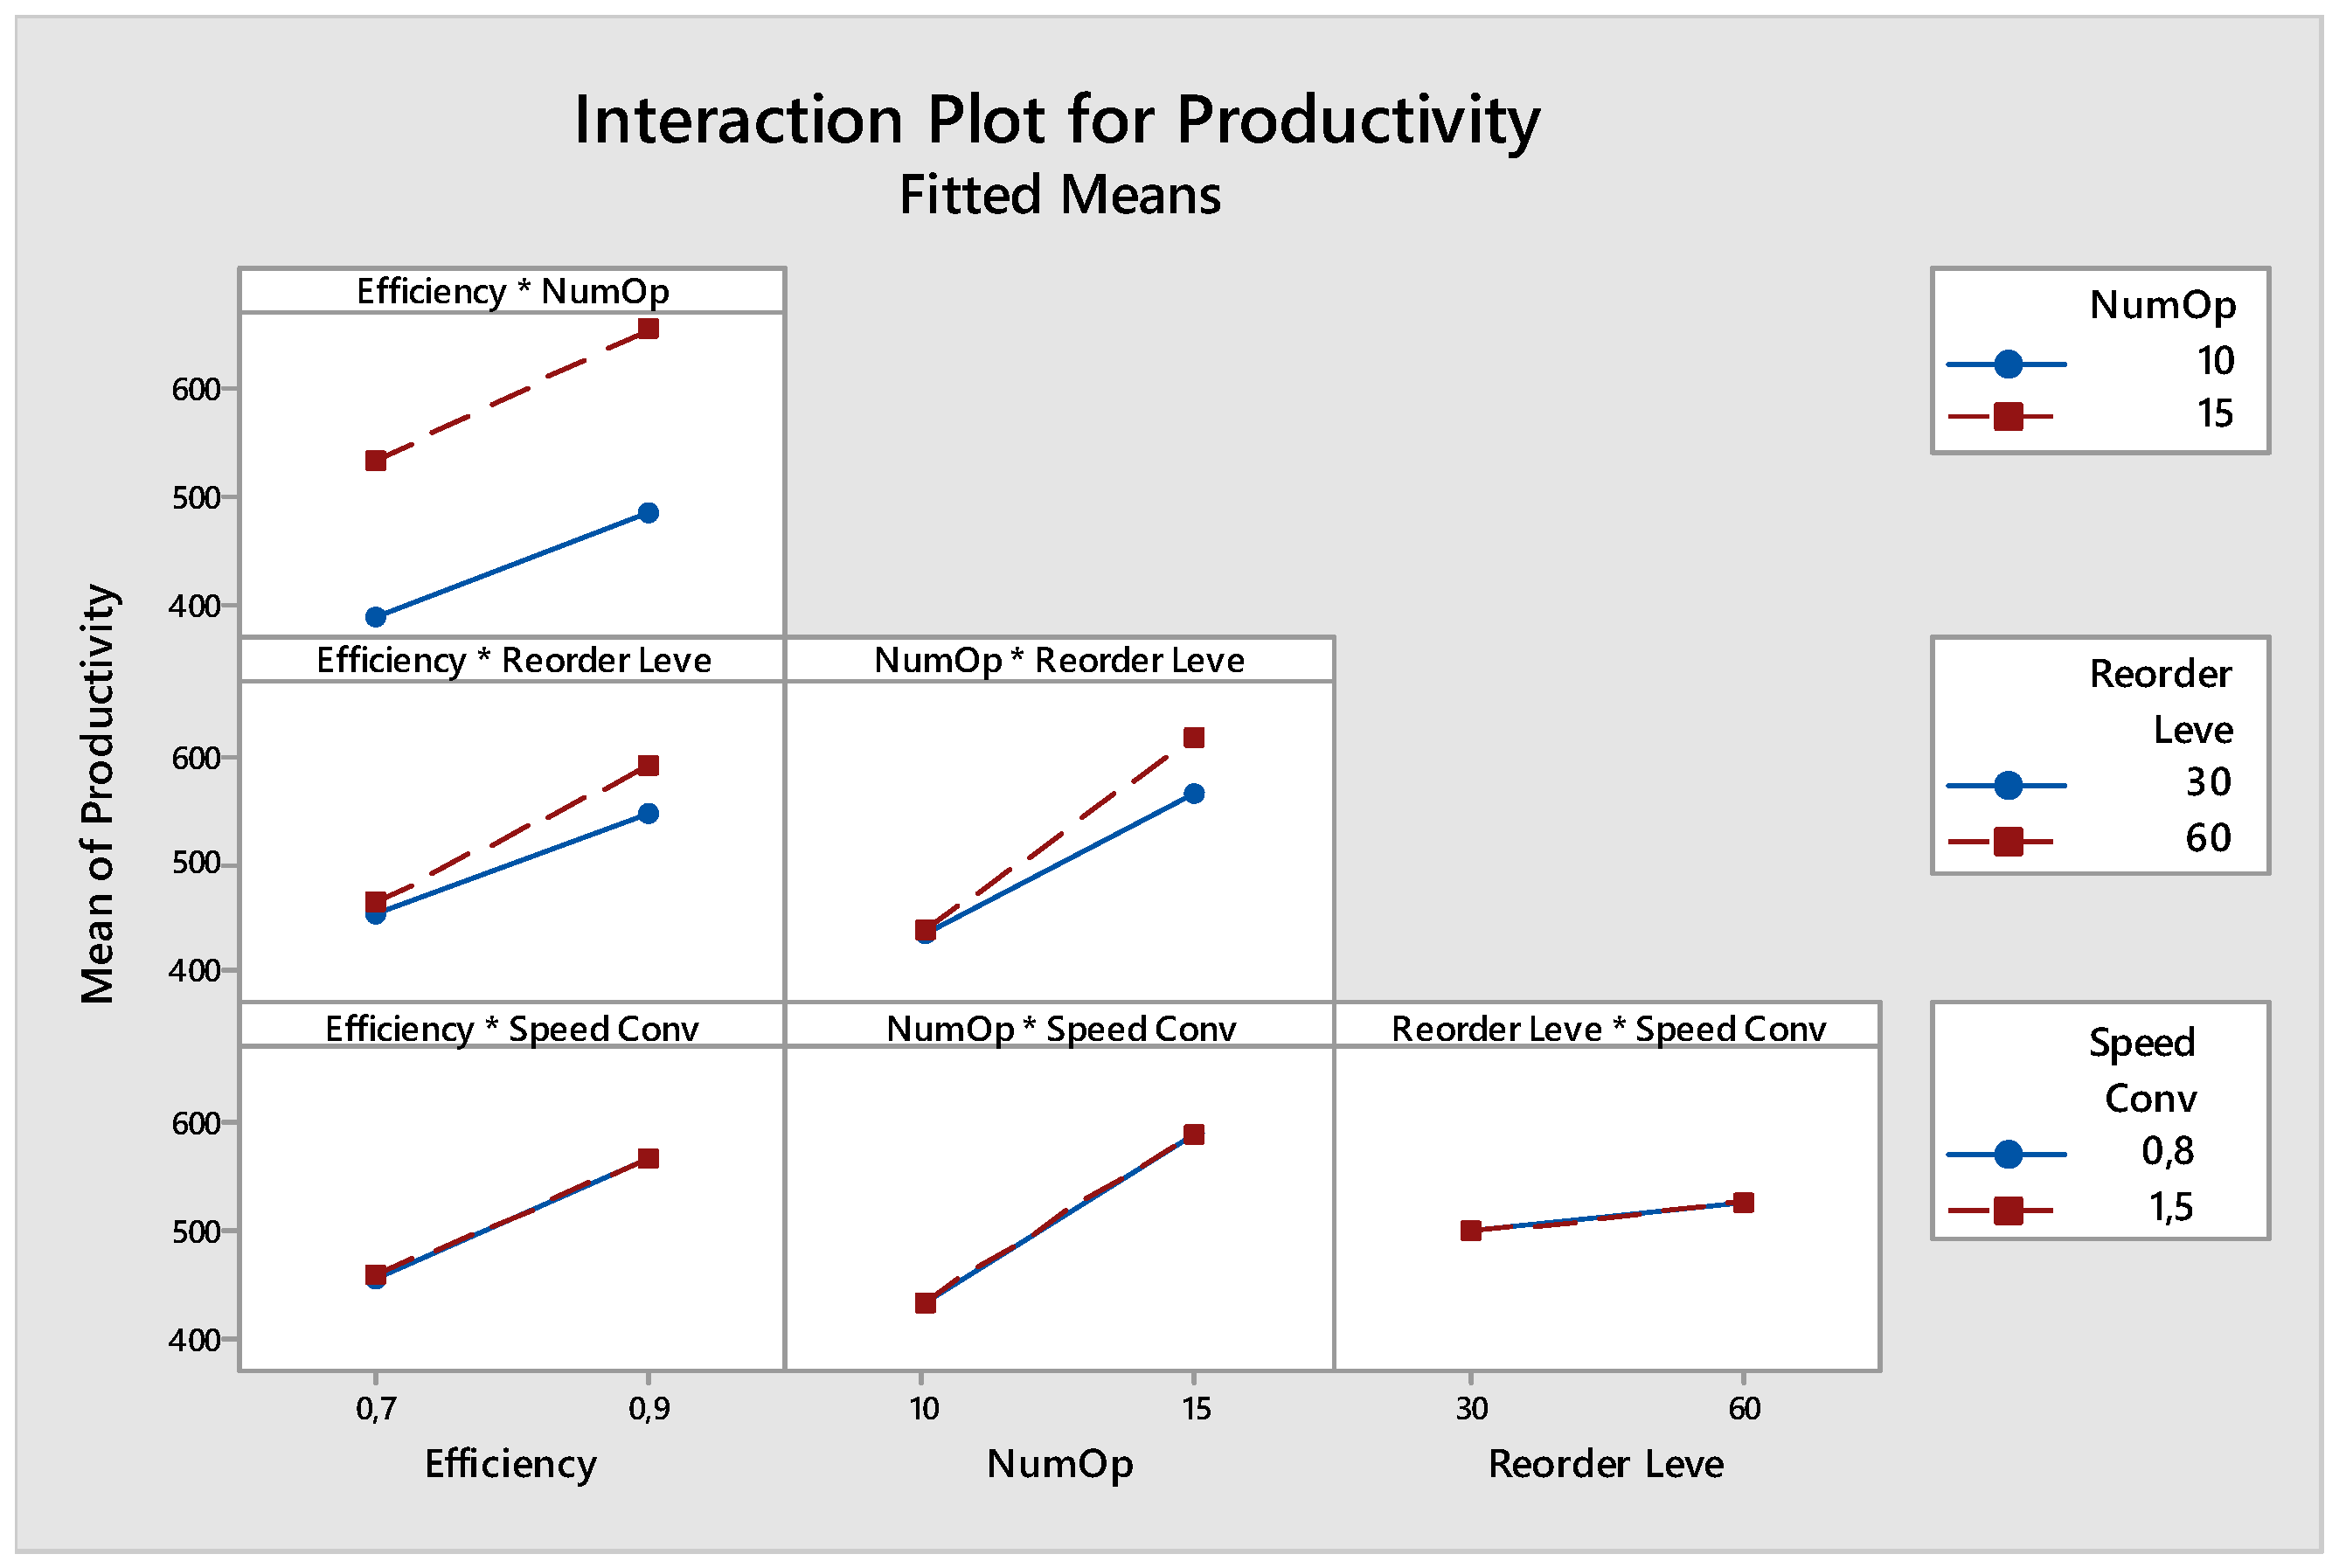
Figure 11 and
Figure 12 show the main effects plot and the interaction plot for the productivity. The sign (*) means multiplication.
We can see that the number of operators and the efficiency of the operators have a high incidence for productivity, while the speed of the conveyor has no influence because even the increase in speed does not increase the number of products manufactured, probably because the reduction in the time of inter-arrival of semi-finished products will increase the waiting time of these in the various buffers. As expected, productivity is significantly higher when the number of operators is 15 and efficiency is 0.9. For the reorder level, the number of manufactured products is higher when this is equal to 60 wood panels.
In
Figure 13, we can find the effects related to the interactions through the Pareto Chart of the Standardized Effects. We can see that the conveyor speed does not interact with any other factor. There is a slight interaction between the reorder level and the efficiency, and between the reorder level and the number of operators, because when the efficiency is at 0.7 and when the number of operators is at 10, the choice of the reorder level is indifferent; vice versa, the situation changes when the efficiency and the number of operators are at the maximum level: in fact, there will be a greater productivity with a reorder level of 60 because it guarantees a more continuous production. Basically, we can see that all the effects related to the speed of the conveyors can be neglected while the number of operators is the factor that has the greatest impact on productivity.
Figure 14 and
Figure 15 show the main effects plot and the interaction plot for the utilization level machine.
Once again, conveyor speed has no impact on the level of machine utilization. The number of operators has an important influence, followed by the efficiency of the operators and the reorder level. It can be noted that there are interactions between the reorder level and the efficiency, the reorder level and the number of operators, since when they are set to the minimum values, the choice of the reorder level is indifferent, while if they are set to the maximum values, the situation changes. All these aspects find confirmation within the Pareto Chart of the Standardized Effects in
Figure 16.
Figure 17 and
Figure 18 show the main effects plot and the interaction plot for the flow time.
We can see how even here, the number of operators is the main incident factor together with their efficiency. In this case, in addition to the speed of the conveyor, the choice of the reorder level is also irrelevant. As regards the interactions, we note a very slight interaction between efficiency and the number of operators as there is a greater reduction in shifting from 0.7 to 0.9 in efficiency when the number of operators is 10 rather than 15, probably because with a number of operators of 15, we already have a good reduction in flowtime that can be improved to a lesser extent by shifting from 0.7 to 0.9 for the efficiency of the operators.
After running all simulations and performing a thorough analysis on the variation of outputs under the various scenarios, it was decided by the company to:
adopt conveyors with a speed of 0.8 m/s instead of 1.5 m/s, with the aim of minimizing the energy consumption and reducing the number of investments on more advanced and expensive technologies, given the irrelevance of the factor on all the considered output measurements;
adopt a reorder level of 60 wood panels;
have 15 expert operators, with an efficiency of 90%.
These choices were made by giving the highest weight to productivity with the aim of maximizing it as much as possible.
5.2. The M&S Framework for Manufacturing Resilience Assessment: Preliminary Study
The Digital Model of the real manufacturing system was also used to carry out assessments in terms of resilience, and to simulate possible response strategies. Indeed, the recent COVID-19 pandemic has highlighted all the fragility of supply chains and production systems in the face of unexpected and disruptive events. The M&S approach was first used to assess the impact of the following two main events:
The supplier of the wood, which is the main raw material of the finished product, delays deliveries due to unavailability of the transporters, affected by COVID-19.
Unavailability of some operators within the production system, due to a COVID-19 outbreak.
Overall, 15 scenarios were taken into account, since for supplier delays, we considered the cases of 2, 5, 7 days, while for the unavailability of operators within the manufacturing system, respectively, 7, 10, 14 days. A summary is available in
Table 2. S0 refers to the standard scenario, where there are no disruptive events.
After 10 runs for each scenario, the framework returned the results available in
Table 3 in terms of monthly productivity. It is important to underline that each run lasted a few seconds.
First, it is important to specify that the reliability of the results obtained is confirmed by the indicator in the last column of the table, given that in the vast majority of cases, there is no intersection between the 95% confidence intervals. It is extremely important to evaluate how the productivity value changes according to the various events, starting from S0. A 2-day delay in supplier deliveries (i.e., S3) has a very limited impact on the production system, so much so that on average, productivity has a decrease of 0.2%. As expected, the worst productivity value can be found in the ninth scenario, where the effects of disruptive events are maximum, with an average reduction of 31.8%. Overall, it can also be noted that pairs of scenarios have similar effects on the production system and are S1–S15, S2–S13, S6–S14. Furthermore, it can be stated that, for the same number of days, the non-deliveries of the supplier seem to have a greater impact than the unavailability of a part of the workforce; indeed, S4 guarantees an average productivity higher than S1 of 18.9%.
From the results in
Table 3, it is evident that unexpected and disruptive events can have important effects on the production system, which demonstrates limited resilience. Therefore, it is reasonable to test the goodness of possible strategies to be adopted to be ready for the occurrence of actions that can disturb the manufacturing ecosystem of the case study.
5.3. Analysis of Possible Response Strategies
The Digital Model of the real manufacturing system was also used to simulate and evaluate the goodness of two possible response strategies:
The company of the case study enters into agreements with an additional supplier of the main raw material (i.e., wood), so as not to depend on a single producer.
The company of the case study enters into agreements with part-time workers, who are able to replace permanent expert workers in the event of an outbreak.
Therefore, an additional 15 scenarios were considered, as in
Table 4. The sign (✓) means that the specific strategy is adopted.
10 runs were carried out for each of these new scenarios. The results are in
Table 5.
As can be seen from the content of
Table 5, the adoption of one or more response strategies can have a very significant effect on the performance of the manufacturing plant. In this context, it can be extremely useful to make a comparison between pairs of scenarios that differ only in the adoption/non-adoption of response strategies (i.e., S1 and S1′, S2 and S2′, …, S15 and S15′). In particular, the most significant effect of the response strategies occurs in scenarios eight and nine, where on average, productivity increases by approximately 26%, thanks to agreements with an additional supplier and part-time workers. It should be noted that the scenarios between the second and sixth see a limited increase in average productivity, which oscillates between 0.2% and 3.7%, probably because one and only one of the two disruptive events is taken into consideration. In any case, the strategies examined always involve an average increase in productivity, which means minimizing lost earnings.
To replicate reality as much as possible, it is necessary to specify that for part-time workers, with whom agreements are made (i.e., second response strategy), an efficiency of 0.7 has been hypothesized. Therefore, their presence makes it possible to limit the loss of productivity due to simulated disruptive events but could lead to a slight increase in defective units (i.e., waste), and therefore, in disposal costs. In this regard,
Table 6 shows the average values of defective products obtained in the S4–S6 and S4′–S6′ scenarios.
As can be seen from
Table 6, on average, the increase in waste is quite limited. This is not a dangerous factor, as the possible increase in disposal costs is lower if compared to the increase in revenue due to the employment of part-time workers in the S4′, S5′ and S6′ scenarios (see the productivity increase from
Table 3 and
Table 5). Furthermore, it is not always necessary to pay to dispose of defective wood panels, as recent studies confirm the possibility to reuse them according to the circular economy paradigm [
44].
6. Conclusions
The advent of digital technologies is offering new opportunities to improve the performance of manufacturing systems. At the same time, the COVID-19 pandemic has highlighted the fragility of all the global supply chains and consequently, of the manufacturing systems that are part of them. Basically, in recent years, interest in the concept of manufacturing resilience has grown enormously. It is the ability of an organization to maintain adequate levels of performance, even in the face of crises or disruptions. In this paper, a simulation-based framework has been proposed, having multiple purposes: (1) to support manufacturing design, (2) to assess the resilience level of a manufacturing system, (3) to estimate the effectiveness of multiple response strategies of the system for dealing with disruptions. The effectiveness of the framework was tested and demonstrated through a real-life case study in the wood sector. First, it was possible to identify the best configuration of production parameters to start a new business, exploiting the potential of an M&S approach and the concepts of Design of Experiment and Full Factorial Design. Basically, the best production combination was identified in terms of number of workers, re-order level for the main raw material, conveyor speed. The criteria taken into consideration for setting the parameters were: productivity, utilization level machine, flow time. Subsequently, the impacts on the system of two disruptive events, resulting from the outbreak of the Covid-19 pandemic, were assessed. This kind of analysis was extremely important to understand how sensitive the system is to a more or less high delay in deliveries by the supplier and a more or less prolonged absence by the operators, due to COVID-19 outbreaks. In accordance with the experimental campaign carried out, the lack of readiness of the system can lead to a decrease in productivity up to 31.8%. Finally, the validity of some response strategies was assessed, in order to understand how to limit the impacts of disruptions. In some cases, they led to increases in productivity of up to 26%. The main innovative contribution of this research work consists in the multiplicity of aims that can be reached through the proposed framework. Basically, it can be used throughout the entire life cycle of a manufacturing system. In the early stages of life, it is extremely useful for designing the system and the most promising configuration of production parameters. Subsequently, it can be used to evaluate its resilience and then the goodness of possible response strategies, in the face of disruptive and unexpected events such as COVID-19. Moreover, the cyclical structure of the framework enables its reuse over time, especially for monitoring and control purposes.
The main limitations of this research work consist in the low number of response strategies taken into consideration and consequently, scenarios. In any case, the analysis carried out made it possible to derive some significant managerial insights. Basically, some valid strategies for increasing the preparedness of the system are the diversification of suppliers to limit dependence on each one and the agreements with part-time workers, who are able to cope with possible outbreaks.
Possible future developments concern the extension of the framework at a macro level and its integration with the blockchain paradigm, with the aim of also taking into consideration the supply chain of which the manufacturing system is part. This would allow one to optimize the flow of materials entering and leaving the system and therefore, further increase overall performance.
Author Contributions
Conceptualization, F.L., G.M. and V.S.; methodology, F.L., G.M. and V.S.; software, F.L., G.M., V.S., U.A., G.D.P., L.G. and M.Z.; validation, F.L., G.M., V.S., U.A., G.D.P., L.G. and M.Z.; formal analysis, F.L., G.M. and V.S.; investigation, F.L., G.M. and V.S.; resources, F.L., G.M. and V.S.; data curation, F.L., G.M., V.S., U.A., G.D.P., L.G. and M.Z.; writing—original draft preparation, F.L., G.M., V.S., U.A., G.D.P., L.G. and M.Z.; writing—review and editing, F.L., G.M. and V.S.; visualization, F.L., G.M., V.S.; supervision, F.L., G.M. and V.S.; funding acquisition, F.L. All authors have read and agreed to the published version of the manuscript.
Funding
This research was partly supported by the SO4SIMS project (Smart Operators 4.0 based on Simulation for Industry and Manufacturing Systems) funded by the Italian Ministry of Education, Universities and Research MIUR (Project PRIN—2017FW8BB4).
Institutional Review Board Statement
Not applicable.
Informed Consent Statement
Not applicable.
Data Availability Statement
Not applicable for privacy reasons.
Conflicts of Interest
The authors declare no conflict of interest.
References
- Lu, Y. Industry 4.0: A survey on technologies, applications and open research issues. J. Ind. Inf. Integr. 2017, 6, 1–10. [Google Scholar] [CrossRef]
- Mabkhot, M.M.; Al-Ahmari, A.A.; Salah, B.; Alkhalefah, H. Requirements of the smart factory system: A survey and perspective. Machines 2018, 6, 23. [Google Scholar] [CrossRef] [Green Version]
- Heydaryan, S.; Bedolla, J.S.; Belingardi, G. Safety design and development of a human-robot collaboration assembly process in the automotive industry. Appl. Sci. 2018, 8, 344. [Google Scholar] [CrossRef] [Green Version]
- Chiurco, A.; Frangella, J.; Longo, F.; Nicoletti, L.; Padovano, A.; Solina, V.; Mirabelli, G.; Citraro, C. Real-time Detection of Worker’s Emotions for Advanced Human-Robot Interaction during Collaborative Tasks in Smart Factories. Procedia Comput. Sci. 2022, 200, 1875–1884. [Google Scholar] [CrossRef]
- Elbasheer, M.; Longo, F.; Nicoletti, L.; Padovano, A.; Solina, V.; Vetrano, M. Applications of ML/AI for Decision-Intensive Tasks in Production Planning and Control. Procedia Comput. Sci. 2022, 200, 1903–1912. [Google Scholar] [CrossRef]
- Posada, J.; Toro, C.; Barandiaran, I.; Oyarzun, D.; Stricker, D.; De Amicis, R.; Pinto, E.B.; Eisert, P.; Döllner, J.; Vallarino, I. Visual Computing as a Key Enabling Technology for Industrie 4.0 and Industrial Internet. IEEE Comput. Graph. Appl. 2015, 35, 26–40. [Google Scholar] [CrossRef]
- Erasmus, J.; Grefen, P.; Vanderfeesten, I.; Traganos, K. Smart hybrid manufacturing control using cloud computing and the internet-of-things. Machines 2018, 6, 62. [Google Scholar] [CrossRef] [Green Version]
- Cotrino, A.; Sebastian, M.A.; Gonzalez-Gaya, C. Industry 4.0 roadmap: Implementation for small and medium-sized enterprises. Appl. Sci. 2020, 10, 8566. [Google Scholar] [CrossRef]
- Lee, J.; Kao, H.-A.; Yang, S. Service innovation and smart analytics for Industry 4.0 and big data environment. Procedia CIRP 2014, 16, 3–8. [Google Scholar] [CrossRef] [Green Version]
- Thoben, K.-D.; Wiesner, S.A.; Wuest, T. “Industrie 4.0” and smart manufacturing-a review of research issues and application examples. Int. J. Autom. Technol. 2017, 11, 4–16. [Google Scholar] [CrossRef] [Green Version]
- Kritzinger, W.; Karner, M.; Traar, G.; Henjes, J.; Sihn, W. Digital Twin in manufacturing: A categorical literature review and classification. IFAC PapersOnLine 2018, 51, 1016–1022. [Google Scholar] [CrossRef]
- Tao, F.; Cheng, J.; Qi, Q.; Zhang, M.; Zhang, H.; Sui, F. Digital twin-driven product design, manufacturing and service with big data. Int. J. Adv. Manuf. Technol. 2018, 94, 3563–3576. [Google Scholar] [CrossRef]
- Lu, Y.; Liu, C.; Kevin, I.; Wang, K.; Huang, H.; Xu, X. Digital Twin-driven smart manufacturing: Connotation, reference model, applications and research issues. Robot. Comput.-Integr. Manuf. 2019, 61, 1018371. [Google Scholar] [CrossRef]
- Qi, Q.; Tao, F. Digital Twin and Big Data towards Smart Manufacturing and Industry 4.0: 360 Degree Comparison. IEEE Access 2018, 6, 3585–3593. [Google Scholar] [CrossRef]
- Golan, M.S.; Jernegan, L.H.; Linkov, I. Trends and applications of resilience analytics in supply chain modeling: Systematic literature review in the context of the COVID-19 pandemic. Environ. Syst. Decis. 2020, 40, 222–243. [Google Scholar]
- Barricelli, B.R.; Casiraghi, E.; Fogli, D. A Survey on Digital Twin: Definitions, Characteristics, Applications, and Design Implications. IEEE Access 2019, 7, 167653–167671. [Google Scholar] [CrossRef]
- Tao, F.; Zhang, H.; Liu, A.; Nee, A.Y.C. Digital Twin in Industry: State-of-the-Art. IEEE Trans. Ind. Inform. 2019, 15, 2405–2415. [Google Scholar] [CrossRef]
- Catalano, M.; Chiurco, A.; Fusto, C.; Gazzaneo, L.; Longo, F.; Mirabelli, G.; Nicoletti, L.; Solina, V.; Talarico, S. A Digital Twin-Driven and Conceptual Framework for Enabling Extended Reality Applications: A Case Study of a Brake Discs Manufacturer. Procedia Comput. Sci. 2022, 200, 1885–1893. [Google Scholar] [CrossRef]
- Mattila, J.; Ala-Laurinaho, R.; Autiosalo, J.; Salminen, P.; Tammi, K. Using Digital Twin Documents to Control a Smart Factory: Simulation Approach with ROS, Gazebo, and Twinbase. Machines 2022, 10, 225. [Google Scholar] [CrossRef]
- Zhuang, C.; Liu, J.; Xiong, H. Digital twin-based smart production management and control framework for the complex product assembly shop-floor. Int. J. Adv. Manuf. Technol. 2018, 96, 1149–1163. [Google Scholar] [CrossRef]
- Xu, Y.; Sun, Y.; Liu, X.; Zheng, Y. A Digital-Twin-Assisted Fault Diagnosis Using Deep Transfer Learning. IEEE Access 2019, 7, 19990–19999. [Google Scholar] [CrossRef]
- Mandolla, C.; Petruzzelli, A.M.; Percoco, G.; Urbinati, A. Building a digital twin for additive manufacturing through the exploitation of blockchain: A case analysis of the aircraft industry. Comput. Ind. 2019, 109, 134–152. [Google Scholar] [CrossRef]
- Knapp, G.L.; Mukherjee, T.; Zuback, J.S.; Wei, H.L.; Palmer, T.A.; De, A.; DebRoy, T. Building blocks for a digital twin of additive manufacturing. Acta Mater. 2017, 135, 390–399. [Google Scholar] [CrossRef]
- Min, Q.; Lu, Y.; Liu, Z.; Su, C.; Wang, B. Machine Learning based Digital Twin Framework for Production Optimization in Petrochemical Industry. Int. J. Inf. Manag. 2019, 49, 502–519. [Google Scholar] [CrossRef]
- Zhang, L.; Zhou, L.; Laili, Y. Modeling and simulation in intelligent manufacturing. Comput. Ind. 2019, 112, 103123. [Google Scholar] [CrossRef]
- Terkaj, W.; Tolio, T.; Urgo, M. A virtual factory approach for in situ simulation to support production and maintenance planning. CIRP Annals 2015, 64, 451–454. [Google Scholar] [CrossRef]
- Goodall, P.; Sharpe, R.; West, A. A data-driven simulation to support remanufacturing operations. Comput. Ind. 2018, 105, 48–60. [Google Scholar] [CrossRef]
- Zhou, L.; Zhang, L.; Ren, L.; Wang, J. Real-Time Scheduling of Cloud Manufacturing Services Based on Dynamic Data-Driven Simulation. IEEE Trans. Ind. Inform. 2019, 15, 5042–5051. [Google Scholar] [CrossRef]
- Jeon, S.M.; Kim, G. A survey of simulation modeling techniques in production planning and control (PPC). Prod. Plan. Control 2016, 27, 360–377. [Google Scholar] [CrossRef]
- Vieira, A.A.C.; Dias, L.M.S.; Santos, M.Y.; Pereira, G.A.B.; Oliveira, J.A. Setting an industry 4.0 research and development agenda for simulation—A literature review. Int. J. Simul. Model. 2018, 17, 377–390. [Google Scholar] [CrossRef]
- Yazdani, M.; Zarate, P.; Coulibaly, A.; Zavadskas, E.K. A group decision making support system in logistics and supply chain management. Expert Syst. Appl. 2017, 88, 376–392. [Google Scholar] [CrossRef] [Green Version]
- Neto, A.A.; Carrijo, B.S.; Brock, J.G.R.; Deschamps, S.; de Lima, E.P. Digital twin-driven decision support system for opportunistic preventive maintenance scheduling in manufacturing. Procedia Manuf. 2021, 55, 439–446. [Google Scholar] [CrossRef]
- Bujari, A.; Calvio, A.; Foschini, L.; Sabbioni, A.; Corradi, A. A Digital Twin Decision Support System for the Urban Facility Management Process. Sensors 2021, 21, 8460. [Google Scholar] [CrossRef]
- Kunath, M.; Winkler, H. Integrating the Digital Twin of the manufacturing system into a decision support system for improving the order management process. Procedia CIRP 2018, 72, 225–231. [Google Scholar] [CrossRef]
- Jones, M.D.; Hutcheson, S.; Camba, J.D. Past, present, and future barriers to digital transformation in manufacturing: A review. J. Manuf. Syst. 2021, 60, 936–948. [Google Scholar] [CrossRef]
- Xu, Z.; Elomri, A.; Kerbache, L.; El Omri, A. Impacts of COVID-19 on Global Supply Chains: Facts and Perspectives. IEEE Eng. Manag. Rev. 2020, 48, 153–166. [Google Scholar] [CrossRef]
- Burgos, D.; Ivanov, D. Food retail supply chain resilience and the COVID-19 pandemic: A digital twin-based impact analysis and improvement directions. Transp. Res. Part E Logist. Transp. Rev. 2021, 152, 102412. [Google Scholar] [CrossRef]
- Badhotiya, G.K.; Soni, G.; Jain, V.; Joshi, R.; Mittal, S. Assessing supply chain resilience to the outbreak of COVID-19 in Indian manufacturing firms. Oper. Manag. Res. 2022, 1–20. [Google Scholar] [CrossRef]
- Okorie, O.; Subramoniam, R.; Charnley, F.; Patsavellas, J.; Widdifield, D.; Salonitis, K. Manufacturing in the Time of COVID-19: An Assessment of Barriers and Enablers. IEEE Eng. Manag. Rev. 2020, 48, 167–175. [Google Scholar] [CrossRef]
- Durão, L.F.C.S.; Barkoczy, R.; Zancul, E.; Lee Ho, L.; Bonnard, R. Optimizing additive manufacturing parameters for the fused deposition modeling technology using a design of experiments. Prog. Addit. Manuf. 2019, 4, 291–313. [Google Scholar] [CrossRef]
- Avdeenko, T.; Timofeeva, A.; Murtazina, M.; Razumnikova, O. Changes in the intelligence levels and structure in russia: An anova method based on discretization and grouping of factors. Appl. Sci. 2021, 11, 5864. [Google Scholar] [CrossRef]
- Morovic, L.; Kritikos, M.; Sobrino, D.R.D.; Bilik, J.; Sobota, R.; Kapustova, M. A Statistical Approach in the Analysis of Geometrical Product Specification during the Cold Tube Drawing Process. Appl. Sci. 2022, 12, 676. [Google Scholar] [CrossRef]
- Țîțu, A.M.; Sandu, A.V.; Pop, A.B.; Țîțu, S.; Frățilă, D.N.; Ceocea, C.; Boroiu, A. Design of Experiment in the Milling Process of Aluminum Alloys in the Aerospace Industry. Appl. Sci. 2020, 10, 6951. [Google Scholar]
- Araújo, C.K.C.; Rodrigo, S.; Cassiano Moro, P.; Cristiane, S.C.; de Francisco, A.C.; Camargo, S.K.C.A. Circular economy practices on wood panels: A bibliographic analysis. Sustainability 2019, 11, 1057. [Google Scholar] [CrossRef] [Green Version]
Figure 1.
The simulation-based framework for manufacturing design and resilience assessment.
Figure 1.
The simulation-based framework for manufacturing design and resilience assessment.
Figure 2.
Finished product of the case study.
Figure 2.
Finished product of the case study.
Figure 3.
Manufacturing area, built through Siemens Plant Simulation.
Figure 3.
Manufacturing area, built through Siemens Plant Simulation.
Figure 4.
Shou Sugi Ban area, built through Siemens Plant Simulation.
Figure 4.
Shou Sugi Ban area, built through Siemens Plant Simulation.
Figure 5.
Assembly Area, built through Siemens Plant Simulation.
Figure 5.
Assembly Area, built through Siemens Plant Simulation.
Figure 6.
Packaging Area, built through Siemens Plant Simulation.
Figure 6.
Packaging Area, built through Siemens Plant Simulation.
Figure 7.
Flow Chart with the main steps of the experimental campaign.
Figure 7.
Flow Chart with the main steps of the experimental campaign.
Figure 8.
Residual Plots for Productivity.
Figure 8.
Residual Plots for Productivity.
Figure 9.
Residual Plots for Utilization Level Machine.
Figure 9.
Residual Plots for Utilization Level Machine.
Figure 10.
Residual Plots for Flow Time.
Figure 10.
Residual Plots for Flow Time.
Figure 11.
Main Effects Plot for Productivity.
Figure 11.
Main Effects Plot for Productivity.
Figure 12.
Interaction Plot for Productivity.
Figure 12.
Interaction Plot for Productivity.
Figure 13.
Pareto Chart of the Standardized Effects for Productivity.
Figure 13.
Pareto Chart of the Standardized Effects for Productivity.
Figure 14.
Main Effects Plot for Utilization Level Machine.
Figure 14.
Main Effects Plot for Utilization Level Machine.
Figure 15.
Interaction Plot for Utilization Level Machine.
Figure 15.
Interaction Plot for Utilization Level Machine.
Figure 16.
Pareto Chart of the Standardized Effects for Utilization Level Machine.
Figure 16.
Pareto Chart of the Standardized Effects for Utilization Level Machine.
Figure 17.
Main Effects Plot for Flow Time.
Figure 17.
Main Effects Plot for Flow Time.
Figure 18.
Interaction Plot for Flow Time.
Figure 18.
Interaction Plot for Flow Time.
Table 1.
The exchange factors.
Table 1.
The exchange factors.
| Exchange Factor | Level |
|---|
| Number of workers | (10;15) units |
| Re-order level (referred to the main raw material) | (30; 60) wood panels |
| Conveyor speed (referred to the whole manufacturing system) | (0.8; 1.5) mt/s |
| Operator’s efficiency | (0.7; 0.9) |
Table 2.
Scenarios for assessment of impacts related to COVID-19.
Table 2.
Scenarios for assessment of impacts related to COVID-19.
| Scenario | Supplier’s Delay
(Day) | Manufacturing Operators’ Unavailability
(Day) |
|---|
| S0 | - | - |
| S1 | 7 | - |
| S2 | 5 | - |
| S3 | 2 | - |
| S4 | - | 7 |
| S5 | - | 10 |
| S6 | - | 14 |
| S7 | 7 | 7 |
| S8 | 7 | 10 |
| S9 | 7 | 14 |
| S10 | 5 | 7 |
| S11 | 5 | 10 |
| S12 | 5 | 14 |
| S13 | 2 | 7 |
| S14 | 2 | 10 |
| S15 | 2 | 14 |
Table 3.
Monthly productivity of the manufacturing system under the scenarios S0–S15.
Table 3.
Monthly productivity of the manufacturing system under the scenarios S0–S15.
| Scenario | Mean
(Unit) | Min
(Unit) | Max
(Unit) | stdDev
(Unit) | 95% Confidence Interval (Unit) |
|---|
| S0 | 697.3 | 693.0 | 701.0 | 2.710 | (695.4; 699.2) |
| S1 | 568.0 | 562.0 | 572.0 | 3.651 | (565.4; 570.6) |
| S2 | 639.0 | 633.0 | 645.0 | 3.916 | (636.2; 641.8) |
| S3 | 695.9 | 689.0 | 701.0 | 3.446 | (693.4; 698.4) |
| S4 | 675.0 | 669.0 | 681.0 | 4.082 | (672.1; 677.9) |
| S5 | 652.0 | 646.0 | 657.0 | 3.712 | (649.3; 654.7) |
| S6 | 612.7 | 605.0 | 616.0 | 3.561 | (610.1; 615.2) |
| S7 | 510.7 | 507.0 | 515.0 | 2.830 | (508.7; 512.7) |
| S8 | 489.2 | 485.0 | 493.0 | 2.860 | (487.2; 491.2) |
| S9 | 475.4 | 471.0 | 479.0 | 2.221 | (473.8; 477.0) |
| S10 | 580.4 | 576.0 | 586.0 | 3.534 | (577.9; 582.9) |
| S11 | 556.8 | 551.0 | 560.0 | 2.974 | (554.7; 558.9) |
| S12 | 504.7 | 500.0 | 509.0 | 2.983 | (502.6; 506.8) |
| S13 | 637.8 | 633.0 | 642.0 | 3.048 | (635.6; 640.0) |
| S14 | 608.9 | 605.0 | 613.0 | 2.961 | (606.8; 611.0) |
| S15 | 571.2 | 567.0 | 574.0 | 2.530 | (569.4; 573.0) |
Table 4.
Scenarios for assessing possible response strategies to disruptions.
Table 4.
Scenarios for assessing possible response strategies to disruptions.
| Scenario | Supplier’s Delay
(Day) | Manufacturing
Operators’
Unavailability
(Day) | Agreements
with an
Additional Supplier | Agreements with Part-Time Workers |
|---|
| S1′ | 7 | - | ✓ | - |
| S2′ | 5 | - | ✓ | - |
| S3′ | 2 | - | ✓ | - |
| S4′ | - | 7 | - | ✓ |
| S5′ | - | 10 | - | ✓ |
| S6′ | - | 14 | - | ✓ |
| S7′ | 7 | 7 | ✓ | ✓ |
| S8′ | 7 | 10 | ✓ | ✓ |
| S9′ | 7 | 14 | ✓ | ✓ |
| S10′ | 5 | 7 | ✓ | ✓ |
| S11′ | 5 | 10 | ✓ | ✓ |
| S12′ | 5 | 14 | ✓ | ✓ |
| S13′ | 2 | 7 | ✓ | ✓ |
| S14′ | 2 | 10 | ✓ | ✓ |
| S15′ | 2 | 14 | ✓ | ✓ |
Table 5.
Monthly productivity of the manufacturing system under the scenarios S1′–S15′, based on the response strategies.
Table 5.
Monthly productivity of the manufacturing system under the scenarios S1′–S15′, based on the response strategies.
| Scenario | Mean
(Unit) | Min
(Unit) | Max
(Unit) | stdDev
(Unit) | 95% Confidence Interval (Unit) |
|---|
| S1′ | 629.3 | 624.0 | 636.6 | 4.244 | (626.3; 632.3) |
| S2′ | 659.4 | 654.0 | 665.0 | 3.204 | (657.1; 661.7) |
| S3′ | 697.6 | 693.0 | 702.0 | 3.134 | (695.4; 699.8) |
| S4′ | 688.4 | 685.0 | 695.0 | 3.169 | (686.1; 690.7) |
| S5′ | 670.3 | 665.0 | 677.0 | 4.296 | (667.2; 673.4) |
| S6′ | 635.5 | 631.0 | 640.0 | 3.274 | (633.2; 637.8) |
| S7′ | 618.8 | 616.0 | 625.0 | 2.974 | (616.7; 620.9) |
| S8′ | 617.5 | 613.0 | 622.0 | 2.799 | (615.5; 619.5) |
| S9′ | 602.6 | 599.0 | 608.0 | 2.951 | (600.5; 604.7) |
| S10′ | 650.8 | 646.0 | 655.0 | 3.011 | (648.6; 653.0) |
| S11′ | 642.7 | 637.0 | 649.0 | 3.917 | (639.9; 645.5) |
| S12′ | 629.9 | 626.0 | 636.0 | 3.178 | (627.6; 632.2) |
| S13′ | 692.0 | 685.0 | 696.0 | 3.682 | (689.4; 694.6) |
| S14′ | 680.7 | 676.0 | 685.0 | 2.983 | (678.6; 682.8) |
| S15′ | 676.8 | 673.0 | 680.0 | 2.530 | (675.0; 678.6) |
Table 6.
Waste (i.e., defective units) under scenarios S4–S6 and S4′–S6′.
Table 6.
Waste (i.e., defective units) under scenarios S4–S6 and S4′–S6′.
Average Waste
(Unit) |
|---|
| S4 | S4′ |
| 17 | 21 |
| S5 | S5′ |
| 17 | 26 |
| S6 | S6′ |
| 13 | 27 |
| Publisher’s Note: MDPI stays neutral with regard to jurisdictional claims in published maps and institutional affiliations. |
© 2022 by the authors. Licensee MDPI, Basel, Switzerland. This article is an open access article distributed under the terms and conditions of the Creative Commons Attribution (CC BY) license (https://creativecommons.org/licenses/by/4.0/).


 ,
, 


