
Musculoskeletal Symptoms and Assessment of Ergonomic Risk Factors on a Coffee Farm


 , , and
Abstract
:1. Introduction
1.1. Organic Coffee Consumption and Fair Trade
1.2. Coffee Production in Honduras
1.3. Risk Factors and Musculoskeletal Lesions in Agricultural Workers
2. Materials and Methods
2.1. Participants
2.2. Instruments
2.3. Procedure
2.4. Data Analysis
3. Results
4. Discussion
5. Conclusions
Author Contributions
Funding
Institutional Review Board Statement
Informed Consent Statement
Data Availability Statement
Conflicts of Interest
References
- Sianes, A.; Vega-Muñoz, A.; Tirado-Valencia, P.; Ariza-Montes, A. Impact of the Sustainable Development Goals on the academic research agenda. A scientometric analysis. PLoS ONE 2022, 17, e0265409. [Google Scholar] [CrossRef]
- Muller, A.; Schader, C.; Hage Scialabba, N. Strategies for feeding the world more sustainably with organic agriculture. Nat. Commun. 2017, 8, 1705. [Google Scholar] [CrossRef] [Green Version]
- Squalli, J.; Adamkiewicz, G. Organic farming and greenhouse gas emissions: A longitudinal U.S. state-level study. J. Clean. Prod. 2018, 192, 30–42. [Google Scholar] [CrossRef]
- He, X.; Qiao, Y.; Liang, L.; Trydeman, K.; Martin, F. Environmental life cycle assessment of long-term organic rice production in subtropical China. J. Clean. Prod. 2018, 176, 880–888. [Google Scholar] [CrossRef]
- Jungbluth, N.; Tietje, O.; Scholz, R. Food purchases: Impacts from the consumers’ point of view investigated with a modular LCA. Int. J. Life Cycle Assess 2000, 5, 134–142. [Google Scholar] [CrossRef]
- Meier, M.; Stoessel, F.; Jungbluth, N.; Juraske, R.; Schader, C.; Stolze, M. Environmental impacts of organic and conventional agricultural products—Are the differences captured by life cycle assessment? J. Environ. Manag. 2015, 149, 193–208. [Google Scholar] [CrossRef] [PubMed]
- Treu, H.; Nordborg, M.; Cederberg, C.; Heuer, T.; Berndes, G. Carbon footprints and land use of conventional and organic diets in Germany. J. Clean. Prod. 2017, 161, 127–142. [Google Scholar] [CrossRef]
- Tricase, C.; Lamonaca, E.; Ingrao, C.; Bacenetti, J.; Lo Giudice, A. A comparative Life Cycle Assessment between organic and conventional barley cultivation for sustainable agriculture pathways. J. Clean. Prod. 2018, 172, 3747–3759. [Google Scholar] [CrossRef]
- Tuomisto, H.; Hodge, I.; Riordan, P.; Macdonald, D. Does organic farming reduce environmental impacts?—A meta-analysis of European research. J. Environ. Manag. 2012, 112, 309–320. [Google Scholar] [CrossRef] [PubMed]
- Engels, S.; Hansmann, R.; Scholz, R. Toward a sustainability label for food products: An analysis of experts’ and consumers’ acceptance. Ecol. Food Nutr. 2010, 49, 30–60. [Google Scholar] [CrossRef]
- Johansson, E.; Hussain, A.; Kuktaite, R.; Andersson, S.; Olsson, M. Contribution of organically grown crops to human health. Int. J. Environ. Res. Public Health 2014, 11, 3870–3893. [Google Scholar] [CrossRef] [PubMed]
- Nicolopoulou-Stamati, P.; Maipas, S.; Kotampas, C.; Stamatis, P.; Hens, L. Chemical pesticides and human health: The urgent need for a new concept in agriculture. Front. Public Health. 2016, 4, 148. [Google Scholar] [CrossRef] [PubMed] [Green Version]
- Probst, L.; Aigelsperger, L.; Hauser, M. Consumer attitudes towards vegetable attributes: Potential buyers of pesticide-free vegetables in Accra and Kumasi, Ghana. Ecol. Food Nutr. 2010, 49, 228–245. [Google Scholar] [CrossRef] [PubMed]
- Saba, A.; Messina, F. Attitudes towards organic foods and risk/benefit perception associated with pesticides. Food Qual. Prefer. 2003, 14, 637–645. [Google Scholar] [CrossRef]
- Schleifer, P.; Sun, Y. Reviewing the impact of sustainability certification on food security in developing countries. Glob. Food Sec. 2020, 24, 100337. [Google Scholar] [CrossRef]
- Jena, P.R.; Grote, U. Fairtrade certification and livelihood impacts on small-scale coffee producers in a tribal community of India. Appl. Econ. Perspect. Policy 2017, 39, 87–110. [Google Scholar] [CrossRef]
- Karki, S.K.; Jena, P.R.; Grote, U. Fair trade certification livelihoods: A panel data analysis of coffee-growing households in India. Agric. Econ. 2016, 45, 436–458. [Google Scholar] [CrossRef] [Green Version]
- Maertens, M.; Swinnen, J.F. Trade, standards, and poverty: Evidence from Senegal. World Dev. 2009, 37, 161–178. [Google Scholar] [CrossRef] [Green Version]
- Blackman, A.; Rivera, J. Producer-Level Benefits of Sustainability Certification. Conserv. Biol. 2011, 25, 1176–1185. [Google Scholar] [CrossRef]
- Beghin, J.C.; Maertens, M.; Swinnen, J. Nontariff measures and standards in trade and global value chains. Annu. Rev. Resour. Econ. 2015, 7, 1–26. [Google Scholar] [CrossRef] [Green Version]
- Bray, J.G.; Neilson, J. Reviewing the impacts of coffee certification programmes on smallholder livelihoods. Int. J. Biodivers. Sci. Ecosyst. Serv. Manag. 2017, 13, 216–232. [Google Scholar] [CrossRef]
- DeFries, R.S.; Fanzo, J.; Mondal, P.; Remans, R.; Wood, S.A. Is voluntary certification of tropical agricultural commodities achieving sustainability goals for small-scale producers? A review of the evidence. Environ. Res. Lett. 2017, 12, 033001. [Google Scholar] [CrossRef] [Green Version]
- Oya, C.; Schaefer, F.; Skalidou, D. The effectiveness of agricultural certification in developing countries: A systematic review. World Dev. 2018, 112, 282–312. [Google Scholar] [CrossRef]
- Meemken, E.M. Do smallholder farmers benefit from sustainability standards? A systematic review and meta-analysis. Glob. Food Secur. 2020, 26, 100373. [Google Scholar] [CrossRef]
- Schuster, M.; Maertens, M. Do private standards benefit workers in horticultural export chains in Peru? J. Clean. Prod. 2016, 112, 2392–2406. [Google Scholar] [CrossRef]
- Mitiku, F.; De Mey, Y.; Nyssen, J.; Maertens, M. Do private sustainability standards contribute to income growth and poverty alleviation? A comparison of different coffee certification schemes in Ethiopia. Sustainability 2017, 9, 246. [Google Scholar] [CrossRef] [Green Version]
- Valkila, J. Fair Trade organic coffee production in Nicaragua—Sustainable development or a poverty trap? Ecol. Econ. 2009, 68, 3018–3025. [Google Scholar] [CrossRef]
- Beuchelt, T.D.; Zeller, M. Profits and poverty: Certification’s troubled link for nicaragua's organic and fair-trade coffee producers. Ecol. Econ. 2011, 70, 1316–1324. [Google Scholar] [CrossRef]
- Ruben, R.; Sfez, P.; Pensioen, T.; Meneses, N. Análisis Integral de la Cadena de Valor del Café en Honduras: Informe Final; Wageningen University & Research: Wageningen, The Netherlands, 2018. [Google Scholar]
- Teuber, R. Café de Marcala—Honduras’ GI Approach to Achieving Reputation in the Coffee Market. Estey Cent. J. Int. Law Trade Policy 2009, 10, 131–148. [Google Scholar]
- Herrell, K.; Tewari, R.; Mehlhorn, J. Honduran Coffee Trade: Economic Effects of Fair Trade Certification On Individual Producers. In Proceedings of the Annual Meeting, Mobile, Al, USA, 4–7 February 2017; Southern Agricultural Economics Association: Cambridge, MA, USA, 2017. [Google Scholar]
- Bentley, J.; Baker, P.; Aristizábal, L.; Campos, O.; Chilán, W.; García, A.; Muñoz, R.; Gálvez, R.; Larco, A.; Mejía, C. Manual for Collaborative Research with Smallholder Coffee Farmers; CABI Commodities: Boston, MA, USA, 2002. [Google Scholar]
- Peligros, C.; Sevilla, J.; Uña-Juarez, O. Importance of Crop Altitude Range for Coffee Production: Findings from Honduras. J. Agric. Sci. Technol. 2018, 8, 1–13. [Google Scholar] [CrossRef] [Green Version]
- Perfect Daily Grind. Proceso 101: Lavado, Natural y Honey Producción de Café. 19 August 2016, PDG Español. Available online: https://perfectdailygrind.com/es/2016/08/19/proceso-101-lavado-natural-y-honey-produccion-de-cafe-articulo-del-mes/ (accessed on 9 June 2022).
- European Agency for Safety and Health at Work (EU-OSHA). Available online: https://osha.europa.eu/es/themes/musculoskeletal-disorders (accessed on 21 March 2022).
- Kumaraveloo, K.S.; Lunner, C. Agriculture and musculoskeletal disorders in low- and middle-income countries. J. Agromed. 2018, 23, 227–248. [Google Scholar] [CrossRef]
- Benos, L.; Tsaopoulos, D.; Bochtis, D. A review on ergonomics in agriculture. part II: Mechanized operations. Appl. Sci. 2020, 10, 3484. [Google Scholar] [CrossRef]
- Bureau of Labor Statistics. Available online: https://www.bls.gov/news.release/archives/osh2_11192015.pdf (accessed on 27 March 2022).
- Leigh, J.P.; Sheetz, R.M. Prevalence of back pain among fulltime United States workers. Br. J. Ind. Med. 1989, 46, 651–657. [Google Scholar] [CrossRef] [PubMed] [Green Version]
- Walker-Bone, K.; Palmer, K.T. Musculoskeletal disorders in farmers and farm workers. Occup. Med. 2002, 52, 441–450. [Google Scholar] [CrossRef] [PubMed] [Green Version]
- McMillan, M.; Trask, C.; Dosman, J.; Hagel, L.; Pickett, W.; for the Saskatchewan Farm Injury Cohort Study Team. Prevalence of Musculoskeletal Disorders Among Saskatchewan Farmers. J. Agromed. 2015, 20, 292–301. [Google Scholar] [CrossRef] [PubMed]
- Peláez, S.; Quintana, L. Assessment of muscular activity and postural load during coffee harvesting activities–A case study. Ing. Univ. 2020, 24, 1–10. [Google Scholar] [CrossRef]
- Peláez-Gómez, S.A.; Rodríguez-Cheu, L.E. Análisis biomecánico en la actividad de recolección café en Colombia. Rev. UIS Ing. 2021, 20, 167–177. [Google Scholar] [CrossRef]
- Ardiansyah, K. Determinan Gangguan Muskuloskeletal Pada Pemetik Kopi Di Kabupaten Lumajang. J. Ind. Hyg. Occup. Health 2020, 4, 32–41. [Google Scholar]
- Côté, P.; Van der Velde, G.; David, J.; Carroll, L.J.; Hogg-Johnson, S.; Holm, L.W.; Carragee, E.J.; Haldeman, S.; Nordin, M.; Hurwitz, E.L.; et al. The Burden and Determinants of Neck Pain in Workers. Eur. Spine J. 2008, 17, 60–74. [Google Scholar] [CrossRef] [Green Version]
- Karahan, A.; Kav, S.; Abbasoglu, A.; Dogan, N. Low back pain: Prevalence and associated risk factors among hospital staff. J. Adv. Nurs. 2009, 65, 516–524. [Google Scholar] [CrossRef]
- Vandergrift, J.L.; Gold, J.E.; Hanlon, A.; Punnett, L. Physical and psychosocial ergonomic risk factors for low back pain in automobile manufacturing workers. r low back pain in automobile manufacturing workers. Occup. Environ. Med. 2012, 69, 29–34. [Google Scholar] [CrossRef] [PubMed]
- Coenen, P.; Gouttebarge, V.; Van Der Burght, A.S.A.M.; Van Dieën, J.H.; Frings-Dresen, M.H.W.; Van Der Beek, A.J.; Burdorf, A. The effect of lifting during work on low back pain: A health impact assessment based on a meta-analysis. Occup. Environ. Med. 2014, 71, 871–877. [Google Scholar] [CrossRef] [PubMed] [Green Version]
- Burström, L.; Nilsson, T.; Wahlström, J. Whole-body vibration and the risk of low back pain and sciatica: A systematic review and meta-analysis. Int. Arch. Occup. Environ. Health 2015, 88, 403–418. [Google Scholar] [CrossRef] [PubMed]
- McBride, D.; Paulin, S.; Herbison, G.P.; Waite, D.; Bagheri, N. Low back and neck pain in locomotive engineers exposed to whole-body vibration. Arch. Environ. Occup. Health 2014, 69, 207–213. [Google Scholar] [CrossRef]
- De Lima, E.; Santos, T.O.; Higino, W.P.; de Souza, R.A.; da Silva, F.F. Electromyograpic activity of the abdominal and paravertebral muscles during coffee harvesting. Rev. Bras. Med. Esporte 2020, 26, 225–229. [Google Scholar] [CrossRef]
- EDE Consulting. PPP-Project: Sustainable Coffee Production and Support of Community Development in San Juan, Intibucá—Honduras. 2007. Available online: https://www.coffee-partners.org/wp-content/uploads/2021/05/ICP-Honduras-Intibuca-Final-Report.pdf (accessed on 28 March 2022).
- World Health Organization. Obesity and Overweight. 9 June 2021. Available online: https://www.who.int/news-room/fact-sheets/detail/obesity-and-overweight (accessed on 9 June 2022).
- Kuorinka, I.; Jonsson, B.; Kilbom, A.; Vinterberg, H.; Biering-Sørensen, F.; Andersson, G.; Jørgensen, K. Standardised Nordic questionnaires for the analysis of musculoskeletal symptoms. Appl. Ergon. 1987, 18, 233–237. [Google Scholar] [CrossRef]
- Li, G.; Buckle, P. A practical method for the assessment of work-related musculoskeletal risks—Quick Exposure Check (QEC). In Proceedings of the Human Factors and Ergonomics Society Annual Meeting; Sage: Los Angeles, CA, USA, 1998; Volume 42, pp. 1351–1355. [Google Scholar] [CrossRef] [Green Version]
- David, G.; Woods, V.; Li, G.; Buckle, P. The development of the Quick Exposure Check (QEC) for assessing exposure to risk factors for work-related musculoskeletal disorders. Appl. Ergon. 2008, 39, 57–69. [Google Scholar] [CrossRef]
- Ozcan, E.; Kesiktas, N.; Alptekin, K.; Ozcan, E.E. The reliability of Turkish translation of Quick Exposure Check (QEC) for risk assessment of work related musculoskeletal disorders. J. Back Musculoskelet. Rehabil. 2008, 21, 51–56. [Google Scholar] [CrossRef]
- Henry, L.J.; Jafarzadeh, A.; Ramli, A.; Ishak, I.; Justine, M.; Mohan, V. Patterns of work-related musculoskeletal disorders among workers in palm plantation occupation. Asia Pac. J. Public Health 2015, 27, NP1785–NP1792. [Google Scholar] [CrossRef]
- Karimi, A.; Dianat, I.; Barkhordari, A.; Yusefzade, I.; Rohani-Rasaf, M. A multicomponent ergonomic intervention involving individual and organisational changes for improving musculoskeletal outcomes and exposure risks among dairy workers. Appl. Ergon. 2020, 88, 103159. [Google Scholar] [CrossRef]
- Ozdemir, F.; Toy, S. Evaluation of scapular dyskinesis and ergonomic risk level in office workers. Int. J. Occup. Saf. Ergon. 2021, 27, 1193–1198. [Google Scholar] [CrossRef]
- Bell, A.F.; Steele, J.R. Risk of musculoskeletal injury among cleaners during vacuuming. Ergonomics 2012, 55, 237–247. [Google Scholar] [CrossRef] [PubMed]
- Murty, M. Musculoskeletal disorders in endoscopy nursing. Gastroenterol. Nurs. 2010, 33, 354–361. [Google Scholar] [CrossRef]
- Park, H.S.; Kim, J.; Roh, H.L.; Namkoong, S. Analysis of the risk factors of musculoskeletal disease among dentists induced by work posture. J. Phys. Ther. Sci. 2015, 27, 3651–3654. [Google Scholar] [CrossRef] [PubMed] [Green Version]
- Rwamamara, R.; Simonsson, P. Self-compacting concrete use for construction work environment sustainability. J. Civ. Eng. Manag. 2012, 18, 724–734. [Google Scholar] [CrossRef] [Green Version]
- Madrid-Casaca, H.E. Estudio de riesgos ergonómicos y condiciones de trabajo decentes en la agroexportación de café hondureño. Ergon. Investig. Desarro. 2021, 3, 9–17. [Google Scholar] [CrossRef]
- Neubert, M.S.; Karukunchit, U.; Puntumetakul, R. Identification of influential demographic and work-related risk factors associated to lower extremity pain perception among rice farmers. Work 2017, 58, 489–498. [Google Scholar] [CrossRef] [PubMed]
- Juntaracena, K.; Neubert, M.S.; Puntumetakul, R. Effects of muddy terrain on lower extremity muscle activity and discomfort during the rice planting process. Int. J. Ind. Ergon. 2018, 66, 187–193. [Google Scholar] [CrossRef]
- Swangnetr, M.; Karukunchit, U.; Juntaracena, K.; Puntumetakul, R.; Gross, M.T.; Kaber, D.B. Relating Musculoskeletal and Disability Conditions of Occupation-Induced Musculoskeletal Disorders to Non-occupational Congenital Disabilities. Adv. Intell. Syst. 2016, 489, 65–73. [Google Scholar] [CrossRef]
- Swangnetr, M.; Kaber, D.B.; Puntumetakul, R.; Gross, M.T. Ergonomics-related risk identification and pain analysis for farmers involved in rice field preparation. Work 2014, 49, 63–71. [Google Scholar] [CrossRef] [Green Version]
- Hess, J.A.; Hecker, S.; Weinstein, M.; Lunger, M. A participatory ergonomics intervention to reduce risk factors for low-back disorders in concrete laborers. Appl. Ergon. 2004, 35, 427–441. [Google Scholar] [CrossRef] [PubMed]
- Barthwal, V.; Jain, S.; Babuta, A.; Jamir, C.; Sharma, A.K.; Mohan, A. Health impact assessment of Delhi's outdoor workers exposed to air pollution and extreme weather events: An integrated epidemiology approach. Environ. Sci. Pollut. Res. 2022, 29, 44746–44758. [Google Scholar] [CrossRef] [PubMed]
- Kim, K.H.; Martin, B.; Chaffin, D. Modelling of shoulder and torso perception of effort in manual transfer tasks. Ergonomics 2004, 47, 927–944. [Google Scholar] [CrossRef] [PubMed]
- Bhattacharyya, N.; Chakrabarti, D. Ergonomic basket design to reduce cumulative trauma disorder in tea leaf plucking operation. Work 2012, 41, 1234–1238. [Google Scholar] [CrossRef] [Green Version]
- ISO 11226:2000; Evaluation of Static Working Postures. ISO: Geneva, Switzerland, 2018. Available online: https://www.iso.org/standard/25573.html (accessed on 9 June 2022).
- Zare, M.; Biau, S.; Brunet, R.; Roquelaure, Y. Comparison of three methods for evaluation of work postures in a truck assembly plant. Ergonomics 2017, 60, 1551–1563. [Google Scholar] [CrossRef]
- ISO 11228-3:2007; Manual Handling—Part 3: Handling of Low Loads at High Frequency. ISO: Geneva, Switzerland, 2007. Available online: https://www.iso.org/standard/26522.html (accessed on 9 June 2022).
- Rhén, I.-M.; Mikael Forsman, M. Inter- and intra-rater reliability of the OCRA checklist method in video-recorded manual work tasks. Appl. Ergon. 2020, 84, 103025. [Google Scholar] [CrossRef]
- Knapik, G.G.; Marras, W.S. Spine loading at different lumbar levels during pushing and pulling. Ergonomics 2009, 52, 60–70. [Google Scholar] [CrossRef]
- National Institute for Occupational Safety and Health. Musculoskeletal Disorders and Workplace Factors—A Critical Review of Epidemiologic Evidence for Work-Related Musculoskeletal Disorders of the Neck, Upper Extremity, and Low Back. 1997. Available online: https://www.cdc.gov/niosh/docs/97-141/default.html (accessed on 9 June 2022).
- Momeni, Z.; Choobineh, A.; Razeghi, M.; Ghaem, H.; Azadian, F.; Daneshmandi, H. Work-related Musculoskeletal Symptoms among Agricultural Workers: A Cross-sectional Study in Iran. J. Agromed. 2020, 25, 339–348. [Google Scholar] [CrossRef]
- Dianat, I.; Afshari, D.; Sarmasti, N.; Sangdeh, M.S.; Azaddel, R. Work posture, working conditions and musculoskeletal outcomes in agricultural workers. Int. J. Ind. Ergon. 2020, 77, 102941. [Google Scholar] [CrossRef]
- Khan, M.I.; Bath, B.; Boden, C.; Adebayo, O.; Trask, C. The association between awkward working posture and low back disorders in farmers: A systematic review. J. Agromed. 2019, 24, 74–89. [Google Scholar] [CrossRef] [PubMed]
- Lowe, B.D.; Billotte, W.G.; Peterson, D.R. ASTM F48 Formation and Standards for Industrial Exoskeletons and Exosuits. ISE Trans. Occup. Ergon. Hum. Factors 2019, 7, 230–236. [Google Scholar] [CrossRef] [PubMed]


| Variables | N | % | |
|---|---|---|---|
| Gender | Female | 12 | 25.0 |
| Male | 36 | 75.0 | |
| Job type | Cutter | 23 | 47.9 |
| Picker | 17 | 35.4 | |
| Processor | 8 | 16.7 | |
| Daily working hours | <4 | 1 | 2.0 |
| 4 to 8 | 32 | 67.7 | |
| 9 to 12 | 15 | 31.3 | |
| >12 | 0 | 0.0 | |
| Working days per week | 1 to 2 | 0 | 0.0 |
| 3 to 4 | 2 | 4.2 | |
| 5 to 6 | 45 | 93.7 | |
| All days | 1 | 2.1 | |
| Smoker | Yes | 24 | 50.0 |
| No | 24 | 50.0 | |
| Alcohol drinker | Yes | 31 | 64.6 |
| No | 17 | 35.4 | |
| Job | Gender: | Female | Male |
| Cutter | 10 | 13 | |
| Picker | 1 | 16 | |
| Processor | 1 | 7 | |
| Variables | N | Mean | Standard Deviation | Median | Min | Max | |
|---|---|---|---|---|---|---|---|
| Age (years) | 20–29 | 5 | 44.5 | 10.7 | 44 | 21 | 71 |
| 30–39 | 12 | ||||||
| 40–49 | 14 | ||||||
| 50–59 | 13 | ||||||
| 60+ | 4 | ||||||
| Weight (kg) | 48 | 75.3 | 2.0 | 75.2 | 68.5 | 80.7 | |
| Height (m) | 48 | 1.66 | 0.02 | 1.66 | 1.62 | 1.70 | |
| Body mass index (kg/m2) | 48 | 27.4 | 0.8 | 27.5 | 24.6 | 29.3 | |
| Years of experience in the enterprise | 48 | 13.1 | 6.5 | 12 | 4 | 30 | |
| Years of experience on the job | 48 | 7.5 | 3.6 | 7 | 0 | 18 | |
| Exposure Factor | Exposure Level | |||
|---|---|---|---|---|
| Low | Moderate | High | Very High | |
| Back (static) | 8–14 | 16–22 | 24–28 | 30–40 |
| Back (moving) | 10–20 | 22–30 | 32–40 | 42–56 |
| Shoulder/arm | 10–20 | 22–30 | 32–40 | 42–56 |
| Wrist/hand | 10–20 | 22–30 | 32–40 | 42–56 |
| Neck | 4–6 | 8–10 | 12–14 | 16–18 |
| Driving | 1 | 4 | 9 | – |
| Vibration | 1 | 4 | 9 | – |
| Work pace | 1 | 4 | 9 | – |
| Stress | 1 | 4 | 9 | 16 |
| Body Region | Frequency and Percentage of Workers | |||||||||
|---|---|---|---|---|---|---|---|---|---|---|
| 0 Days | 1 to 7 Days | 8 to 30 Days | >30 Days | All Days | ||||||
| f | % | f | % | f | % | f | % | f | % | |
| Neck | 11 | 22.9 | 0 | 0.0 | 10 | 20.8 | 27 | 56.3 | 0 | 0.0 |
| Right shoulder | 3 | 6.3 | 1 | 2.1 | 12 | 25.0 | 32 | 66.7 | 0 | 0.0 |
| Left shoulder | 3 | 6.3 | 1 | 2.1 | 12 | 25.0 | 32 | 66.7 | 0 | 0.0 |
| Upper back | 1 | 2.1 | 1 | 2.1 | 11 | 22.9 | 35 | 72.9 | 0 | 0.0 |
| Right upper arm | 29 | 60.4 | 1 | 2.1 | 4 | 8.3 | 14 | 29.2 | 0 | 0.0 |
| Left upper arm | 31 | 64.6 | 1 | 2.1 | 4 | 8.3 | 12 | 25.0 | 0 | 0.0 |
| Lower back | 4 | 8.3 | 1 | 2.1 | 10 | 20.8 | 33 | 68.8 | 0 | 0.0 |
| Right forearm | 44 | 91.6 | 0 | 0.0 | 2 | 4.2 | 2 | 4.2 | 0 | 0.0 |
| Left forearm | 45 | 93.7 | 0 | 0.0 | 2 | 4.2 | 1 | 2.1 | 0 | 0.0 |
| Right wrist | 8 | 16.7 | 0 | 0.0 | 9 | 18.7 | 31 | 64.6 | 0 | 0.0 |
| Left wrist | 9 | 18.7 | 0 | 0.0 | 9 | 18.7 | 30 | 62.5 | 0 | 0.0 |
| Hip/buttocks | 48 | 100 | 0 | 0.0 | 0 | 0.0 | 0 | 0.0 | 0 | 0.0 |
| Right thigh | 48 | 100 | 0 | 0.0 | 0 | 0.0 | 0 | 0.0 | 0 | 0.0 |
| Left thigh | 47 | 97.9 | 0 | 0.0 | 0 | 0.0 | 1 | 2.1 | 0 | 0.0 |
| Right knee | 3 | 6.3 | 1 | 2.1 | 9 | 18.7 | 35 | 72.9 | 0 | 0.0 |
| Left knee | 4 | 8.3 | 1 | 2.1 | 9 | 18.7 | 34 | 70.8 | 0 | 0.0 |
| Right lower leg | 46 | 95.8 | 0 | 0.0 | 1 | 2.1 | 1 | 2.1 | 0 | 0.0 |
| Left lower leg | 46 | 95.8 | 0 | 0.0 | 1 | 2.1 | 1 | 2.1 | 0 | 0.0 |
| Right foot | 3 | 6.3 | 0 | 0.0 | 11 | 22.9 | 34 | 70.8 | 0 | 0.0 |
| Left foot | 3 | 6.3 | 0 | 0.0 | 11 | 22.9 | 34 | 70.8 | 0 | 0.0 |
| Body Region | Frequency and Percentage of Workers | ||||||
|---|---|---|---|---|---|---|---|
| Cutter (n = 23) | Picker (n = 17) | Processor (n = 8) | Total (n = 48) | ||||
| f | % | f | % | f | % | ||
| Neck | 15 | 65.2 | 9 | 52.9 | 3 | 37.5 | 27 |
| Right shoulder | 15 | 65.2 | 13 | 76.5 | 4 | 50.0 | 32 |
| Left shoulder | 15 | 65.2 | 13 | 76.5 | 4 | 50.0 | 32 |
| Upper back | 16 | 69.6 | 13 | 76.5 | 6 | 75.0 | 35 |
| Lower back | 14 | 60.9 | 13 | 76.5 | 6 | 75.0 | 33 |
| Right wrist | 16 | 69.6 | 9 | 52.9 | 6 | 75.0 | 31 |
| Left wrist | 16 | 69.6 | 9 | 52.9 | 5 | 62.5 | 30 |
| Right knee | 16 | 69.6 | 13 | 76.5 | 6 | 75.0 | 35 |
| Left knee | 16 | 69.6 | 13 | 76.5 | 5 | 62.5 | 34 |
| Right foot | 17 | 73.9 | 12 | 70.6 | 5 | 62.5 | 34 |
| Left foot | 17 | 73.9 | 12 | 70.6 | 5 | 62.5 | 34 |
| Body Region | Frequency of Workers | ||||||||||
|---|---|---|---|---|---|---|---|---|---|---|---|
| Smoker | Alcohol Drinker | Gender | Height (m) | Weight (kg) | Total | ||||||
| No | Yes | No | Yes | F | M | 1.60–1.65 | >1.65–1.70 | 65–75 | >75–85 | ||
| Neck | 14 | 13 | 9 | 18 | 7 | 20 | 13 | 14 | 15 | 12 | 27 |
| Right shoulder | 18 | 14 | 11 | 21 | 7 | 25 | 13 | 19 | 17 | 15 | 32 |
| Left shoulder | 18 | 14 | 11 | 21 | 7 | 25 | 13 | 19 | 17 | 15 | 32 |
| Upper back | 19 | 16 | 12 | 23 | 8 | 27 | 14 | 21 | 18 | 17 | 35 |
| Lower back | 18 | 15 | 11 | 22 | 7 | 26 | 12 | 21 | 17 | 16 | 33 |
| Right wrist | 16 | 15 | 12 | 19 | 8 | 23 | 13 | 18 | 18 | 13 | 31 |
| Left wrist | 16 | 14 | 12 | 18 | 8 | 22 | 13 | 17 | 17 | 13 | 30 |
| Right knee | 20 | 15 | 13 | 22 | 9 | 26 | 14 | 21 | 17 | 18 | 35 |
| Left knee | 20 | 14 | 13 | 21 | 9 | 25 | 13 | 21 | 16 | 18 | 34 |
| Right foot | 19 | 15 | 12 | 22 | 9 | 25 | 14 | 20 | 17 | 17 | 34 |
| Left foot | 19 | 15 | 12 | 22 | 9 | 25 | 14 | 20 | 17 | 17 | 34 |
| Total | 24 | 24 | 17 | 31 | 12 | 36 | 20 | 28 | 24 | 24 | |
| Body Region | 20–29 | 30–39 | 40–49 | 50–59 | 60+ | Total |
|---|---|---|---|---|---|---|
| Neck | 1 | 7 | 7 | 8 | 4 | 27 |
| Right shoulder | 1 | 8 | 9 | 10 | 4 | 32 |
| Left shoulder | 1 | 8 | 9 | 10 | 4 | 32 |
| Upper back | 1 | 8 | 12 | 10 | 4 | 35 |
| Lower back | 0 | 8 | 11 | 10 | 4 | 33 |
| Right wrist | 1 | 8 | 10 | 8 | 4 | 31 |
| Left wrist | 1 | 8 | 9 | 8 | 4 | 30 |
| Right knee | 1 | 8 | 12 | 10 | 4 | 35 |
| Left knee | 1 | 7 | 12 | 10 | 4 | 34 |
| Right foot | 1 | 8 | 11 | 10 | 4 | 34 |
| Left foot | 1 | 8 | 11 | 10 | 4 | 34 |
| Mean | 1 | 8 | 10 | 9 | 4 | 32 |
| Total, workers | 5 | 12 | 14 | 13 | 4 | 48 |
| Body Region | Job Type | Smoker | Alcohol Drinker | Gender | BMI level | Age Level |
|---|---|---|---|---|---|---|
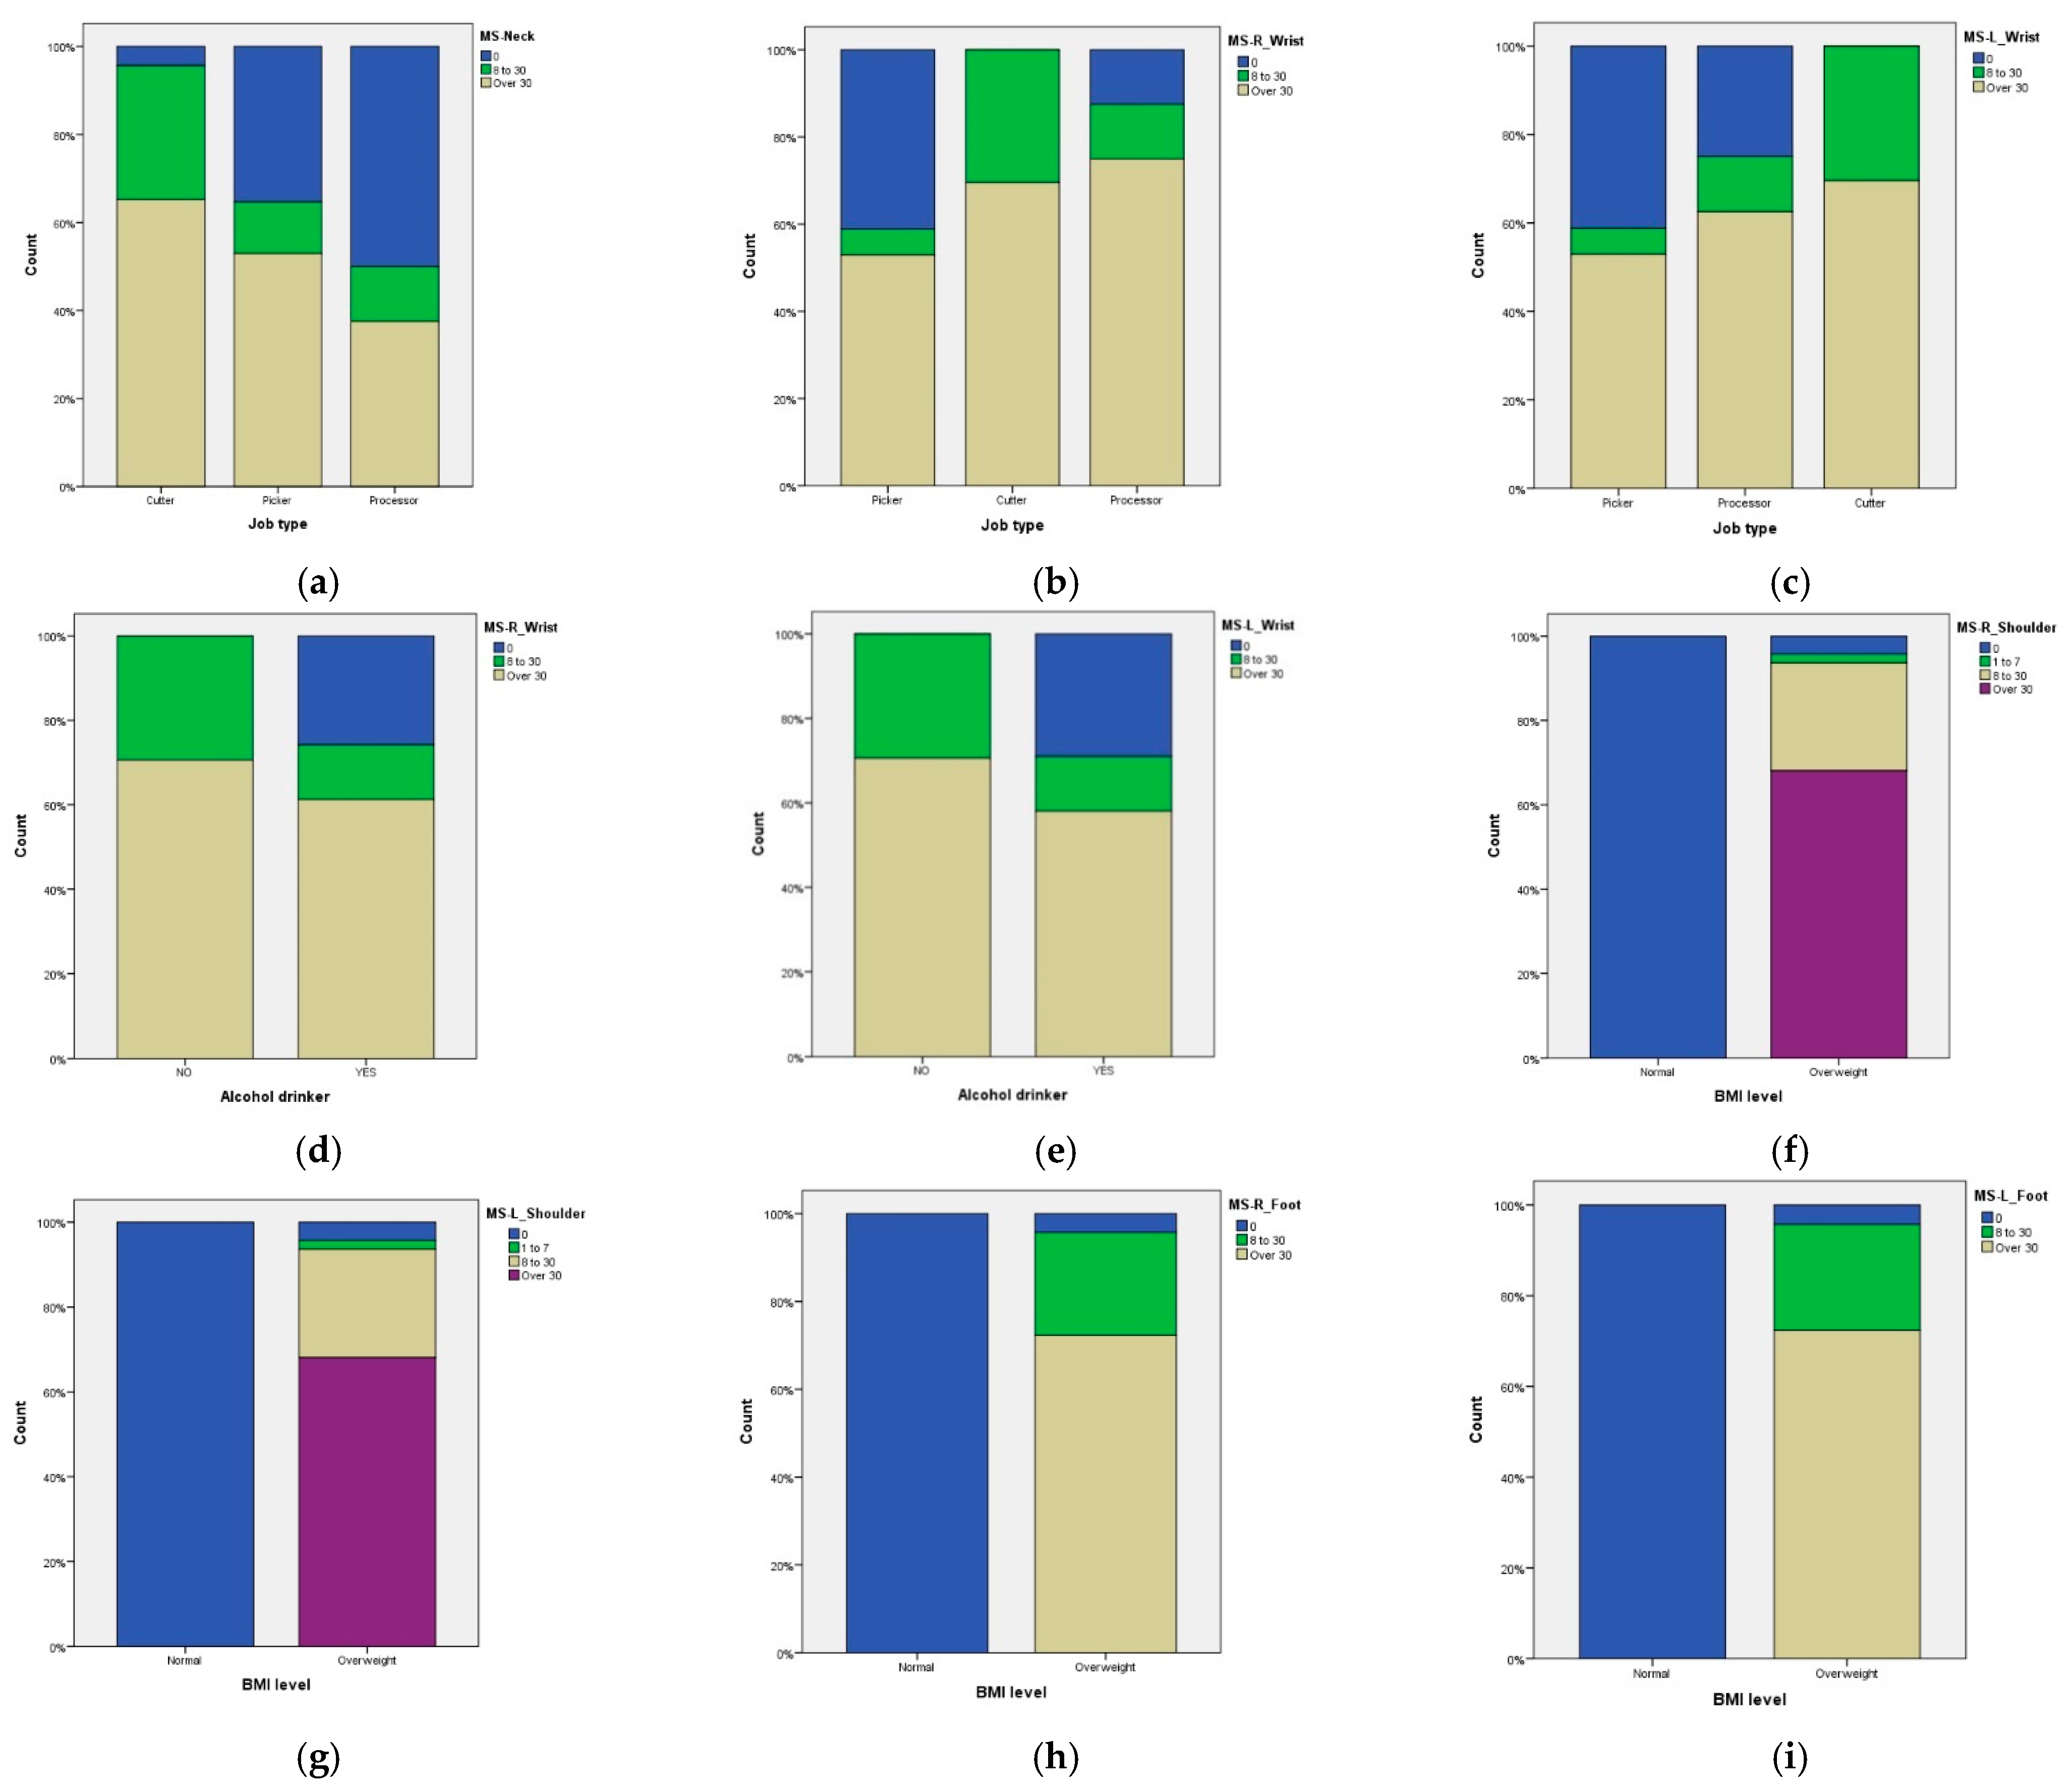
| Neck | 9.975 (0.041) * | 0.128 (0.938) | 1.300 (0.522) | 2.697 (0.260) | 3.435 (0.179) | 12.497 (0.130) |
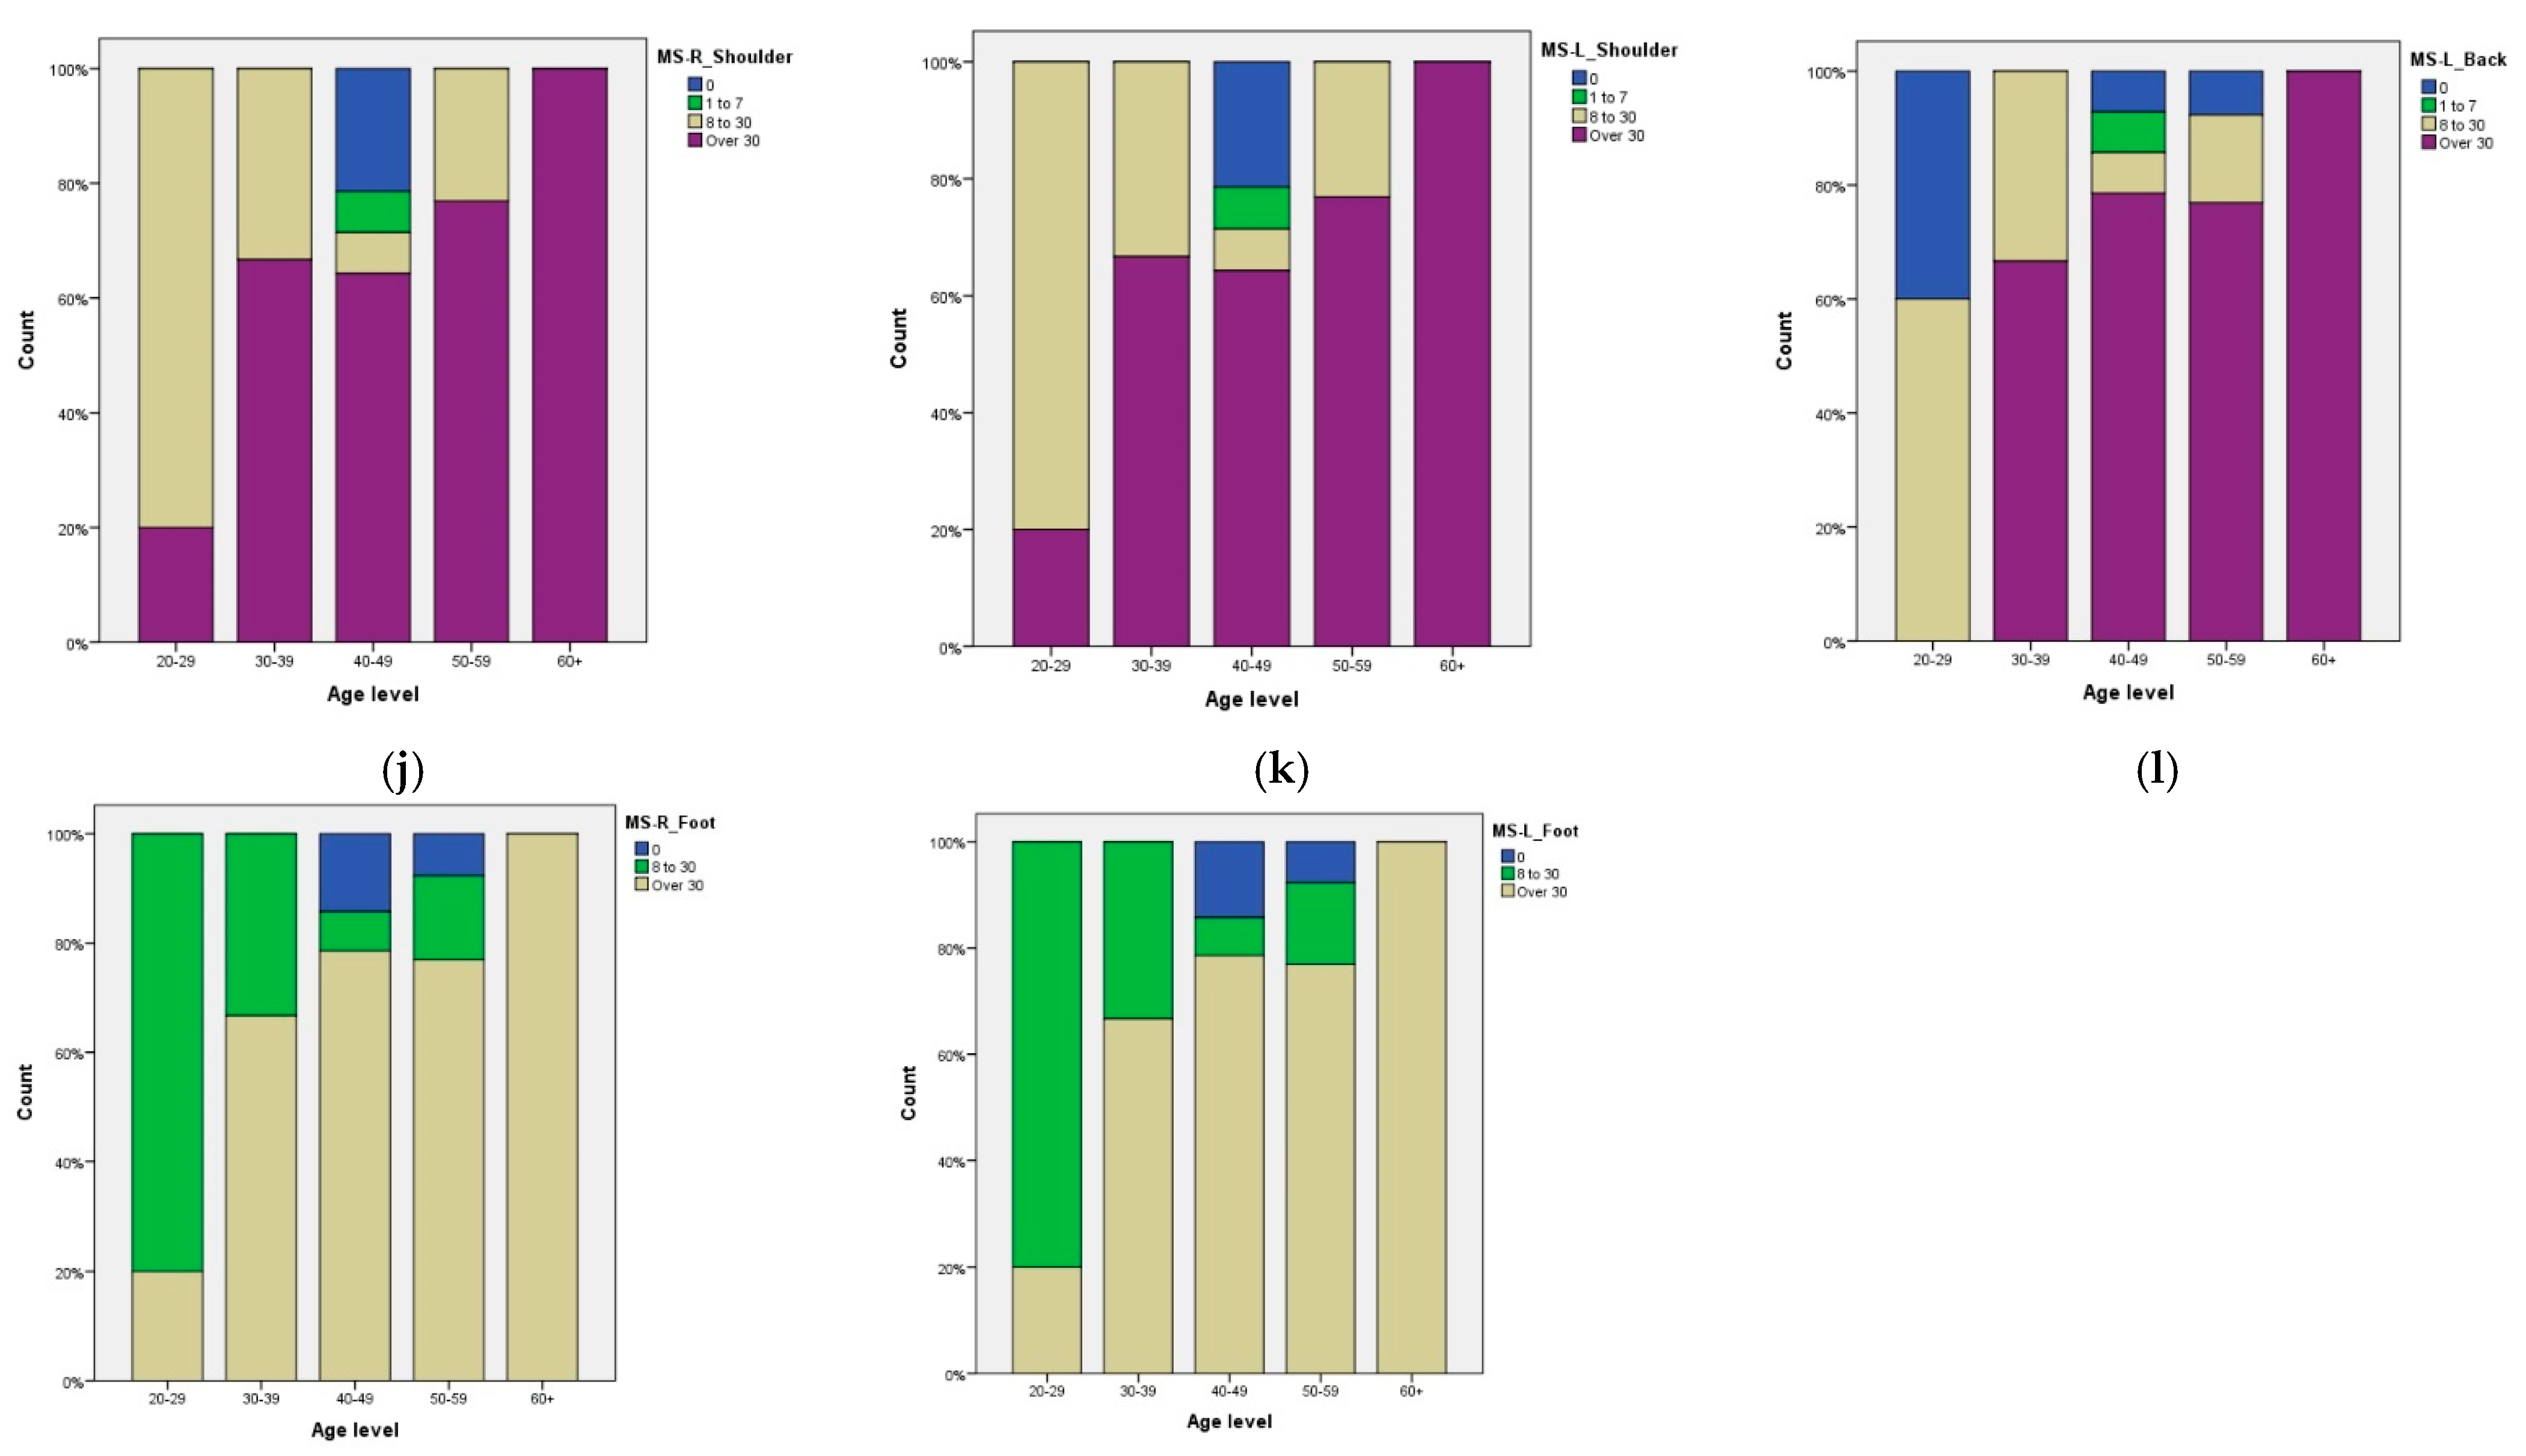
| Right shoulder | 8.744 (0.188) | 2.167 (0.539) | 0.774 (0.856) | 1.056 (0.788) | 15.319 (0.002) * | 21.420 (0.045) * |
| Left shoulder | 8.744 (0.188) | 2.167 (0.539) | 0.774 (0.856) | 1.056 (0.788) | 15.319 (0.002) * | 21.420 (0.045) * |
| Upper back | 3.302 (0.770) | 3.075 (0.380) | 2.396 (0.494) | 3.449 (0.327) | 0.379 (0.944) | 18.287 (0.107) |
| Lower back | 6.731 (0.346) | 1.673 (0.643) | 1.075 (0.783) | 2.053 (0.562) | 0.464 (0.927) | 21.005 (0.050) * |
| Right wrist | 13.966 (0.007) * | 0.643 (0.725) | 6.130 (0.047) * | 4.492 (0.106) | 0.560 (0.756) | 11.655 (0.167) |
| Left wrist | 12.814 (0.012) * | 1.244 (0.537) | 6.807 (0.033) | 4.859 (0.088) | 4.426 (0.109) | 11.841 (0.158) |
| Right knee | 5.354 (0.499) | 4.825 (0.185) | 2.560 (0.465) | 1.676 (0.642) | 0.379 (0.944) | 14.545 (0.267) |
| Left knee | 4.379 (0.625) | 6.170 (0.104) | 3.181 (0.365) | 2.039 (0.564) | 0.421 (0.936) | 15.448 (0.218) |
| Right foot | 3.196 (0.526) | 1.622 (0.444) | 0.010 (0.995) | 1.070 (0.586) | 15.319 (0.000) * | 15.759 (0.046) * |
| Left foot | 3.196 (0.526) | 1.622 (0.444) | 0.010 (0.995) | 1.070 (0.586) | 15.319 (0.000) * | 15.759 (0.046) * |
| Exposure Factor | Exposure Level | |||||||
|---|---|---|---|---|---|---|---|---|
| Low | Moderate | High | Very High | |||||
| f | % | f | % | f | % | f | % | |
| Back | 0 | 0.0 | 6 | 12.5 | 16 | 33.3 | 26 | 54.2 |
| Shoulder/arm | 0 | 0.0 | 2 | 4.2 | 21 | 43.8 | 25 | 52.1 |
| Wrist/hand | 1 | 2.1 | 14 | 29.2 | 32 | 66.7 | 1 | 2.1 |
| Neck | 0 | 0.0 | 8 | 16.7 | 13 | 27.1 | 27 | 56.3 |
| Driving | 35 | 72.9 | 10 | 20.8 | 3 | 6.3 | 0 | 0.0 |
| Vibration | 45 | 93.6 | 2 | 4.2 | 1 | 2.1 | 0 | 0.0 |
| Work pace | 19 | 39.6 | 28 | 58.3 | 1 | 2.1 | 0 | 0.0 |
| Stress | 4 | 8.3 | 35 | 72.9 | 5 | 10.4 | 4 | 8.3 |
| Exposure Factor | Exposure Level | |||||||
|---|---|---|---|---|---|---|---|---|
| Low | Moderate | High | Very High | |||||
| f | % | f | % | f | % | f | % | |
| Back | 0 | 0.0 | 6 | 26.1 | 14 | 60.9 | 3 | 13.0 |
| Shoulder/arm | 0 | 0.0 | 1 | 4.4 | 13 | 56.5 | 9 | 39.1 |
| Wrist/hand | 0 | 0.0 | 4 | 17.4 | 19 | 82.6 | 0 | 0.0 |
| Neck | 0 | 0.0 | 0 | 0.0 | 4 | 17.4 | 19 | 82.6 |
| Driving | 23 | 100 | 0 | 0.0 | 0 | 0.0 | 0 | 0.0 |
| Vibration | 23 | 100 | 0 | 0.0 | 0 | 0.0 | 0 | 0.0 |
| Work pace | 12 | 52.2 | 11 | 47.8 | 0 | 0.0 | 0 | 0.0 |
| Stress | 3 | 13.0 | 15 | 65.2 | 1 | 4.4 | 4 | 17.4 |
| Exposure Factor | Exposure Level | |||||||
|---|---|---|---|---|---|---|---|---|
| Low | Moderate | High | Very High | |||||
| f | % | f | % | f | % | f | % | |
| Back | 0 | 0.0 | 0 | 0.0 | 1 | 5.9 | 16 | 94.1 |
| Shoulder/arm | 0 | 0.0 | 0 | 0.0 | 4 | 23.5 | 13 | 76.5 |
| Wrist/hand | 0 | 0.0 | 6 | 35.3 | 10 | 58.8 | 1 | 5.9 |
| Neck | 0 | 0.0 | 5 | 29.4 | 6 | 35.3 | 6 | 35.3 |
| Driving | 6 | 35.3 | 8 | 47.1 | 3 | 17.7 | 0 | 0.0 |
| Vibration | 15 | 88.2 | 1 | 5.9 | 1 | 5.9 | 0 | 0.0 |
| Work pace | 3 | 17.7 | 13 | 76.5 | 1 | 5.9 | 0 | 0.0 |
| Stress | 0 | 0.0 | 15 | 88.2 | 2 | 11.8 | 0 | 0.0 |
| Exposure Factor | Exposure Level | |||||||
|---|---|---|---|---|---|---|---|---|
| Low | Moderate | High | Very High | |||||
| f | % | f | % | f | % | f | % | |
| Back | 0 | 0.0 | 0 | 0.0 | 1 | 12.5 | 7 | 87.5 |
| Shoulder/arm | 0 | 0.0 | 1 | 12.5 | 4 | 50.0 | 3 | 37.5 |
| Wrist/hand | 1 | 12.5 | 4 | 50.0 | 3 | 37.5 | 0 | 0.0 |
| Neck | 0 | 0.0 | 3 | 37.5 | 3 | 37.5 | 2 | 25.0 |
| Driving | 6 | 75.0 | 2 | 25.0 | 0 | 0.0 | 0 | 0.0 |
| Vibration | 7 | 87.5 | 1 | 12.5 | 0 | 0.0 | 0 | 0.0 |
| Work pace | 4 | 50.0 | 4 | 50.0 | 0 | 0.0 | 0 | 0.0 |
| Stress | 1 | 12.5 | 5 | 62.5 | 2 | 25.0 | 0 | 0.0 |
| Body Region | Exposure Factor | |||||||
|---|---|---|---|---|---|---|---|---|
| Musculoskeletal Symptoms | Back | Shoulder/Arm | Wrist/Hand | Neck | Driving | Vibration | Work Pace | Stress |
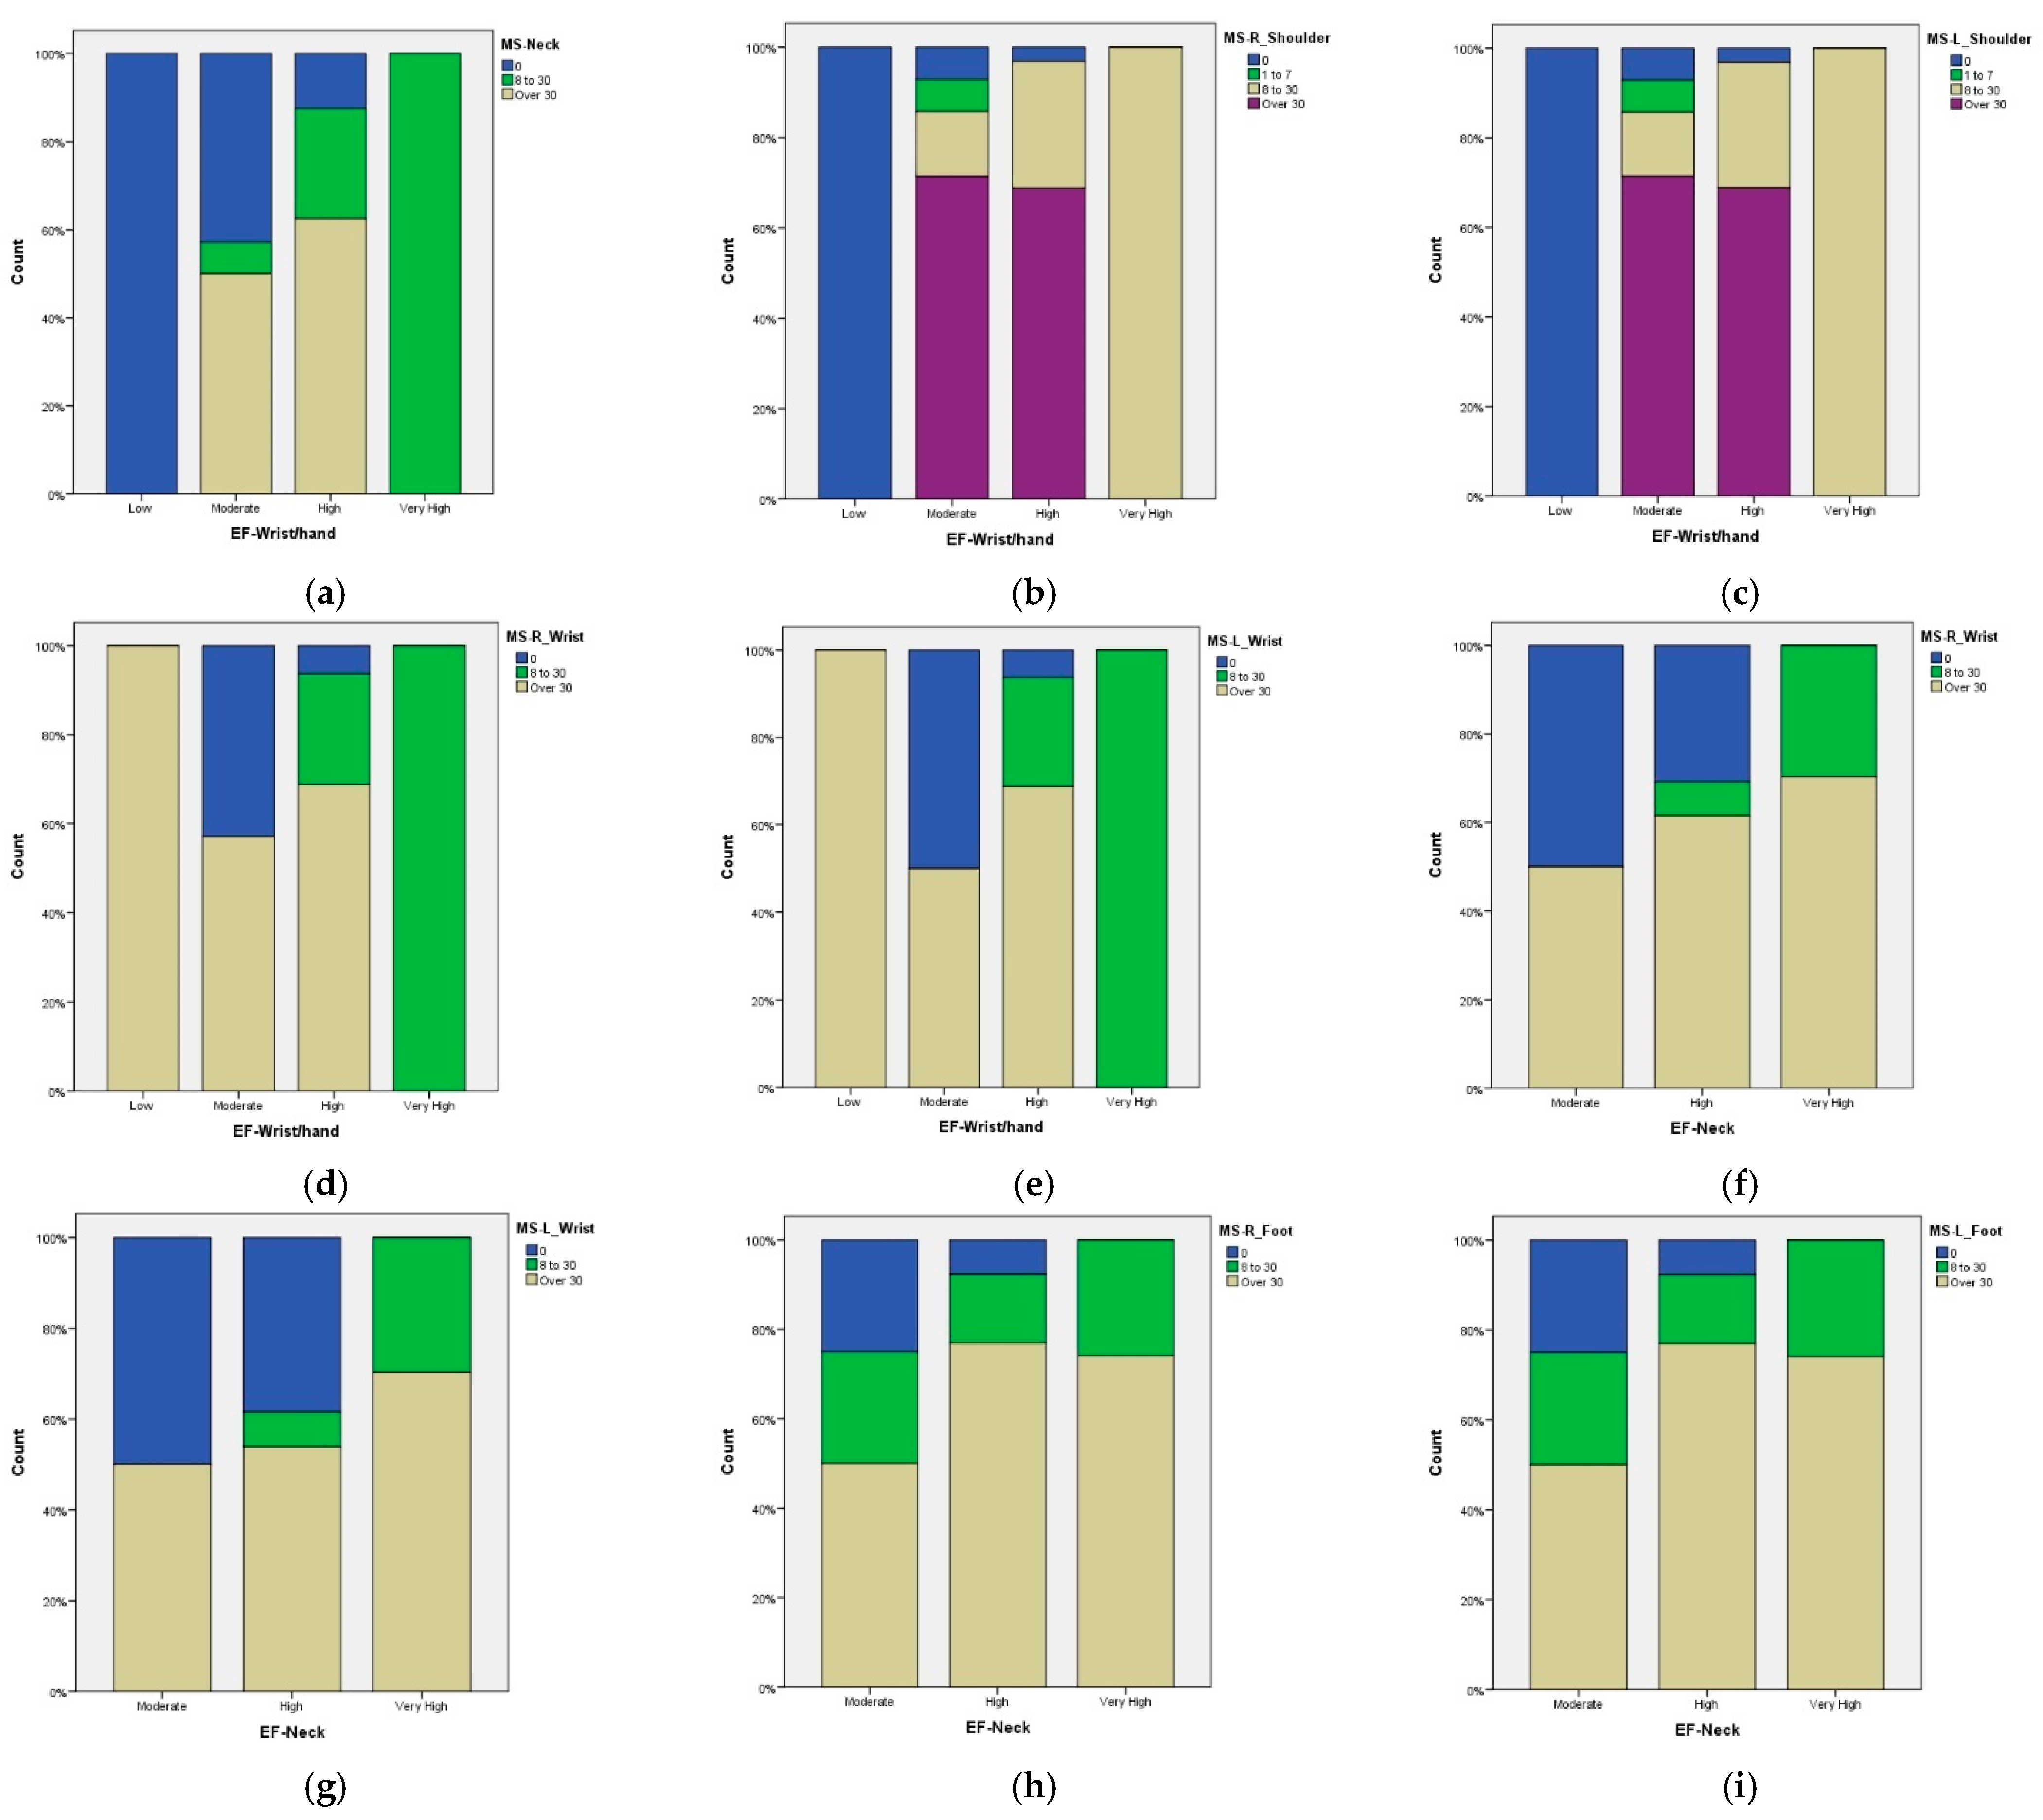
| Neck | 4.841 (0.304) | 1.387 (0.846) | 12.954 (0.044) * | 10.609 (0.101) | 4.794 (0.309) | 1.903 (0.754) | 2.084 (0.720) | 5.925 (0.432) |
| Right shoulder | 3.499 (0.751) | 6.470 (0.373) | 21.741 (0.010) * | 11.549 (0.240) | 2.229 (0.898) | 1.272 (0.973) | 7.098 (0.312) | 5.550 (0.784) |
| Left shoulder | 3.449 (0.751) | 6.470 (0.373) | 21.741 (0.010) * | 11.549 (0.240) | 2.229 (0.898) | 1.272 (0.973) | 7.098 (0.312) | 5.550 (0.784) |
| Upper back | 1.972 (0.922) | 3.659 (0.723) | 7.162 (0.620) | 9.425 (0.399) | 1.973 (0.922) | 1.258 (0.974) | 2.662 (0.850) | 2.513 (0.981) |
| Lower back | 2.459 (0.873) | 4.673 (0.586) | 7.026 (0.634) | 10.757 (0.293) | 3.372 (0.761) | 1.618 (0.951) | 2.586 (0.859) | 4.074 (0.906) |
| Right wrist | 4.748 (0.314) | 2.313 (0.678) | 16.225 (0.013) * | 19.045 (0.004) * | 3.603 (0.462) | 2.045 (0.727) | 1.065 (0.900) | 4.365 (0.627) |
| Left wrist | 5.794 (0.215) | 3.375 (0.497) | 18.733 (0.005) * | 19.809 (0.003) * | 5.554 (0.235) | 2.127 (0.712) | 1.752 (0.781) | 4.472 (0.613) |
| Right knee | 9.267 (0.159) | 6.455 (0.374) | 8.682 (0.467) | 13.542 (0.140) | 3.096 (0.797) | 1.764 (0.940) | 2.148 (0.906) | 3.583 (0.937) |
| Left knee | 6.612 (0.358) | 4.171 (0.654) | 9.252 (0.414) | 15.278 (0.084) | 3.529 (0.740) | 1.828 (0.935) | 2.575 (0.860) | 8.580 (0.477) |
| Right foot | 3.639 (0.457) | 1.463 (0.833) | 6.243 (0.397) | 12.513 (0.051) * | 1.863 (0.761) | 1.322 (0.858) | 1.388 (0.846) | 3.178 (0.786) |
| Left foot | 3.639 (0.457) | 1.463 (0.833) | 6.243 (0.397) | 12.513 (0.051) * | 1.863 (0.761) | 1.322 (0.858) | 1.388 (0.846) | 3.178 (0.786) |
Publisher’s Note: MDPI stays neutral with regard to jurisdictional claims in published maps and institutional affiliations. |
© 2022 by the authors. Licensee MDPI, Basel, Switzerland. This article is an open access article distributed under the terms and conditions of the Creative Commons Attribution (CC BY) license (https://creativecommons.org/licenses/by/4.0/).
Share and Cite
Estrada-Muñoz, C.; Madrid-Casaca, H.; Salazar-Sepúlveda, G.; Contreras-Barraza, N.; Iturra-González, J.; Vega-Muñoz, A. Musculoskeletal Symptoms and Assessment of Ergonomic Risk Factors on a Coffee Farm. Appl. Sci. 2022, 12, 7703. https://doi.org/10.3390/app12157703
Estrada-Muñoz C, Madrid-Casaca H, Salazar-Sepúlveda G, Contreras-Barraza N, Iturra-González J, Vega-Muñoz A. Musculoskeletal Symptoms and Assessment of Ergonomic Risk Factors on a Coffee Farm. Applied Sciences. 2022; 12(15):7703. https://doi.org/10.3390/app12157703
Chicago/Turabian StyleEstrada-Muñoz, Carla, Héctor Madrid-Casaca, Guido Salazar-Sepúlveda, Nicolás Contreras-Barraza, José Iturra-González, and Alejandro Vega-Muñoz. 2022. "Musculoskeletal Symptoms and Assessment of Ergonomic Risk Factors on a Coffee Farm" Applied Sciences 12, no. 15: 7703. https://doi.org/10.3390/app12157703