Article

Acoustic Roughness Measurement of Railway Tracks: Laboratory Investigation of External Disturbances on the Chord-Method with an Optical Measurement Approach

1
Institute for Machine Tools and Manufacturing, ETH Zürich, 8092 Zurich, Switzerland
2
Inspire AG, 8005 Zurich, Switzerland
*
Author to whom correspondence should be addressed.
Appl. Sci. 2022, 12(15), 7732; https://doi.org/10.3390/app12157732
Submission received: 13 July 2022 / Revised: 28 July 2022 / Accepted: 29 July 2022 / Published: 1 August 2022

Abstract

:

Featured Application

The rail roughness is to be measured optically to allow such a non-contact measuring system to be operated from the moving train.

Abstract

For acoustic roughness monitoring of the railway network at train travelling speed, new direct measurement methods are required. Common direct measurement methods need the blocking of track sections, as they are based on manually operated devices. Indirect measurement methods such as accelerometer or microphone measurements can be installed on the train, but require a conversion of the obtained measurement data to rail roughness. Optical measurement methods allow a direct measurement from the moving train, even at higher speeds, due to the contact-free nature of the measurement. This paper investigates the influence of various disturbances on the measurement result, which are expected on the train. The frequently used chord method deploying laser triangulation sensors is used. Four sensors are integrated into the setup, thus providing the possibility to combine the results from four chord methods. The measurements of the optical system are compared with a tactile measurement of METAS (Swiss Federal Institute of Metrology) on a test bench equipped with a reference rail segment. It is shown that dust and water on the rail have a significant influence in the range of small wavelengths. Displacements and tilting of the sensor array, as well as vibrations, can be compensated to a certain level by the chord method, while a single sensor is significantly disturbed. The combination of four different chord lengths and selection of the theoretically optimal method for each one-third octave band shows an improvement of the measurement result. Based on the observations made, recommendations for practical tests on the train are concluded.

1. Introduction

Prolonged exposure to traffic noise can have a significant impact on human health, as shown by Veber et al. [1] and Vienneau et al. [2]. Noise reduction is therefore of significant importance in the railway sector. According to Szwarc et al. [3], rolling noise is particularly responsible for noise generation in the speed range between 50   km   h 1   and 200   km   h 1 . The roughness of both the rail and the wheel is, according to Thompson et al. [4], directly related to the noise generated. In addition to acoustics, roughness and rail irregularities can have an impact on operational safety, as has been studied by Miri et al. [5]. Song et al. [6] have also shown that the pantograph-catenary system can be negatively affected by roughness, especially at higher driving speeds. Acoustic emissions of wheel-rail contact can be reduced by applying an acoustic rail grinding strategy, as described by Kuffa et al. [7]. Suitable measuring methods are needed to monitor the surfaces of both contact partners. Grassie [8] stated that the best optimization of the reprofiling process can be achieved by consistent monitoring of the objective quantity. To assess the rail roughness, the quantity of acoustic roughness defined in EN 15610 [9] is used. An extension of EN 15610 and a discussion on the numerical implementation for the optical measurement approach are summarized in detail by Mauz et al. [10].
Höjer et al. [11] provide an overview of the measuring methods used to determine rail roughness. A distinction is made between direct methods measuring the surface roughness directly and indirect methods, which are indicative of roughness. Most direct measuring devices available on the market are designed for manual operation, such as trolley devices described by Valigi et al. [12], and require a free track. Measurement devices that can be operated from a running train are usually based on indirect measurement methods. Kuijpers et al. [13] describe a system that records the noise development in the wheel area of a train with microphones, and derives a value for the roughness based on this data. Kuijpers et al. [13] describe the difficulties to determine a proper transfer function for roughness calculation. This depends on the characteristics of the track, the wheel roughness and the speed of the train. A comparable approach is implemented by Kendl et al. [14], with the sound measurement car of DB (Deutsche Bahn). The measured noise levels are calibrated using direct roughness measurements from a tactile reference measurement device. An alternative to noise measurements is to measure the acceleration of the axle box, as described by Lewis et al. [15]. Bocciolone et al. [16] discuss the difficulties to determine transfer functions, since the track properties have an influence on the measurement result. Bongini et al. [17] perform the calibration of the method utilizing a CAT (Corrugation Analysis Trolley) device. Another influencing factor is the vehicle itself. Dittrich et al. [18] state requirements for a reference vehicle for this purpose. Phamová et al. [19] show the dependence on the train velocity and poorer measurement results for sections which are classified as fine. Tufano et al. [20] point out the sensitivity of axle-box acceleration measurement methods to sensor bandwidth of the applied accelerometers as an additional limitation.
The chord method described by Grassie [21] is insensitive to speed, although the results of the individual sensors are influenced. Tanaka et al. [22] developed a trolley device based on the chord method. Naganuma et al. [23] implemented the chord method on a moving train based on inertial measurements. Wavelengths in the range of 5   m could be measured. Wang et al. [24], Jeong et al. [25] and Li et al. [26] investigated the possibility of using multiple sensors. They have shown that the combination of different chord methods in the same platform can increase the quality of the measurement result.
This paper focuses on a fully optical measurement method utilizing the chord method, and integrates several chords in the same setup. A fully optical approach would allow a speed-independent measurement and reduce further dependencies, such as on the track properties. The lack of a fixed reference system due to the movements of the vehicle is a relevant disturbance for this concept. Displacements and tilting of the measurement setup can influence the measurement. A system with four triangulation laser sensors is built and tested for subsequent use on the train under laboratory conditions. While a single chord with non-contact measurement requires three sensors, four sensors can consequently be used to evaluate four chords and achieve greater robustness. This paper shows the extent to which a measurement method with four sensors based on the chord method is robust against expected external influences.

2. Experimental Approach and Optimization
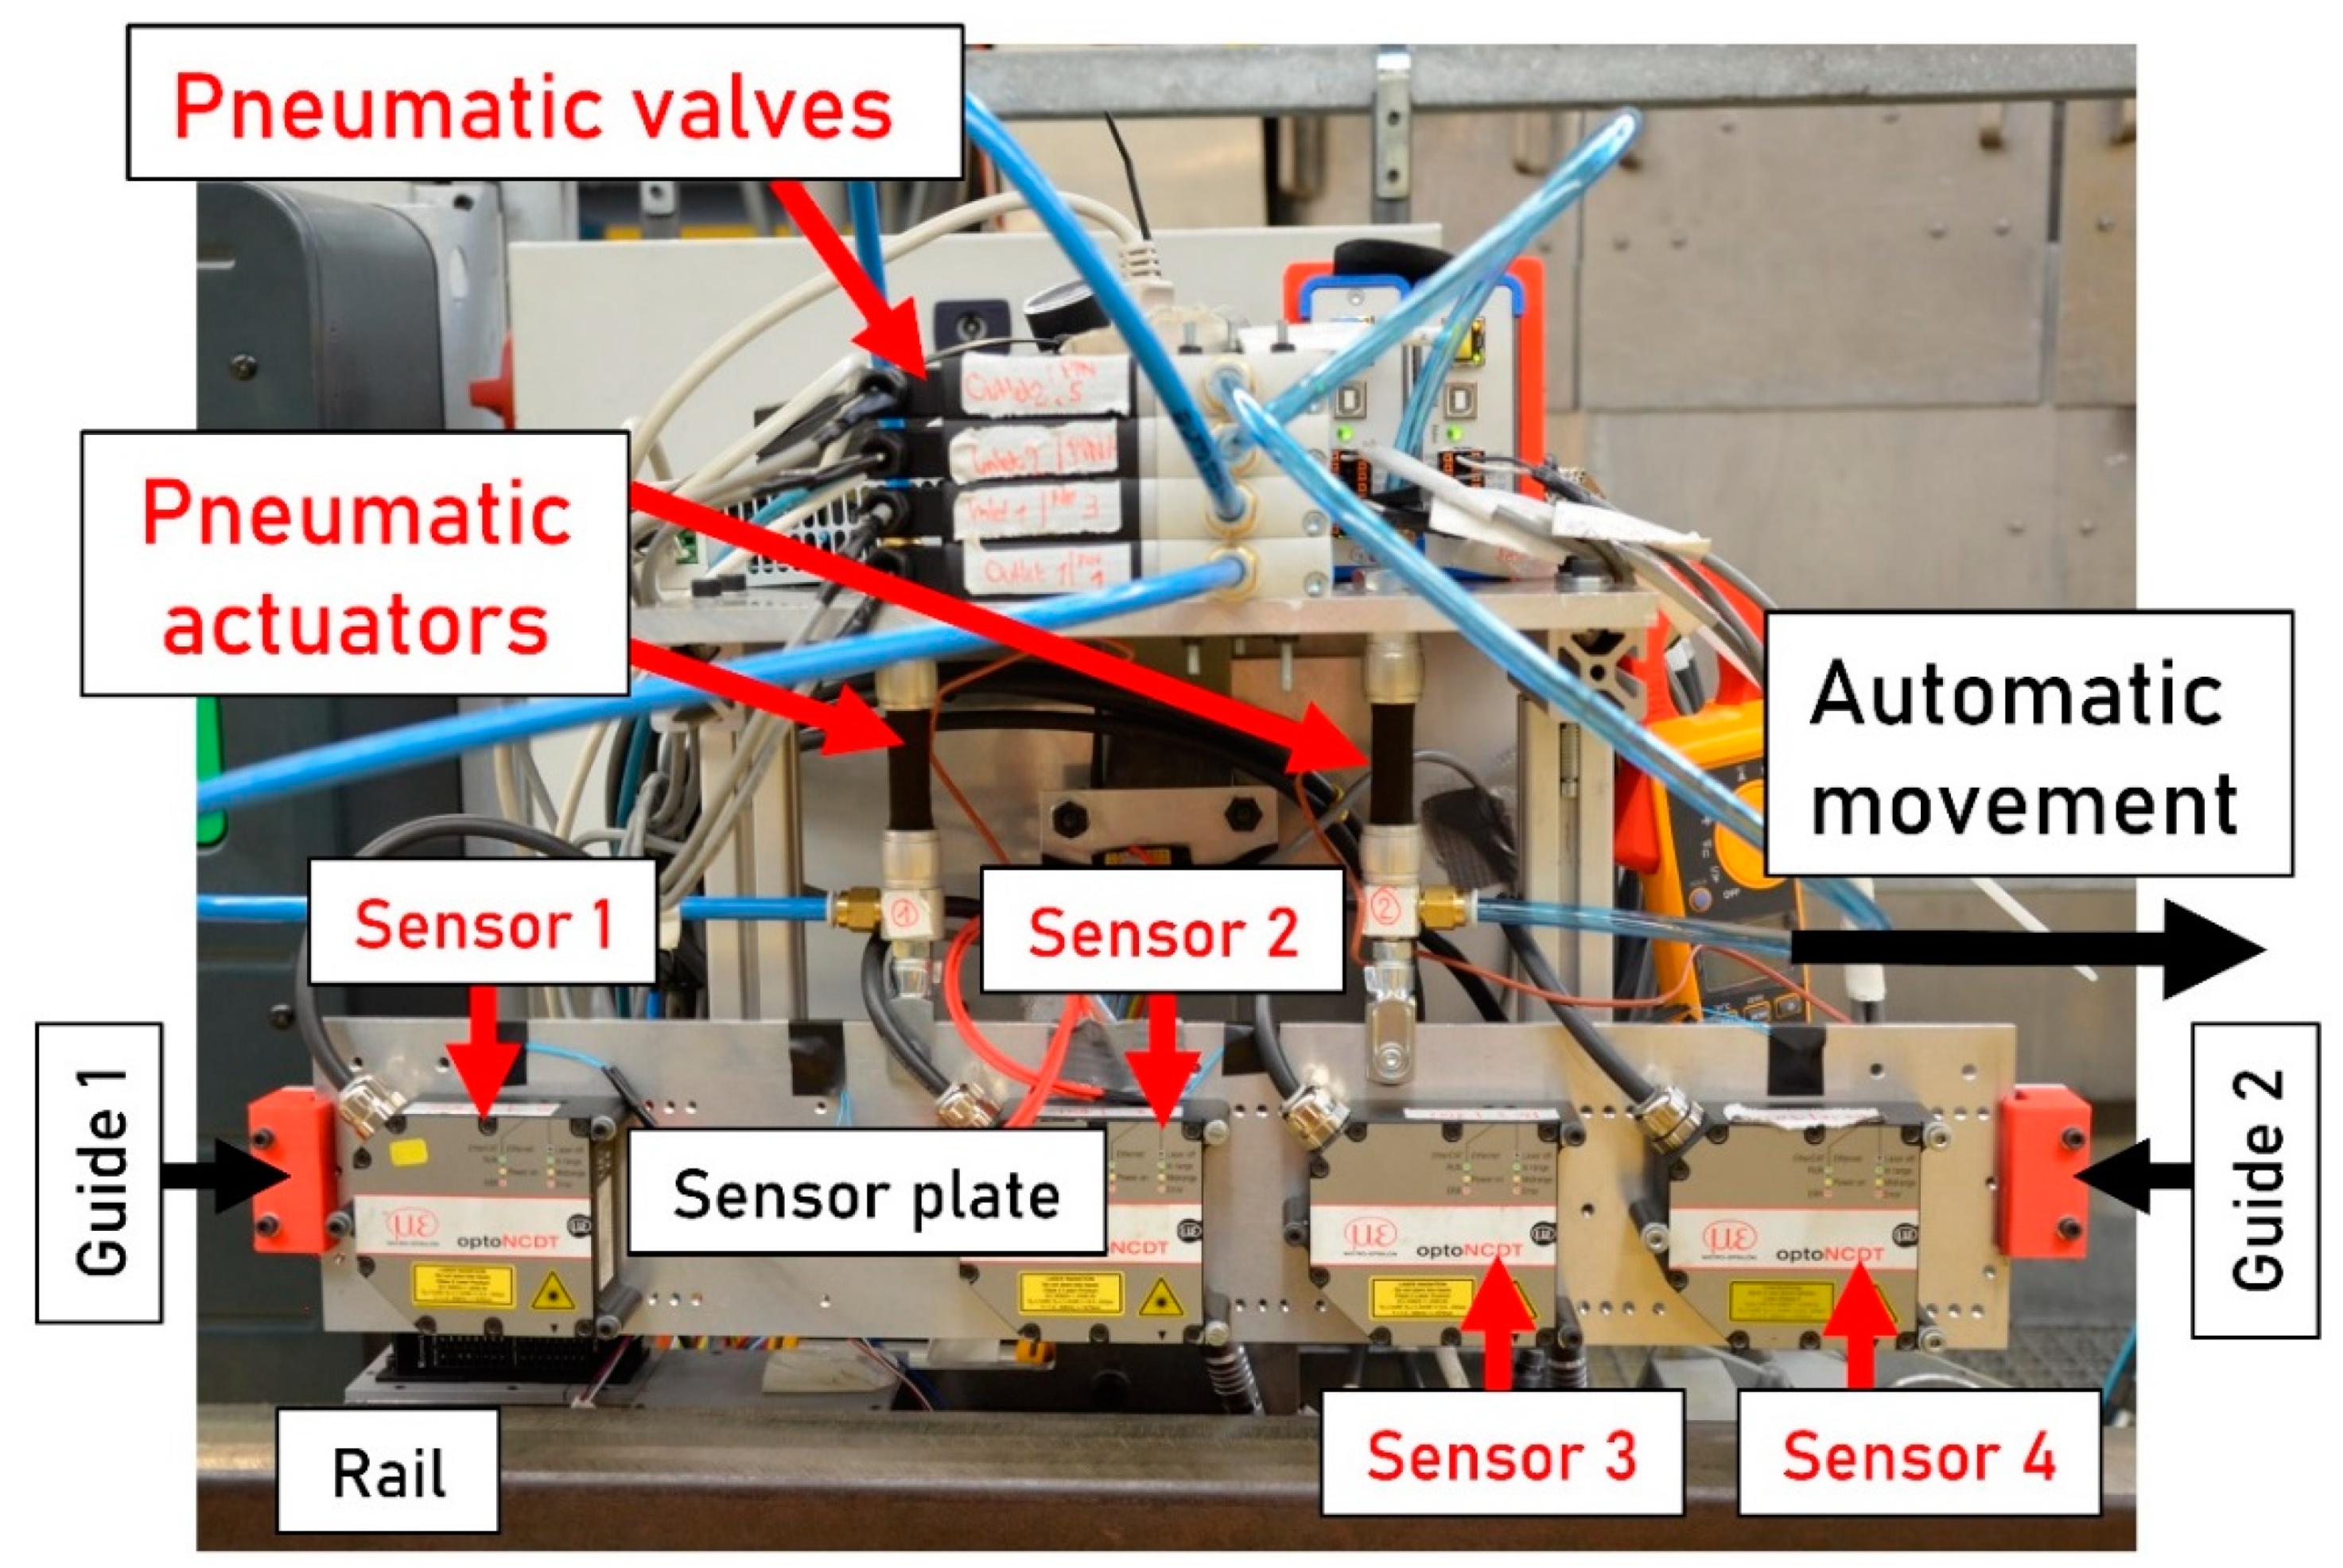
2.1. Setup

The identical experimental setup was used as the one described by Mauz et al. [10] and consisted of a reference rail of 3.3   m length tactilely measured by METAS (Swiss Federal Institute of Metrology) on two parallel longitudinal lines. The setup is shown in Figure 1. For the optical measurement, four Micro-Epsilon optoNCDT 2300-10LL laser triangulation sensors are mounted on a sensor plate. The sensor plate is connected to the slider via pneumatic actuators. The pneumatic actuators allow a defined vertical movement to be applied to the sensor plate. Guides restrict major lateral deflection during longitudinal movements of the slider. The arrangement is automatically moved along the rail by a linear drive with a velocity of 0.031   m   s 1 . The sampling distance of the measurements is adjusted to the METAS reference measurement via resampling. This results in a data point distance of 48   μ m . The four sensors record analog data in a range from 10   V to 10   V , with a sampling rate f S of 30   kHz . Analog signals from the sensors are recorded with an NI 9222 module within a cRIO-9045 from National Instruments using LabView. In addition, an encoder signal of a Leine Linde RSI 593 is recorded using an NI 9402 module to determine the position along the rail. The measurements are not triggered via the encoder.
The lateral position of the setup (track setting) was fixed while the longitudinal profile was measured. The regular sinusoidal lateral movement of the train, known as hunting oscillation, cannot be approximated with this setup. Each measurement is repeated three times. The experimentally obtained data and the data from the reference measurement were processed identically, as described by Mauz et al. [10]. Levels in decibels were calculated as described in EN 15610 [9]:
L = 10   log 10 ( r 2 r 0 2 )
L is the level in decibels, r is the value of roughness in micrometers and r 0 is the reference value of roughness with a value of 1   μ m . The peripheral areas (representing the ends of the rail) of the signal were removed to avoid interference with the chord method. A pre-filter is applied for the wavelength range from 3   mm to 500   mm . For the acoustic roughness, the averaged relative error in percent and the averaged absolute error are calculated for the spectrum from 3   mm to 400   mm . The absolute error was calculated as the difference between the reference and the respective measurement per one-third octave band. The averaged absolute error thus corresponds to the averaging of the deviation over all one-third octave bands of a spectrum.

2.2. Experiments

The measurement is influenced by various disturbances under laboratory conditions. Precise and useful measurements are desired under the following conditions:
  • Constant velocity: A measurement at constant velocity and without further disturbances is modelled. All measurements, with the exception of the acceleration and deceleration measurements, are performed at constant speed.
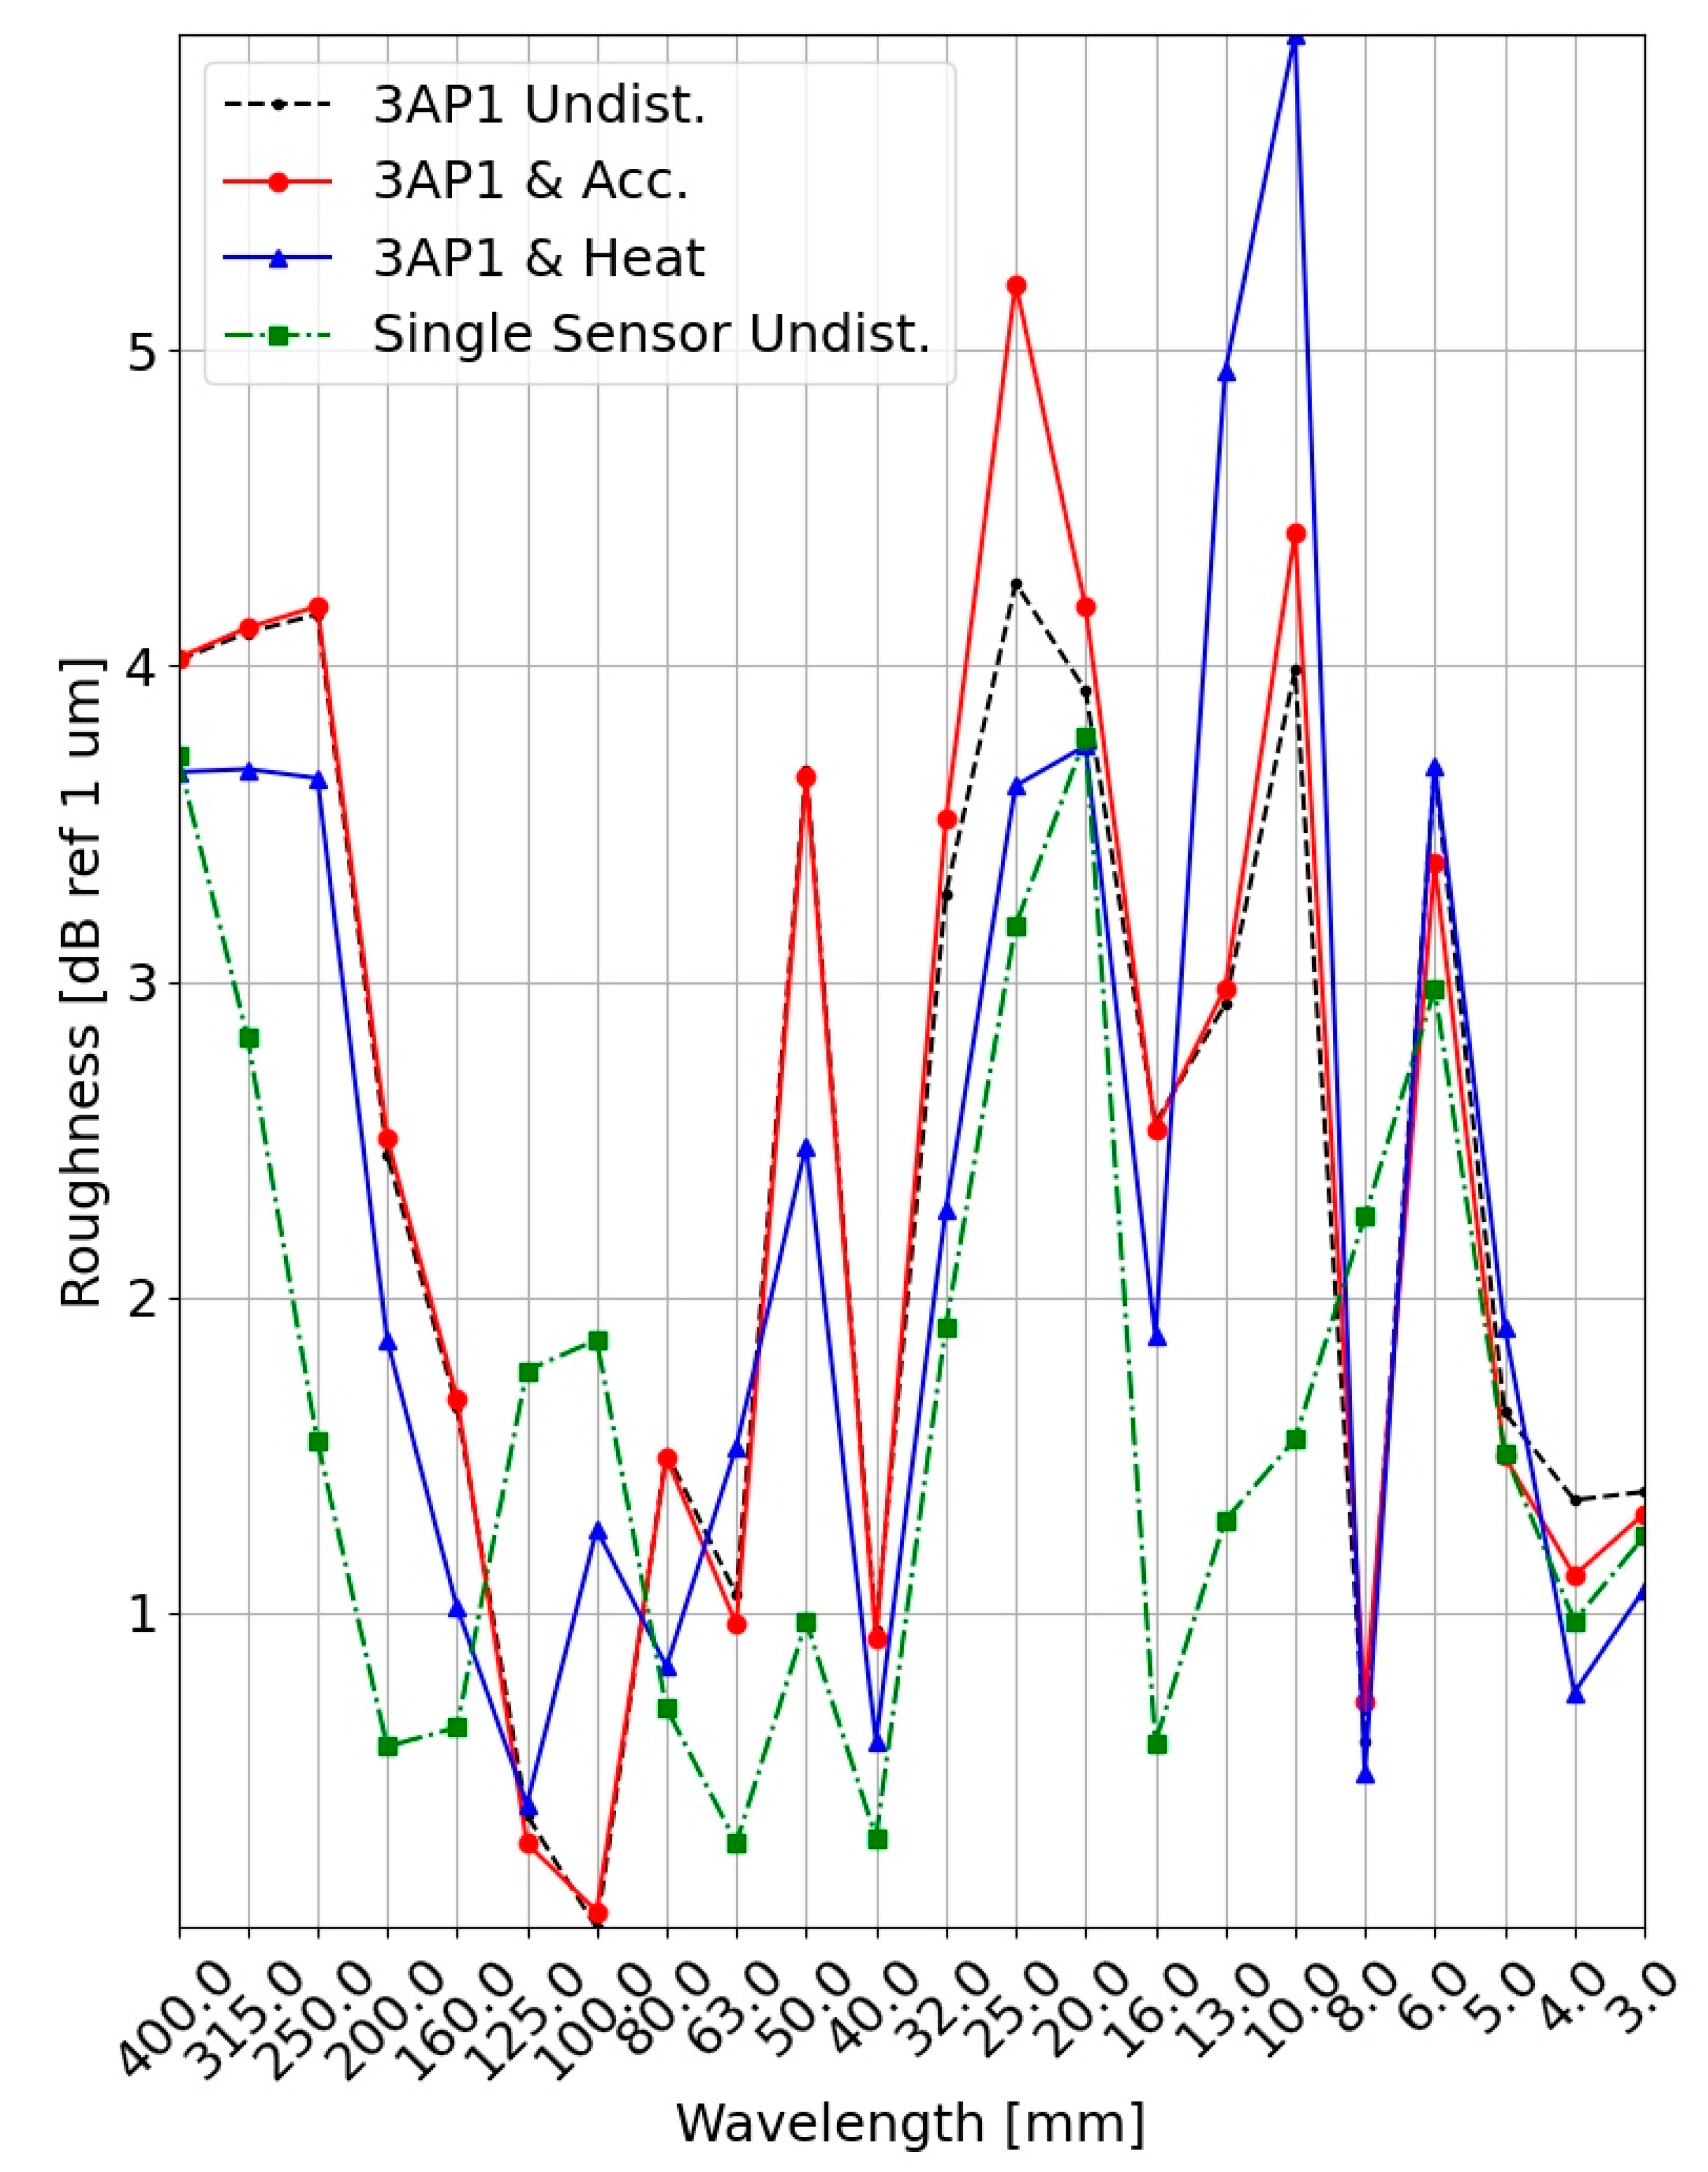
  • Acceleration & Deceleration: The situation of accelerating and braking is emulated. This should according to Grassie [21] not affect the chord method. For this purpose, the slider is stopped several times along the rail and then set in motion again.
  • Heat: Additional heat flux affects the optical properties of the air between the rail and the sensor. For this purpose, a 300   ° C heat stream from a heat gun was directed towards the region between the sensor and the rail.
  • Water: Wet track conditions occur in operation, for example during rainfall. Water or moisture on the rail will be rolled over, and will have no influence on the acoustic emission from the wheel-rail contact. Nevertheless, water can affect the optical measurement method, and must be considered in this study. Water is sprayed onto the surface of the rails. A uniform distribution is targeted, which is shown in Figure 2.
  • Dust: Sand is applied to the rail near railway stations to achieve better adhesion. The sand would be overrun by following vehicles, and is therefore relevant for acoustic emissions resulting from the wheel-rail contact. In order to test the effect of the presence of particles on the rail surface, dust is applied to the rail. The particle distribution is kept identical for all tests with dust on the rail.
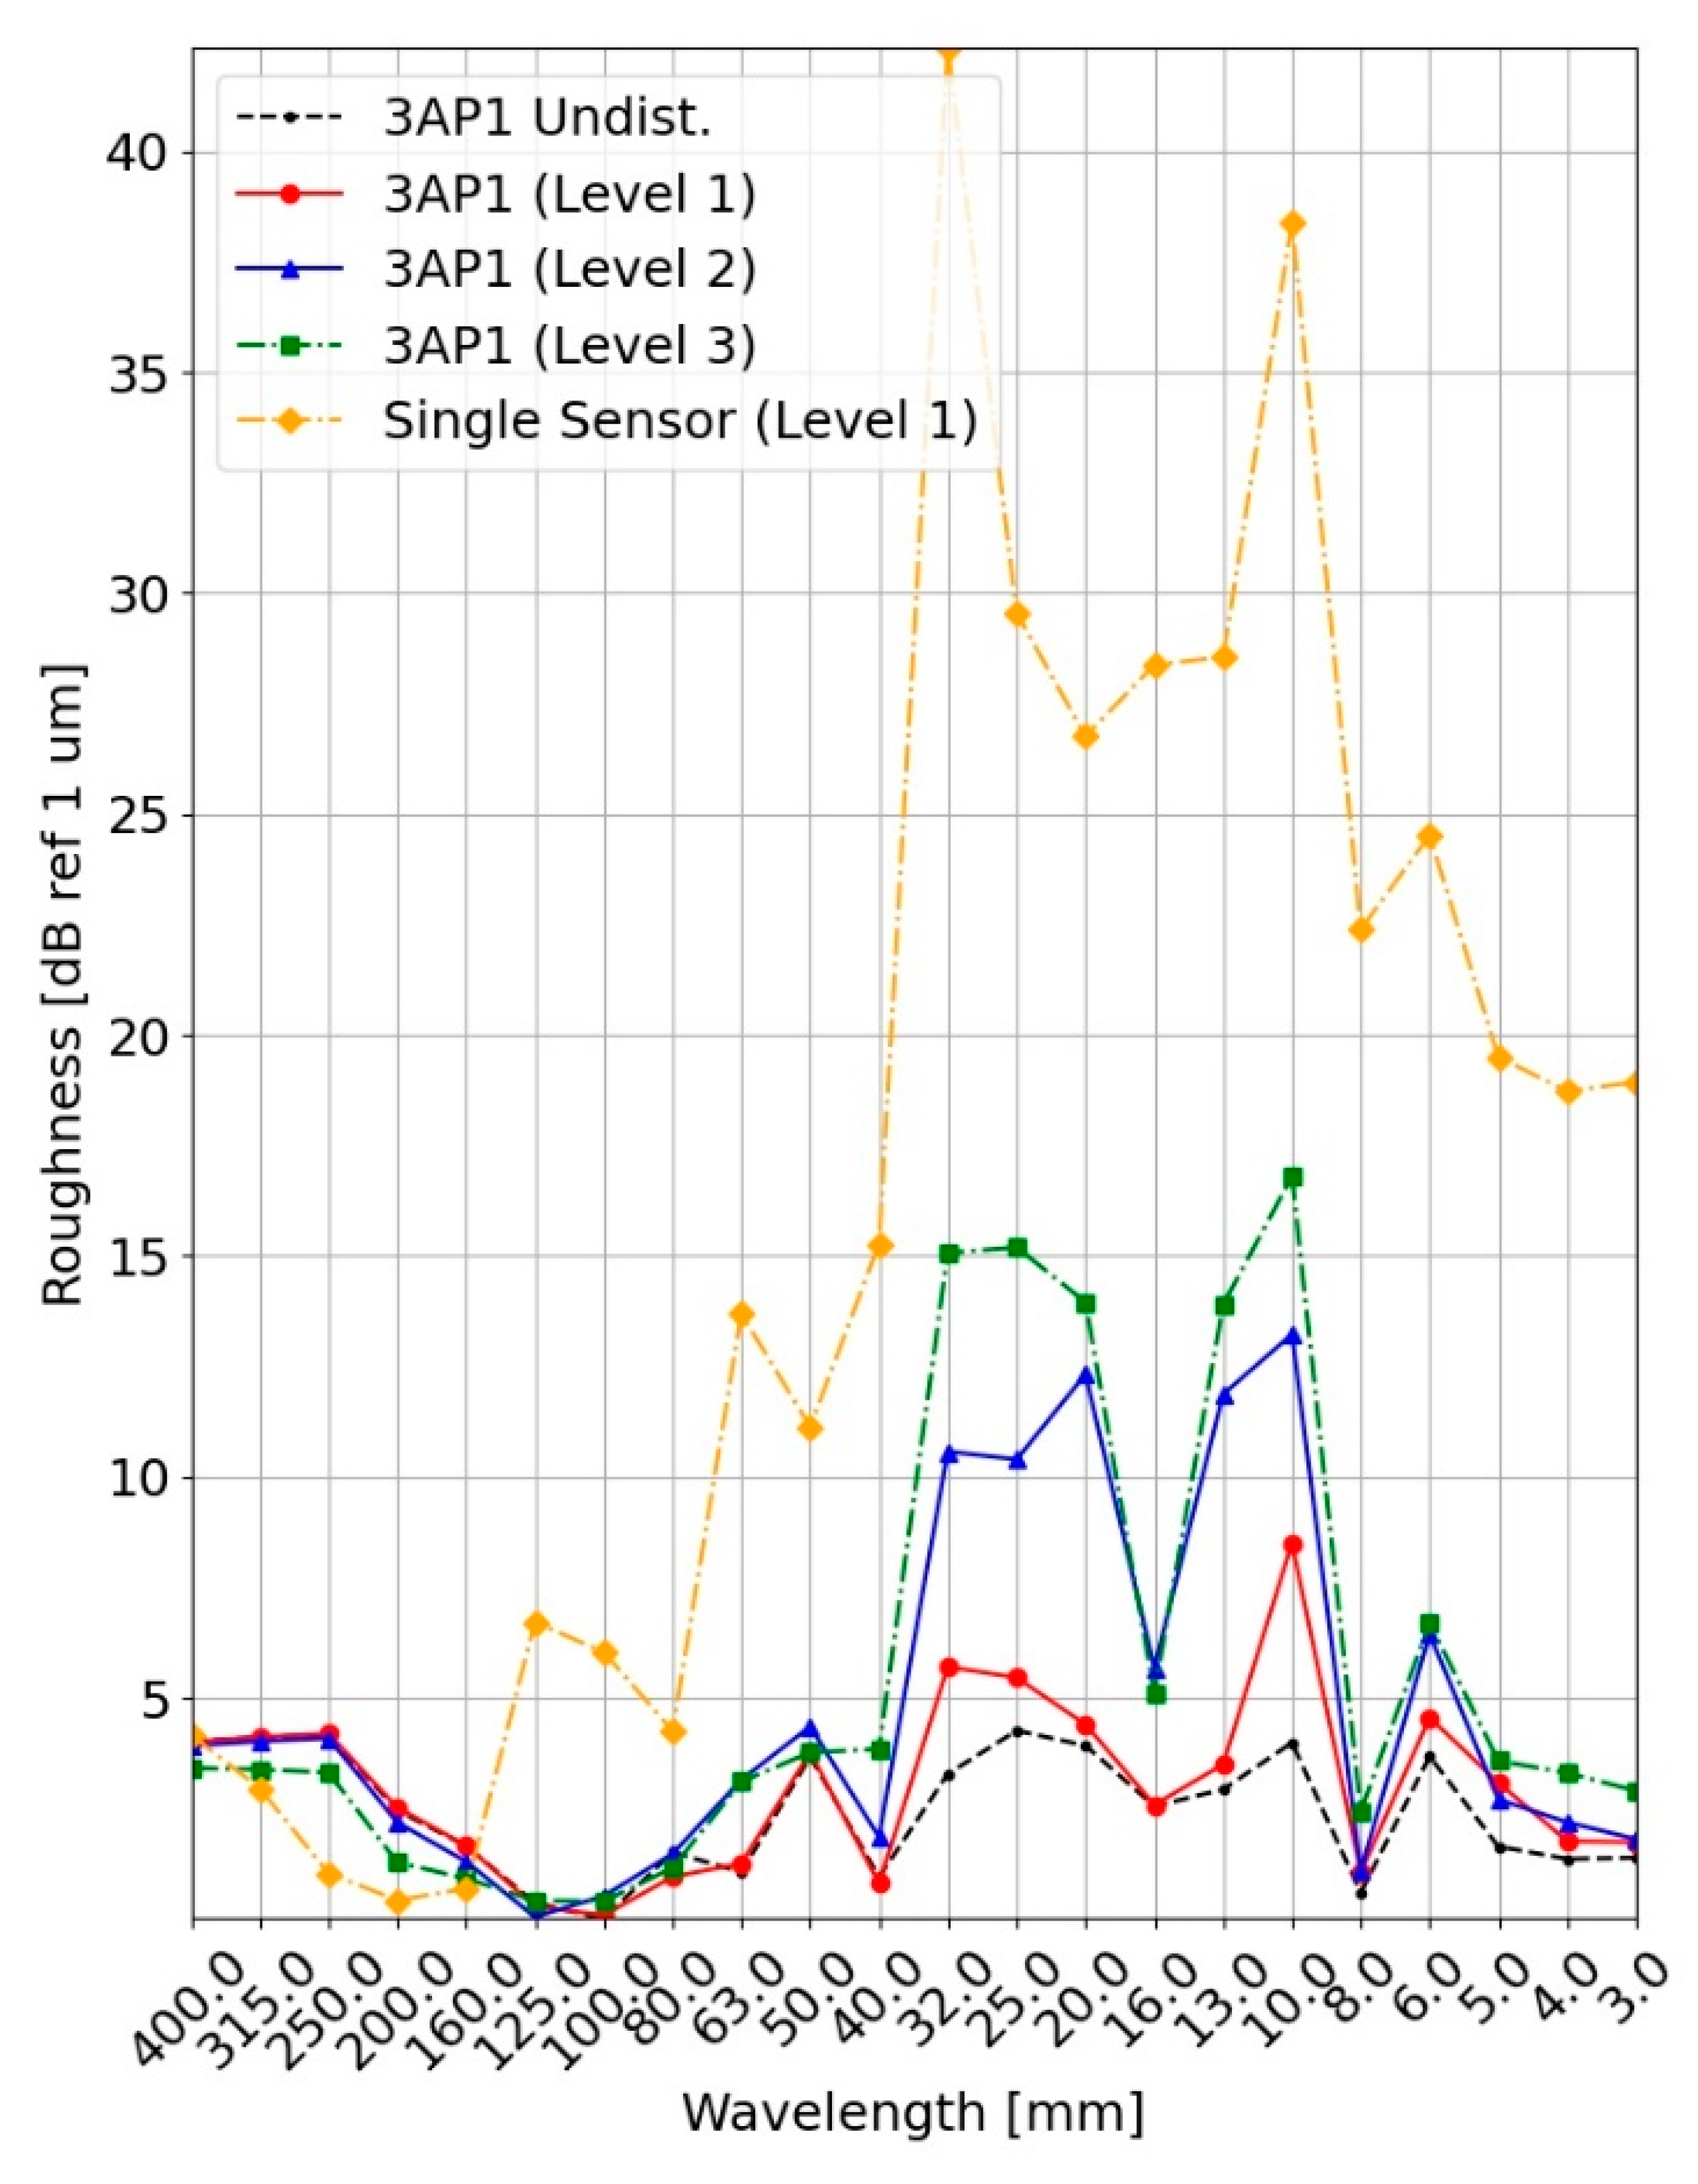
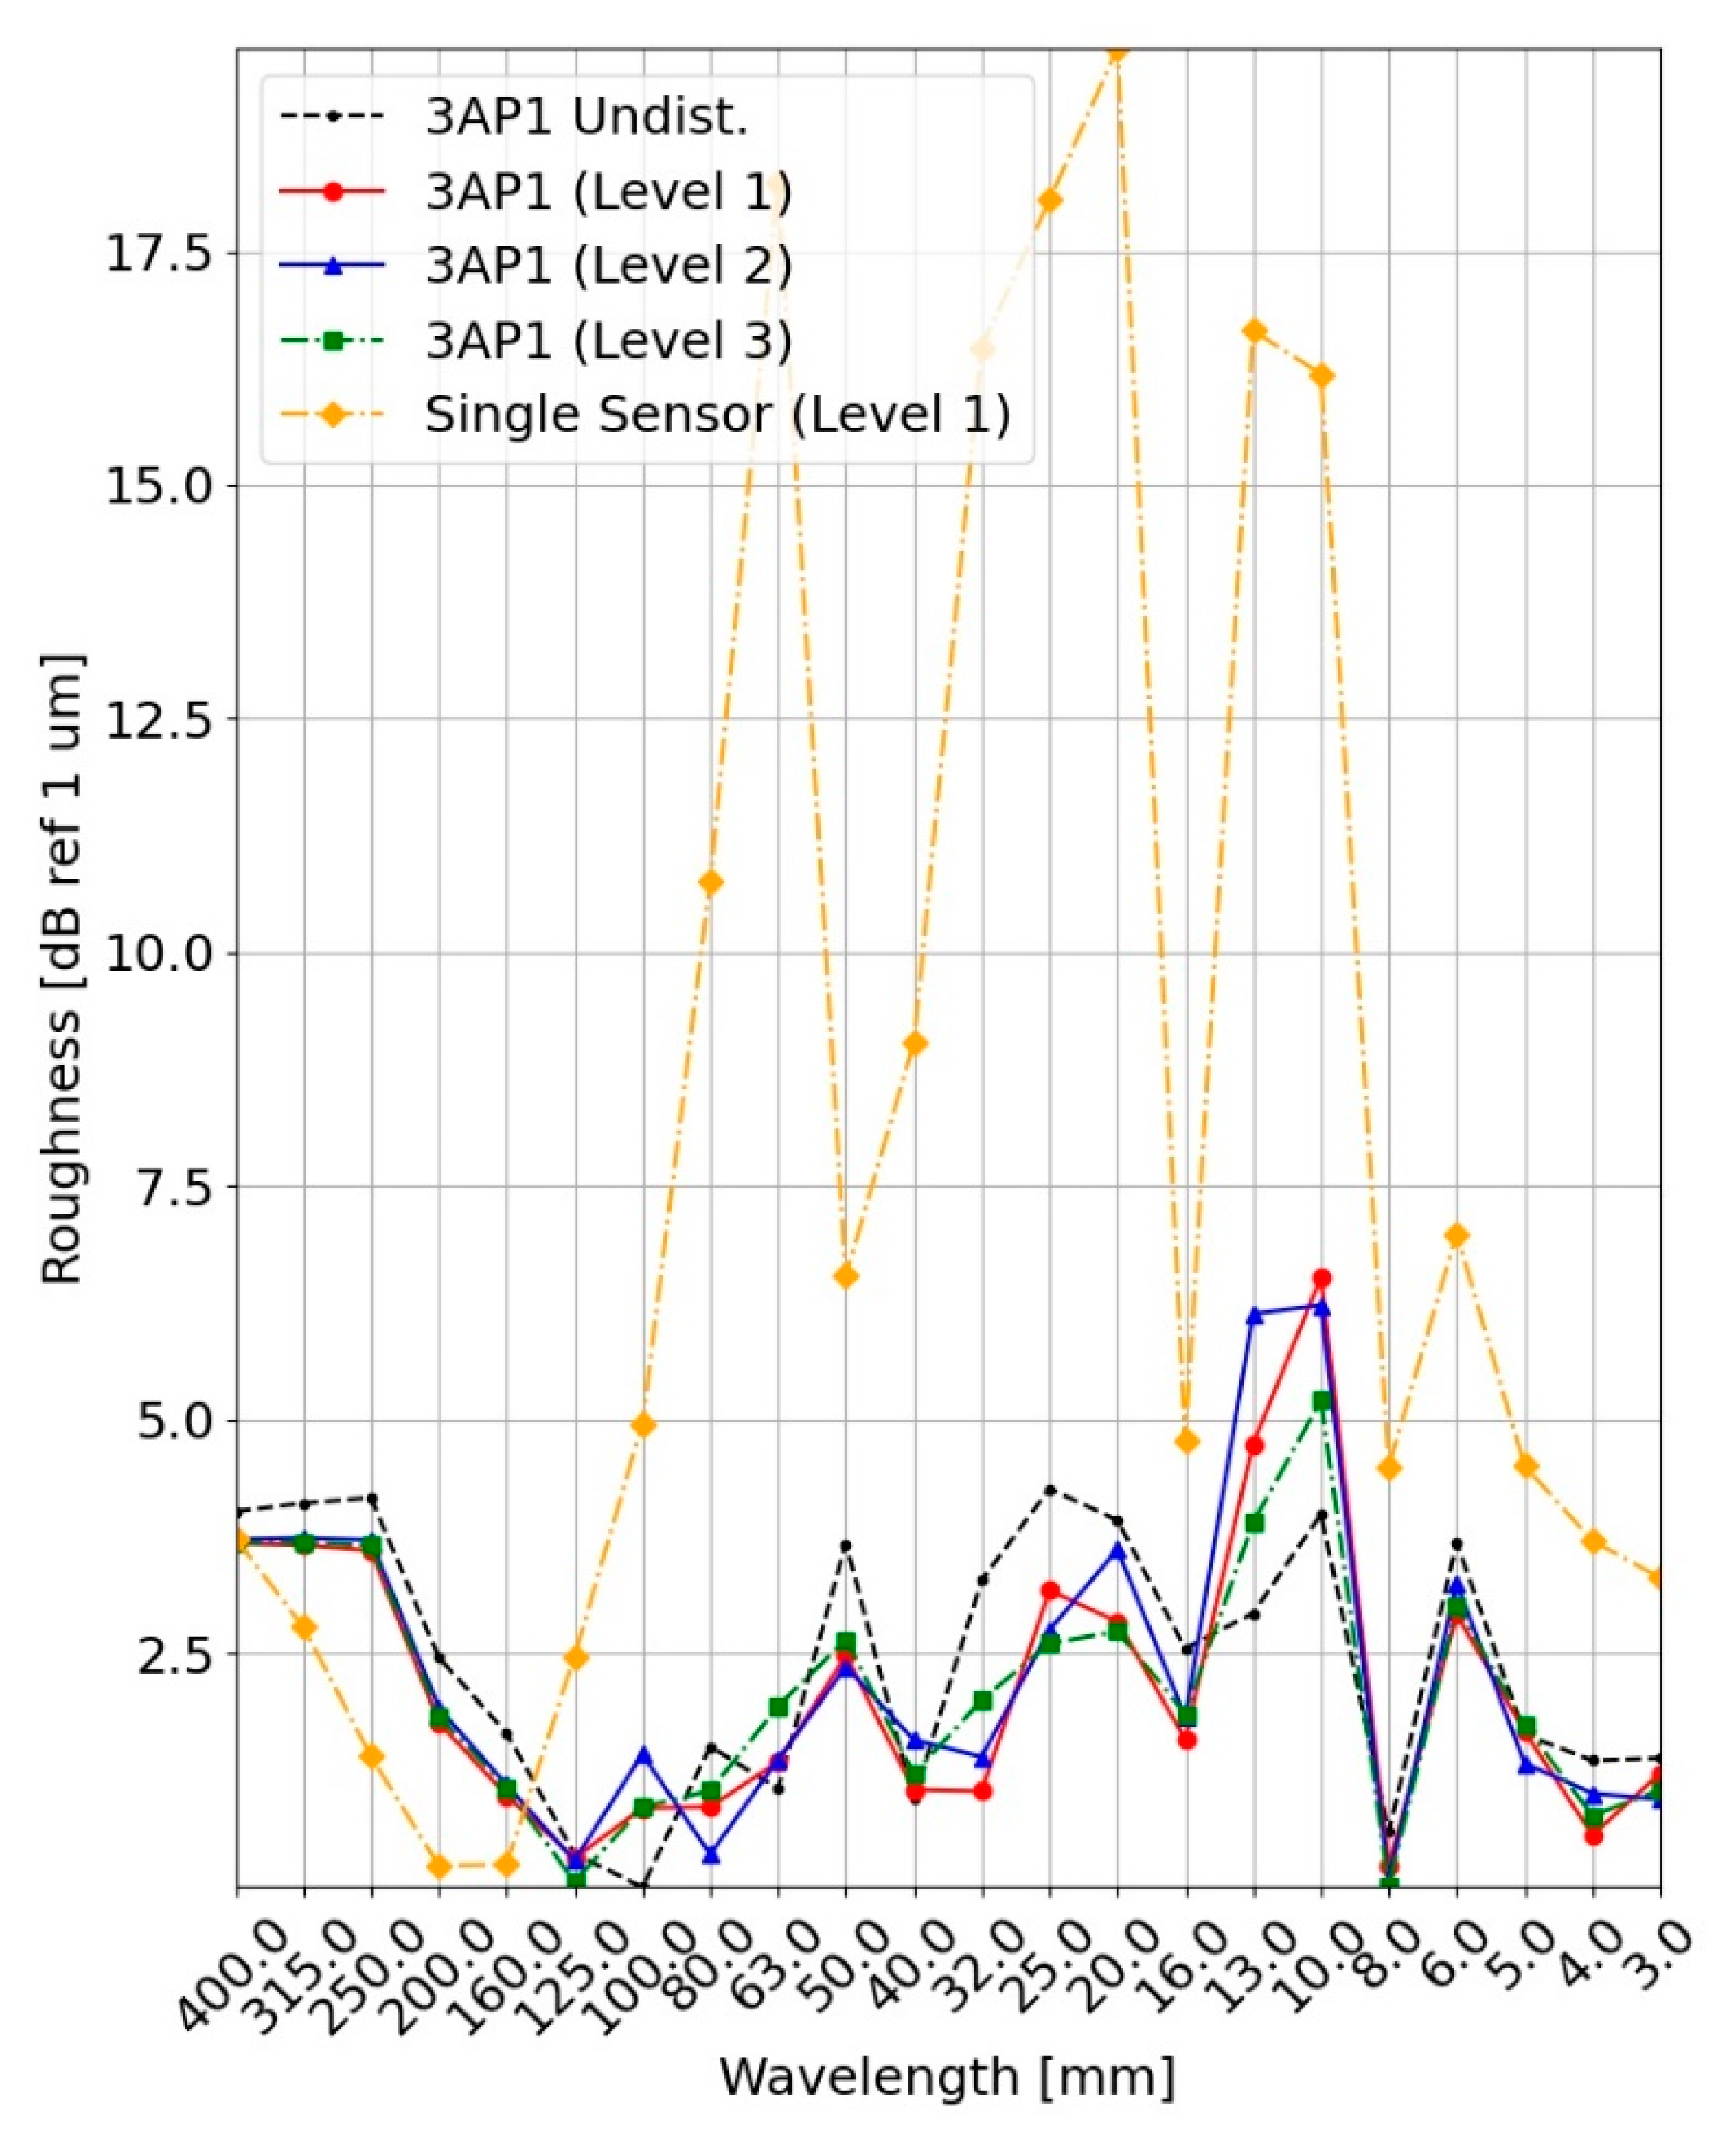
  • Displacement & Tilting: Displacements of the entire measurement setup perpendicular to the rail surface occur because of the bogie suspension. A tilting of the measuring system can result, for example, from an inclined mounting position on the train. Both scenarios are artificially realized in the experimental setup by suspending the sensors from the pneumatic actuators. The degree of freedom to tilt in lateral direction is prevented by guides. The two pneumatic actuators are actuated at a frequency f P using rectangular pulses, either synchronously (displacement) or asynchronously (tilting). The amplitude d represents the displacement at the location of each pneumatic actuator. Three different amplitudes are tested for displacement and tilting, respectively:
    Level 1: f P = 1   Hz , d = 0.5   mm
    Level 2: f P = 1   Hz , d = 1.1   mm
    Level 3: f P = 1   Hz , d = 2.0   mm
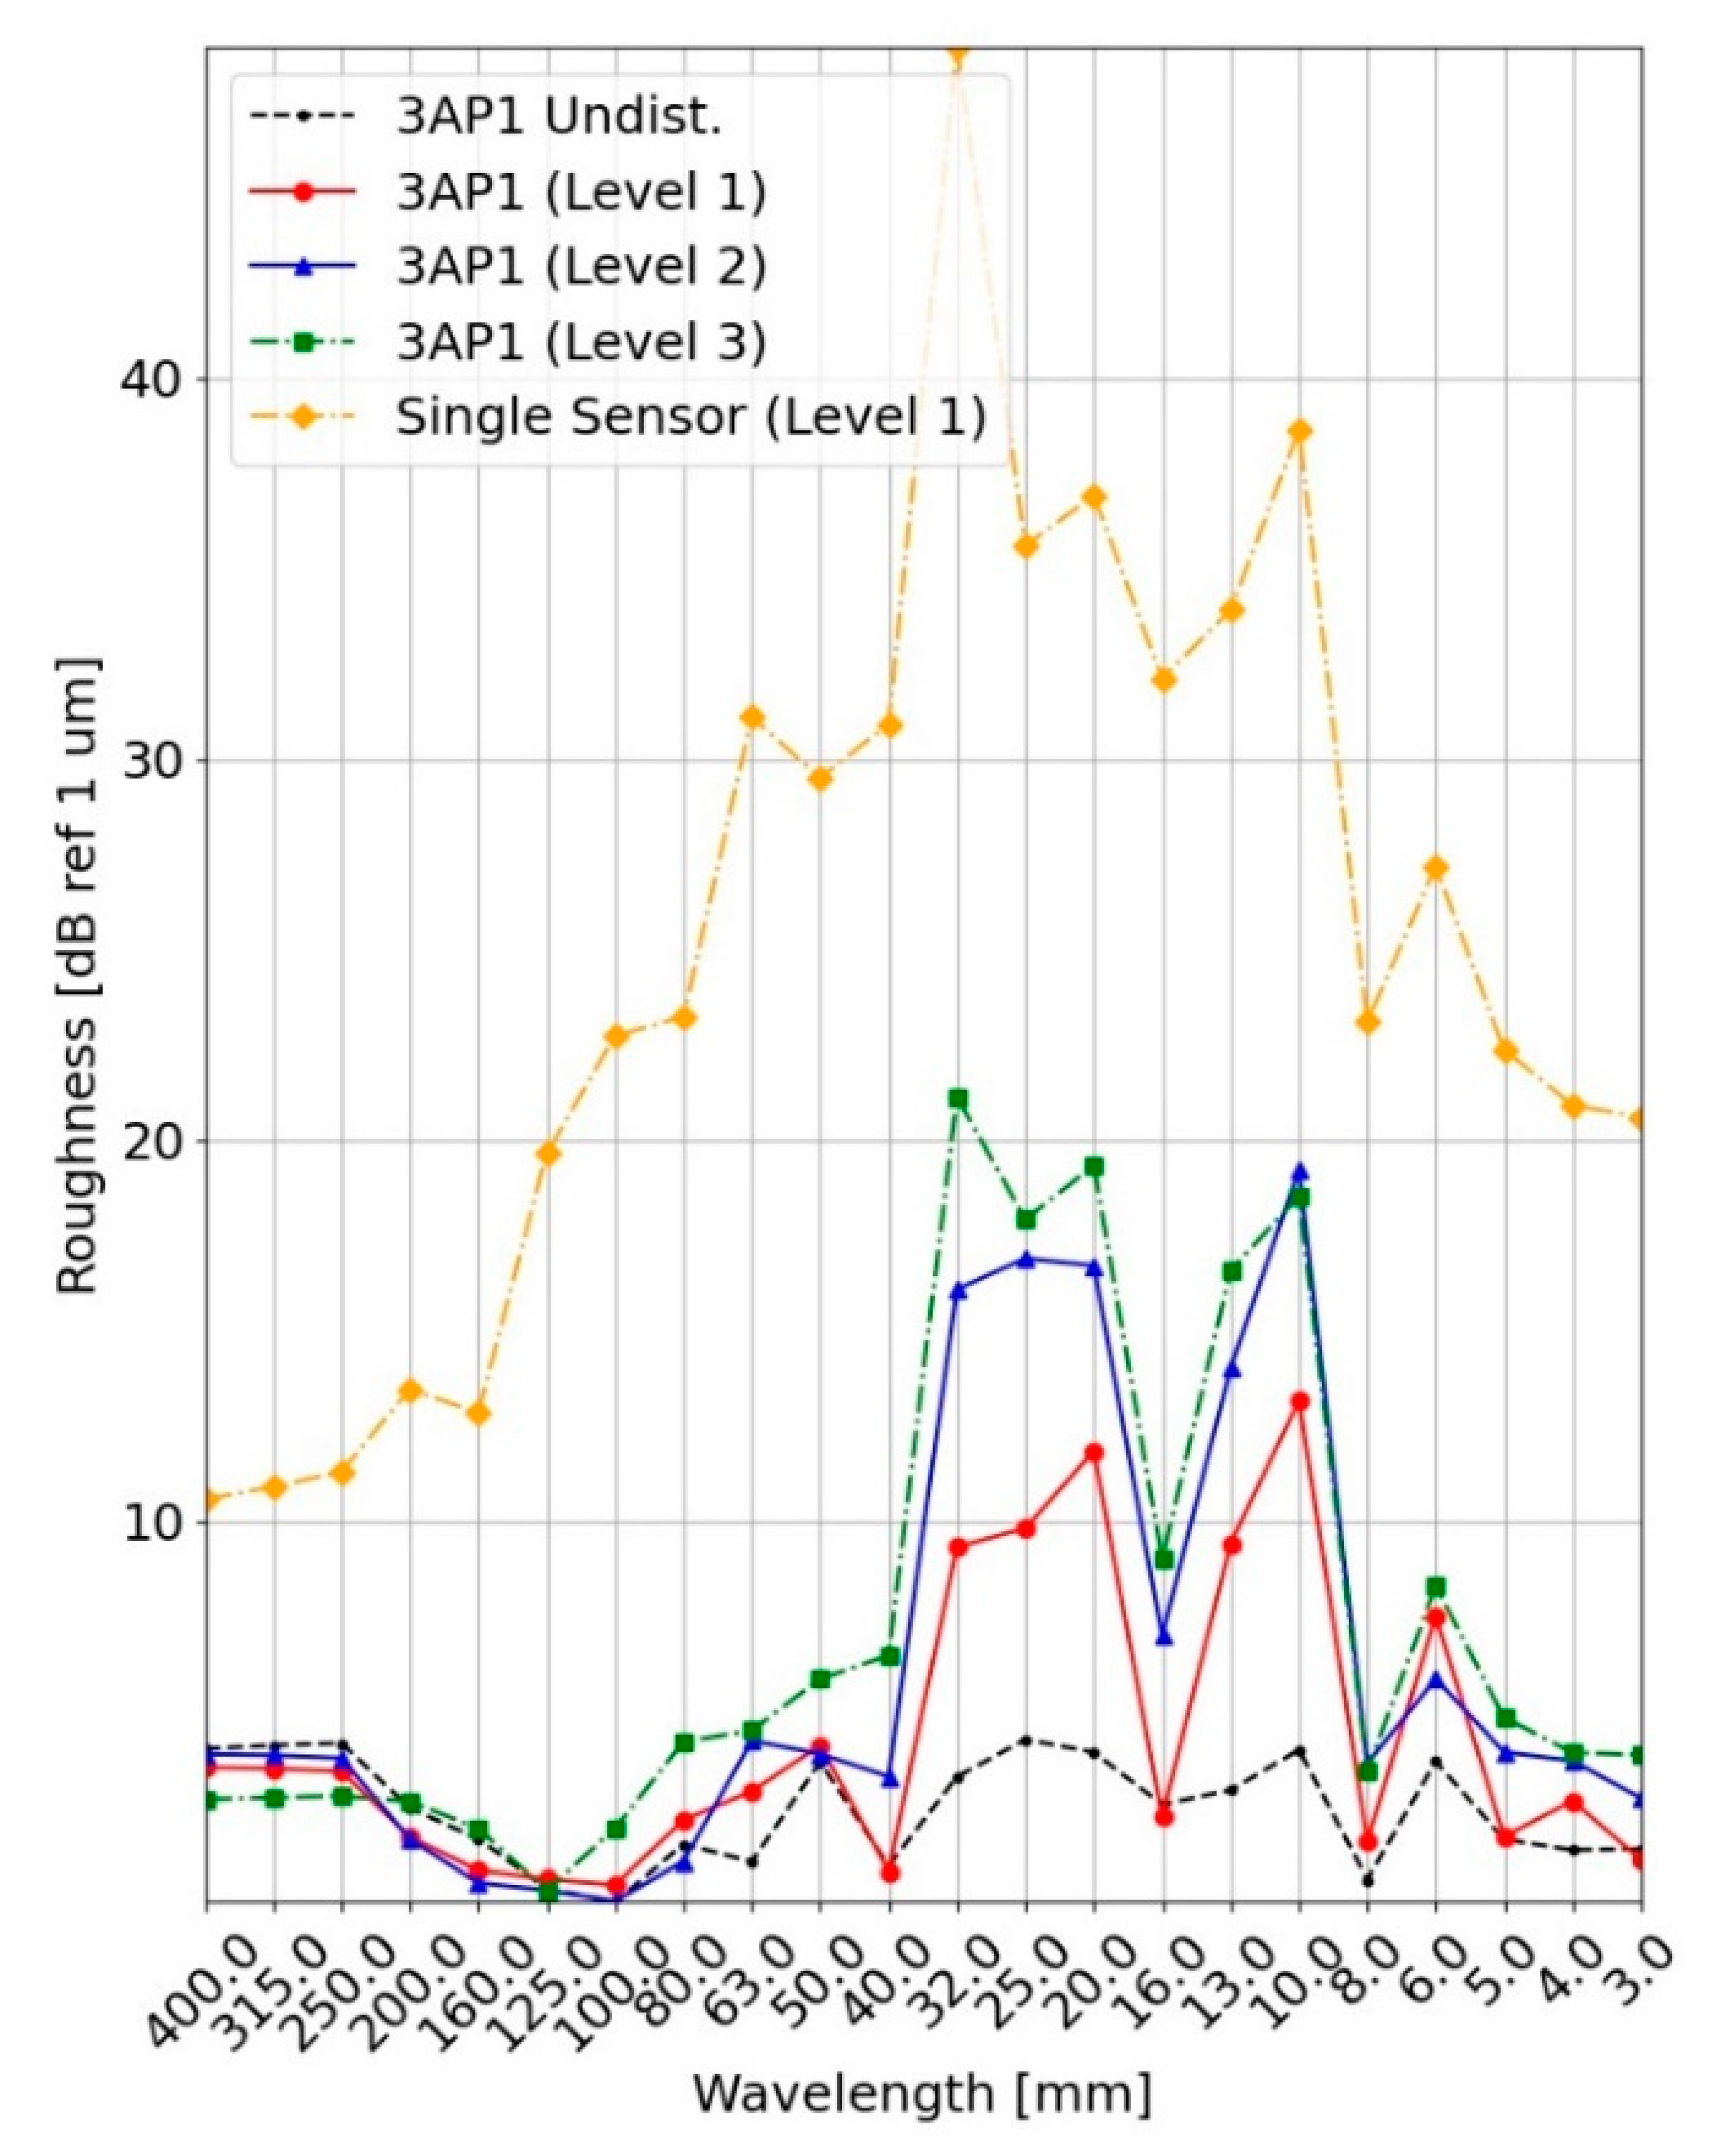
  • Vibration: Vibrations can originate from the train and its movement. Chen et al. [27] applied a simulation for a car body structure to determine modal frequencies up to 29.598   Hz . Therefore, three different and realistic frequencies are tested experimentally from 20   Hz to 40   Hz , by inducing small displacements with the pneumatic actuators, using identical pneumatic pressures for all frequencies.
    Level 1: f P = 20   Hz , d < 0.1   mm
    Level 2: f P = 30   Hz , d < 0.1   mm
    Level 3: f P = 40   Hz   ,   d < 0.1   mm

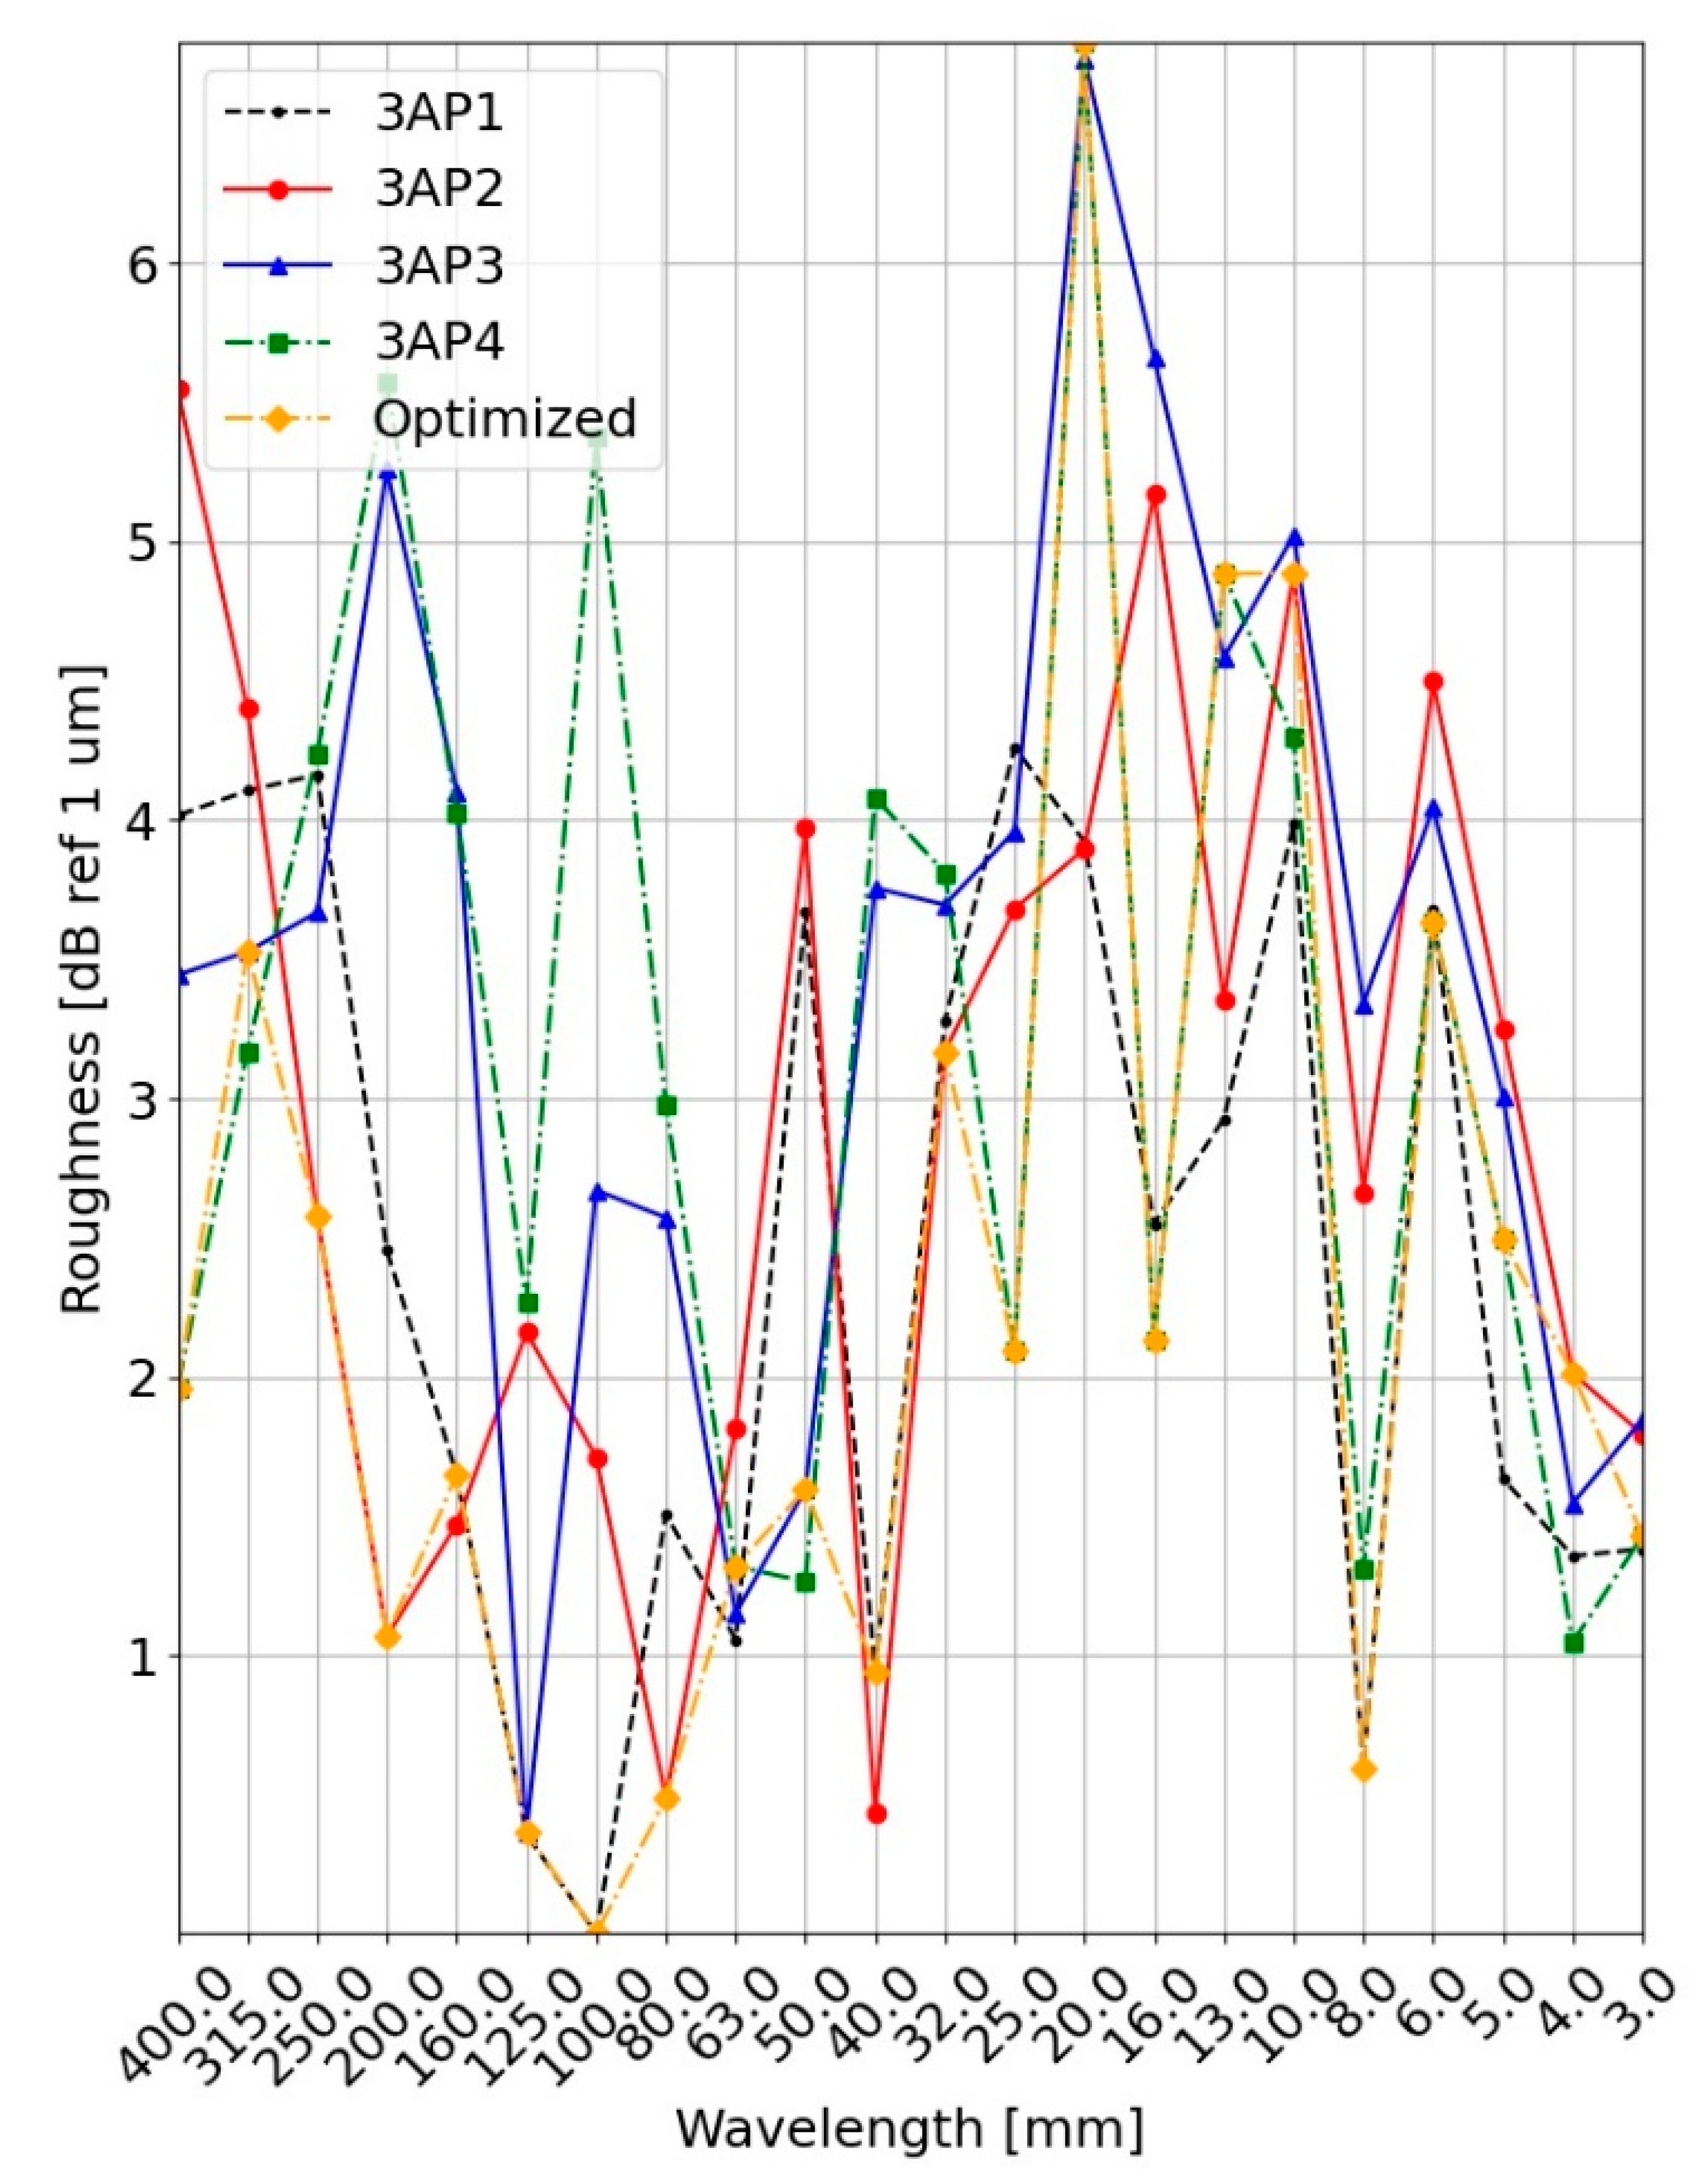
2.3. Chord Methods & Optimization

The transfer function of the chord method based on the definition of Grassie [21], is given as:
H ( ω ) = e ( a 1 ) L j ω + ( a 1 ) e L j ω a
The transfer function describes the relationship between the measured sensor signals (input) and the estimation of the longitudinal profile (output). L corresponds to the total length of the chord, and   a gives information about the position of the middle sensor, and varies between 0 and 1 . If a = 0.5 , the middle sensor is located centrally between the other two sensors and the arrangement is symmetrical. If a 0.5 applies, the arrangement is referred to as asymmetrical. Grassie [21] stated that the transfer function of the chord method has undesirable properties. The amplification factor of this function varies greatly depending on the wavelength. Some wavelengths cannot be measured or are distorted. To avoid these effects, a “decoloring” process can be applied as described in EN 13848-1 [28]. An example of this can be the correction of the measurement result using the inverse of the known transfer function of the chord method. This was not applied in context of these investigations, as the transfer function of the described chords have multiple values close to zero, and consequently the inverse causes a deterioration of the results.
Ideally, the amplification factor should be one and independent of the wavelength. Since four sensors are integrated in the setup, the longitudinal profile can be recorded with four different chord lengths simultaneously, which makes it possible to perform an optimization of the measurement result. The individual chord methods differ in their total chord length   L and their asymmetry   a . These are the two design parameters of the chord method that can be varied. The parameters of the individual chord methods are listed in Table 1.
Figure 3 shows the sensor arrangement as it is mounted onto the sensor plate. The individual chord methods and the position of the middle sensor are also illustrated. In addition to the evaluated chords, which are each based on three sensor values, it would be possible to evaluate six further chord methods based on two sensor values with this setup.
For each one-third octave band, it is possible to choose the optimal chord method with an amplification factor as close to one as possible. The selection of the appropriate chord method for the respective one-third octave band was performed based on the following quality criterion:
Q B a n d = 1 N k = 0 N 1 ( | H ( ω k ) | 1 ) 2
N represents the number of equally spaced evaluation points set within a one-third octave band. The number of evaluation points was set to 1000 . If Q B a n d is close to zero, the transfer function shows the desired behavior in the evaluated one-third octave band. The spectrum of acoustic roughness determined in this way is consequently composed of the four individual methods, and is referred to in the following as the optimized acoustic roughness. Figure 4 shows the transfer functions with parameters defined in Table 1 for the wavelength range of between 80   mm and 100   mm .
If a method selection would be made for this wavelength range, the method 3AP1 with the smallest deviation from the amplification factor one would be selected. The sensor distances given in Table 1 are the result of a numerical optimization based on the stated quality criterion Q B a n d . The distances between two adjacent sensors should be between 80   mm and 200   mm , and the length of the total arrangement should not exceed 550   mm . Each possible configuration is evaluated in 0.5   mm step sizes with a quality factor Q C for each sensor configuration. First, all Q B a n d are calculated and summarized in a matrix Q :
Q = ( Q 1 , 1 Q 1 , n Q m , 1 Q m , n )
Each row represents the values of Q B a n d for each one-third octave band of a chord method (with n the total number of one-third octave bands). Consequently, Q contains four rows representing four chord methods ( m = 4 ). To be able to evaluate a sensor configuration, it is assigned a single value Q C . The variable i indicates the number for different chord methods:
Q C = j = 1 n min i ( Q i , j )
For each one-third octave band, the minimal Q B a n d is included (column-wise in Q ) and added up for all bands. The configuration with the lowest Q C resulted in the specified sensor distances listed in Table 1. The four chords are used to achieve a subsequent optimization of the measurement result. For each one-third octave band, the measured value of the chord with the lowest Q B a n d value is used and included into the spectrum of acoustic roughness. This procedure is subsequently referred to as optimized acoustic roughness.

3. Results

In order to test the repeatability of the test stand measurements, 20 identical measurements of acoustic roughness are conducted in succession. For the single sensor, this resulted in a standard deviation of 0.22   dB . For the chord method 1 (3AP1), the standard deviation was 0.26   dB .

3.1. Constant Velocity, Acceleration & Heat

The determined absolute error of the acoustic roughness for the undisturbed measurement at constant velocity of a single sensor and the chord method 3AP1, the measurement of the chord method 3AP1 with stop points (and subsequent acceleration) along the rail and the measurement with the influence of an additional heat flux are shown in Figure 5. The undisturbed measurement at constant velocity shows that the single sensor has the lowest average deviation from the reference with 1.54   dB . The chord method shows a mean deviation of 2.43   dB for an undisturbed measurement. The measurement with breakpoints along the rail has a mean deviation of   2.48   dB . The measurement under the influence of heat shows a reduction of the mean deviation to 2.08   dB .

3.2. Water & Dust on the Rail

The absolute error of the acoustic roughness for measurements with dust and alternatively water on the rail surface along with the absolute error of an undisturbed measurement are shown in Figure 6. In the wavelength range below 100   mm , both disturbed scenarios show significant deviations compared to the undisturbed measurement and the reference. The measurement with dust on the rail deviates from the reference by a maximum of 22.71   dB , at a wavelength of 25   mm . The measurement with water on the rail deviates from the reference by a maximum of 18.04   dB , at a wavelength of 13   mm .
For wavelengths above 100   mm , the results converge to the reference, and have no significant differences compared to the undisturbed measurement.

3.3. Displacement & Tilting

Three different displacement amplitudes are tested, as well as tilt amplitudes of the sensor plate. The resulting absolute error of the acoustic roughness for measurements with a displacement of the sensor plate are shown in Figure 7. The acoustic roughness determined for the single sensor already shows a large deviation from the reference for the smallest displacement amplitude (referred to as level 1), leading to an average deviation of 17   dB . In the wavelength range between 8   mm and 80   mm , the chord method shows the largest deviations for all displacement amplitudes, with the mean deviation increasing from 2.99   dB over 4.78   dB to 5.63   dB for increasing displacement amplitudes (levels).
The resulting absolute error of the acoustic roughness for measurements with a tilting of the sensor plate is shown in Figure 8. As with the measurements with pure displacements, tilting the sensor plate shows that the single sensor already deviates strongly from the reference at the smallest amplitude (level 1), with a mean deviation of 25.28   dB . The chord method deviates considerably from the reference in the wavelength range between approx. 4   mm and 63   mm . Compared to the measurements with a pure displacement of the sensor plate, it can be seen that the mean deviation increases as a function of the amplitude (levels). The mean deviation increases from 4.19   dB over 6.16   dB to 7.20   dB for the three displacement amplitudes (levels).

3.4. Vibration

The absolute error of acoustic roughness for measurements with vibrations acting on the sensor plate are shown in Figure 9. The single sensor measurement shows the strongest sensitivity to vibration, deviating from the reference on average by 7.96   dB . The measurement with the chord method on the other hand shows no increased deviation compared to the undisturbed measurement.

3.5. Chord Methods & Optimization

The absolute error of the acoustic roughness for the four chord methods integrated in the measurement setup are compared in Figure 10. In addition, the course of the optimized acoustic roughness is provided. It can be seen that the curve of the optimized acoustic roughness over the entire spectrum is closer to the reference compared to the individual methods. For a wavelength of 16   mm , for example, the deviation of the optimized acoustic roughness is 2.13   dB , while method 3AP3 deviates by 5.66   dB .
The average absolute error over all one-third octave bands assumed the lowest value of 2.11   dB for the optimized acoustic roughness method. For the individual chord methods, the minimum was 2.43   dB (3AP1) and the maximum 3.19   dB (3AP3). The median (calculated for the respective spectrum) of the absolute error shows the identical trend. The optimized acoustic roughness method has a median value of 1.99   dB , while the individual methods varies between 2.5   dB and 3.6   dB .

4. Discussion

In an undisturbed measurement, the single sensor achieves the smallest deviation from the METAS reference. In comparison to the single sensor, the accuracy of the chord method slightly decreases for an undisturbed measurement, which can only be achieved under laboratory conditions. This can be attributed to the transfer function of the chord method, and to mounting inaccuracies between the individual sensors, which in turn could lead to deviations in the measurement result. It is therefore important to ensure that the sensor plate in the measurement setup has close tolerances and a low thermal expansion over its length. It is noted that for selected one-third octave bands in the low wavelength range, a larger deviation from the reference is observed. This is also the case without interference at 10   mm , 20   mm and 25   mm . It should be investigated whether this is also the case on a smooth rail in real operation by measuring the running surface. The reference rail used has a ground and therefore rough surface. Stop points in the movement direction along the rail and subsequent acceleration have no significant effect on the measurement result, confirming the results of Grassie [21]. Heat application directed to the region between sensors and rail surface does not show any deteriorating influence on the measurement result.
The changed optical conditions on the rail surface caused by the water worsen the measurement result. In particular for small wavelengths below 100   mm , an increased acoustic roughness level value is measured. For longer wavelengths, only a slight change can be detected compared to an undisturbed measurement. It is therefore recommended that measurements are carried out with dry rail conditions. This must be ensured either operationally by selecting the time and date of a measurement, or technically by removing the water.
Similar as for the wet rail, levels at smaller wavelengths below 100   mm are influenced and increased by dust. Unlike water, the dust, solid particles or debris are not necessarily removed from the rail as the train passes over it and contribute to the acoustic emission from the wheel-rail interaction. It can be assumed that dust particles are usually displaced after they have been passed. Nevertheless, when operating on a train, it should be investigated to what extent dust particles pose a problem and whether further additional measures are necessary to remove them from the rail (e.g. by means of brushes). With a suitable mounting position on the train, the negative influence on the optical measurement concept could be reduced to a minimum. Depending on the type, size and amount of dust, the influence on the measurement result could vary considerably. To what extent and how often dust is a relevant obstacle for measurements on a train still needs to be investigated.
Under the influence of a vertical displacement, the signal of the single sensor is not suitable for acoustic roughness measurements. Applying a filter is insufficient, since the frequency of the deflection can vary. The chord method in contrary can reproduce the profile correctly. The deviation from the METAS reference increases with increasing amplitude, and already deviates significantly at an amplitude of 2   mm in the wavelength range between 8   mm and 50   mm . The measurement result becomes unsuitable for the entire wavelength range with a further increase in amplitude. In the case of tilting, the signal of the single sensor also shows large deviations compared to the METAS reference. For the identical set amplitudes (as for displacement test scenario) of the pneumatic actuators, the mean deviations due to tilting are bigger than the ones caused by displacement of the sensor plate. The pneumatic actuators were not connected with the right or left end of the sensor plate, as shown in Figure 1. Therefore, with the same set amplitude, sensor 1 and sensor 4 are deflected more than in the case of uniform displacement of the entire sensor plate. This in turn leads to a larger disturbance of these sensors, which ultimately results in a larger deviation of the chord method from the METAS reference. During isolated measurements, sensors 1 and 4 even reached the edge of the measuring range and generated an error signal, which in turn also negatively influences the corresponding chord methods. For reduction of the negative influence of displacements or tilting on the measurement results, it would be conceivable to add additional accelerometers and a gyroscope in the form of an IMU (inertial measurement unit) to the setup. With additional information about the applied disturbances, the measurement data could be corrected.
Applying a vibration to the sensor plate significantly worsens the result of the single sensor. This can be observed already for low applied amplitudes. The chord method is not negatively affected. This statement is valid regardless of the applied frequency. Applying a filter to the data set to remove the influence of vibration from the signals would be possible. However, the frequency of the vibration is usually not known, and depends on the speed of the train, for example. On the train, different vibration frequencies would act on the structure at the same time. In this study, only one frequency was applied at a time, but it can be assumed that vibrations would not influence the measurement result in the case of a chord method.
The use of four sensors provides several advantages over the use of fewer sensors. Most importantly, the strengths of the individual chord methods can be combined to achieve a better result. For longer wavelengths, this setup would offer the advantage to evaluate six additional two-point methods. The optimized acoustic roughness approach can improve accuracy. The inherent redundancy of a four-sensor arrangement provides robustness, as it can be used to check plausibility of the obtained results by comparing the chord methods. This could be especially relevant in the event of a sensor failure. Considering future developments of the setup and methods, an alternative sensor arrangement with different sensor distances could still lead to further improvement in measurement quality. A symmetrical chord method ( a = 0.5 ) could be added to the arrangement, and thus complement the asymmetric chord methods. The method selection per each one-third octave band is currently limiting the advantage of the optimized acoustic roughness approach. Instead, the selection of the chord method could be done for each narrow band individually, which could lead to a further improvement.
The test stand in the laboratory does not take into account two effects, which could be relevant for a measurement on the train. One is the hunting oscillation of the train, which, according to Dumitriu [29], could lead to lateral displacements in the range of up to 4.25   mm . The effect of rail vibration, which according to Kouroussis et al. [30] also depends on the characteristics of the vehicle, is an external disturbance, which could not be investigated with the above-described test bench. The entire test stand could be vibrated. However, since the measurement setup is directly mechanically connected via the linear guide, no distinction could be made in this scenario between the vibration of the measurement platform and the vibration of the rail. This should therefore be tested under real conditions. The identical applies to rail deflections due to the contact force of the wheelset.
The described laboratory environment in which the tests were carried out did not allow measurement at higher velocities, due to the limited length of the test rail. For further investigations, the velocity should be increased significantly to practical values on a train. A higher velocity has an influence on the data point distance, which significantly increases. EN 15610 [9] specifies a maximum value of 1   mm . For a sampling rate of 30   kHz (applied during this study), this results in a maximum feasible velocity of   108   km   h 1 , whereby the sensor model can also be operated at 49   kHz . It is also to be investigated to what extent displacement and tilting of the sensor platform vary with velocity, and how great their influence is in operation.

5. Conclusions & Outlook

The influence of various external disturbances on an optical measurement method for measuring the acoustic roughness of a rail was demonstrated under laboratory conditions. A setup with four integrated asymmetric chord methods was studied. Water and dust had a degrading effect, especially on wavelengths below 100   mm . It is recommended to carry out measurements with a dry and cleaned rail. The influence of dust and sand on the rail cannot be neglected when installing on a train, as sand is occasionally used to improve adhesion. Displacements which can occur, for example, due to the deflection of the bogie suspension, can be compensated by the chord method, but also cause larger inaccuracy. A relevant deviation was observed at an amplitude of 2   mm , especially in the low wavelength range below 50   mm . Tilting of the structure should also be avoided, as its influence can be considered more damaging to the measurement result than simple displacements. If a comparable measurement setup is mounted on a train, it is important to choose a position that only includes the displacement of the primary suspension. This would be the case at the bogie of the train, in the middle between two wheelsets. The best possible lateral alignment should theoretically be achieved at this position for measuring the running surface. The tests on the test rig were carried out at fixed lateral track settings. The influence of the hunting oscillation should be tested on the real train. Vibrations had no significant influence on the measurement result using the chord method, as long as they occurred with a rather low amplitude of less than 0.1   mm . Nevertheless, the issue of vibration should be taken into account when designing a connection to the train in order not to damage the sensors in the long term. The implementation of four sensors and thus four chord methods showed an improvement of the measurement result compared to the METAS reference. In future, a test should be performed on the train at travelling speed to verify its suitability for use at higher velocities. The results of this optical measurement concept should be compared with a classical, preferably tactilely measured reference measurement.

Author Contributions

Conceptualization, F.M.; methodology, F.M.; software, R.W. and F.M.; validation, R.W. and F.M.; formal analysis, F.M. and R.W.; investigation, F.M. and R.W.; resources, K.W.; data curation, R.W. and F.M.; writing—original draft preparation, F.M.; writing—review and editing, F.M., R.W., T.W., M.K. and K.W.; visualization, F.M.; supervision, M.K. and K.W.; project administration, M.K. and F.M.; and funding acquisition, M.K. All authors have read and agreed to the published version of the manuscript.

Funding

This research was funded by the Federal Office for the Environment (FOEN) and the Federal Office of Transport (FOT). The APC was funded by ETH Zurich.

Institutional Review Board Statement

Not applicable.

Informed Consent Statement

Not applicable.

Data Availability Statement

Some data used during this study are available from the corresponding author upon request.

Conflicts of Interest

The authors declare no conflict of interest.

References

  1. Veber, T.; Tamm, T.; Ründva, M.; Kriit, H.K.; Pyko, A.; Orru, H. Health impact assessment of transportation noise in two Estonian cities. Environ. Res. 2022, 204, 112319. [Google Scholar] [CrossRef] [PubMed]
  2. Vienneau, D.; Saucy, A.; Schäffer, B.; Flückiger, B.; Tangermann, L.; Stafoggia, M.; Wunderli, J.M.; Röösli, M. Transportation noise exposure and cardiovascular mortality: 15-years of follow-up in a nationwide prospective cohort in Switzerland. Environ. Int. 2022, 158, 106974. [Google Scholar] [CrossRef] [PubMed]
  3. Szwarc, M.; Kostek, B.; Kotus, J.; Szczodrak, M.; Czyżewski, A. Problems of Railway Noise-A Case Study. Int. J. Occup. Saf. Ergon. 2011, 17, 309–325. [Google Scholar] [CrossRef] [PubMed] [Green Version]
  4. Thompson, D.J.; Fodiman, P.; Mahé, H. Experimental validation of the twins prediction program for rolling noise, part 2: Results. J. Sound Vib. 1996, 193, 137–147. [Google Scholar] [CrossRef]
  5. Miri, A.; Mohammadzadeh, S.; Salek, H. A finite element approach to develop track geometrical irregularity thresholds from the safety aspect. J. Theor. Appl. Mech. 2017, 55, 695. [Google Scholar] [CrossRef] [Green Version]
  6. Song, Y.; Wang, Z.; Liu, Z.; Wang, R. A spatial coupling model to study dynamic performance of pantograph-catenary with vehicle-track excitation. Mech. Syst. Signal Process. 2021, 151, 107336. [Google Scholar] [CrossRef]
  7. Kuffa, M.; Ziegler, D.; Peter, T.; Kuster, F.; Wegener, K. A new grinding strategy to improve the acoustic properties of railway tracks. Proc. Inst. Mech. Eng. Part F J. Rail Rapid Transit 2018, 232, 214–221. [Google Scholar] [CrossRef]
  8. Grassie, S.L. Rail irregularities, corrugation and acoustic roughness: Characteristics, significance and effects of reprofiling. Proc. Inst. Mech. Eng. Part F J. Rail Rapid Transit 2012, 226, 542–557. [Google Scholar] [CrossRef]
  9. DIN EN 15610; Bahnanwendungen—Akustik—Messung der Schienen-und Radrauheit im Hinblick auf die Entstehung von Rollgeräuschen. Deutsche Fassung EN 15610:2019; Beuth Verlag: Berlin, Germany, 2021. [CrossRef]
  10. Mauz, F.; Wigger, R.; Wahl, T.; Kuffa, M.; Wegener, K. Acoustic roughness measurement of railway tracks: Implementation of an optical measurement approach & possible improvements to the standard. Proc. Inst. Mech. Eng. Part F J. Rail Rapid Transit 2022, 2022, 095440972210864. [Google Scholar] [CrossRef]
  11. Höjer, M.; Almgren, M. Monitoring system for track roughness. Euronoise 2015, 2015, 2007–2011. [Google Scholar]
  12. Valigi, M.C.; Logozzo, S.; Meli, E.; Rindi, A. New instrumented trolleys and a procedure for automatic 3d optical inspection of railways. Sensors 2020, 20, 2927. [Google Scholar] [CrossRef]
  13. Kuijpers, A.H.W.M.; Schwanen, W.; Bongini, E. Indirect Rail Roughness Measurement: The ARRoW System within the LECAV Project. In Notes on Numerical Fluid Mechanics and Multidisciplinary Design; Springer: Tokyo, Japan, 2012; Volume 118, pp. 563–570. [Google Scholar]
  14. Kendl, F.; Heckelmüller, H.; Krump, G. Korrelation des Schallmesswagen-Pegels mit akustischer Schienenrauheit und Gleisabklingraten. In Proceedings of the DAGA 2016, Aachen, Germany, 14–17 March 2016. [Google Scholar]
  15. Lewis, R.B. Track-recording techniques used on British Rail. IEEE Proc. B Electr. Power Appl. 1984, 131, 73–81. [Google Scholar] [CrossRef]
  16. Bocciolone, M.; Caprioli, A.; Cigada, A.; Collina, A. A measurement system for quick rail inspection and effective track maintenance strategy. Mech. Syst. Signal Process. 2007, 21, 1242–1254. [Google Scholar] [CrossRef]
  17. Bongini, E.; Grassie, S.L.; Saxon, M.J. “Noise mapping” of a railway network: Validation and use of a system based on measurement of axlebox vibration. Notes Numer. Fluid Mech. Multidiscip. Des. 2012, 118, 505–513. [Google Scholar] [CrossRef]
  18. Dittrich, M.G.; Janssens, M.H.A. Improved measurement methods for railway rolling noise. J. Sound Vib. 2000, 231, 595–609. [Google Scholar] [CrossRef]
  19. Phamová, L.; Bauer, P.; Malinský, J.; Richter, M. Indirect method of rail roughness measurement—VUKV implementation and initial results. Notes Numer. Fluid Mech. Multidiscip. Des. 2015, 126, 189–196. [Google Scholar] [CrossRef]
  20. Tufano, A.R.; Chiello, O.; Pallas, M.A.; Faure, B.; Chaufour, C.; Reynaud, E.; Vincent, N. On-board indirect measurements of the acoustic quality of railway track: State-of-the art and simulations. In Proceedings of the Inter-Noise 2019 Madrid—48th International Congrress Exhibition on Noise Control Engineering, Madrid, Spain, 6–19 June 2019. [Google Scholar]
  21. Grassie, S.L. Measurement of railhead longitudinal profiles: A comparison of different techniques. WEAR An Int. J. Sci. Technol. Frict. Lubr. Wear 1996, 191, 245–251. [Google Scholar] [CrossRef]
  22. Tanaka, H.; Shimizu, A.; Sano, K. Development and verification of monitoring tools for realizing effective maintenance of rail corrugation. In Proceedings of the 6th IET Conference on Railway Condition Monitoring (RCM), Birmingham, UK, 17–18 September 2014; Volume 2014, pp. 1–6. [Google Scholar] [CrossRef]
  23. Naganuma, Y.; Tanaka, M.; Ichikawa, K. High-Speed Track Inspection Car in New Dr. Yellow. In Proceedings of the World Congress on Railway Research (WCRR), Cologne, Germany, 25–29 November 2001. [Google Scholar]
  24. Wang, C.; Zeng, J. Combination-Chord Measurement of Rail Corrugation Using Triple-Line Structured-Light Vision: Rectification and Optimization. IEEE Trans. Intell. Transp. Syst. 2020, 22, 7256–7265. [Google Scholar] [CrossRef]
  25. Jeong, D.; Choi, H.S.; Choi, Y.J.; Jeong, W. Measuring acoustic roughness of a longitudinal railhead profile using a multi-sensor integration technique. Sensors 2019, 19, 1610. [Google Scholar] [CrossRef] [Green Version]
  26. Li, Y.; Liu, H.; Ma, Z.; Wang, C.; Zhong, X. Rail Corrugation Broadband Measurement Based on Combination-Chord Model and LS. IEEE Trans. Instrum. Meas. 2018, 67, 938–949. [Google Scholar] [CrossRef]
  27. Chen, T.L.; Yao-Hui, L.; Zeng, J.; Zhang, L.M. Modal and local modal analysis of high speed train car-body. In Applied Mechanics and Materials; Trans Tech Publications Ltd.: Bäch, Switzerland, 2012; Volume 215, pp. 800–803. [Google Scholar]
  28. DIN EN 13848-1; Bahnanwendungen—Oberbau—Gleislagequalität—Teil 1: Beschreibung der Gleisgeometrie. Deutsche Fassung EN 13848-1:2019; Beuth Verlag: Berlin, Germany, 2019.
  29. Dumitriu, M. Influence of the Longitudinal and Lateral Suspension Damping on the Vibration Behaviour in the Railway Vehicles. Arch. Mech. Eng. 2015, 62, 115–140. [Google Scholar] [CrossRef]
  30. Kouroussis, G.; Connolly, D.P.; Verlinden, O. Railway-induced ground vibrations—A review of vehicle effects. Int. J. Rail Transp. 2014, 2, 69–110. [Google Scholar] [CrossRef] [Green Version]
Figure 1. Test stand including sensor plate and pneumatic actuators.
Applsci 12 07732 g001
Figure 2. Water and dust on the rail surface.
Applsci 12 07732 g002
Figure 3. Sensor configuration mounted on the sensor plate and four included chord methods.
Applsci 12 07732 g003
Figure 4. The transfer function for the different chord methods in the wavelength range between 80 mm and 100 mm.
Applsci 12 07732 g004
Figure 5. Absolute error of acoustic roughness for undisturbed measurements (chord method and single sensor), for constant velocity (undisturbed), acceleration during measurement and under influence of an additional heat flux.
Applsci 12 07732 g005
Figure 6. Absolute error of acoustic roughness for an undisturbed measurement (chord method), for a measurement with water on the rail surface and for a measurement with dust on the rail.
Applsci 12 07732 g006
Figure 7. Absolute error of acoustic roughness for measurements with sensor plate displacements (amplitude indicated as levels).
Applsci 12 07732 g007
Figure 8. Absolute error of acoustic roughness for measurements with tilting of the sensor plate (amplitude indicated as levels).
Applsci 12 07732 g008
Figure 9. Absolute error of acoustic roughness for measurements with vibration applied to the sensor plate (frequency indicated as levels).
Applsci 12 07732 g009
Figure 10. Absolute error of acoustic roughness for an undisturbed measurement and comparison of different chord lengths with the optimization approach.
Applsci 12 07732 g010
Table 1. Chord parameters for the methods integrated into the setup.
Designation L 1 = a L
[mm]
L 2 = L a L
[mm]
Chord   Length   L
[mm]
a
[-]
3AP1 (Three-Point Asymmetrical 1)1681132810.598
3AP2 (Three-Point Asymmetrical 2)1682183860.435
3AP3 (Three-Point Asymmetrical 3)2811053860.728
3AP4 (Three-Point Asymmetrical 4)1131052180.518
Publisher’s Note: MDPI stays neutral with regard to jurisdictional claims in published maps and institutional affiliations.

