
The Usefulness of Gradient-Weighted CAM in Assisting Medical Diagnoses

Abstract
:Featured Application
Abstract
1. Introduction
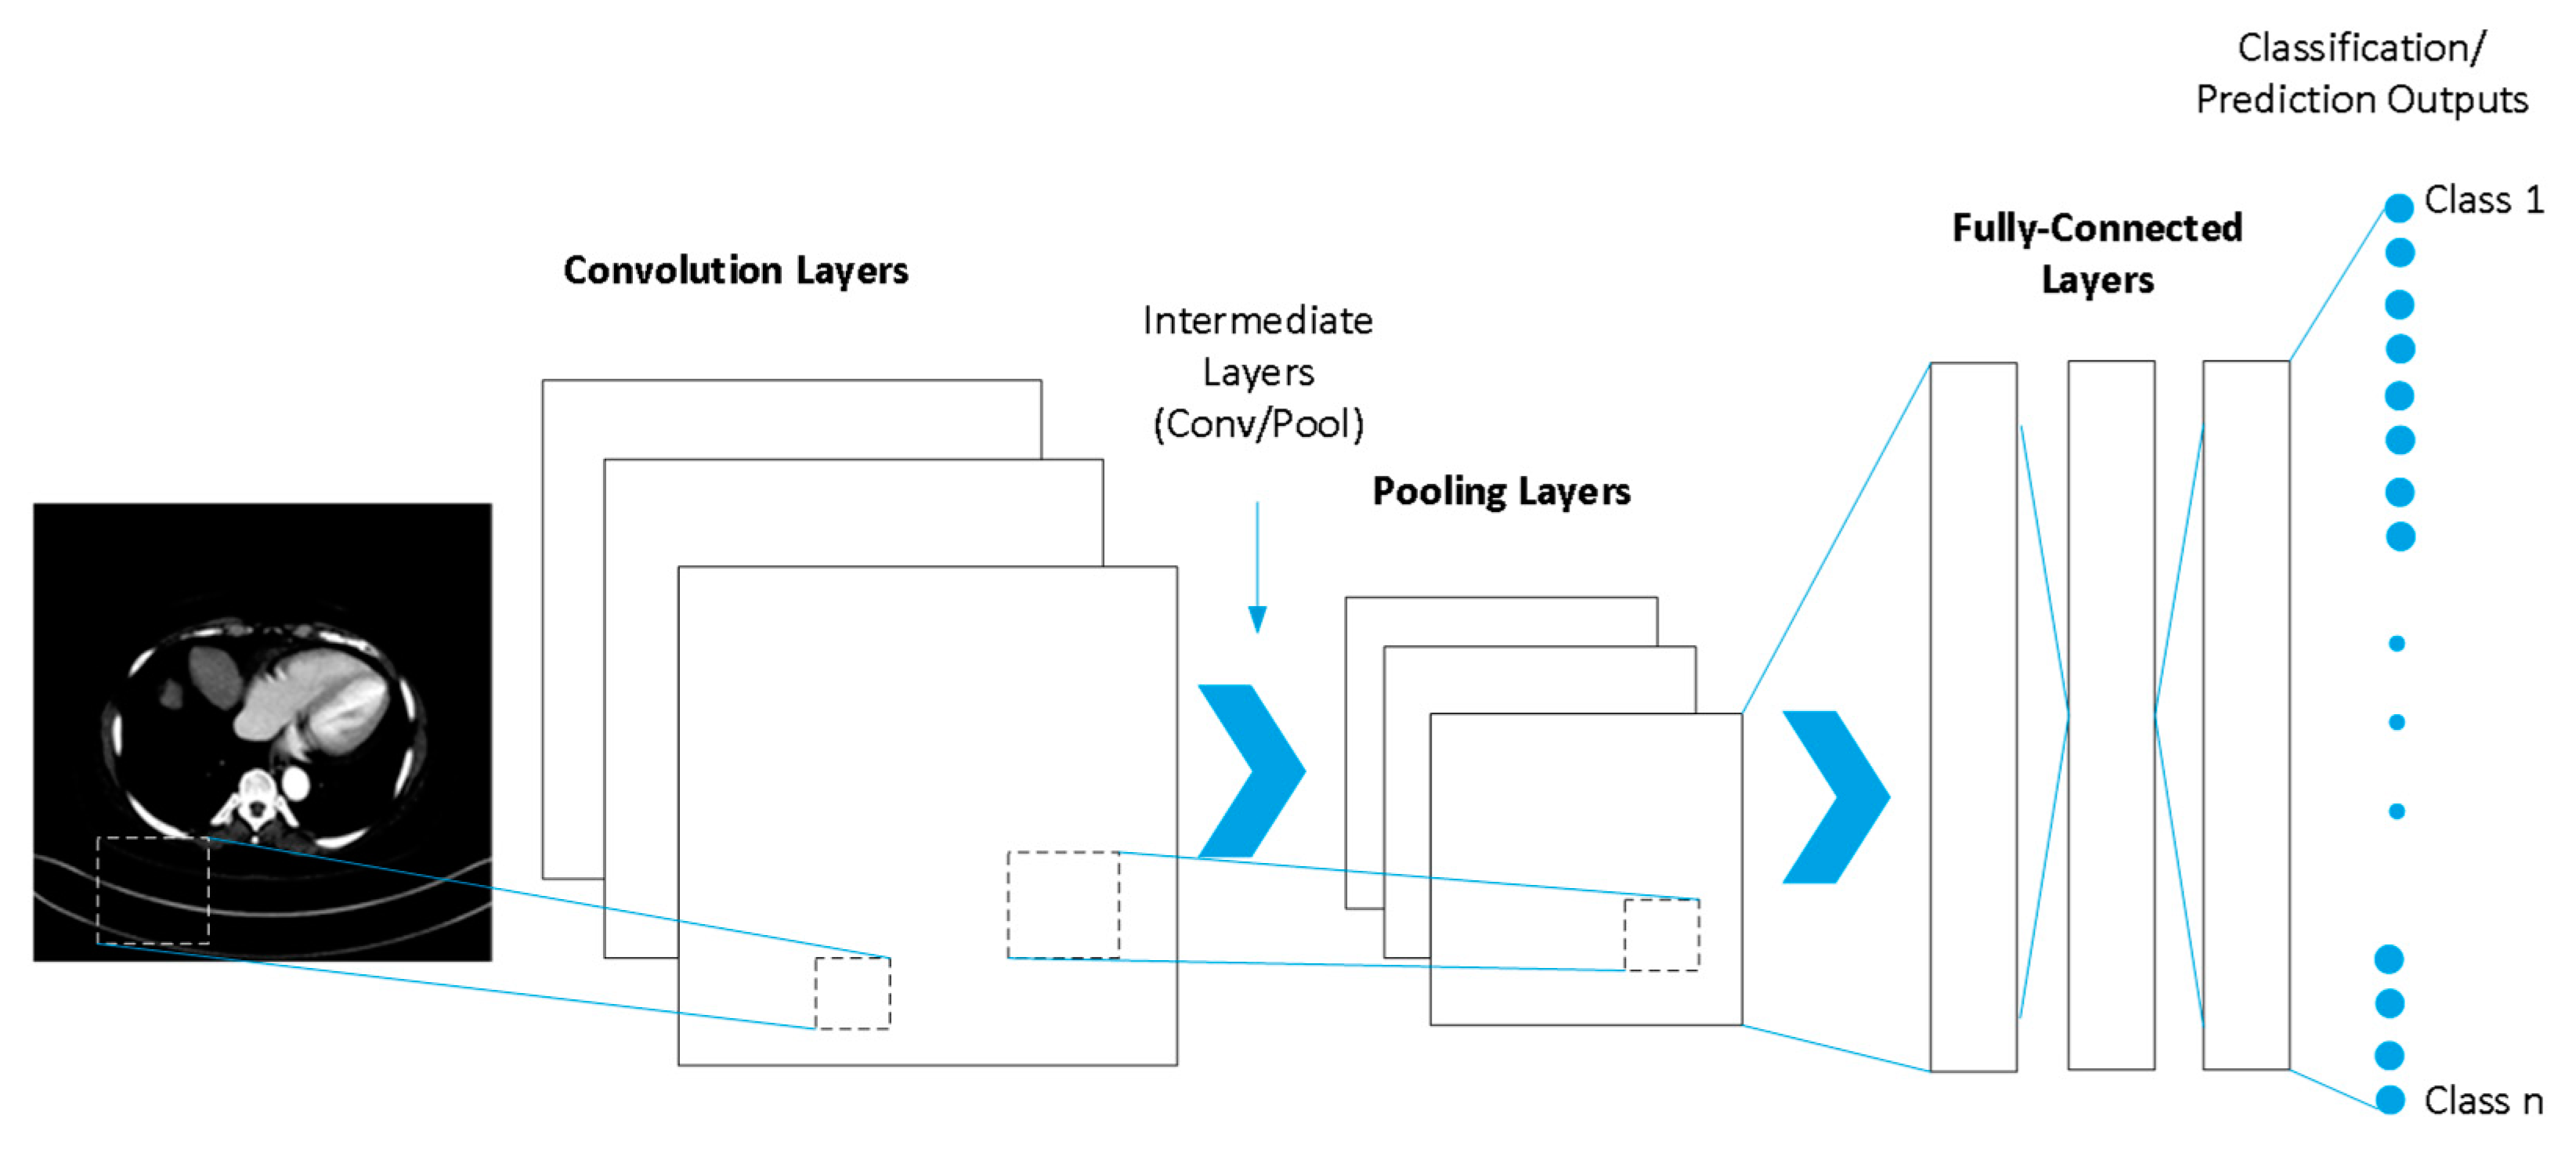
2. Method
- (1)
- Conv2d: This block constitutes a 2D convolutional layer that creates a convolutional kernel that varies with the layer input and helps to produce the output tensor. The kernel is a convolutional matrix or mask, which can be used for enhancing desired features on its input by convolving it with the input matrix, which can be an image or output from the previous layer.
- (2)
- MaxPool2D: This block is the pooling layer, which retains only the largest value in each 2D sub-block of its input, respectively.
- (3)
- Flatten: This block takes the multidimensional input from the MaxPool2D layer and flattens the whole thing into a one-dimensional output; this is commonly used in the transition from the convolutional layer to the fully connected layer.
- (4)
- Dropout: This block is used in machine learning to help solve the overfitting problem when training. It prevents overfitting by randomly turning off the connections between the input and hidden neurons.
- (5)
- Linear: This block is the module used to perform linear calculations, i.e., y = ATx + b. It is part of the fully connected layer.
- (6)
- AvgPool2d: This block is the pooling layer, which retains only the average values in each 2D sub-block of its input, respectively.
- (7)
- Sigmoid: This block is the activation function, which can be mathematically described. It approximates the recognizable S-shaped curve, which is often used for logistic regression in basic neural network implementation.
3. Results
4. Discussion
5. Conclusions
Author Contributions
Funding
Institutional Review Board Statement
Informed Consent Statement
Data Availability Statement
Acknowledgments
Conflicts of Interest
References
- Cheng, J.Z.; Ni, D.; Chou, Y.H.; Qin, J.; Tiu, C.; Chang, Y.; Huang, C.; Shen, D.; Chen, C. Computer-Aided Diagnosis with Deep Learning Architecture: Applications to Breast Lesions in US Images and Pulmonary Nodules in CT Scans. Sci. Rep. 2016, 6, 24454. [Google Scholar] [CrossRef] [Green Version]
- Azour, F.; Boukerche, A. Design Guidelines for Mammogram-Based Computer-Aided Systems Using Deep Learning Techniques. IEEE Access 2022, 10, 21701–21726. [Google Scholar] [CrossRef]
- Hu, Q.; Whitney, H.M.; Giger, M.L. A deep learning methodology for improved breast cancer diagnosis using multiparametric MRI. Sci. Rep. 2020, 10, 10536. [Google Scholar] [CrossRef] [PubMed]
- Fonollà, R.; van der Zander, Q.E.W.; Schreuder, R.M.; Masclee, A.A.M.; Schoon, E.J.; van der Sommen, F.; de With, P.H.N. A CNN CADx System for Multimodal Classification of Colorectal Polyps Combining WL, BLI, and LCI Modalities. Appl. Sci. 2020, 10, 5040. [Google Scholar] [CrossRef]
- Khan, M.B.; Islam, M.T.; Ahmad, M. A CNN-based CADx Model for Pneumonia Detection from Chest Radiographs with Web Application. In Proceedings of the 2021 International Conference on Science & Contemporary Technologies (ICSCT), Dhaka, Bangladesh, 5–7 August 2021; pp. 1–5. [Google Scholar]
- Available online: https://towardsdatascience.com/convolutional-neural-network-feature-map-and-filter-visualization-f75012a5a49c (accessed on 10 February 2022).
- Shaban-Nejad, A.; Michalowski, M.; Brownstein, J.S.; Buckeridge, D.L. Guest Editorial Explainable AI: Towards Fairness, Accountability, Transparency and Trust in Healthcare. IEEE J. Biomed. Health Inform. 2021, 25, 2374–2375. [Google Scholar] [CrossRef]
- Joshi, G.; Walambe, R.; Kotecha, K. A Review on Explainability in Multimodal Deep Neural Nets. IEEE Access 2021, 9, 59800–59821. [Google Scholar] [CrossRef]
- Singh, A.; Sengupta, S.; Lakshminarayanan, V. Explainable Deep Learning Models in Medical Image Analysis. J. Imaging 2020, 6, 52. [Google Scholar] [CrossRef] [PubMed]
- Zhou, B.; Khosla, A.; Lapedriza, A.; Oliva, A.; Torralba, A. Learning Deep Features for Discriminative Localization. In Proceedings of the 2016 IEEE Conference on Computer Vision and Pattern Recognition (CVPR), Las Vegas, NV, USA, 27–30 June 2016; pp. 2921–2929. [Google Scholar]
- Simonyan, K.; Vedaldi, A.; Zisserman, A. Deep Inside Convolutional Networks: Visualising Image Classification Models and Saliency Maps. In Proceedings of the Workshop at International Conference on Learning Representations, Banff, AB, Canada, 14–16 April 2014. [Google Scholar]
- Selvaraju, R.R.; Cogswell, M.; Das, A.; Vedantam, R.; Parikh, D.; Batra, D. Grad-CAM: Visual Explanations from Deep Networks via Gradient-Based Localization. In Proceedings of the 2017 IEEE International Conference on Computer Vision (ICCV), Venice, Italy, 22–29 October 2017; pp. 618–626. [Google Scholar]
- Chattopadhay, A.; Sarkar, A.; Howlader, P.; Balasubramanian, V.N. Grad-CAM++: Generalized Gradient-Based Visual Explanations for Deep Convolutional Networks. In Proceedings of the 2018 IEEE Winter Conference on Applications of Computer Vision (WACV), Lake Tahoe, NV, USA, 12–15 March 2018; pp. 839–847. [Google Scholar]
- Zhang, Y.; Hong, D.; McClement, D.; Oladosu, O.; Pridham, G.; Slaney, G. Grad-CAM helps interpret the deep learning models trained to classify multiple sclerosis types using clinical brain magnetic resonance imaging. J. Neurosci. Methods 2021, 353, 109098. [Google Scholar] [CrossRef] [PubMed]
- Saporta, A.; Gui, X.; Agrawal, A.; Pareek, A.; Truong, S.Q.H.; Nguyen, C.D.T.; Ngo, V.; Seekins, J.; Blankenberg, F.G.; Ng, A.Y.; et al. Benchmarking saliency methods for chest X-ray interpretation. medRxiv 2021. [Google Scholar] [CrossRef]
- Lizzi, F.; Scapicchio, C.; Laruina, F.; Retico, A.; Fantacci, M.E. Convolutional Neural Networks for Breast Density Classification: Performance and Explanation Insights. Appl. Sci. 2022, 12, 148. [Google Scholar] [CrossRef]
- Gichoyo, J.W.; Banerjee, I.; Bhimireddy, A.R.; Burns, J.L.; Celi, L.A.; Chen, L.; Correa, R.; Dullerud, N.; Ghassemi, M.; Huang, S.; et al. AI recognition of patient race in medical imaging: A modelling study. Lancet Digit. Health 2022, 4, e406–e414. [Google Scholar] [CrossRef]
- Available online: https://nihcc.app.box.com/v/DeepLesion (accessed on 5 January 2022).
- Available online: https://colab.research.google.com (accessed on 15 March 2022).
- Kimman, M.; Norman, R.; Jan, S.; Kingston, D.; Woodward, M. The burden of cancer in member countries of the Association of Southeast Asian Nations (ASEAN). Asian Pac. J. Cancer Prev. 2012, 13, 411–420. [Google Scholar] [CrossRef] [Green Version]
- Yan, K.; Wang, X.; Lu, L.; Summers, R.M. DeepLesion: Automated mining of large-scale lesion annotations and universal lesion detection with deep learning. J. Med. Imaging 2018, 5, 036501. [Google Scholar] [CrossRef]


| Paper Reference | Summary |
|---|---|
| [14] | Compared the heat-maps generated using CAM, Grad-CAM, and Grad-CAM++ using 3 types of multiple sclerosis MRI images using the best-performing CNN models in terms of classification accuracy and concluded that Grad-CAM shows the best heat-map localizing ability. |
| [15] | Compared the heat-maps generated by Saliency Map, Grad-CAM, and Grad-CAM++ using chest X-ray images. Found that Grad-CAM generally localized pathologies better than the other methods, but slightly worse than the human benchmark. |
| [16] | Evaluated the performance of Grad-CAM on breast mammogram images, and showed that Grad-CAM has good localization capability after the pectoral muscle was removed from the images. Concluded that for improving diagnosis, classification accuracy as well as obtaining a reasonable heat-map is important. |
| First Run: | Second Run: | ||
|---|---|---|---|
| Training Sample Error Rate | 5% | Training Sample Error Rate | 5% |
| Testing Sample Error Rate | 14.586% | Testing Sample Error Rate | 8.091% |
| Accuracy | 85.414% | Accuracy | 91.909% |
| Image Number | Overlaid Image | Deep Lesion Label | CNN Result | Clinical Radiologist’s Diagnosis | Grad-CAM Helpfulness |
|---|---|---|---|---|---|
| 1 |  | Has Tumor | Has Tumor | Has Tumor | Some |
| 2 |  | Has Tumor | Has Tumor | Has Tumor | Yes |
| 3 |  | Has Tumor | Has Tumor | Has Tumor | Yes |
| 4 |  | Has Tumor | Has Tumor | Has Tumor | Yes |
| 5 |  | Has Tumor | Has Tumor | Has Tumor | Yes |
| 6 |  | No Tumor | Has Tumor | Has Tumor | Yes |
| 7 |  | Has Tumor | Has Tumor | Has Tumor | Yes |
| 8 |  | Has Tumor | Has Tumor | Has Tumor | Yes |
| 9 |  | Has Tumor | Has Tumor | Has Tumor | Some |
| 10 |  | Has Tumor | Has Tumor | Has Tumor | Yes |
| 11 |  | Has Tumor | Has Tumor | No Tumor (Cyst) | Some |
| 12 |  | Has Tumor | Has Tumor | Has Tumor | Yes |
| 13 |  | Has Tumor | Has Tumor | No Tumor | Yes |
| 14 |  | Has Tumor | Has Tumor | No Tumor (Inflammation of the Biliary Tract) | Some |
| 15 |  | No Tumor | Has Tumor | No Tumor (Cyst) | Some |
| 16 |  | Has Tumor | Has Tumor | Has Tumor | Yes |
Publisher’s Note: MDPI stays neutral with regard to jurisdictional claims in published maps and institutional affiliations. |
© 2022 by the authors. Licensee MDPI, Basel, Switzerland. This article is an open access article distributed under the terms and conditions of the Creative Commons Attribution (CC BY) license (https://creativecommons.org/licenses/by/4.0/).
Share and Cite
Chien, J.-C.; Lee, J.-D.; Hu, C.-S.; Wu, C.-T. The Usefulness of Gradient-Weighted CAM in Assisting Medical Diagnoses. Appl. Sci. 2022, 12, 7748. https://doi.org/10.3390/app12157748
Chien J-C, Lee J-D, Hu C-S, Wu C-T. The Usefulness of Gradient-Weighted CAM in Assisting Medical Diagnoses. Applied Sciences. 2022; 12(15):7748. https://doi.org/10.3390/app12157748
Chicago/Turabian StyleChien, Jong-Chih, Jiann-Der Lee, Ching-Shu Hu, and Chieh-Tsai Wu. 2022. "The Usefulness of Gradient-Weighted CAM in Assisting Medical Diagnoses" Applied Sciences 12, no. 15: 7748. https://doi.org/10.3390/app12157748