Article

Effect of the Cadmium Telluride Deposition Method on the Covering Degree of Electrodes Based on Copper Nanowire Arrays

1
Research and Development Center for Materials and Electronic & Optoelectronic Devices (MDEO), Faculty of Physics, University of Bucharest, 077125 Măgurele, Ilfov, Romania
2
National Institute for Laser, Plasma and Radiation Physics (INFLPR), 077125 Măgurele, Ilfov, Romania
3
National Institute of Materials Physics (NIMP), 077125 Măgurele, Ilfov, Romania
4
Academy of Romanian Scientists (AOSR), 050094 Bucharest, Romania
5
Institute of Condensed Matter and Nanosciences (IMCN), Université catholique de Louvain (UCLouvain), B-1348 Louvain-la-Neuve, Belgium
6
Center of Materials Technology and Photonics, School of Engineering, Hellenic Mediterranean University, 71410 Heraklion, Greece
7
National Institute for Research and Development in Microtechnologies (IMT), 023573 Bucharest, Romania
*
Authors to whom correspondence should be addressed.
Appl. Sci. 2022, 12(15), 7808; https://doi.org/10.3390/app12157808
Submission received: 20 July 2022 / Revised: 30 July 2022 / Accepted: 1 August 2022 / Published: 3 August 2022

Abstract

:
In this work, we report the preparation of nanostructured electrodes based on dense arrays of vertically-aligned copper (Cu) nanowires (NWs) to be subsequently covered by cadmium telluride (CdTe) thin films, with great potential to be used within “substrate”-type photovoltaic cells based on A I I -B V I heterojunctions. In particular, the multi-step preparation protocol presented here involves an electrochemical synthesis procedure within a supported anodic aluminum oxide (AAO) nanoporous template for first generating a homogeneous array of vertically-aligned Cu NWs, which are then further embedded within a compact CdTe thin film. In a second stage, we tested three deposition methods (vacuum thermal evaporation, VTE; radio-frequency magnetron sputtering, RF-MS; and electrochemical deposition, ECD) for use in obtaining CdTe layers potentially able to consistently penetrate the previously prepared Cu NWs array. A comparative analysis was performed to critically evaluate the morphological, optical, and structural properties of the deposited CdTe films. The presented results demonstrate that under optimized processing conditions, the ECD approach could potentially allow the cost-effective fabrication of absorber layer/collecting electrode CdTe/Cu nanostructured interfaces that could improve charge collection mechanisms, which in turn could allow the fabrication of more efficient solar cells based on A I I -B V I semiconducting compounds.

1. Introduction

Among the A I I -B V I semiconducting compounds [1,2,3], Cadmium Telluride (CdTe) is a p-type semiconductor with excellent physical and chemical properties [4], and is commonly used as photoabsorbing layer within optoelectronic devices such as infrared windows [5], electro-optic modulators [6], electroluminescent diodes [7], nuclear detectors [8], and solar cells [9]. For the latter category, the ideal band gap of CdTe (1.51 eV), as well as its outstanding stability against ionizing radiations (including cosmic rays), render it particularly interesting for both terrestrial and space-based solar photoconversion applications [10,11]. In such scenarios, the photovoltaic element typically relies on a “substrate”-type configuration, in which the CdTe absorber is synthesized on top of a back-electrode typically made of a thin film of gold (Au), copper (Cu), or an Au:Cu combination [12,13]. Consequently, a finite Schottky barrier inherently appears at the interface between the CdTe layer and the metallic film, potentially lowering the photogenerated charge carriers’ collection and hence diminishing the power conversion efficiency (PCE) of these kind of thin film-based solar cells. Unfortunately, the properties of this interface are not simply affected by the metal work function and semiconductor band structure, and depend considerably on the initial surface morphology of the materials. For instance, the Schottky barrier height can be decreased by carefully optimizing the contact interface between the layers in order to enhance the performance of such solar cells [14].
Although these systems have been widely studied theoretically [14,15], little has been reported regarding the experimental optimization of metal/CdTe heterojunctions for photovoltaic applications [16]. In this regard, by exploiting the advantages of up-to-date nanotechnologies it may be possible to obtain an improved interface by first creating a large array of vertically-aligned metallic nanowires (NWs) acting as a back-electrode, then fully embedding them within a consistent CdTe layer to ultimately secure a considerably enlarged electrically-active medium. Furthermore, the fabrication of “brush”-like electrodes is of particular interest for “substrate”-type photovoltaic structures based on semiconducting A I I -B V I heterojunctions, as such perpendicular metallic NWs can be designed to approach the spatial charge region. Hence, they can be expected to play an important role in the charge collection mechanism, currently one of the limiting factors in achieving high efficiency from this type of solar cells [17].
However, the design of such well-controlled arrays of one-dimensional (1D) nanoarchitectures in a low-cost manner and with easily tunable geometrical features faces several limitations. Thus far, complex patterning methods such as electron-beam lithography, nanoimprinting, and nanosphere lithography have been employed to create vertically-aligned NWs with excellent spatial and geometric control; however, their fabrication involves high costs and time-consuming methods [18,19,20]. Alternatively, more cost-effective methods have been developed entailing an electrochemical synthesis approach within a suitable nanoporous template, such as track-etched polycarbonate (PC) or anodic aluminum oxide (AAO) membranes, where the resulting array of NWs represents an inverse replica of the initial nanoporous host [21,22]. AAO is generally preferred thanks to its dense and highly-ordered hexagonally-packed nanopore arrangement, which favourably compares to the typical random distribution and low-density profile of the nanopores within a PC template. In addition, facile control of the nanopores’ geometrical aspect by simple regulation of the anodization parameters, as well as the possibility of generating thin supported AAO nanoporous films which adhere well on various substrates, render this template-based technology suitable for cost-effective preparation of dense arrays of parallel vertically-standing NWs. This method features acceptable control over the aspect ratio and density [23,24], which are important parameters to take into account when employing AAO for nanostructured back-electrodes in “substrate”-type solar cells based on A I I -B V I heterojunctions.
Nevertheless, in order to achieve a compact and void-free NW-based metal/CdTe interface advantageously engaged within A I I -B V I compound-based solar cells, one of the main challenges lies in seeking out a suitable CdTe deposition method to evenly fill the gaps through the NW array. Previous reports on embedding vertically-aligned NWs into an organic or inorganic matrix revealed that adequate optimization of the NW pitch and aspect ratio are required, and that the best strategy to fill the NW space is tremendously important, as the embedding-material should uniformly protrude through the NWs in order to secure a maximized interface area with superior electrical properties [24,25,26]. To the best of our knowledge, optimization studies of the morphological and structural quality of CdTe thin films capable of uniformly penetrating a dense array of vertically-aligned metallic NWs remain limited. In this work, a fabrication protocol with great potential for low-cost and effective preparation of CdTe-embedded Cu nanowire arrays is described. The method relies on a multi-step process in which the CdTe film is deposited on a dense array of vertically-aligned Cu NWs; these are previously prepared through an electrochemical synthesis procedure within a supported AAO nanoporous template. We subsequently carried out comparative evaluations of the morphological and structural quality of the CdTe thin films obtained by different techniques, namely, vacuum thermal evaporation (VTE), radio-frequency magnetron sputtering (RF-MS), and electrochemical deposition (ECD). The results show promising results when employing the electrochemical synthesis approach for CdTe thin film deposition under optimized processing conditions. Hence, the presented work deserves consideration in the future, as it demonstrates that this is a reliable and cost-effective method for production of absorber layer/collecting electrode CdTe/Cu nanostructured interfaces for affordable and more efficient “substrate”-type solar cells based on A I I -B V I heterojunctions.

2. Materials and Methods

2.1. Sample Preparation

Analytical grade reagents (Merck KGaA, Darmstadt, Germany) were used throughout this work as provided. Ultra-pure deionized water (DIW) supplied from a Direct-Q 3 UV (Merck KGaA, Darmstadt, Germany) water purification system was used for preparing the aqueous electrolytic solutions and for rinsing the samples during the fabrication process flow. A gaseous nitrogen (N 2 ) cylinder (5.0 purity from Linde Gaz S.R.L., Ilfov, Romania) was employed for blow-drying operations. Dense arrays of vertically-aligned Cu NWs were first prepared through electrochemical synthesis within supported nanoporous AAO templates, then in a second step were covered by CdTe thin films synthesized using three deposition methods (Figure 1). Moreover, where appropriate, additional control samples of CdTe thin films deposited on either Au-coated silicon (Si) or glass substrates were prepared under the same conditions as described below in order to allow subsequent morphological, structural, and optical studies of the obtained CdTe layers, assuming that the evaluated properties were comparable to the CdTe films within the prepared CdTe/Cu nanostructured interfaces. The latter assumption is especially valid for micrometer-thick films (as in this work), in which case the underlying substrate structure and surface roughness effects can be neglected, as they predominately manifest near the substrate–film interface.
In the first stage, the substrate was prepared by in-situ direct-current (DC) sputtering of a multi-layer sequence consisting of Ti/Au/Ti/Al (5/50/5/1000 nm) onto a freshly cleaned p-doped <100> Si substrate (525 μ m thickness and 5 m Ω · cm resistivity) (SIEGERT WAFER GmbH, Aachen, Germany) using commercially-available targets (Kurt J. Lesker Limited, Saint Leonards-on-sea, United Kingdom) and a Plassys MP500S magnetron as sputtering equipment (PLASSYS Bestek, Marolles-en-Hurepoix, France) (Figure 1a). The processing plasma parameters have been detailed elsewhere [27]. In this configuration, the thin Au film is the actual electrode, the aluminum (Al) layer is introduced to develop the supported AAO template through anodization, and the ultra-thin titanium (Ti) film is used to enhance the adhesion between successive metallic layers.
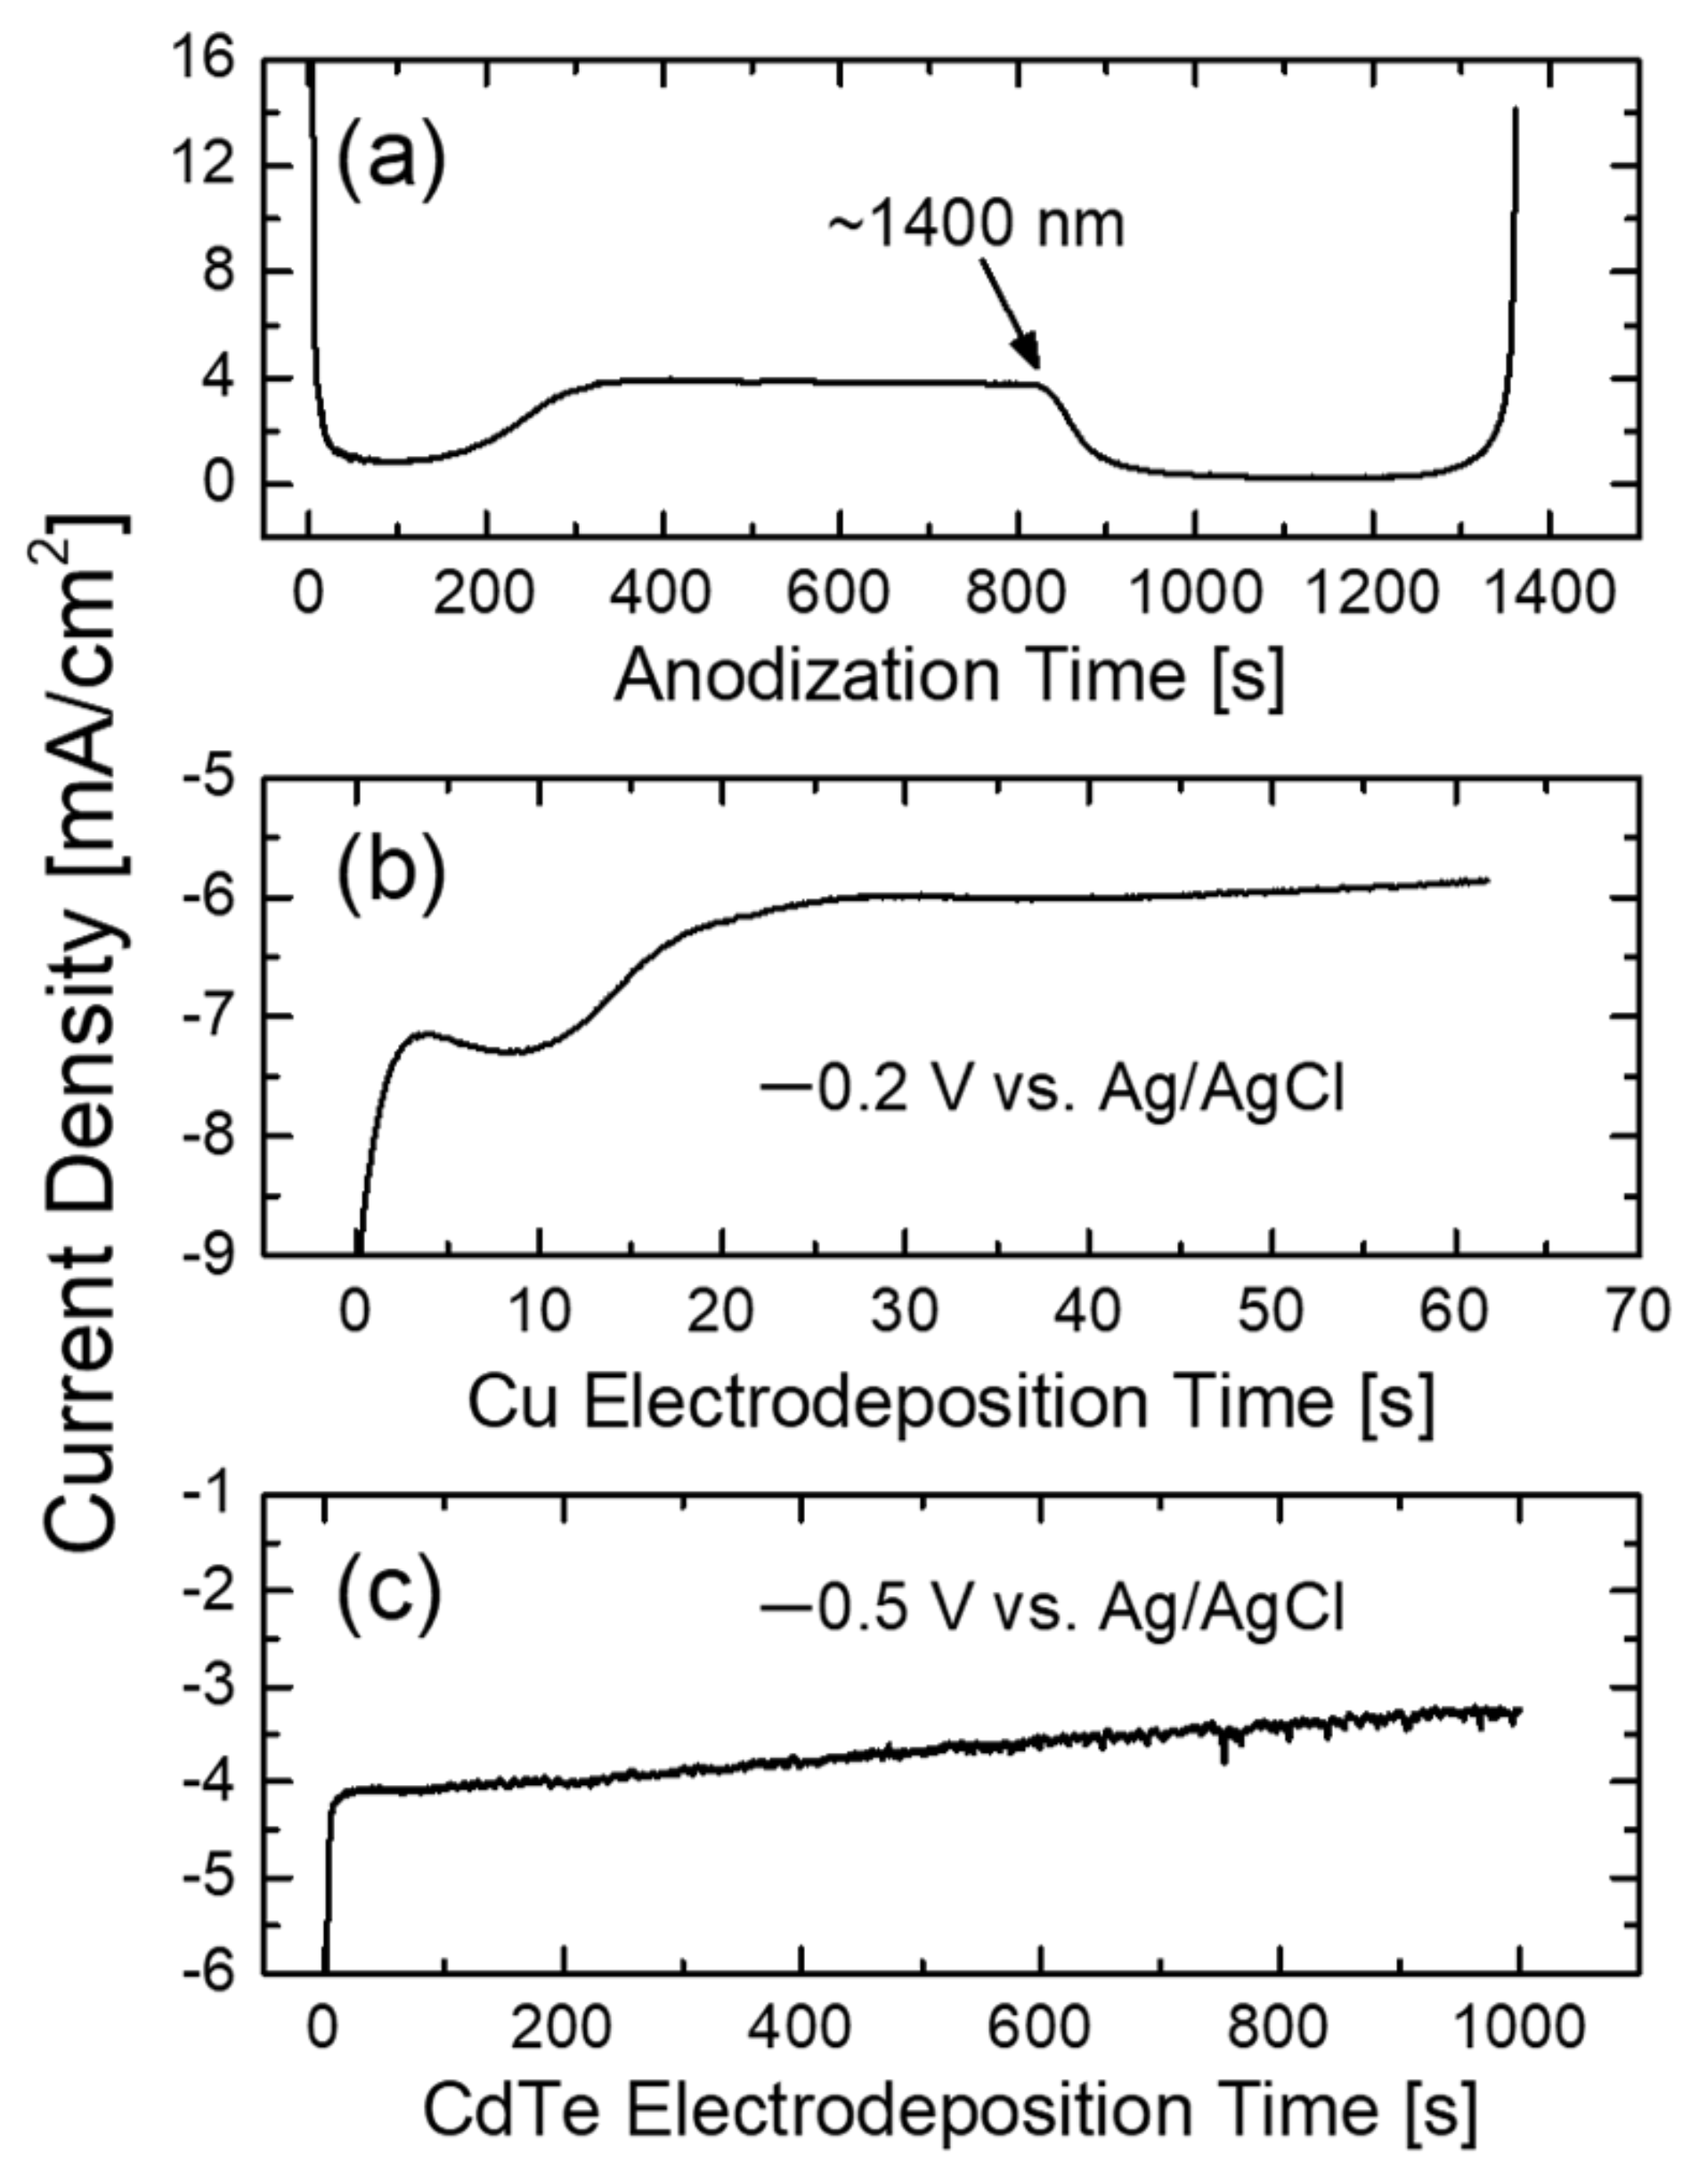
The as-prepared substrate was afterwards subjected to an anodization process in order to entirely convert the Al film into a supported nanoporous AAO template with parallel quasi-cylindrical nanochannels reaching the Au conducting underlayer. The electrochemical process was carried out in a thermo-regulated electrolytic cell, using a two-electrode configuration by applying 60 V from a Keithley 2460 High Current SourceMeter (Source Measure Unit, Tektronix Inc., Beaverton, OR, USA) in 0.3 M oxalic acid solution kept at 2 C, followed by a chemical widening process of the nanopores in 0.5 M H 2 SO 4 at 40 C for 85 min (Figure 1b). The current curve obtained for entirely anodizing the Al layer (1 μ m thick) is presented in Figure 2a. As explained elsewhere [23,24,27], the measured current density drops at the beginning of the process due to the formation of a compact barrier-type Al 2 O 3 on the initial Al surface, leading to a plateau when a competitive equilibrium between field-enhanced Al 2 O 3 dissolution and Al 2 O 3 formation is established before sharply increasing at the end of the process as the nanopores progressively approach the Au electrode.
Subsequently, an optimized electrochemical deposition protocol was employed to grow Cu within the AAO nanopores, by using a three-electrode potentiostatic setup using a Voltalab PGZ-100 Potentiostat (Radiometer Analytical Inc., Hegnau, Switzerland). In brief, −0.2 V was applied versus an Ag/AgCl reference electrode (KCl-saturated, E = 0.197 V against Normal Hydrogen Electrode, NHE) installed in a Cu commercially-available electroplating bath kept at room temperature. The Au underlayer was the working electrode and a platinum (Pt) strip acted as the auxiliary electrode (Figure 1c). Electrodeposition duration was adjusted to 250–300 s to avoid the nanoporous AAO template overfilling and obtain the Cu NWs in a free-standing vertical orientation on the Au-coated Si substrate. The obtained cathodic reduction current curve for Cu electrodeposition inside the AAO nanopores is presented in Figure 2b, resembling to the typical behavior of an AAO-assisted chronoamperometric process. It can be seen that fast diffusion of cations occurs first towards the bottom of the nanopores. This is suggested by the sharp negative increase in the current, subsequently followed by a current plateau when the gradient of ion concentration in the solution reaches an equilibrium, which mainly relates to the vertical growth of NWs within the AAO nanopores. The vertically-standing arrays of Cu NWs were revealed by entirely dissolving the AAO template in a 2 M NaOH solution for 10 min at room temperature, then gently rinsing the samples with DIW and leaving them to dry in a vacuum desiccator to prevent the superficial oxidation of the Cu NWs under ambient conditions before further manipulation. The optimized preparation conditions determined the formation of dense and robust arrays of vertically-standing Cu NWs with an average diameter value around 90 nm, a center-to-center distance of about 150 nm, and typical lengths of 350 nm (see Section 3.1).
In a second stage, the prepared arrays of vertically-oriented Cu NWs were covered with thin CdTe films, employing three different deposition methods (Figure 1d): (i) vacuum thermal evaporation (VTE); (ii) radio-frequency magnetron sputtering (RF-MS); and (iii) electrochemical deposition (ECD). The evaporated CdTe thin films were obtained at a working pressure of 8 × 10 4 torr, a substrate temperature of 260 C, and a source (CdTe powder) temperature of 650 C, while the evaporation time was set to 3 min using a Balzers BA 510 evaporation system (Oerlikon Balzers Limited, Balzers, Liechtenstein). The VTE process was followed by thermal treatment of the samples at 320 C for 10 min, mainly to improve the CdTe intrinsic morphology and crystallinity. For the CdTe RF-MS procedure, a commercial CdTe target (PI-KEM Limited, Wilnecote, Tamworth, United Kingdom) was employed, and the RF plasma was engaged at 90 W in an Argon (Ar) atmosphere kept at 4.4 × 10 3 mbar for a duration of 90 min using a tectra Sputter-Coater (tectra GmbH, Frankfurt, Germany). The substrate temperature during the RF-MS process was maintained at 250 C.
A commonly-established CdTe ECD protocol was performed according to the existing literature reports [28,29,30,31] and subsequently adapted to be applied on the particular Cu NWs-based Au-coated Si substrate. The ECD process used here relied on a chronoamperometric technique applied in a Te-diluted electrolytic solution consisting of 0.5 M 3CdSO 4 · 8H 2 O, 0.5 mM TeO 2 , and 25 mM H 2 SO 4 (95% concentrated). The electrolyte was obtained in three steps: a Te-based stock solution was first prepared by dissolving the TeO 2 powder in concentrated H 2 SO 4 under vigorous stirring; then, an aqueous Cd-based stock solution was made; and subsequently, the electrolytic bath was finalized by mixing out the two stock solutions. Notably, the Te and Cd species were used in a 1:10 3 ratio in the electrolyte due to previous reports that the concentration ratio between the two active species can have a major impact upon the elemental composition of the obtained CdTe thin film, as a Te-rich electrolyte could determine the occurrence of separated Cd and Te crystalline phases [30]. The ECD process was then carried out in a three-electrode potentiostatic configuration using a Voltalab PGZ-100 Potentiostat (Radiometer Analytical Inc., Hegnau, Switzerland). In this setup, the array of Cu NWs vertically aligned to the Au-coated Si substrate represented the working electrode and a Pt strip was used as auxiliary electrode. The CdTe film was grown by applying −0.5 V versus an Ag/AgCl reference electrode (KCl-saturated, E = 0.197 V against NHE), while the process temperature was maintained at 60 C. As is well known, ECD is typically a low-temperature process when compared to the VTE or RF-MS alternatives, allowing CdTe thin films with good structural properties to be obtained at temperatures even below 60 C [28]. The overall electrochemical growth of CdTe has been commonly reported to occur in two steps, with the cathodic reduction of HTeO 2 + to Te (Equation (1)) subsequently accompanied by the temperature-mediated reaction of Te with Cd 2 + (Equation (2)), ultimately favoring CdTe formation [32,33]:
H T e O 2 + + 3 H + + 4 e T e + 2 H 2 O
C d 2 + + T e + 2 e C d T e
Notably, the overall process of CdTe electrochemical synthesis is diffusion-controlled, with ECD potential playing a crucial role in establishing the Cd/Te atomic ratio within electrodeposited CdTe films. In this context, it has been previously demonstrated that a more negative potential leads to the formation of Cd-rich n-type deposits, while in the opposite conditions Te-rich p-type deposits are obtained. Only within a narrow potential electrodeposition range is the Cd/Te atomic ratio equal to unity, favoring the formation of stoichiometric CdTe thin films [29,34]. Figure 2c presents the cathodic chronoamperometric current curve obtained during the electrochemical growth of CdTe on the Cu NWs for about 15 min; the higher current on the application of the constant potential is attributed to the fast diffusion of anion species through the Cu NWs and subsequent formation of double-layer charges between the electrode’s surface and the electrolytic solution, while the sudden change in the current marks the beginning of the CdTe nucleation process.

2.2. Sample Characterization

Morphological characterization of the Cu NWs and of the CdTe-covered Cu NWs samples was first carried out using a Tescan VEGA II Scanning Electron Microscope (SEM) (TESCAN ORSAY HOLDING, a.s., Brno-Kohoutovice, Czech Republic). For proper characterization, freshly cleaned samples were carefully diced to allow both top-view and cross-sectional analysis, then were subsequently installed on the SEM specimen holder using conducting carbon tape to minimize charging effects during the SEM inspections. At this stage, geometrical parameters of the Cu NWs (i.e., average diameter, center-to-center distance and length) and the thickness of the CdTe thin films deposited onto the Cu NW array were directly measured by SEM. The topography of the obtained CdTe thin films was additionally observed by atomic force microscopy using an AGS-100 Atomic Force Microscope (AFM) (A.P.E. Research, Trieste, Italy) operating in taping mode, and the typical surface-related parameters (Route Means Square Roughness, RMS; Skewness, Ssk; and Excess Kurtosis, K) were extracted.
Structural characterization was afterwards performed by X-ray Diffraction (XRD) using a Bruker D8 Discover diffractometer (Brucker Corp., Billerica, MA, United States) working with Cu K α radiation ( λ K α = 0.154 nm). XRD data were acquired in a symmetric theta–theta geometry in the range of 2 θ = 15–65 and with an angular step of 0.02 . The highlighted CdTe (111) diffraction peaks were then analyzed in detail with a finer angular step of 0.005 , and the resulting experimental data were fitted with a Voight profile to evaluate the structural parameters of the prepared CdTe thin films.
Finally, optical absorption and transmission spectroscopy measurements were performed in the spectral range of 500–1500 nm at room temperature using an Ultraviolet-Visible (UV-VIS) PerkinElmer Lambda 750 spectrophotometer (PerkinElmer, Inc., Waltham, MA, USA). The optical transmission spectra were used to evaluate the thickness values of the CdTe films deposited by VTE and RF-MS onto optical glass substrates, while the optical band gap energies of the CdTe thin films grown by all three methods (i.e., VTE, RF-MS, and ECD), were computed from the corresponding optical absorption spectra. Only for ECD-obtained CdTe thin films were the optical absorption spectrum was evaluated by an indirect approach, using the integrating sphere of the spectrophotometer and measuring the optical reflection, R. Afterwards, the optical absorption, A, was obtained from Equation (3), assuming that the optical transmittance, T, is negligible (as the Au-coated Si substrate is not transparent within the employed spectral range [35]):
A + R + T = 1

3. Results and Discussion

3.1. Morphological Characterizations

As an example, Figure 3a shows the top-view SEM micrograph, acquired after the complete removal of the embedding nanoporous AAO template, of a dense array of vertically-aligned Cu NWs prepared via ECD at a reduction potential of −0.2 V applied versus the Ag/AgCl reference electrode. The inset presents a corresponding tilted SEM image of the Cu NW “forest”. As can be seen, the obtained Cu NWs retain their predominant vertical orientation with respect to the substrate after AAO host removal. Moreover, a homogeneous array of Cu NWs was obtained, whereas it was experimentally observed that their lengths varied between 250–350 nm (depending the duration of the ECD process) and their average diameter was about 90 nm. The latter value, coupled with an observed center-to-center distance of about 150 nm, resembles a densely-packed Cu NW array obtained while employing a supported AAO template with a superficial porosity (P) of ∼32.5%, as estimated with Equation (4) [36]:
P [ % ] = π 2 3 · ϕ 2 D 2 · 100
where ϕ is the average NW diameter and D is the mean distance between the centers of two adjacent NWs, with both geometrical parameters directly evaluated through SEM analysis. Notably, the estimated porosity value was slightly lower compared with other studies [23,24,25,27] due to the specifically selected parameters engaged in the anodization process, ultimately yielding Cu NWs of slightly reduced density. This further facilitates adequate penetration of the CdTe through the NW array.
Figure 3b–d presents cross-sectional SEM micrographs of the Cu NWs supported on the Au-coated Si substrate and subsequently covered by CdTe thin films obtained by VTE (Figure 3b), RF-MS (Figure 3c), and ECD (Figure 3d). As can be seen, the evaporated CdTe film (Figure 3b) is homogeneous with an obvious intrinsic columnar nature due to the selected parameters employed in the VTE process, which favored growth along (111) crystalline plane of the “zinc blende”-type structure of CdTe, as reported elsewhere [37] and as confirmed later by XRD analysis. However, the anisotropic behavior of the CdTe evaporation process, with a high associated deposition rate (∼700 nm/min), determined the formation of a ∼2.1 μ m-thick CdTe thin film in a relatively short time of ∼3 min, as directly measured by SEM. Consequently, as can be observed in Figure 3b, the penetration depth of the CdTe through the Cu NWs was observed to be extremely low, rendering the method rather unsuitable to properly fill the gaps in the Cu NW array.
In contrast, CdTe deposition via the RF-MS procedure (Figure 3c) led to slightly better results in terms of CdTe protrusion through the Cu NWs, although the multiple voids detected still render it unacceptable. The improved penetration can be explained by the isotropic nature of the sputtering process, which is typically coupled with a lower deposition rate (∼70 nm/min), as the thickness of the CdTe was ∼5.5 μ m obtained in ∼90 min, as observed in Figure 3c. However, it can be assumed that in both CdTe deposition scenarios (i.e., VTE and RF-MS), superior results could be achieved through better control of the Cu NW aspect ratio and/or by further reducing the density of the Cu NWs forming the array. This would incur the cost of diminishing the active surface at the collecting electrode/inorganic absorber layer interface within a “substrate”-type photovoltaic structure based on semiconducting A I I -B V I heterojunctions.
Notably, the ECD process (Figure 3d) revealed promising results, a consistent CdTe thin film being electrochemically synthesized through the Cu NWs array, as the top-view SEM image depicted in the inset of Figure 3d demonstrates. The result can be attributed to the “bottom-up” nature of the ECD process, wherein CdTe film growth occurs through electrochemical reduction mechanisms close to the working electrode surface, as previously explained. In addition, the measured thickness of the electrochemically-synthesized CdTe film was ∼250 nm, obtained in ∼33 min, points to a low growth rate of CdTe (∼7 nm/min) achieved under optimized conditions with the Te-diluted electrolyte (ECD potential and process temperature). The latter conditions favor the growth of a compact CdTe able to penetrate the Cu NW array effectively, thus facilitating the achievement of an excellent interface between the Cu NW-based collecting electrode and the subsequent CdTe absorber layer in a “substrate”-type solar cell configuration.
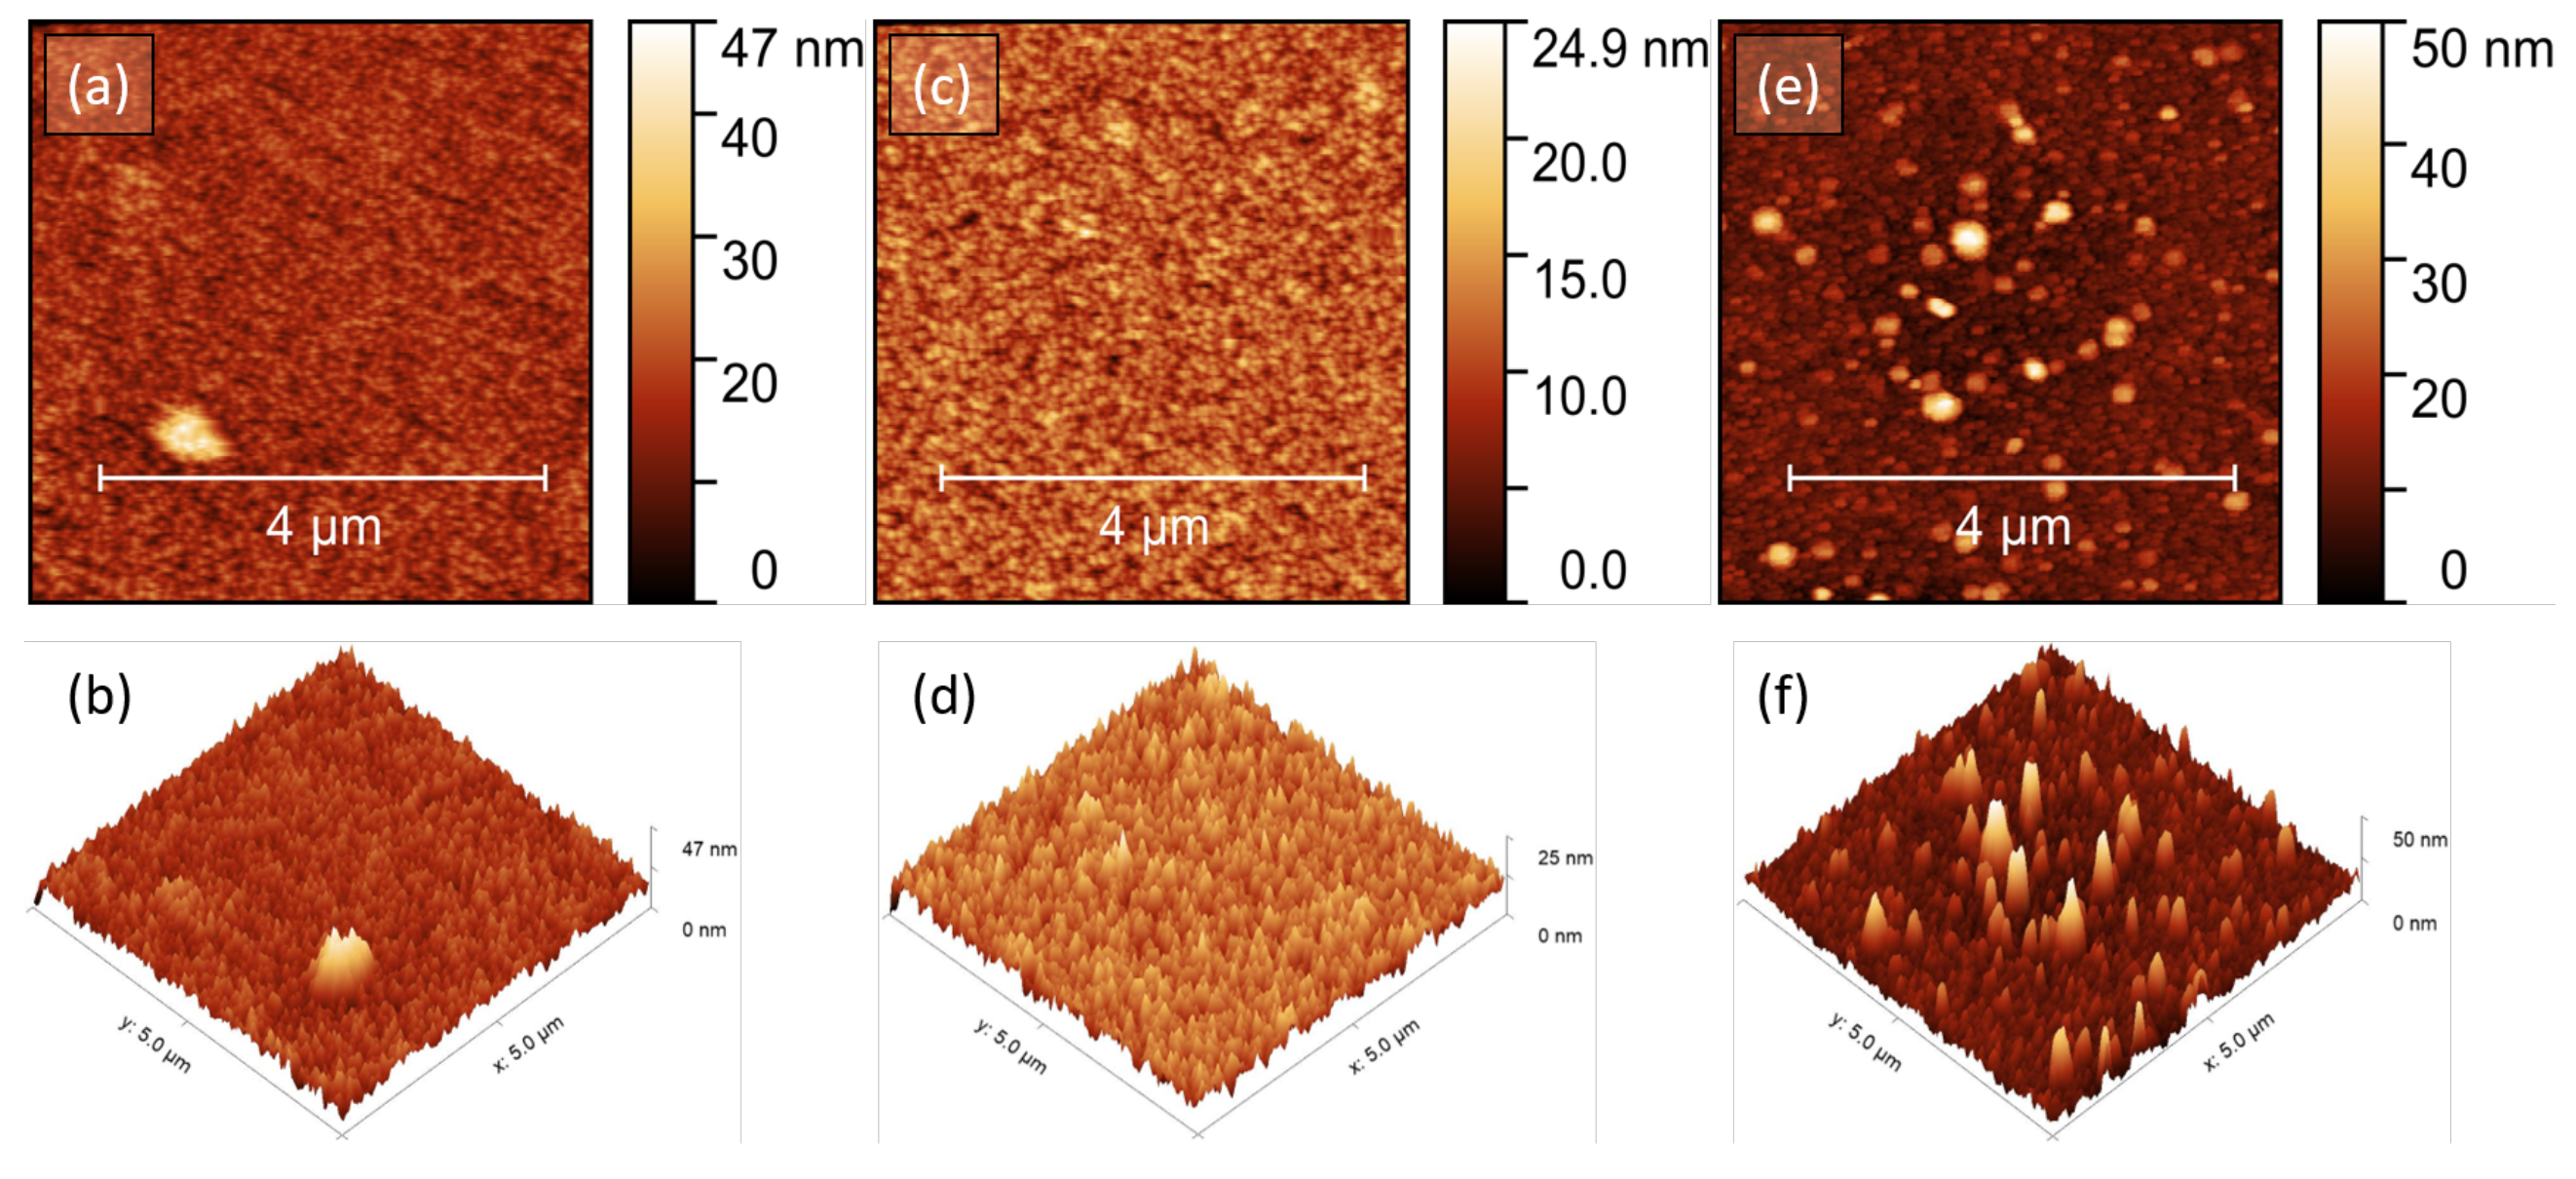
As previously mentioned, the protrusion capability of the CdTe through the NWs is affected by both the NWs’ density and their average aspect ratio, as well as being notably affected by the intrinsic morphological and structural properties of the subsequently-deposited CdTe thin films, which inherently lead to different topography features. In this context, complementary information in addition to SEM images (i.e., surface roughness and overall topography) was obtained through AFM analysis performed on control samples (fabricated in the same conditions), allowing investigation of individual CdTe thin films prepared by all three methods (i.e., VTE, RF-MS, and ECD), which was expected to feature the same intrinsic properties as the CdTe deposits onto the Cu NW “forest”. Figure 4 presents AFM images acquired in tapping mode (top view: Figure 4a,c,e; corresponding 3D representation: Figure 4b,d,f) of the CdTe thin films deposited in the same conditions as previously described by VTE (Figure 4a,b) and RF-MS (Figure 4c,d) onto glass substrates and by ECD (Figure 4e,f) onto an Au-coated Si substrate. The scanned area was established as 5 × 5 μ m 2 for all samples. The images were further post-processed using the Gwyddion 2.52 software package [38], with the corresponding statistical parameters (i.e., RMS, Ssk, and K coefficients) are collected in Table 1. As can be seen, all samples present good uniformity of the CdTe thin films and a granular surface aspect that changes with the employed deposition method. Notably, the Z-range is dramatically reduced for the sputtered CdTe film (Figure 4c,d), suggesting a more flattened and smoothened CdTe film surface relative to the other two deposition methods (i.e., VTE and ECD). This behavior can most probably be attributed to the isotropic nature of the sputtering process, as well as to increased surface mobility of the species arriving to the substrate, allowing very conformal and compact thin films to be obtained. This observation is further confirmed by the calculated RMS values (see Table 1), which show a value of 2.40 nm for the sputtered CdTe film, almost two times lower compared to the RMS values of the evaporated (3.54 nm) and electrodeposited (4.93 nm) CdTe thin films, respectively.
Furthermore, the surface evenness of the prepared CdTe thin films can be analyzed in terms of the statistical coefficients (Skewness, Ssk and Excess Kurtosis, K) shown in Table 1. In particular, the excellent smoothness of the sputtered CdTe film is confirmed by an almost null value of the Ssk coefficient (−0.08), where the slightly negative Skewness may indicate the subtle presence of height values below the average, represented by pit defects in the film. Notably, the corresponding K coefficient (0.10) is almost zero, demonstrating a normal distribution of the heights on the surface of the sputtered CdTe thin film. In contrast, the evaporated and electrodeposited CdTe films exhibit larger positive Ssk coefficients (1.18 and 2.66, respectively), demonstrating a flat surface with the presence of a few extreme heights considerably above the average, as suggested by the larger K coefficient values (6.47 and 11.13, respectively). This effect is more pronounced for the CdTe thin film prepared by ECD, as can be directly seen in Figure 4e,f. The obtained results are in agreement with other reports, countering unevenness issues in evaporated films potentially caused by typically high and less-controllable deposition rates associated with VTE processes [37] or growth abnormalities in the electrodeposited films (which are mostly associated with the ECD procedure complexity in terms of applied potential, chemical species unbalance in the electrolytic solution, process cleanness, or bath temperature stability during film growth [39]).

3.2. Structural Characterization

Figure 5 shows the results from the XRD analysis of all three types of samples of CdTe thin films evaporated or sputtered onto optical glass or electrodeposited onto Au-coated Si substrate, respectively. The crystallographic texture observed from the structural investigation is provided by the strong preferential orientation of the (111) diffraction plane, regardless of the choice of deposition method. For CdTe layers prepared by VTE (Figure 5a) and RF-MS (Figure 5b), only the CdTe phase was detected. In contrast, the electrodeposited CdTe film (Figure 5c) presents an additional structural phase of Cd. As previously mentioned, in addition to the direct influence of the deposition parameters on CdTe thin films properties, it is important to carefully optimize the synthesis process by taking into consideration different Cd:Te atomic ratios in the electrolytic solution with respect to the other variables in the electrochemical process. Notably, the CdTe “zinc blend”-type structure retains its preferential orientation and no separated phase of Te was highlighted in the XRD measurement, in contrast to the crystallization of metallic Cd. Finally, the strong signal of the Au (111) diffraction plane from Figure 5c is related to the Au-coated Si substrate employed in the preparation of CdTe by ECD.
The XRD data recorded in symmetric theta–theta geometry around the CdTe (111) crystalline plane are presented in Figure 6 together with the theoretical curves obtained by fitting the experimental data with a Voigt profile [13,40,41]. The residual of the fit procedure is shown at the bottom of each graph. The Voigt profile provides information on the integral breadths of the Gauss and Lorentz components, which can be used further to calculate the mean-square micro-strain and crystallite size, respectively (see Table 2). By comparison, the values of the mean square strain, i.e., ε 2 1 / 2 , of CdTe layers deposited by VTE and RF-MS are almost identical, while the CdTe thin film prepared via the VTE method exhibits a larger crystallite size ( D e f ). For the ECD-prepared CdTe thin film, the smaller value of crystallite size and higher micro-strain value is caused by the more energetic processes at the working electrode interface during the ECD process, which lead to fast growth of lower crystallinity films. Thus, the low surface mobility which is present in the electrochemical preparation of the CdTe leads to a slight deviation from the structural and morphological characteristics of the CdTe layers synthesized by VTE or RF-MS. Moreover, the differences in stoichiometry of the compound are partly responsible for the higher mechanical stress observed in the structure of the CdTe film obtain by ECD. However, another feature that may stand for the unsuccessfully attempts in covering and penetrating the Cu NW matrix by evaporating or sputtering CdTe is the D e f values of the thin films. Because the VTE and RF-MS deposition methods promote the growth of larger crystallites (81 nm and 64 nm, respectively), it is highly probable that Cd and Te atoms condense first on the tips of the Cu NWs featuring an average diameter of about 90 nm and an average center-to-center distance around 150 nm. Thus, in a very short time a thin CdTe film forms on top of the dense vertical array of Cu NWs, while the space between Cu NWs remains empty. Overall, the experimental values for the lattice constant (a) of CdTe prepared by VTE, RF-MS, and ECD have small variation from that of the bulk CdTe crystal [42] due to the mechanical stress, as shown by the micro-structural parameters presented in Table 2.

3.3. Optical Characterization

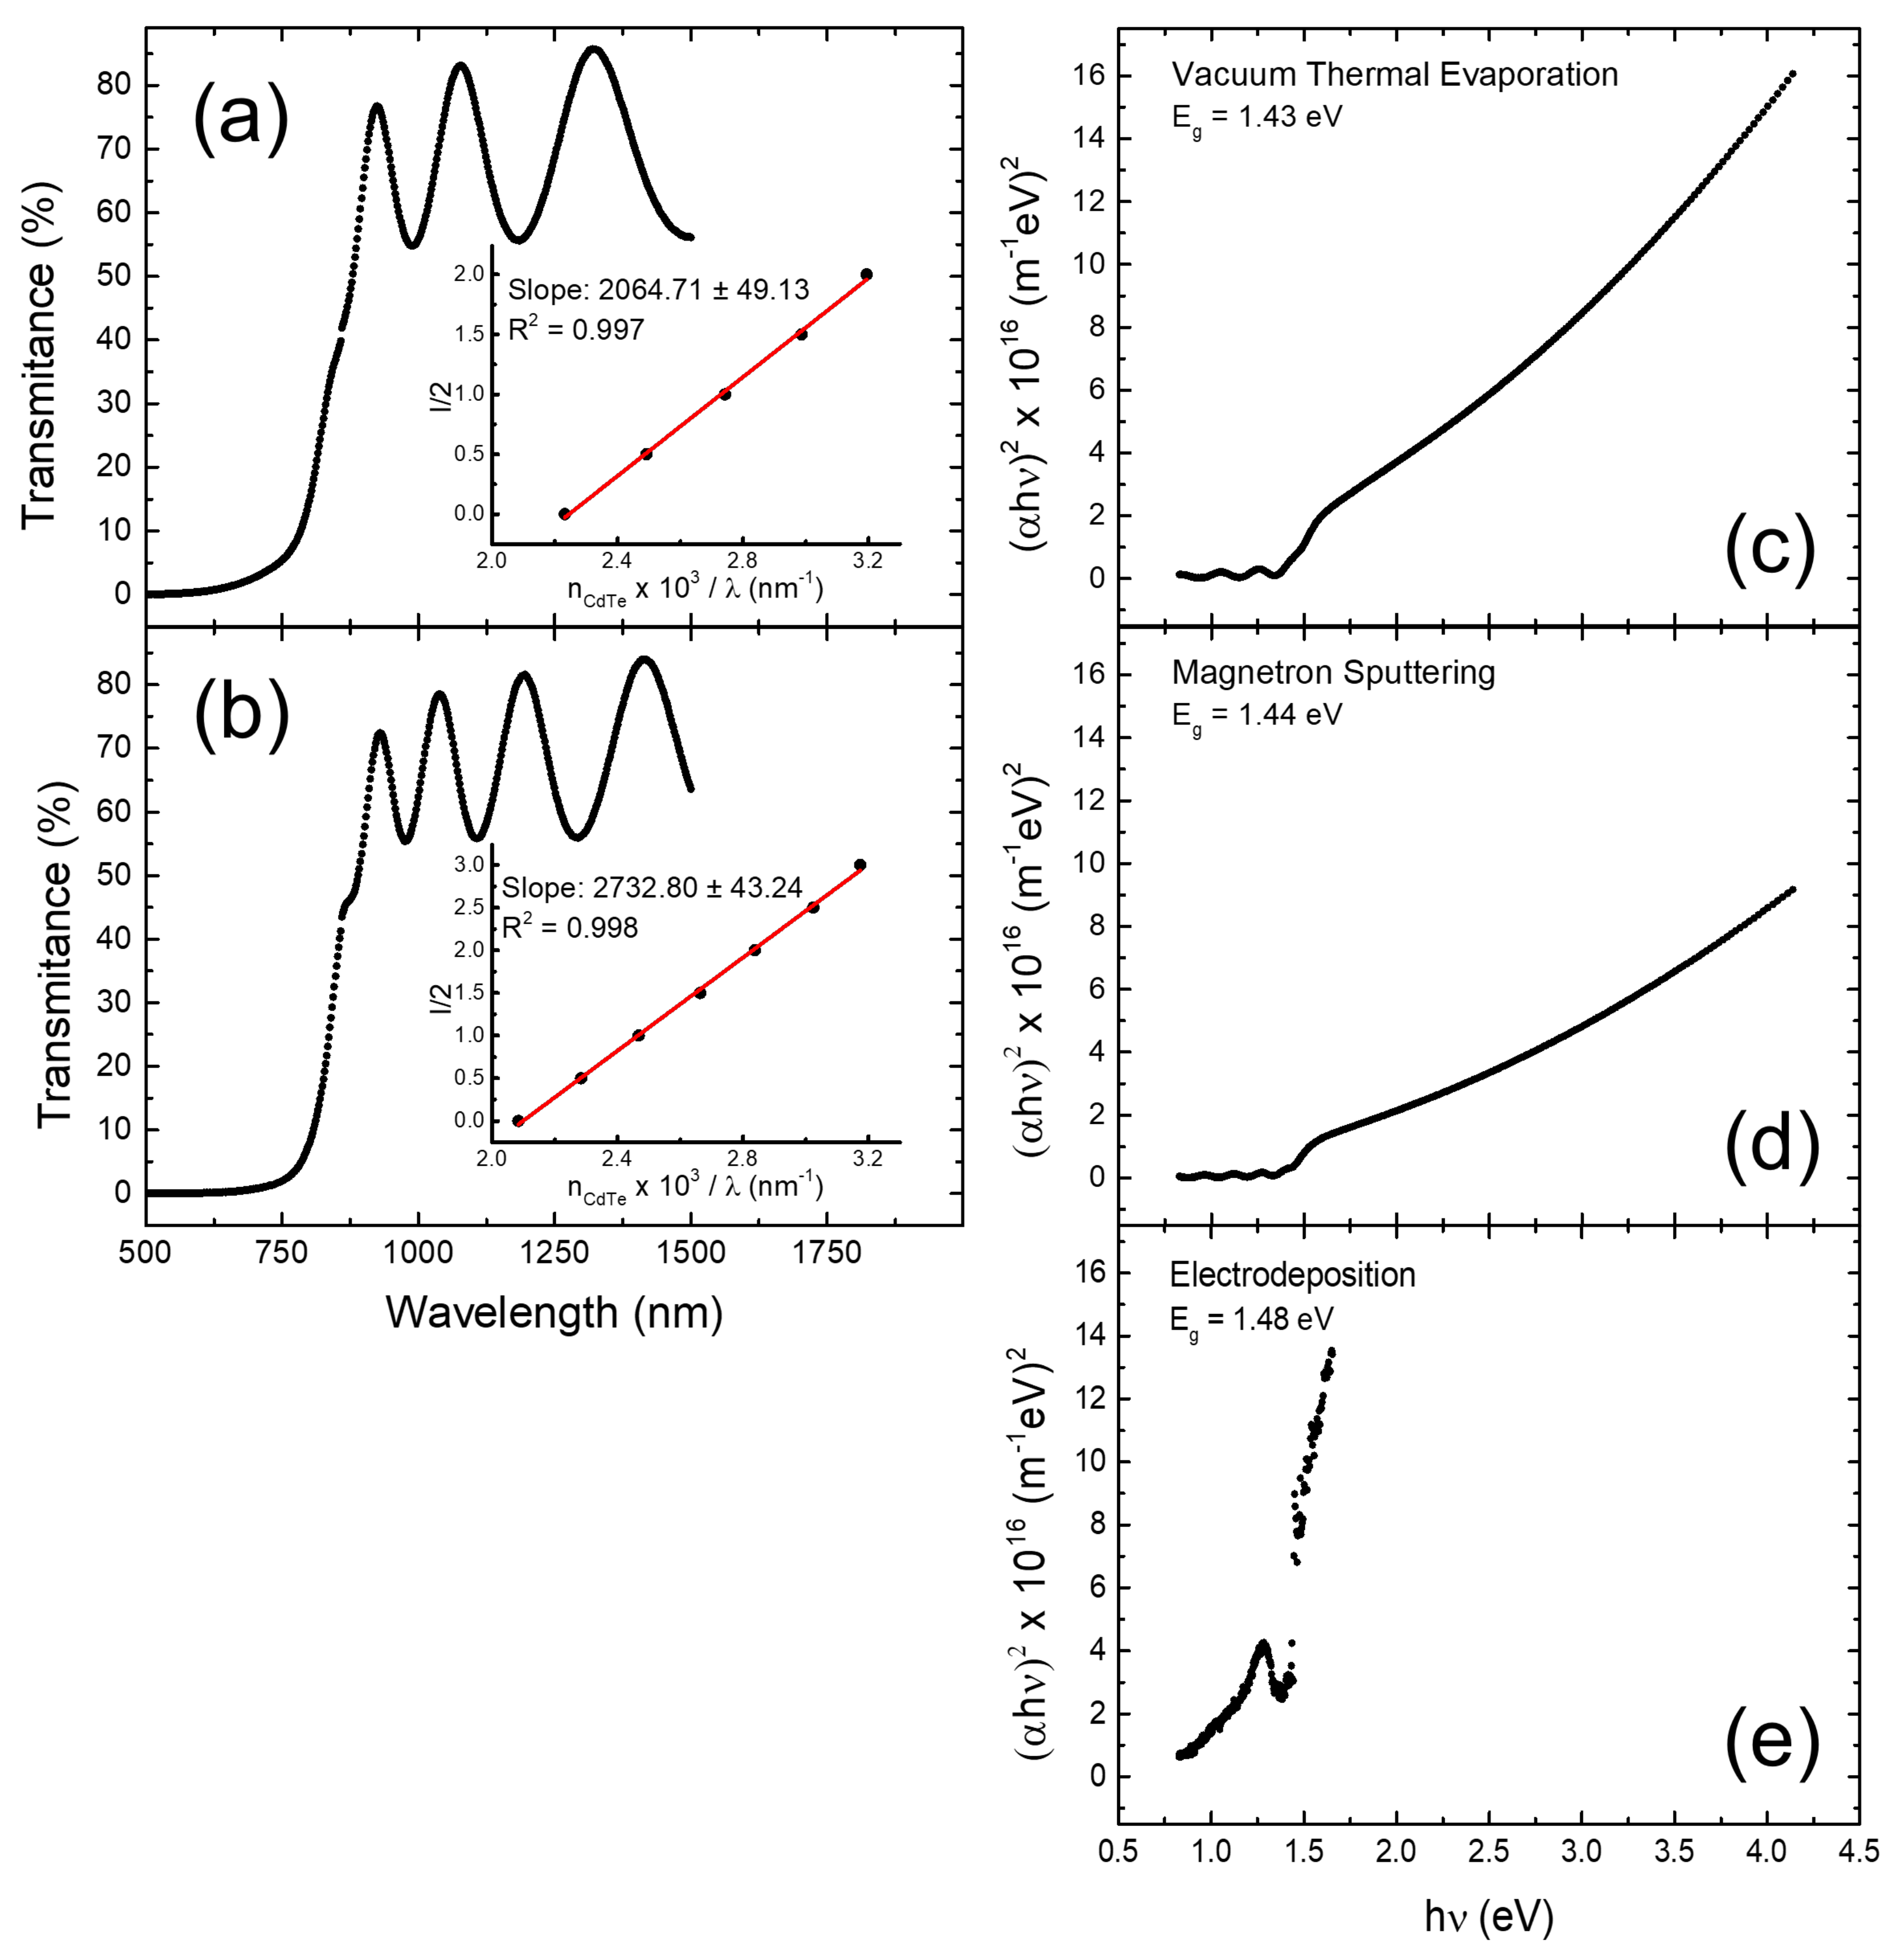
Transmission spectra of the CdTe films as deposited by VTE and RF-MS onto glass substrates were first plotted to compute their corresponding thicknesses by constructing the two envelopes, superior and inferior, around the maxima and minima of the interference fringes within the transparency region (see Figure 7a,b, respectively). By exploiting the relation between the maxima and minima positions as well as the refractive index, the linear dependence of l 2 as a function of n λ could then be represented (see the insets of Figure 7a,b, respectively), and the slope of the linear regression is twice the film thickness, according to Equation (5):
l 2 = 2 h n λ m 0
where l = 0,1,2,,n is the refractive index, h is the CdTe film thickness, λ is the wavelength associated with a minimum or a maximum, and m 0 is the unknown order of the first interference fringe [43]. The evaluated thickness values of the deposited CdTe films were (1032 ± 24.5) nm for the VTE sample and (1366 ± 21.6) nm for the RF-MS sample (see Table 1 and Table 3), where the errors were estimated from the standard errors (SEs) of the linear regression fits (see the insets of Figure 7a,b, respectively). These values were similar to those evaluated by cross-sectional SEM analysis, proving the computation accuracy of the optical spectroscopy method. The thickness of the ECD-prepared CdTe film was only estimated by direct SEM inspections (with the SE calculated over multiple SEM measurements), due to the extremely low transparency of the Au-coated Si substrate used here, in the spectral range of 500–1500 nm.
The thickness values collected in Table 1 and Table 3 were subsequently used to compute the optical band gap energies (E g ) of the fabricated CdTe thin films by employing the absorption spectra (see Figure 7c–e) and Tauc’s plot method. CdTe is a direct band gap semiconductor, and as such the E g value corresponding to Γ point in the first Brillouin zone can be easily computed from the dependence of the absorption coefficient on the energies of the incident photons near the fundamental absorption edge:
α = C · ω E g 1 / 2 ω
where α is the absorption coefficient, ω is the energy of the incident photons, and C is a constant. For all samples, α could thus be directly evaluated by its dependence on the optical absorbance (A) and the film thickness (h):
α = A h
The calculated E g values of the CdTe films prepared by VTE, RF-MS and ECD are provided in Table 3, and were computed with a precision of ±0.01–0.03 eV, as similarly estimated from the errors associated with the fits of the linear domains within absorption spectra, which is a typical accuracy demonstrated for Tauc’s method [44]. Notably, a good agreement with the theoretical optical band gap value of CdTe films, reported to be in the range of 1.40–1.44 eV [45], can be clearly noticed. Small variations of the band gap value with respect to the ideal bulk value of the CdTe (1.51 eV) can be explained by the contamination levels associated with each deposition method, which contribute to the formation of defects through doping within the crystalline structure and have a major impact on the electrical properties of the films, especially in terms of reducing the overall resistivity of the films and consequently their band gap energy. Nevertheless, the increasing tendency of the band gap can be observed, with the smallest value obtained for the evaporated CdTe film (1.43 eV) and the largest for the ECD-prepared CdTe film (1.48 eV). This result can be corroborated with the decreasing tendency of the crystallite size, from 81 nm for the VTE-deposited CdTe film to 21 nm for the electrodeposited CdTe film, respectively (see Table 3). This behavior can be explained in terms of quantum confinement effects, as a reduction in the crystallite size of the material can cause discretization of the energy levels, changing the density of states within the energetic band structure. As a consequence, the energy difference between the energy bands is increased, as is the band gap energy value. The largest band gap value of 1.48 eV, approaching the ideal value of the bulk CdTe material (1.51 eV), was obtained for the ECD-prepared CdTe thin film, additionally confirming that the latter “bottom-up” approach may represent a suitable low-cost and low-temperature synthesis method to produce good quality CdTe layers capable of penetrating the Cu NWs array under optimized processing conditions, thus allowing the fabrication of robust CdTe/Cu NWs interfaces for “substrate”-type photovoltaic structures based on semiconducting A I I -B V I heterojunctions.

4. Conclusions

The paper reports the preparation and characterization of nanostructured electrodes based on vertically-aligned Cu NWs subsequently covered by CdTe thin films for potential use in “substrate”-type solar cells relying on A I I -B V I chalcogenide compounds. The Cu NWs matrix was obtained through template-assisted electrodeposition within the nanopores of a supported AAO template, while the CdTe thin films were obtained through VTE, RF-MS, and ECD techniques. SEM morphological examination of the Cu NW array revealed its densely-packed nature (∼32.5%) and the geometrical features of the NWs, i.e., the center-to-center distance of ∼150 nm and an aspect-ratio around 4 (tailored for retaining the NWs’ vertical orientation on the substrate after the AAO host removal step). The morphological, structural, and optical properties of CdTe thin films obtained through VTE, RF-MS, and ECD were studied and analyzed to determine the optimal experimental conditions that could allow a good degree of CdTe penetrability through the Cu NWs array. A comparative critical discussion of the obtained data points out that the evaporated CdTe thin film exhibits excellent crystallinity, with a pronounced (111) crystalline orientation, although with larger CdTe crystallites (∼81 nm) that generally prevent CdTe protrusion through the Cu NWs. Similar results were observed for the sputtered CdTe thin film, although slightly improved due to a smaller crystallite size of ∼64 nm. However, the crystallite size of ∼21 nm for the electrodeposited CdTe film rendered the ECD approach most suitable for properly filling the gaps through the Cu NWs array. An overall observed reduction in the evaluated CdTe deposition rate among the three methods investigated (i.e., ∼700 nm/min for VTE, ∼70 nm/min for RF-MS and ∼7 nm/min for ECD), as well as the reduction of the crystallite size, seem to favor the better protrusion of the CdTe through the Cu NWs. Ultimately, the computed optical band gap energies of the CdTe thin films prepared by the three investigated methods are in the range of 1.43–1.48 eV, approaching thus the reported values for bulk CdTe films (1.51 eV). The results obtained from all investigations show that the ECD method may be a suitable technique for use in producing robust absorber layer/collecting back-electrode nanostructured interfaces relying on CdTe-embedded Cu NWs. Although further optimization of the ECD process parameters may be required to achieve a CdTe thin film with competitive compositional and structural properties, the electrochemical method could represent a cost-effective solution when engaged in the fabrication of solar cells based on A I I -B V I heterojunctions; vertically-aligned NWs could be designed to improve the charge collection towards the electrodes, contributing to a better efficiency of the cells. To the best of our knowledge, no such detailed comparative study has yet been reported.

Author Contributions

Conceptualization, V.-A.A.; methodology, Ş.A. and V.-A.A.; validation, Ş.A., M.P.S. and V.-A.A.; formal analysis, A.-M.P., I.A., C.L., S.I., Ş.A., L.P., M.P.S. and V.-A.A.; investigation, A.-M.P., I.A., C.L. and S.I.; resources, Ş.A., L.P. and V.-A.A.; writing–original draft preparation, A.-M.P.; writing–review and editing, A.-M.P., C.L., S.I., Ş.A., M.P.S. and V.-A.A.; supervision, Ş.A. and V.-A.A.; project administration, Ş.A. and V.-A.A.; funding acquisition, I.A., S.I., Ş.A., L.P., M.P.S. and V.-A.A. All authors have read and agreed to the published version of the manuscript.

Funding

This research was funded by the “Executive Unit for Financing Higher Education, Research, Development and Innovation”—UEFISCDI (Romania) through the grants: 195/2020 (PN-III-P1-1.1-PD-2019-0466), 25/2020 (PN-III-P1-1.1-TE-2019-0846) and 115/2020 (PN-III-P1-1.1-TE-2019-0868), as well as by the “Fonds de la Recherche Scientifique” —FNRS (Belgium).

Institutional Review Board Statement

Not applicable.

Informed Consent Statement

Not applicable.

Data Availability Statement

The data used and/or analyzed during the current study are available from the corresponding authors on reasonable request.

Acknowledgments

V.-A.A. acknowledges financial and infrastructure support from Bio- and Soft Matter Research Division (BSMA/IMCN/UCLouvain, Belgium) for the preparation of the Al/Ti/Au/Ti/Si substrates by in-situ DC magnetron sputtering. M.P.S. contribution was partially financed by the Romanian Ministry of Research, Innovation and Digitization through: “MICRO-NANO-SIS PLUS” core Programme and MicroNEx Project, Contract nr.: 20 PFE/30.12.2021.

Conflicts of Interest

The authors declare no conflict of interest. The funders had no role in the design of the study; in the collection, analyses, or interpretation of data; in the writing of the manuscript; or in the decision to publish the results.

Abbreviations

The following abbreviations are used in this manuscript:
MDPIMultidisciplinary Digital Publishing Institute
Appl. Sci.Applied Sciences
R&DResearch & Development
MDEOR&D Center for Materials and Electronic & Optoelectronic Devices
INFLPRNational Institute for Lasers, Plasma and Radiation Physics
NIMPNational Institute of Materials Physics
AOSRAcademy of Romanian Scientists
UCLouvainUniversité catholique de Louvain
IMCNInstitute of Condensed Matter and Nanosciences
IMTNational Institute for R&D in Microtechnologies
NWsNanowires
PCPolycarbonate
AAOAnodic aluminum oxide
VTEVacuum thermal evaporation
RF-MSRadio frequency-magnetron sputtering
ECDElectrochemical deposition
PCEPower conversion efficiency
1DOne-dimensional
DIWDeionized water
DCDirect current
SEStandard error
NHENormal hydrogen electrode
SEMScanning Electron Microscope
AFMAtomic Force Microscope
RMSRoute means square roughness
SskSkewness
KExcess Kurtosis
XRDX-ray diffraction
UV-VISUltraviolet - Visible
UEFISCDIExecutive Unit for Financing Higher Education, Research, Development and Innovation
FNRSFonds de la Recherche Scientifique
BSMABio- and Soft Matter

References

  1. Toma, O.; Antohe, V.A.; Panaitescu, A.M.; Iftimie, S.; Răduţă, A.M.; Radu, A.; Ion, L.; Antohe, Ş. Effect of RF Power on the Physical Properties of Sputtered ZnSe Nanostructured Thin Films for Photovoltaic Applications. Nanomaterials 2021, 11, 2841. [Google Scholar] [CrossRef] [PubMed]
  2. Manica, D.; Antohe, V.A.; Moldovan, A.; Pascu, R.; Iftimie, S.; Ion, L.; Suchea, M.P.; Antohe, Ş. Thickness Effect on Some Physical Properties of RF Sputtered ZnTe Thin Films for Potential Photovoltaic Applications. Nanomaterials 2021, 11, 2286. [Google Scholar] [CrossRef] [PubMed]
  3. Ion, L.; Iftimie, S.; Radu, A.; Antohe, V.A.; Toma, O.; Antohe, Ş. Physical Properties of RF-Sputtered ZnSe Thin Films for Photovoltaic Applications: Influence of Film Thickness. Proc. Rom. Acad. Ser. A 2021, 22, 25–34. [Google Scholar]
  4. Wald, F.V. Applications of CdTe. A review. Rev. Phys. Appl. 1977, 12, 277–290. [Google Scholar] [CrossRef]
  5. Bottger, G.L.; Geddes, A.L. Infrared Absorption Spectrum of CdTe. J. Chem. Phys. 1967, 47, 4858–4859. [Google Scholar] [CrossRef]
  6. Kiefer, J.E.; Yariv, A. Electro-Optic Characteristics of CdTe at 3.39 and 10.6 μ. Appl. Phys. Lett. 1969, 15, 26–27. [Google Scholar] [CrossRef]
  7. Morikawa, K.; Yamaka, E. Electroluminescence in CdTe Diodes. Jpn. J. Appl. Phys. 1966, 5, 736–737. [Google Scholar] [CrossRef]
  8. Squillante, M.R.; Entine, G. New applications of CdTe nuclear detectors. Nucl. Instrum. Methods Phys. Res. Sect. Accel. Spectrom. Detect. Assoc. Equip. 1992, 322, 569–574. [Google Scholar] [CrossRef]
  9. Bülent, M.B.; Brian, M. Brief review of cadmium telluride-based photovoltaic technologies. J. Photonics Energy 2014, 4, 040996. [Google Scholar] [CrossRef]
  10. Ion, L.; Antohe, V.-A.; Ghenescu, M.; Ghenescu, O.; Bazavan, R.; Danila, M.; Gugiu, M.M.; Antohe, S. The Effect of Ionizing Radiations on the Structural, Electrical and Optical Properties of AII-BVI Polycrystalline Thin Films Used as Solar Cell Materials. MRS Online Proc. Libr. 2007, 1012, Y12-01. [Google Scholar] [CrossRef]
  11. Toma, O.; Ion, L.; Girtan, M.; Antohe, S. Optical, morphological and electrical studies of thermally vacuum evaporated CdTe thin films for photovoltaic applications. Sol. Energy 2014, 108, 51–60. [Google Scholar] [CrossRef] [Green Version]
  12. Kim, K.H.; Kasouit, S.; Johnson, E.V.; i Cabarrocas, P.R. Substrate versus superstrate configuration for stable thin film silicon solar cells. Sol. Energy Mater. Sol. Cells 2013, 119, 124–128. [Google Scholar] [CrossRef]
  13. Toma, O.; Ion, L.; Iftimie, S.; Antohe, V.A.; Radu, A.; Raduta, A.M.; Manica, D.; Antohe, S. Physical properties of rf-sputtered ZnS and ZnSe thin films used for double-heterojunction ZnS/ZnSe/CdTe photovoltaic structures. Appl. Surf. Sci. 2019, 478, 831–839. [Google Scholar] [CrossRef]
  14. Li, S.; Peng, Z.; Zheng, J.; Pan, F. Optimizing CdTe-metal interfaces for high performance solar cells. J. Mater. Chem. A 2017, 5, 7118–7124. [Google Scholar] [CrossRef]
  15. Patterson, M.H.; Williams, R.H. Metal-CdTe interfaces. J. Cryst. Growth 1982, 59, 281–288. [Google Scholar] [CrossRef]
  16. Odkhuu, D.; Miao, M.S.; Aqariden, F.; Grein, C.; Kioussis, N. Atomic and electronic structure of CdTe/metal (Cu, Al, Pt) interfaces and their influence to the Schottky barrier. J. Appl. Phys. 2016, 120, 5703. [Google Scholar] [CrossRef] [Green Version]
  17. Boiko, B.T.; Khripunov, G.S.; Yurchenko, V.B.; Ruda, H.E. Photovoltaic properties in CdS/CdTe thin-film heterosystems with graded-gap interfaces. Sol. Energy Mater. Sol. Cells 1997, 45, 303–308. [Google Scholar] [CrossRef]
  18. Araujo, F.A.; Piraux, L.; Antohe, V.A.; Cros, V.; Gence, L. Single spin-torque vortex oscillator using combined bottom-up approach and e-beam lithography. Appl. Phys. Lett. 2013, 102, 2402. [Google Scholar] [CrossRef] [Green Version]
  19. Pierret, A.; Hocevar, M.; Diedenhofen, S.L.; Algra, R.E.; Vlieg, E.; Timmering, E.C.; Verschuuren, M.A.; Immink, G.W.G.; Verheijen, M.A.; Bakkers, E.P.A.M. Generic nano-imprint process for fabrication of nanowire arrays. Nanotechnology 2010, 21, 5305. [Google Scholar] [CrossRef]
  20. Cao, H.; Li, X.; Zhou, B.; Chen, T.; Shi, T.; Zheng, J.; Liu, G.; Wang, Y. On-Demand Fabrication of Si/SiO2 Nanowire Arrays by Nanosphere Lithography and Subsequent Thermal Oxidation. Nanoscale Res. Lett. 2017, 12, 105. [Google Scholar] [CrossRef] [Green Version]
  21. Virk, H.S.; Kishore, K.; Balouria, V. Fabrication of Copper Nanowires by Electrodeposition Using Anodic Alumina and Polymer Templates. J. Nano Res. 2010, 10, 63–67. [Google Scholar] [CrossRef]
  22. Piraux, L.; Antohe, V.A.; Ferain, E.; Lahem, D. Self-supported three-dimensionally interconnected polypyrrole nanotubes and nanowires for highly sensitive chemiresistive gas sensing. RSC Adv. 2016, 6, 21808–21813. [Google Scholar] [CrossRef]
  23. Mátéfi-Tempfli, S.; Mátéfi-Tempfli, M.; Vlad, A.; Antohe, V.A.; Piraux, L. Nanowires and nanostructures fabrication using template methods: A step forward to real devices combining electrochemical synthesis with lithographic techniques. J. Mater. Sci. Mater. Electron. 2009, 20, S249–S254. [Google Scholar] [CrossRef]
  24. Antohe, V.A.; Radu, A.; Mátéfi-Tempfli, M.; Attout, A.; Yunus, S.; Bertrand, P.; Duţu, C.A.; Vlad, A.; Melinte, S.; Mátéfi-Tempfli, S.; et al. Nanowire-templated microelectrodes for high-sensitivity pH detection. Appl. Phys. Lett. 2009, 94, 3118. [Google Scholar] [CrossRef]
  25. Antohe, V.A.; Radu, A.; Mátéfi-Tempfli, S.; Piraux, L. Circuit Modeling on Polyaniline Functionalized Nanowire-Templated Micro-Interdigital Capacitors for pH Sensing. IEEE Trans. Nanotechnol. 2011, 10, 1314–1320. [Google Scholar] [CrossRef] [Green Version]
  26. Sahoo, M.K.; Kale, P. Integration of silicon nanowires in solar cell structure for efficiency enhancement: A review. J. Mater. 2019, 5, 34–48. [Google Scholar] [CrossRef]
  27. Locovei, C.; Filipoiu, N.; Kuncser, A.; Stanciu, A.E.; Antohe, Ş; Florica, C.F.; Costas, A.; Enculescu, I.; Piraux, L.; Kuncser, V.; et al. Unidirectional Magnetic Anisotropy in Dense Vertically-Standing Arrays of Passivated Nickel Nanotubes. Nanomaterials 2020, 10, 2444. [Google Scholar] [CrossRef] [PubMed]
  28. Bonilla, S.; Dalchiele, E.A. Electrochemical deposition and characterization of CdTe polycrystalline thin films. Thin Solid Film. 1991, 204, 397–403. [Google Scholar] [CrossRef]
  29. Guo, Y.; Deng, X. Electrodeposition of CdTe thin films and their photoelectrochemical behaviour. Sol. Energy Mater. Sol. Cells 1993, 29, 115–122. [Google Scholar] [CrossRef]
  30. Bhattacharya, R.N.; Rajeshwar, K. Electrodeposition of CdTe Thin Films. J. Electrochem. Soc. 1984, 131, 2032–2037. [Google Scholar] [CrossRef]
  31. Echendu, O.K.; Okeoma, K.B.; Oriaku, C.I.; Dharmadasa, I.M. Electrochemical Deposition of CdTe Semiconductor Thin Films for Solar Cell Application Using Two-Electrode and Three-Electrode Configurations: A Comparative Study. Adv. Mater. Sci. Eng. 2016, 2016, 3581725. [Google Scholar] [CrossRef] [Green Version]
  32. Ueng, H.Y.; Yang, S.Y. Electrodeposition of stoichiometric CdTe thin film for photovoltaic application. J. Renew. Sustain. Energy 2012, 4, 1605. [Google Scholar] [CrossRef]
  33. Dharmadasa, I.M.; Madugu, M.L.; Olusola, O.I.; Echendu, O.K.; Fauzi, F.; Diso, D.G.; Weerasinghe, A.R.; Druffel, T.; Dharmadasa, R.; Lavery, B.; et al. Electroplating of CdTe Thin Films from Cadmium Sulphate Precursor and Comparison of Layers Grown by 3-Electrode and 2-Electrode Systems. Coatings 2017, 7, 17. [Google Scholar] [CrossRef] [Green Version]
  34. Matei, E.; Ion, L.; Antohe, S.; Neumann, R.; Enculescu, I. Multisegment CdTe nanowire homojunction photodiode. Nanotechnology 2010, 21, 5202. [Google Scholar] [CrossRef]
  35. Fest, E. Basic Radiometry for Stray Light Analysis. In Stray Light Analysis and Control; SPIE Press Book: Bellingham, WA, USA, 2013; Chapter 2; Volume PM229, 228p, ISBN 978-0-81-949325-5. [Google Scholar] [CrossRef]
  36. Nielsch, K.; Castaño, F.J.; Matthias, S.; Lee, W.; Ross, C.A. Synthesis of Cobalt/Polymer Multilayer Nanotubes. Adv. Eng. Mater. 2005, 7, 217–221. [Google Scholar] [CrossRef]
  37. Hussain, K.M.A.; Mahmood, Z.H.; Syed, I.M.; Begum, T.; Faruqe, T.; Parvin, J. Thermal vacuum deposition of cadmium telluride thin flims solar cell material. J. Mater. Sci. Appl. 2014, 2, 91–95. [Google Scholar]
  38. Nečas, D.; Klapetek, P. Gwyddion: An open-source software for SPM data analysis. Open Phys. 2012, 10, 181–188. [Google Scholar] [CrossRef]
  39. Saha, S.; Johnson, M.; Altayaran, F.; Wang, Y.; Wang, D.; Zhang, Q. Electrodeposition Fabrication of Chalcogenide Thin Films for Photovoltaic Applications. Electrochem 2020, 1, 286–321. [Google Scholar] [CrossRef]
  40. Vasile, N.; Iftimie, S.; Acsente, T.; Locovei, C.; Călugăr, A.I.; Radu, A.; Ion, L.; Antohe, V.A.; Manica, D.; Toma, O.; et al. Physical properties of indium zinc oxide and aluminium zinc oxide thin films deposited by radio-frequency magnetron sputtering. Mater. Res. Express 2020, 6, 126447. [Google Scholar] [CrossRef]
  41. Balzar, D. Voight Function Model in Diffraction-Line Broadening Analysis. In Defect and Microstructure Analysis by Diffraction; International Union of Crystallography Monographs on Crystallography; Snyder, R.L., Fiala, J., Bunge, H.J., Eds.; Oxford Science Publications: Oxford, UK, 1999; Chapter 7; ISBN 978-0-19-850189-3. [Google Scholar]
  42. Rabadanov, M.K.; Verin, I.A.; Ivanov, Y.M.; Simonov, V.I. Refinement of the atomic structure of CdTe single crystals. Crystallogr. Rep. 2001, 46, 636–641. [Google Scholar] [CrossRef]
  43. Bazavan, R.; Ion, L.; Socol, G.; Enculescu, I.; Bazavan, D.; Tazlaoanu, C.; Lörinczi, A.; Mihailescu, I.; Popescu, M.; Antohe, S. Optical properties of pulsed-laser deposited ZnO thin films. J. Optoelectron. Adv. Mater. 2009, 11, 425–428. [Google Scholar]
  44. Makuła, P.; Pacia, M.; Macyk, W. How To Correctly Determine the Band Gap Energy of Modified Semiconductor Photocatalysts Based on UV-Vis Spectra. J. Phys. Chem. Lett. 2018, 9, 6814–6817. [Google Scholar] [CrossRef] [PubMed] [Green Version]
  45. Mathew, X.; Thompson, G.W.; Singh, V.P.; McClure, J.C.; Velumani, S.; Mathews, N.R.; Sebastian, P.J. Development of CdTe thin films on flexible substrates—A review. Sol. Energy Mater. Sol. Cells 2003, 76, 293–303. [Google Scholar] [CrossRef]
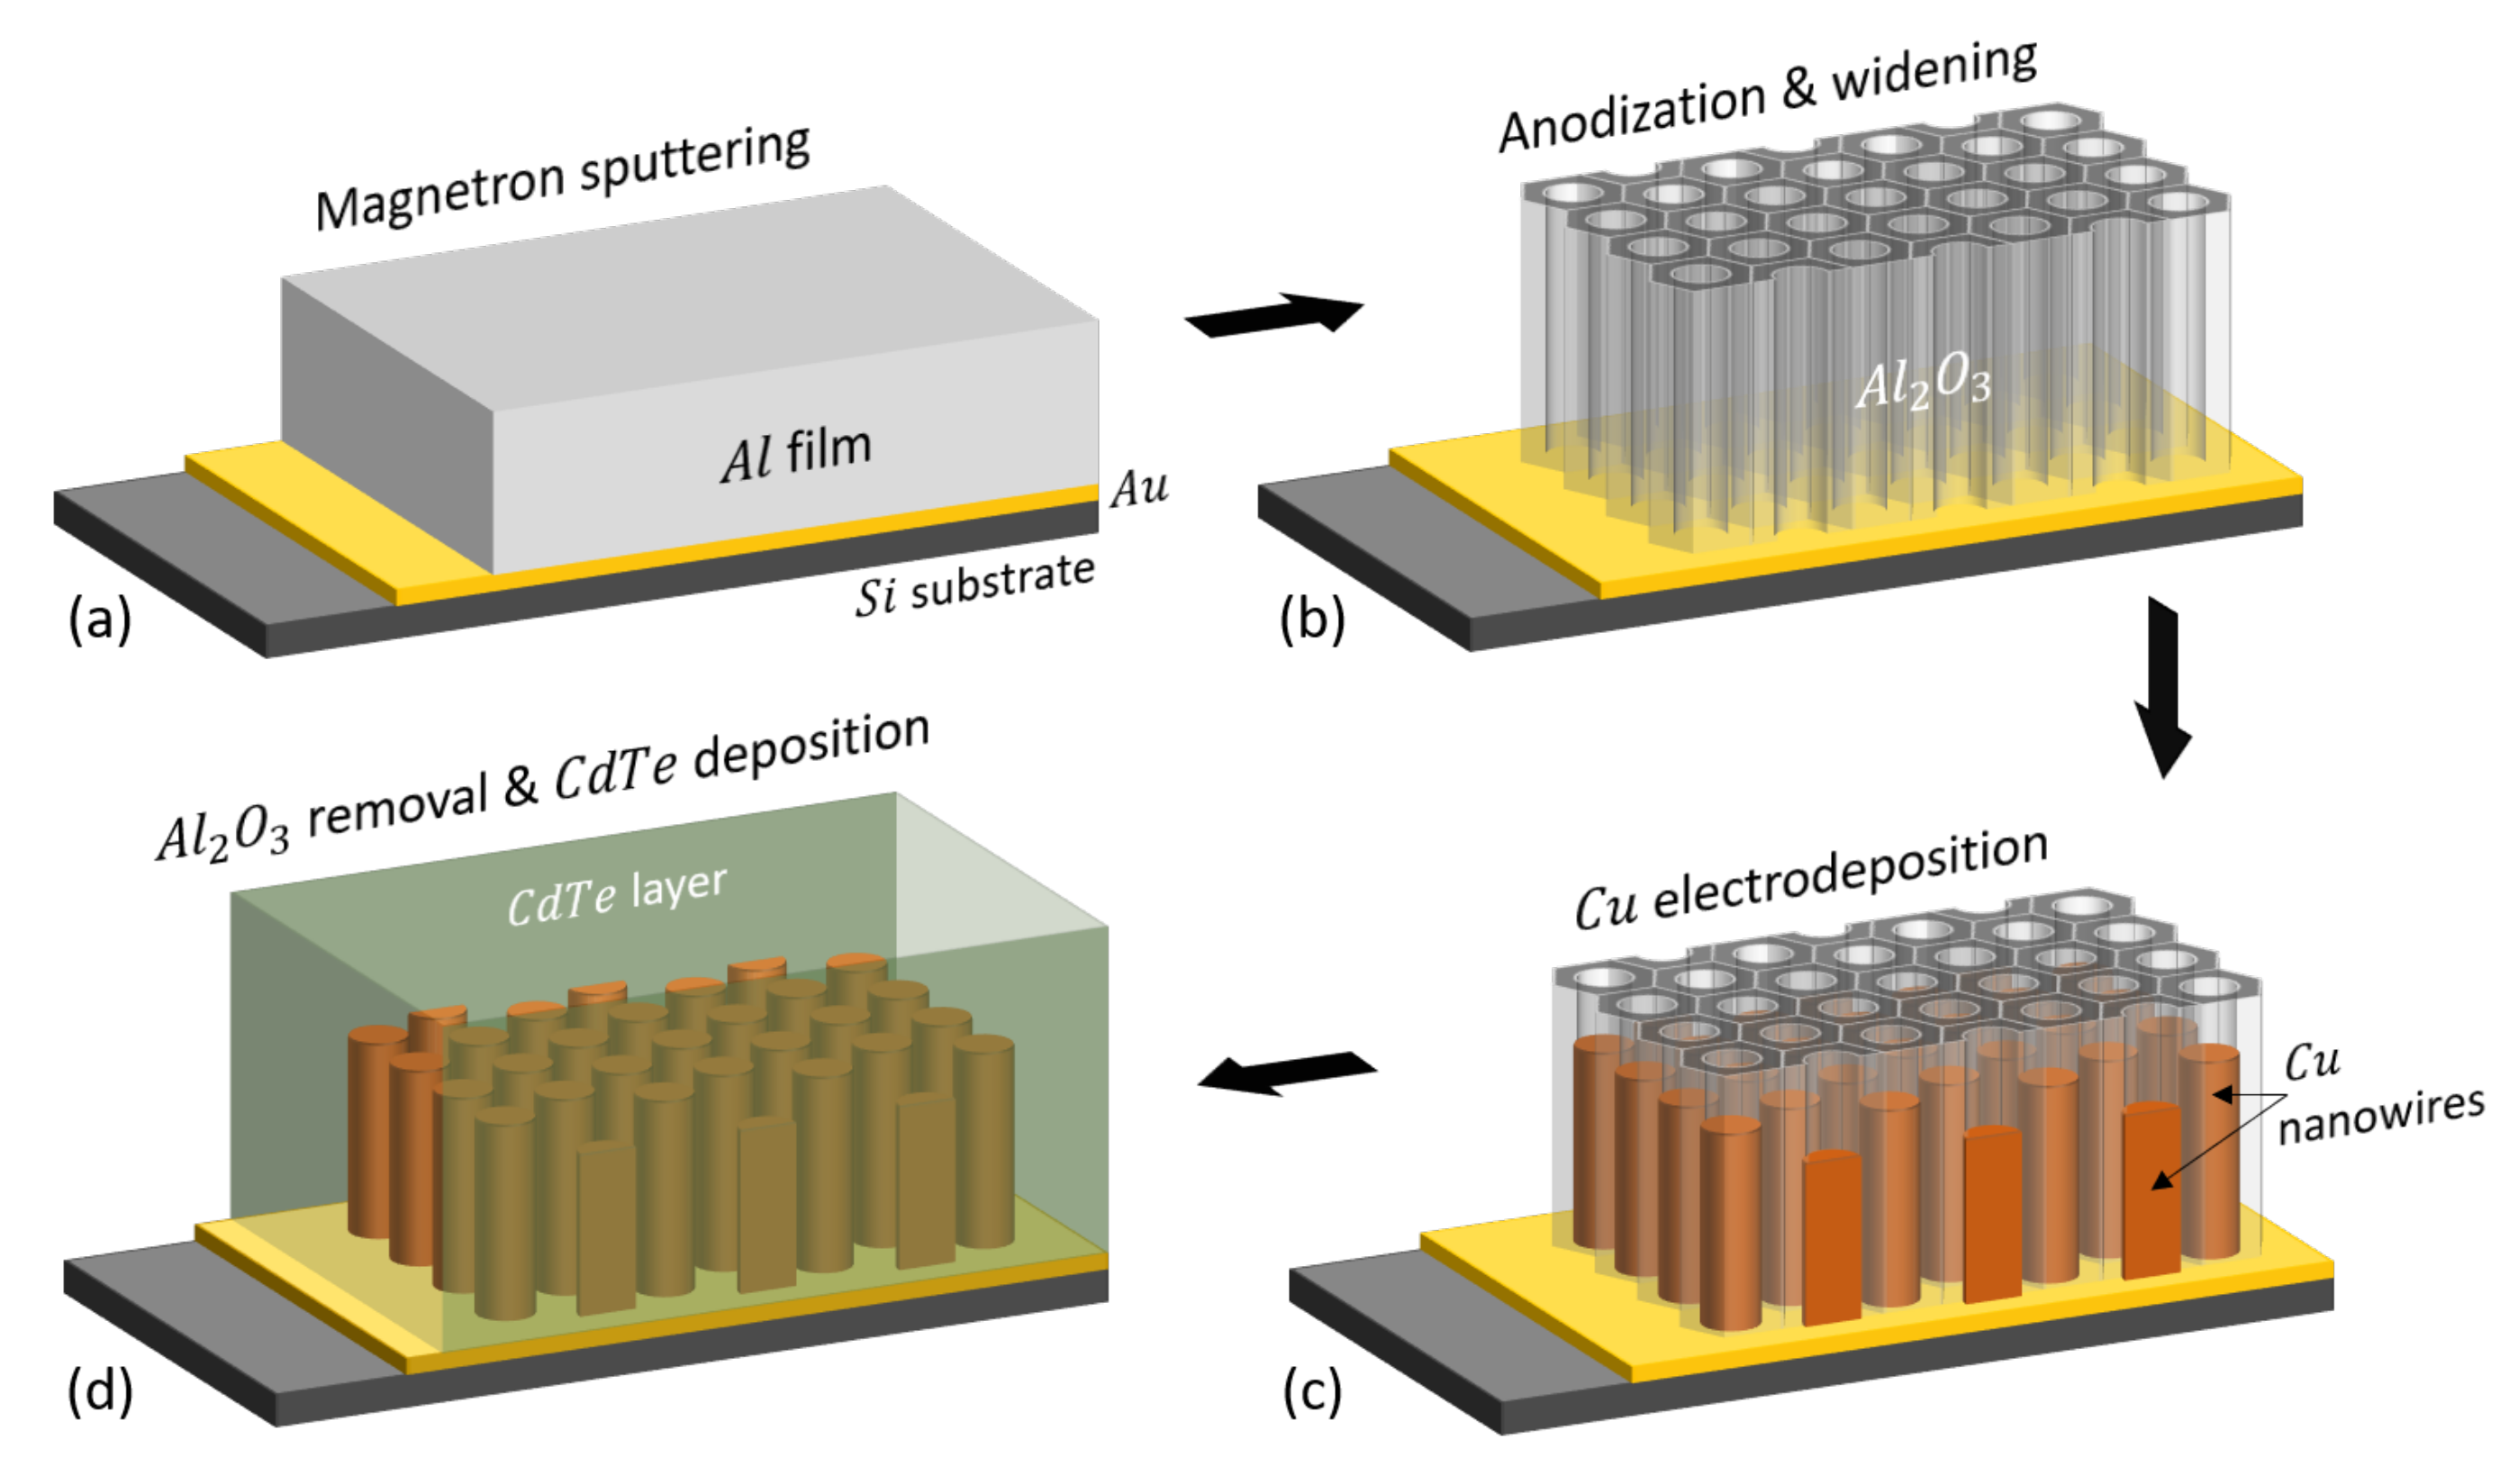
Figure 1. Schematic representation of the fabrication process for obtaining CdTe-embedded interfaces based on Cu NWs: (a) substrate preparation by in-situ DC magnetron sputtering of Ti (5 nm)/Au (50 nm)/Ti (5 nm)/Al (1 μ m) layers on a <100> p-doped Si substrate (Ti ultra-thin films are not represented for convenience); (b) supported nanoporous Al 2 O 3 template fabrication through anodization of the entire Al film and subsequent chemical widening of the nanopores; (c) electrochemical synthesis of Cu within the aluminum oxide (Al 2 O 3 ) nanopores; (d) complete removal of the Al 2 O 3 template and CdTe deposition on top of the Cu NW array.
Applsci 12 07808 g001
Figure 2. (a) Current curve acquired for the anodization of ∼1 μ m Al layer sputtered on the Au-coated Si substrate, leading to the formation of a supported AAO nanoporous template with a thickness of ∼1.4 μ m; (b) typical cathodic reduction current obtained during the electrochemical deposition of Cu NWs within the nanopores of the AAO template via application of −0.2 V versus an Ag/AgCl reference electrode; (c) chronoamperometric electrodeposition curve corresponding to CdTe synthesis on top of the Cu NW array (after the complete removal of the AAO nanoporous host) while applying −0.5 V versus an Ag/AgCl reference electrode.
Applsci 12 07808 g002
Figure 3. (a) Top-view scanning electron microscope (SEM) image of a dense array of Cu NWs supported on the Au-coated Si substrate. The inset shows corresponding tilted view representation of the vertically-aligned Cu NW array. SEM observations were performed after the complete removal of the supported AAO template. (bd) Cross-section SEM micrographs of the CdTe thin film as-deposited on top of the Cu NW array by VTE (b), by RF-MS (c), and by ECD (d). The inset in (d) represents the corresponding top surface view of the CdTe-embedded Cu NW array. The scale bar of the insets is 250 nm.
Applsci 12 07808 g003
Figure 4. Atomic Force Microscope (AFM) top-view (a,c,e) and corresponding three-dimensional (3D) surface profile (b,d,e) of the CdTe films surfaces deposited by VTE (a,b) and RF-MS (c,d) on a pristine optical glass substrate and by ECD (e,f) on an Si substrate previously coated by a thin Au layer.
Applsci 12 07808 g004
Figure 5. X-ray diffraction (XRD) characterization of CdTe thin films deposited by VTE (a), RF-MS (b), and ECD (c). VTE and RF-MS thin film control samples were prepared using pristine optical glass substrates, while ECD test samples were synthesized using a common Au-coated Si substrate.
Applsci 12 07808 g005
Figure 6. XRD analysis of (111) diffraction peak corresponding to the CdTe thin film deposited by VTE (a) and RF-MS (b) on a pristine optical glass and by ECD (c) on an Si substrate coated by a thin Au film. The experimental data (black dots) were fitted with Voigt profiles (red curves), with the residual of this procedure presented at the bottom of each graph.
Applsci 12 07808 g006
Figure 7. (a,b) The transmission spectra of the CdTe films deposited by VTE (a) and RF-MS (b). The insets represent linear fitting plots used for thickness evaluation. The obtained slope values and associated standard errors (SEs) are indicated. R 2 represents the coefficient of determination. (ce) The absorption spectra obtained for CdTe films fabricated by VTE (c), RF-MS (d), and ECD (e). The CdTe films were deposited onto pristine optical glass substrate, except for the ECD samples, which were synthesized on a common Au-coated Si substrate. For the latter samples, the absorption spectrum was indirectly evaluated from the reflection spectrum, assuming negligible transmittance through the Au-coated Si substrate within the employed electromagnetic spectral range. Extrapolations of the linear fitting domains within absorption spectra to intercept the energy axis allowed for assessment of the optical band gap energy values, with the estimated accuracy in the range of ±0.01–0.03 eV.
Applsci 12 07808 g007
Table 1. Morphological parameters of the CdTe thin films deposited by VTE, RF-MS, and ECD, as statistically evaluated by AFM analysis. RMS represents the route mean square roughness and Ssk and K are the corresponding Skewness and Excess Kurtosis coefficients, respectively. The thickness of the deposited CdTe films (h) is indicated (SE denotes the standard error) as well, being directly estimated by SEM for all samples and subsequently calculated from the optical transmission spectra only for the VTE- and RF-MS-deposited CdTe thin films, respectively (see Section 3.3).
Deposition Method Control SampleRMS (nm)SskKh ± SE (nm)
VTE3.541.186.471032 ± 24.5
CdTe/glass
RF-MS2.40−0.030.101366 ± 21.6
CdTe/glass
ECD4.932.6611.13553 ± 13.4
CdTe/Au/Ti/Si
Table 2. Structural parameters of CdTe thin films deposited by VTE, RF-MS, and ECD, as quantitatively obtained by analytic fitting of the XRD experimental data using the Voigt profile; D e f ( 111 ) denotes the crystalline coherence length determined from the analysis of (111) crystalline plane, ε 2 1 / 2 is the mean square micro-strain, and a represents the lattice constant.
Deposition Method Control Sample D ef ( 111 ) (nm) ε 2 1 / 2 a (Å)
VTE81 1.5 × 10 3 6.46
CdTe/glass
RF-MS64 1.4 × 10 3 6.45
CdTe/glass
ECD21 8.3 × 10 3 6.44
CdTe/Au/Ti/Si
Table 3. Collection of morpho-structural data, showing the variation of the band gap energy (E g ) with the crystallite size ( D e f ( 111 ) ) and film thickness (h) for the CdTe layers deposited by VTE, RF-MS, and ECD, respectively. E g values are shown with an estimated accuracy of ±0.01–0.03 eV.
Deposition Method Control Sampleh ± SE (nm) D ef ( 111 ) (nm)E g (eV)
VTE1032 ± 24.5811.43
CdTe/glass
RF-MS1366 ± 21.6641.44
CdTe/glass
ECD553 ± 13.4211.48
CdTe/Au/Ti/Si
Publisher’s Note: MDPI stays neutral with regard to jurisdictional claims in published maps and institutional affiliations.