Article

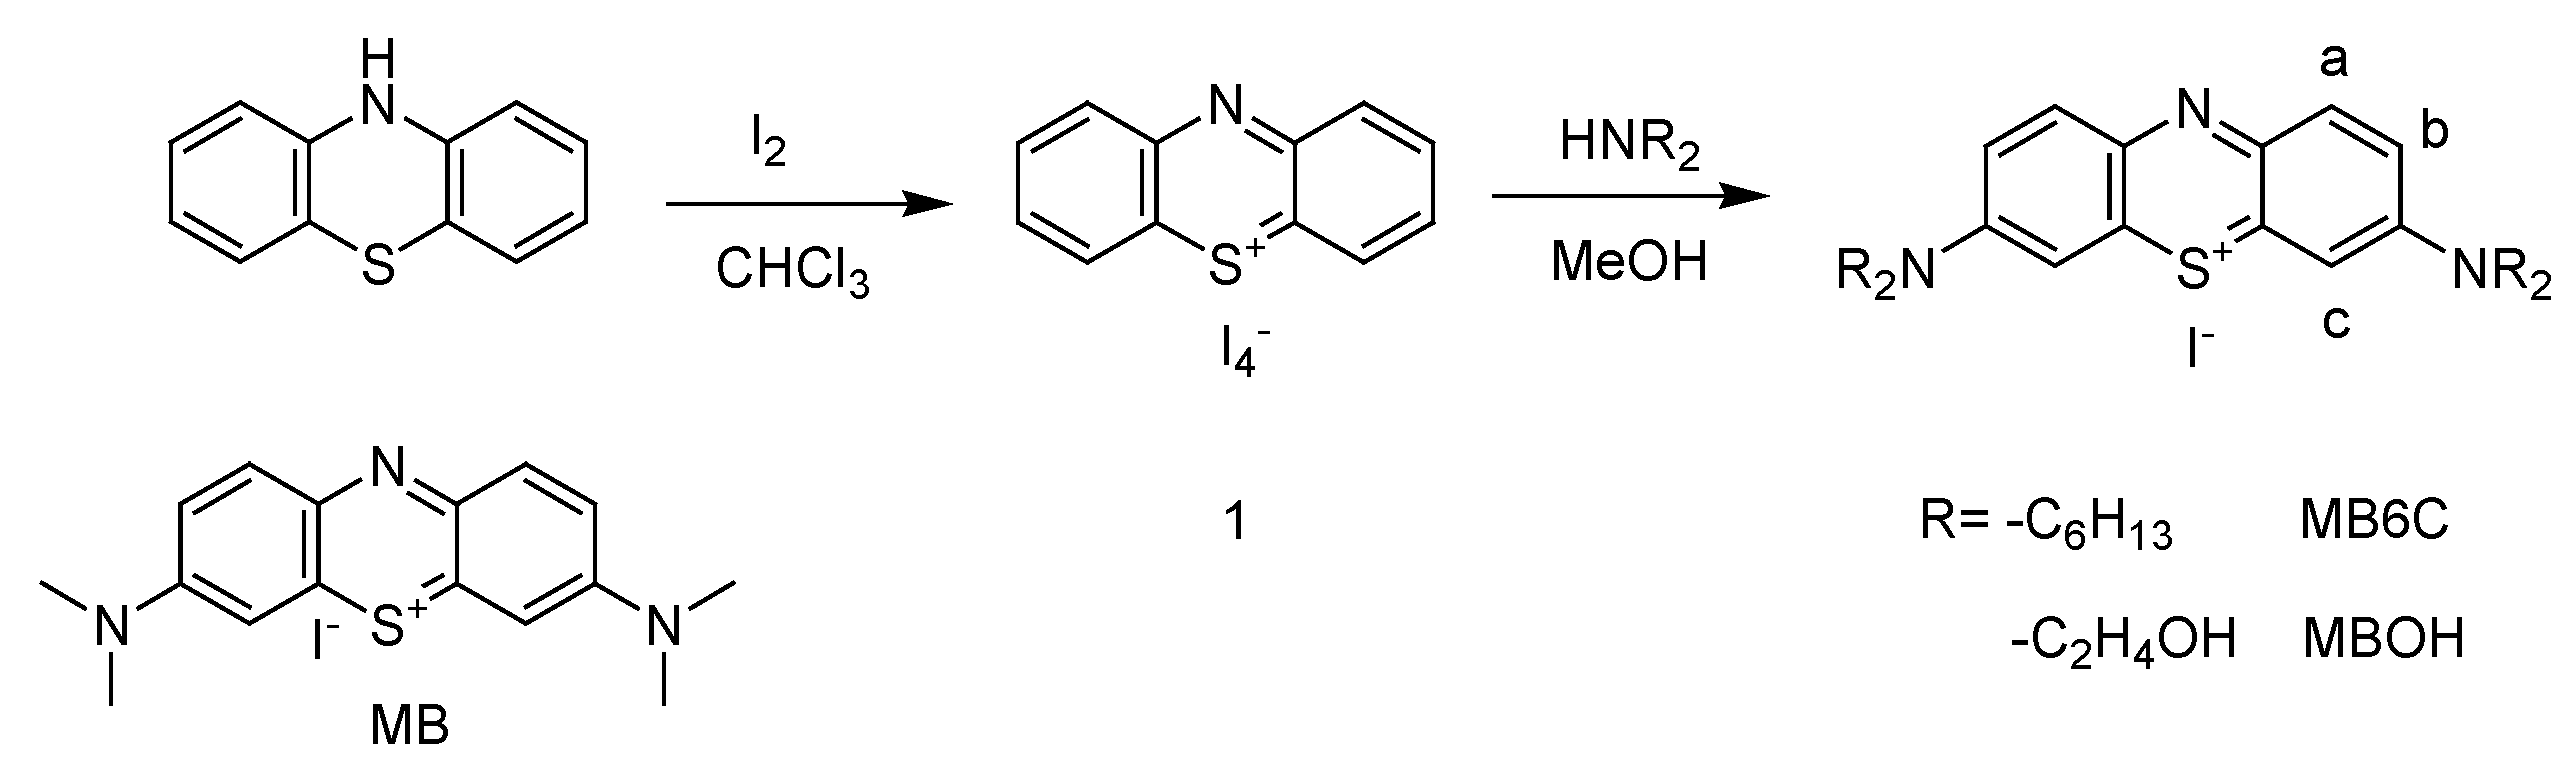
Investigation of Sonosensitizers Based on Phenothiazinium Photosensitizers

1
Graduate Institute of Biomedical Engineering, National Chung Hsing University, Taichung 402, Taiwan
2
Research Assistant Center, Show Chwan Memorial Hospital, Changhua 500, Taiwan
3
Department of Biology, National Changhua University of Education, Changhua 500, Taiwan
4
Office of Physical Education, Tamkang University, New Taipei City 251301, Taiwan
*
Author to whom correspondence should be addressed.
These authors contributed equally to this work.
Appl. Sci. 2022, 12(15), 7819; https://doi.org/10.3390/app12157819
Submission received: 2 July 2022 / Revised: 26 July 2022 / Accepted: 1 August 2022 / Published: 3 August 2022
(This article belongs to the Section Chemical and Molecular Sciences)

Abstract

:
The main advantage of sonodynamic therapy (SDT), the combining of ultrasound with a sonosensitizer, over photodynamic therapy (PDT) is that ultrasound penetrates deeper into tissues to activate the sonosensitizer, which offers noninvasive therapy for tumors in a site-oriented approach. In this study, we synthesized two symmetrical phenothiazine derivatives in which the methyl groups of MB (methylene blue) have been replaced by a hexyl and hydroxyethyl chains, named 3,7-bis(dihexylamino)-phenothiazin-5-ium iodide (MB6C) and 3,7-bis(di(2-hydroxyethyl)amino)-phenothiazin-5-ium iodide (MBOH), respectively. We explore the efficiency differences between PDT and SDT induced by these phenothiazine derivatives based on the standard of methylene blue (MB). Spectral studies indicate that these MB analogs exhibit sonosensitization ability with a similar tendency to the photosensitization ability. This means that MB, MBOH, and MB6C can be potential photosensitizers and sonosensitizers. After biological evaluation, we conclude that compound MB6C is a potential PDT and SDT candidate because it exhibits higher uptake, efficient intracellular phototoxicity and sonotoxicity over MB and MBOH, with IC50 values of ~2.5 µM and ~5 µM, respectively.

1. Introduction

Cancer is one of the major causes of human death, and the number of patients diagnosed is increasing rapidly. Many efforts for cancer treatments involve invasive (surgery) and noninvasive procedures (chemotherapy, radiation) to remove the tumor [1]. Recently, a cancer therapy method called photodynamic therapy (PDT), which activates photosensitizers with related wavelengths, has been widely used [2]. PDT activates the photosensitizer (Ps) accumulated in the tumor area through the light excitation of appropriate wavelengths, transforms the Ps into a high-energy state and triggers a photochemical reaction to bring about ROS (reactive oxygen species) to kill tumor cells but not normal tissues outside the treatment area [3,4]. Currently, PDT has been widely used in the treatment of prostate, breast, head and neck, skin, pancreas, and lung cancers [5]. Incidentally, recent research on photosensitizers has mainly focused on their photochemical activity, which enables PDT to be applied not only to the theranostics of cancer [6] but also to the photodynamic inactivation (PDI) of viruses and microorganisms [7,8].
Extended from PDT, Umemura et al. first explored sonodynamic therapy (SDT) in the 1990s as a noninvasive treatment [9]. Sonosensitizer-generated SDT is expected to be a next-generation therapy strategy [10,11]. The energy source is the major difference between SDT and PDT for activating the sensitizer; one utilizes ultrasound and the other uses light. Ultrasound penetrates deeper into tissues and can be focused tightly even through tens of centimeters into soft tissues when compared to PDT, which is limited by the short penetration depth of light [12,13]. The ultrasonically activated sonosensitizers can produce reactive oxygen species (ROS), such as superoxide anion (O2•−), hydroxy radical (•OH), hydrogen peroxide (H2O2) or singlet oxygen (1O2) [9,14]. When discussing the underlying mechanisms of SDT-induced apoptosis or necrosis, sonosensitizers are considered the most critical factor to maximize effectiveness. We focused on organic small molecule sonosensitizers and found that the most commonly used are porphyrin derivatives, such as hematoporphyrin (Hp), protoporphyrin IX (PpIX), chlorin e6 (Ce6), and hematoporphyrin monomethyl ether (HMME) [15,16,17]. The xanthene derivatives erythrosine B (EB) [18,19] and rose bengal (RB) [20,21] have also been found to exhibit a high relationship with ultrasonication. Other small molecule agents, such as hypocrellin B (HB) [22,23], IR780 [24,25], indocyanine green (ICG) [26,27], curcumin [28,29], and 5-aminolevulinic acid (a natural porphyrin precursor) [30,31], have also been reported as effective sonosensitizers. Most notably, the anticancer drug doxorubicin was also found to act as a sonosensitizer and showed relatively high SDT efficiency [32,33]. Thus, we know that most sonosensitizers are derived from photosensitizers, which may cause apparent phototoxicity and offer undesirable biological profiles.
The photosensitizer methylene blue (MB) [34,35], a low-toxicity phenothiazine molecule, has been approved for antifungal, antibacterial [36], and antimalarial activity [37] and in the staining of living organisms for clinical use. The literature has reported that MB could be a new sonosensitizer and cause ultrasound-induced cell death [38,39,40]. However, the specific cellular mechanism of MB-induced SDT on tumors is unclear. The purpose of this study is to evaluate the SDT efficiencies of MB, its hydrophilic derivative MBOH, and its lipophilic derivative MB6C (as shown in Scheme 1). Molecular synthesis, spectra, and ROS measurements and the cellular assays of these molecules were performed and discussed for SDT development.

2. Materials and Methods

2.1. Materials

Methylene blue (MB) was purchased from Alfa Aesar. 1,3-Diphenylisobenzofuran (DPBF) was purchased from Aldrich Chemical Co. All of the solvents were of spectrometric grade. In this study, the highest-grade general chemicals were employed that obtained from Acros Organic Co., Merck Ltd., or Aldrich Chemical Co. and used without further purification. All compound and DPBF stock solutions (10−2 M) were kept in the dark at 4 °C until use. Molecular 3,7-bis(di(2-hydroxyethyl)amino)-phenothiazin-5-ium iodide (MBOH) and 3,7-bis(dihexylamino)-phenothiazin-5-ium iodide (MB6C) were synthesized as shown in Scheme 1. All the spectra for identifying compounds are listed in the supporting information (Supplementary Materials Figures S1–S6)
Synthesis of phenothiazinium tetraiodide hydrate 1 [41]. To a solution of phenothiazine (1.0 g, 0.005 mol) in chloroform (35 mL) contained in a 250 mL round-bottom flask, an iodine (3.8 g, 0.015 mol)-containing chloroform (115 mL) was added dropwise in an ice bath and then kept at room temperature for 4 h. The solution was filtered, and the solid was washed with a large amount of chloroform (50 mL × 4) to remove the excess iodine. After drying, a dark green powder (3.1 g, 88%) was obtained. 1H NMR (400 MHz, DMSO-d6): δ (ppm) = 7.82–8.05 (m, 4H), 7.60–7.75 (m, 4H). Mass (ESI+): calculated for C12H8NS+ m/z = 198.04, found 198.0.
Synthesis of 3,7-bis(dihexylamino)-phenothiazin-5-ium iodide (MB6C) [42]. Tetraiodide hydrate salt 1 (1.44 g, 0.002 mol) was dissolved in 40 mL of methanol at room temperature. An excess amount of N,N-dihexylamine (8 mmol) in methanol (10 mL) was added dropwise, and the system was stirred for 4 h. The product tetraalkylamino phenothiazinium precipitated and was filtered and recrystallized three times by a CH2Cl2-MeOH system. The final product was collected as a dark purple solid (yield 68%) after drying overnight in an oven. 1H NMR (400 MHz, DMSO-d6) δ (ppm) = 7.92 (d, J = 8.8 Hz, 2 Ha), 7.50 (dd, J = 8.8, 2.4 Hz, 2 Hb)-7.47 (d, J = 2.4 Hz, 4 Hc), 3.68 (t, 8H), 2.99–2.75 (m, 8H), 1.7–1.45 (m, 8H), 1.4–1.2 (m, 8H), 0.8–1.0 (m, 20H). MS (ESI+): calculated for C28H42N3S+ m/z = 564.0, found m/z = 564.5.
Synthesis of 3,7-bis(di(2-hydroxyethyl)amino)-phenothiazin-5-ium iodide (MBOH). Similar to MB6C [43], a solution of the appropriate N,N-di(2-hydroxyethyl)amine (8 mmol) in methanol (10 mL) was added to the solution containing compound 1 and stirring was continued for 3 h by monitoring with thin-layer chromatography. The methanol was removed under vacuum and purified by flash chromatography (eluent CH2Cl2/MeOH 95/5 (v/v)) to yield a dark green–purple solid (52%). 1H NMR (400 MHz, DMSO-d6) δ (ppm) = 7.87 (d, J = 8.8 Hz, 2 Ha), 7.53~7.56 (m, 2 Hb and 2 Hc), 5.03 (t, 4H, CCOH) 3.84 (m, 8 H, CH2CH2OH), 3.71 (m, 8 H, CH2CH2OH). MS (ESI+): calcd. for C20H26N3O4S+ m/z = 404.16, found m/z = 404.2.

2.2. Apparatus

We used a Thermo Genesys 6 UV–visible spectrophotometer to collect the absorption spectra. A HORIBA JOBIN-YVON Fluoromas-4 spectrofluorometer was used to record fluorescence spectra on with a 1-nm bandpass in a 1-cm cell length at room temperature. EI mass spectra were recorded using a MAT 95XL double-focusing mass spectrometer from FINNIGAN MAT. Precision weights were determined via the peak-matching method. 1H NMR spectra were recorded on a VARIAN Mercury 400 MHz spectrometer. The spectra of samples of DMSO-d6 were recorded, and chemical shifts (δ) are given in ppm downfield from Me4Si, determined by chloroform (=7.26 ppm). The cellular fluorescence images were obtained using a Leica AF6000 fluorescence microscope combining a Leica DFC310 FX digital color camera. The light source from Xenon Light Source LAX-Cute (Asahi Spectra, Torrance, CA, USA) with a 400–700 nm cube and a 510 long pass filter was used to measure the singlet oxygen yield and PDT effect. An ultrasonicator (CDS-100) in 22 °C ± 3 cold water was used as the ultrasound source for measuring the singlet oxygen yield and SDT.

2.3. Cell Culture

A549 lung cancer cells were cultured in MEM and cultured in a 37 °C incubator containing 5% CO2. The cells were purchased from Bioresource Collection and Research Center (BCRC). Minimum Essential Medium (MEM), phosphate-buffered saline (PBS), penicillin streptomycin (Pen-strep), MEM nonessential amino acids (MEM-NEAA), and fetal bovine serum (FBS) were purchased from Invitrogen. The cell experiment was carried out in a 3 cm petri dish, and 2 × 10⁵ cells were seeded into the petri dish and cultured overnight. On the second day, the precalculated concentration of the compound and the culture solution were added, shaken evenly, and placed in the culture room for culture.

2.4. MTT Assay

Cells were seeded in 96-well plates (2 × 10³ cells per well) and placed in an incubator at 37 °C in a 5% CO2. They were then treated with different concentrations (1 to 20 μM) of the compound for 12 h to examine the short-term cytotoxic effect. Subsequently, the culture medium was refreshed, and the plates were irradiated or ultrasonicated and then incubated overnight at 37 °C. The 3-(4,5-dimethylthiazol-2-yl)-2,5-diphenyl-tetrazolium bromide (MTT) was used to determine and analyzed the cytotoxicity by an automatic microplate reader (Multiskan EX, Thermo Electron Corporation, Vantaa, Finland) fixing at 595 nm. The data error bars were achieved based on three independent experiments. The dark toxicity means that the cells are incubated with compounds but no light or ultrasound treatment, and the control assay means that cells were not incubated with any compound but with light or ultrasound treatment.

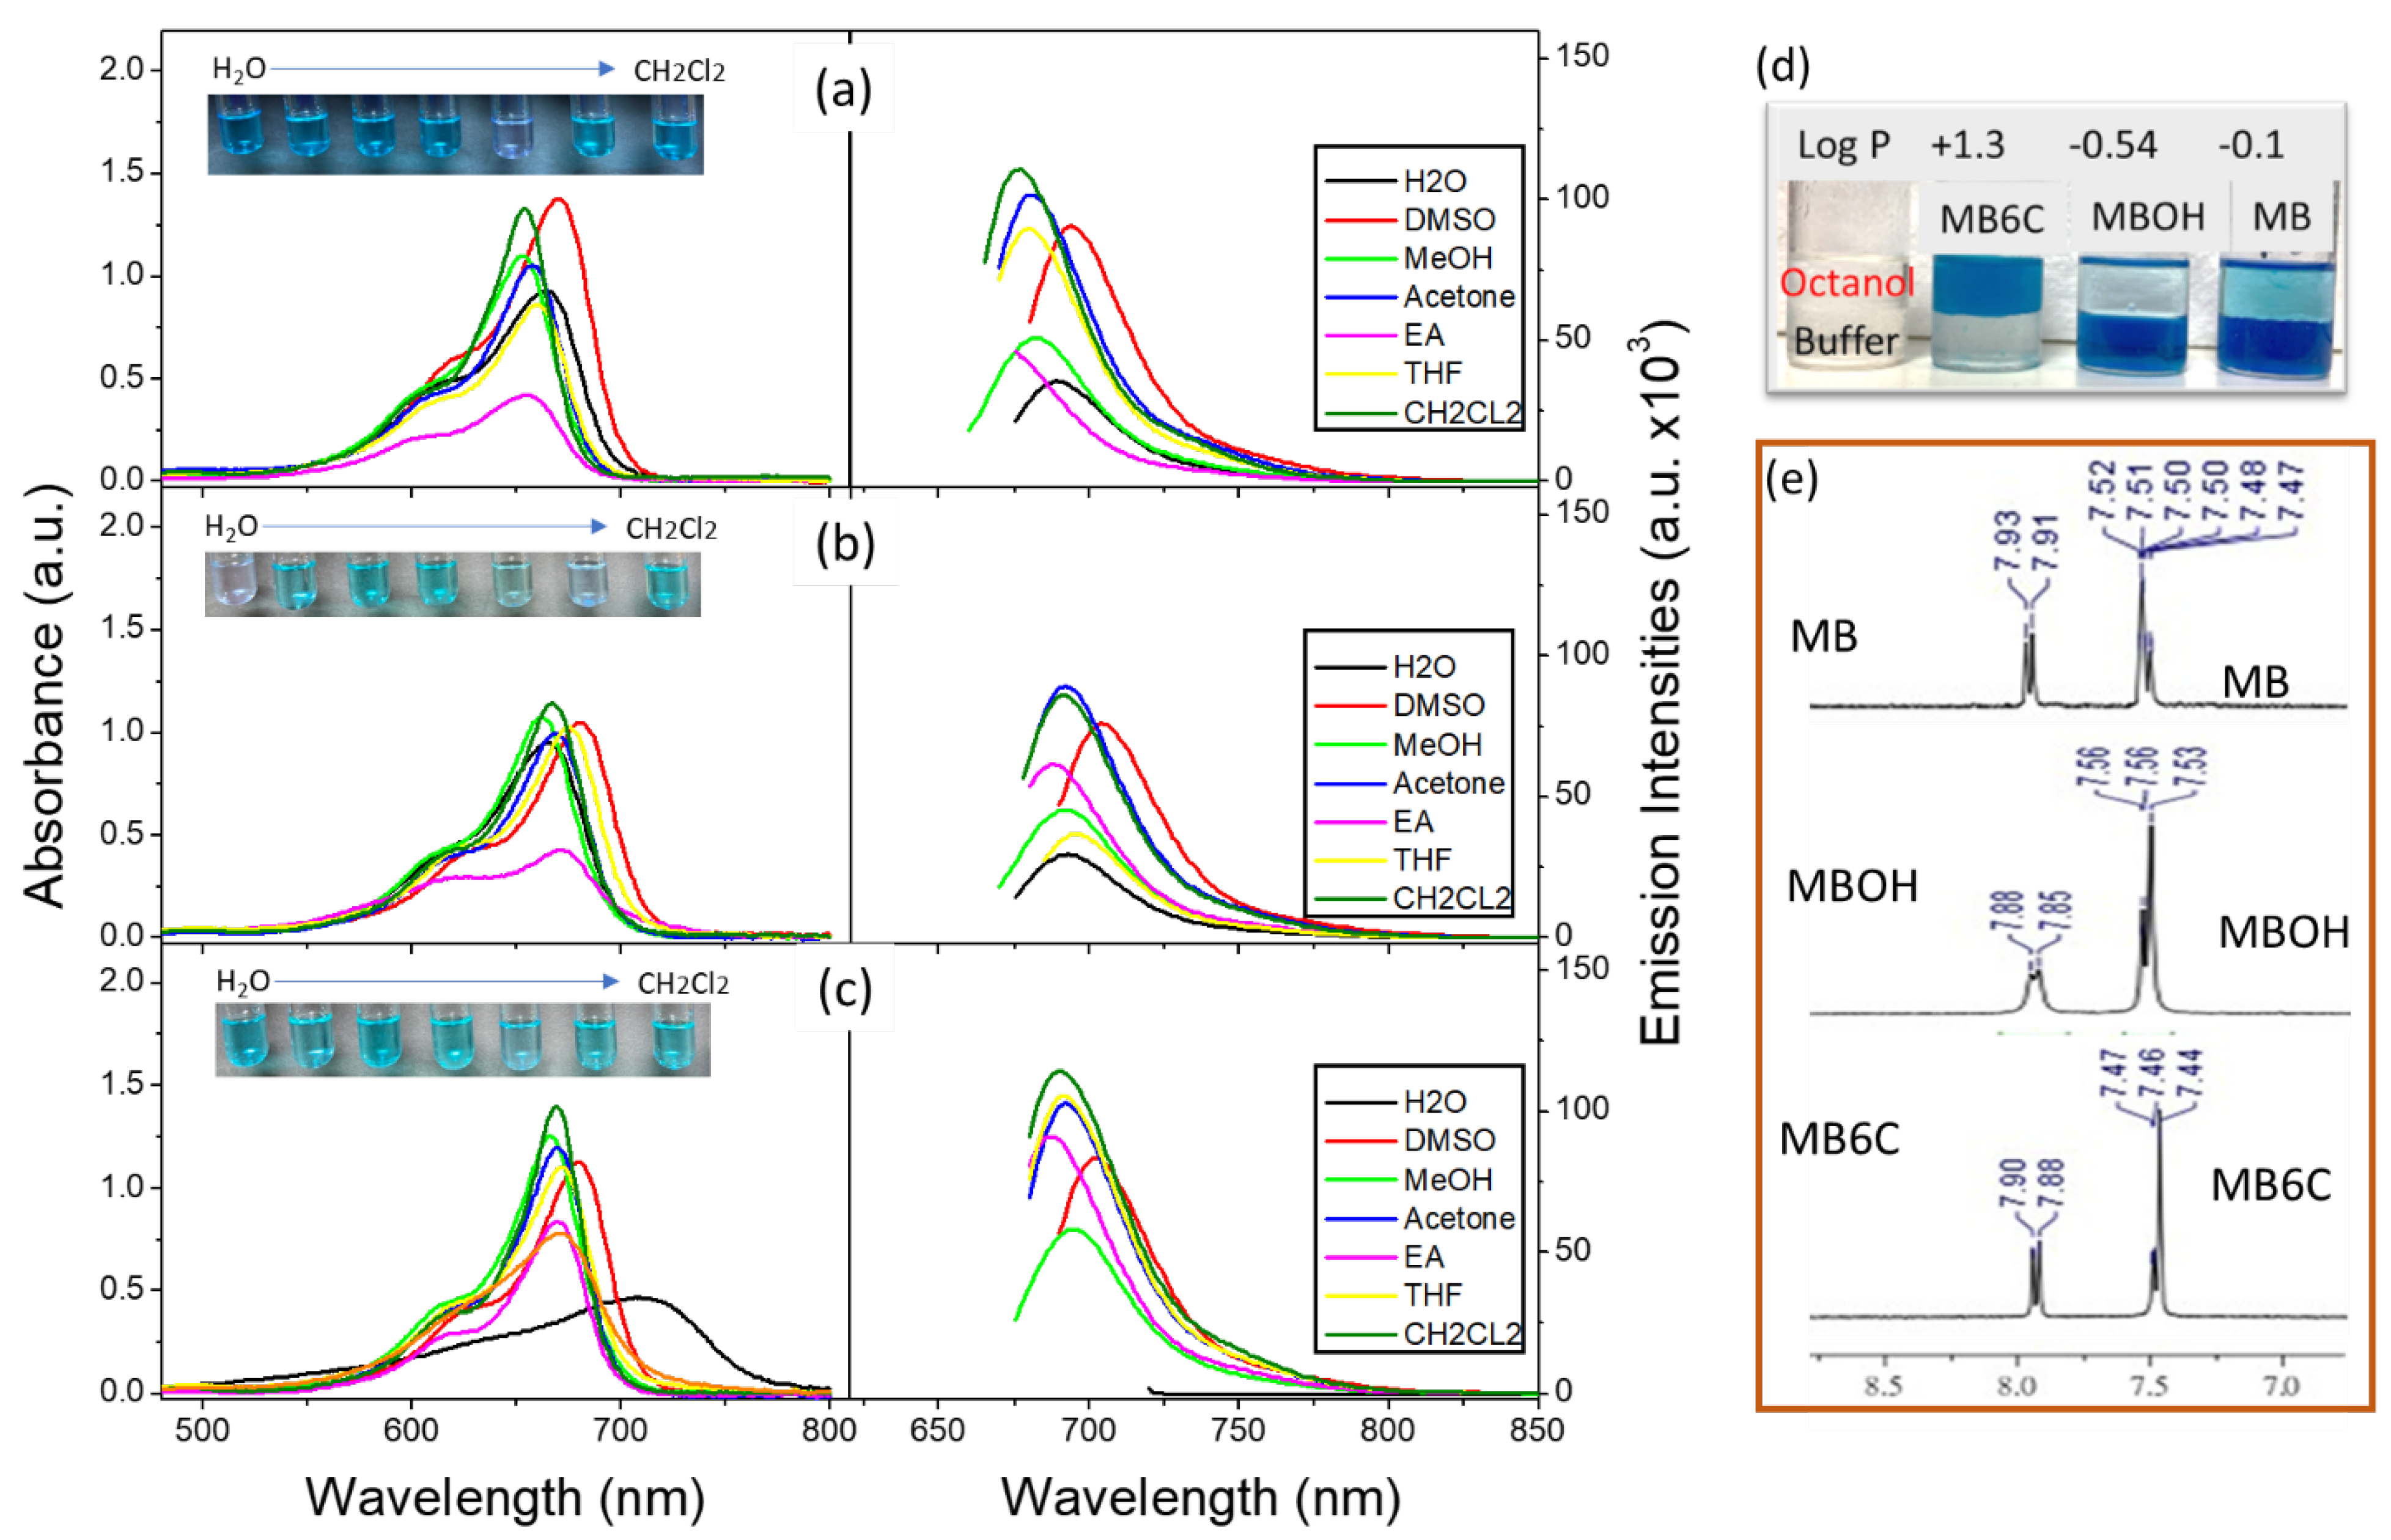
2.5. Hydrophilic–Lipophilic Balance (LogP)

The lipophilicities of theses photosensitizers were defined in terms of logP, which is the logarithm plot of their partition coefficients relationships between phosphate-buffered saline and 1-octanol. The data were calculated using the standard spectrophotometric method based on the following relationship:
LogP = Log [(A − A1)/A1 × Vw/Vo]
where A and A1 are the intensities of absorption before and after partitioning, respectively, and Vw and Vo are the divided volumes of the aqueous and 1-octanol phases. The determinations were repeated three times.

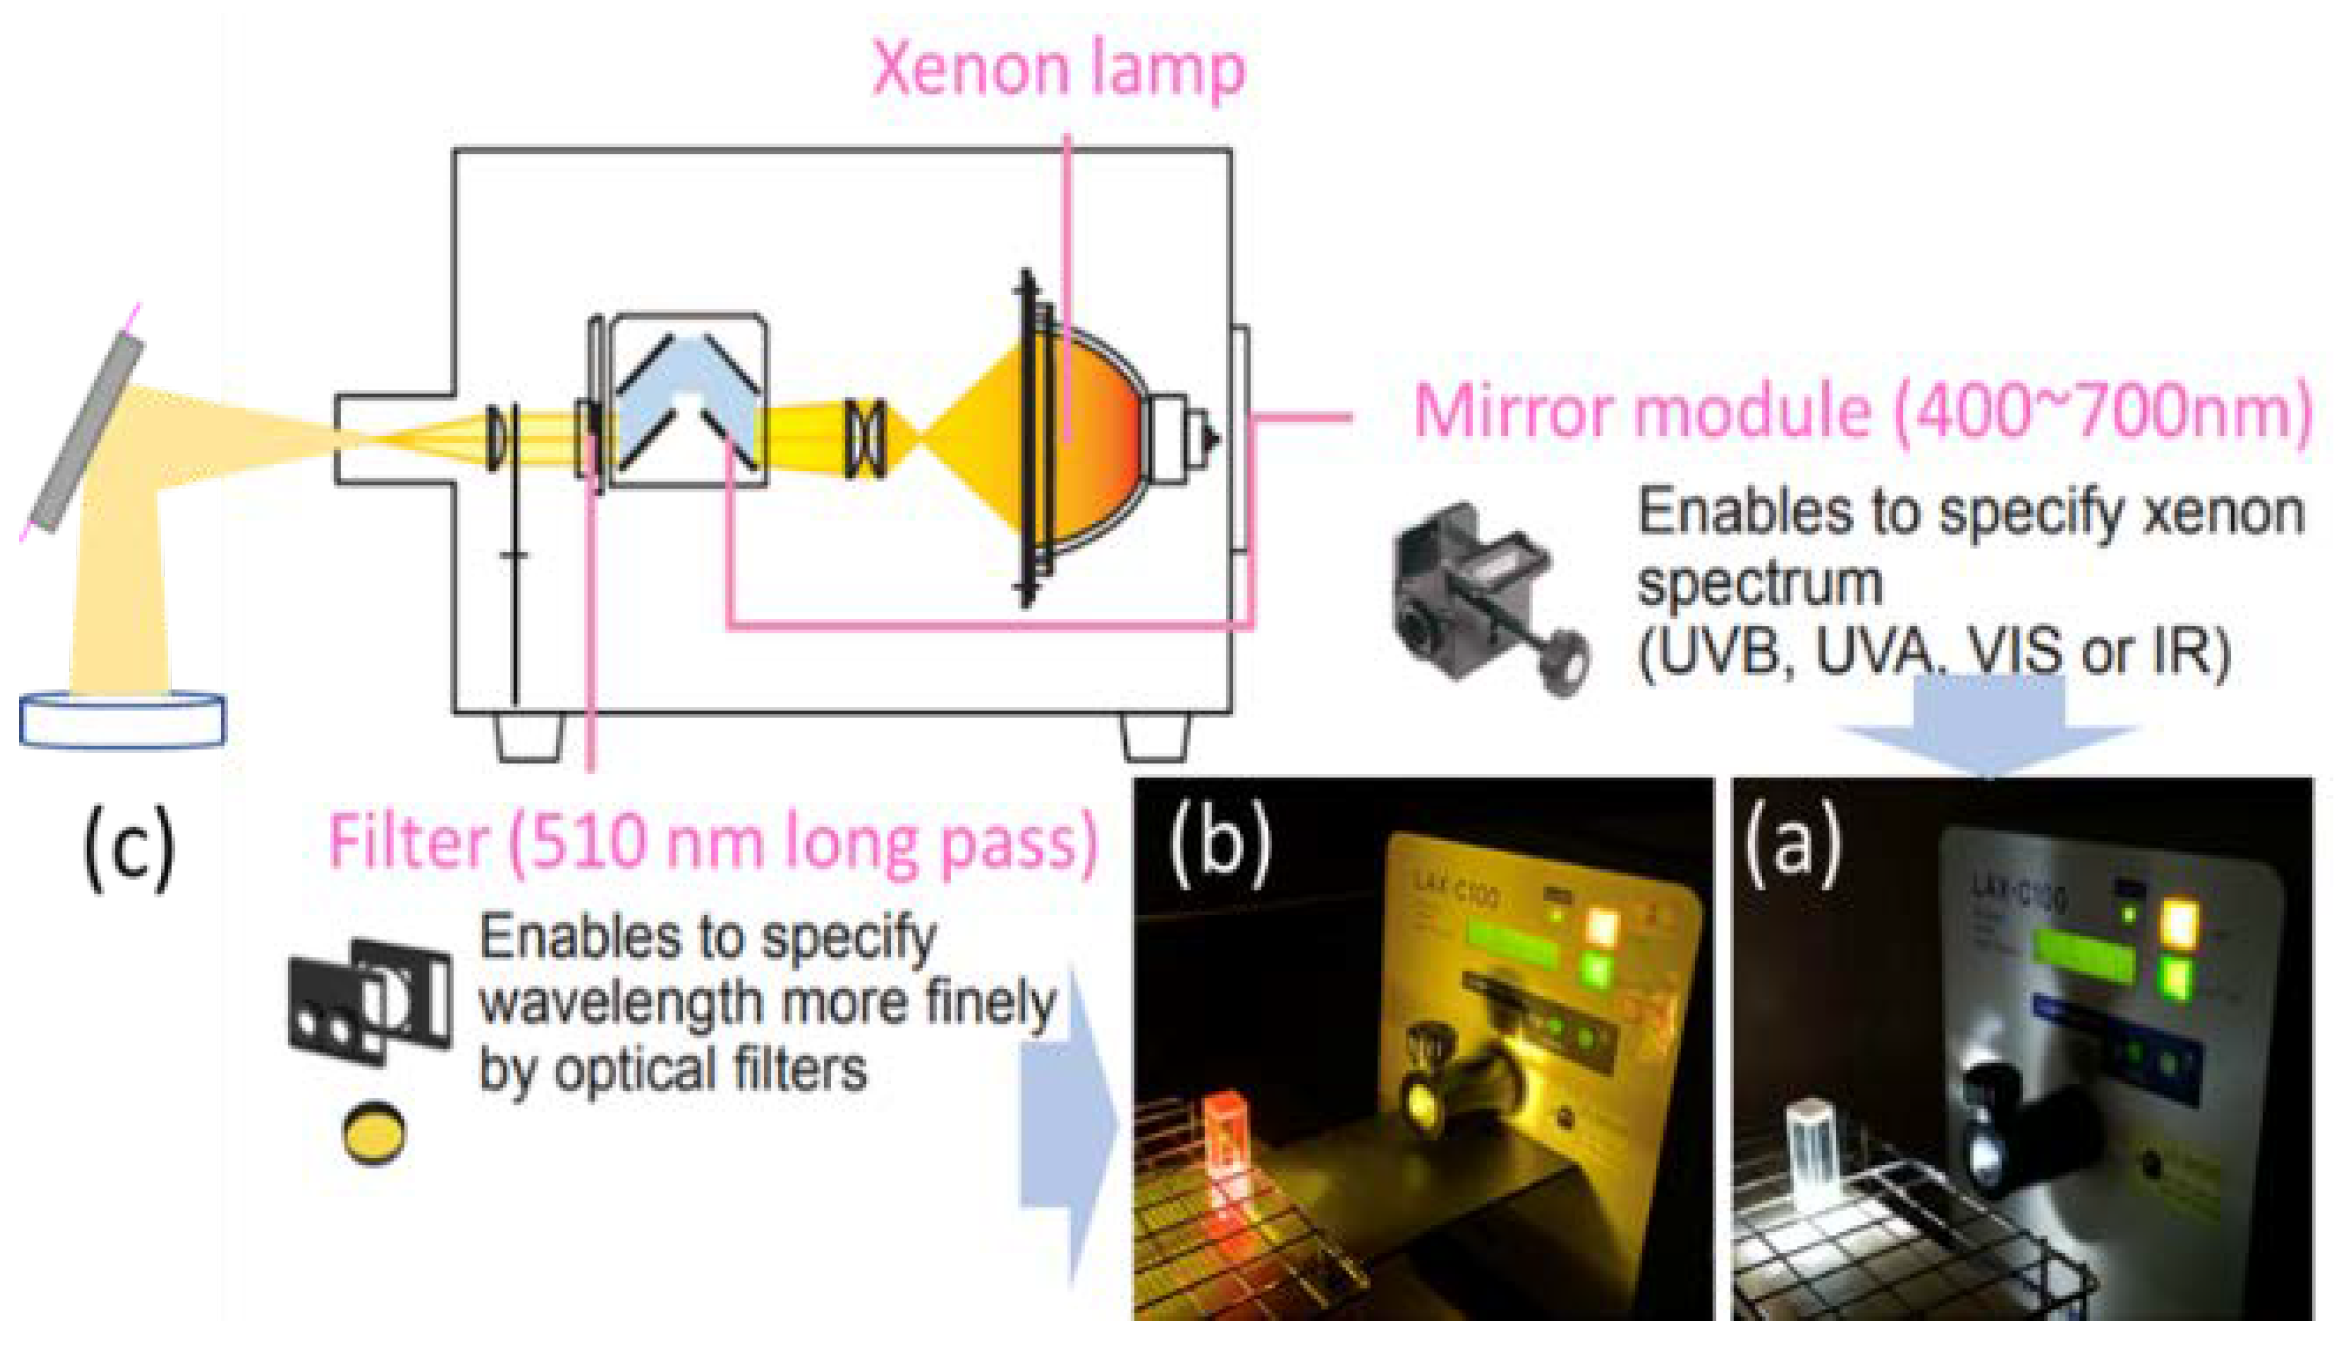
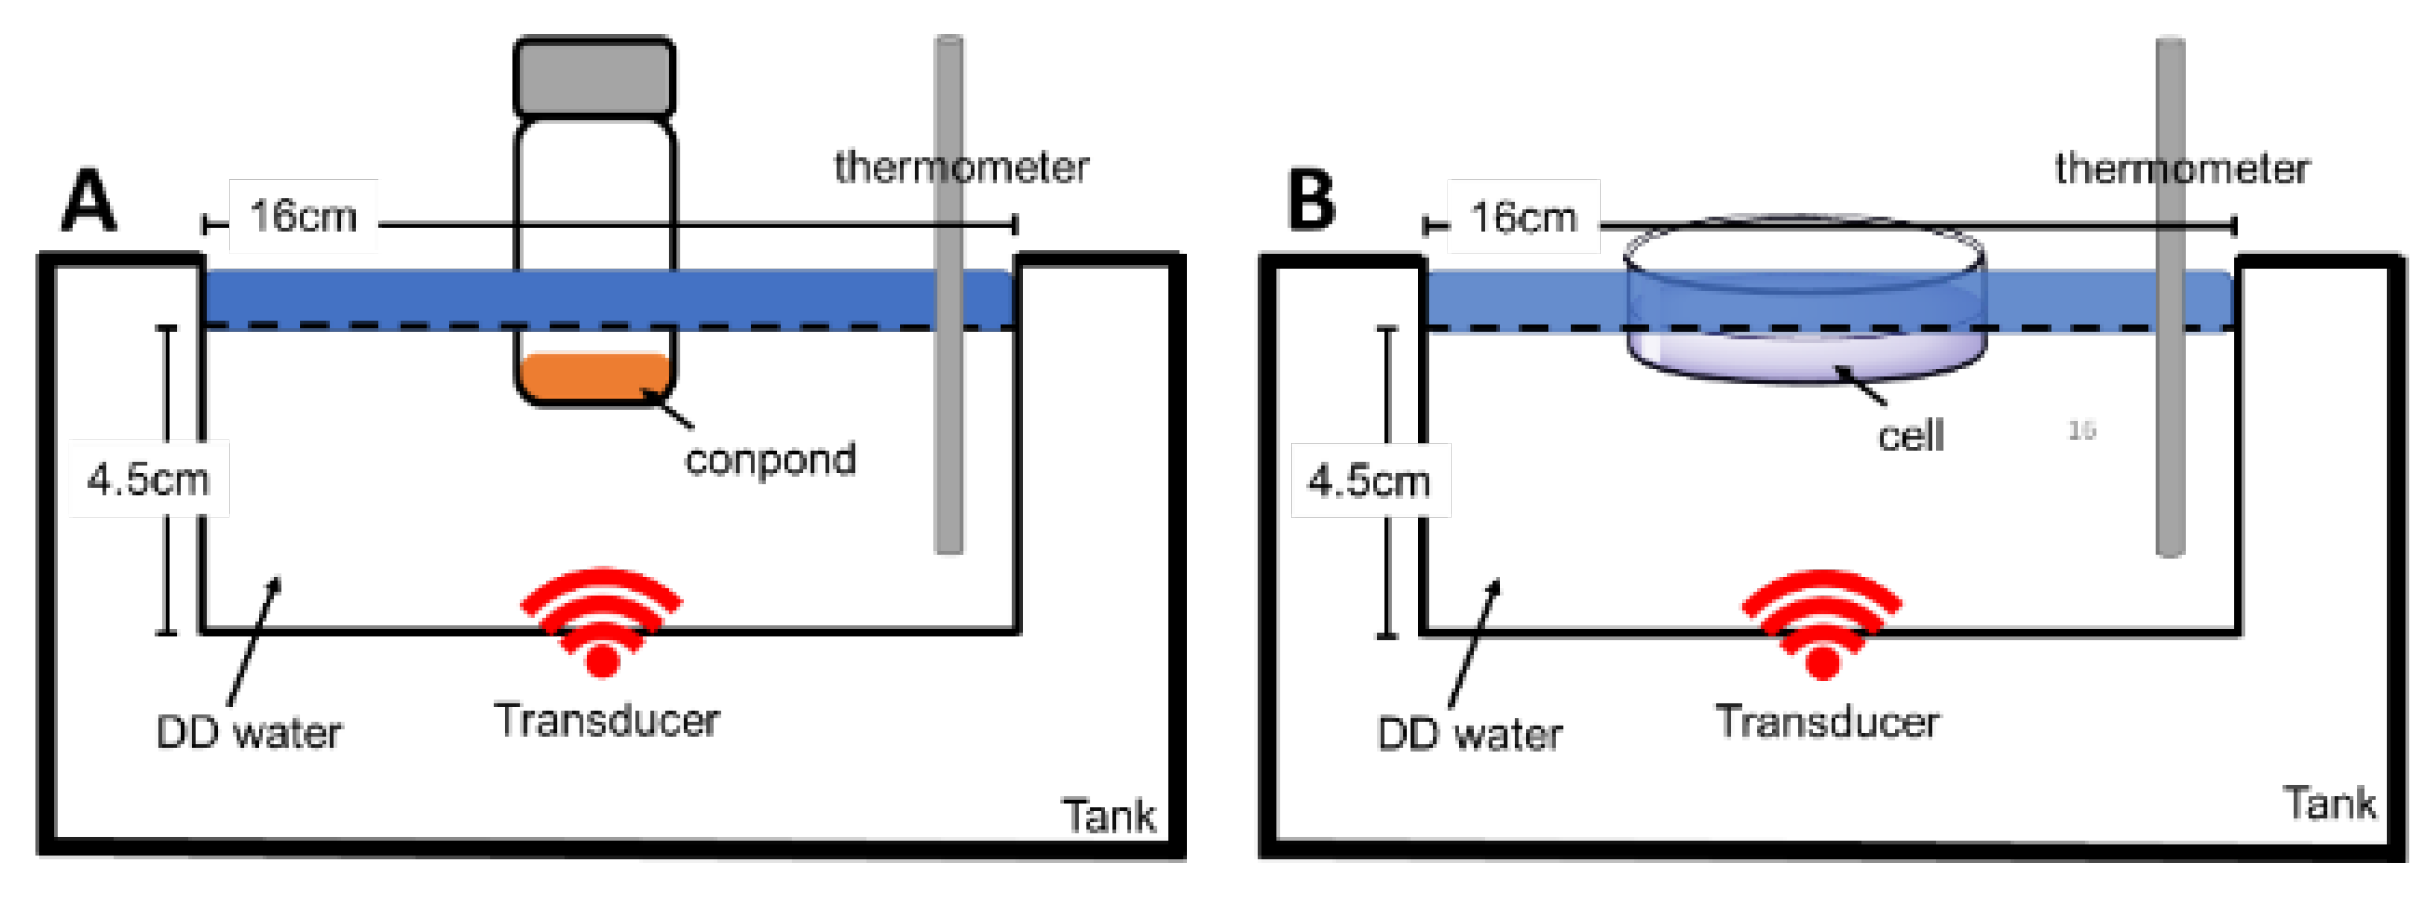
2.6. Design of PDT and SDT Apparatus Setting

2.6.1. Measurement of Photoinduced ROS and Cytotoxicity Assay

As shown in Figure 1, the white light (400~700 nm) was produced by a 100 W Xenon lamp with 20% output and then passed through mirror module (400–700 nm, Figure 1a). Eventually, the desired light source with a wavelength range of 510~700 nm was achieved by a 510 nm long pass filter (Figure 1b). The singlet oxygen quantum yield from the compound was determined using the photo-steady state method using 1,3-diphenylisobenzofuran as the scavenger in DMSO. For the cellular cytotoxicity assay, varying concentrations of compounds were incubated with human lung A549 cancer cells in the dark for 12 h. Subsequently, the culture medium was refreshed and then irradiated using a light source as described above (the light power was 15 mW/cm2 on the dish surface, which was measured using an optical power meter, Figure 1c) and then incubated overnight at 37 °C. All of these experiments were performed in triplicate and presented an average from three individual runs.

2.6.2. Measurement of Sono-Induced ROS and Cytotoxicity Assay

As shown in Figure 2, ultrasonic water baths (frequency is 42 kHz, power 35 W) as the energy source of ultrasound (US) were applied for spectral and cell disk measurements, respectively. Prior to ultrasound exposure, the cell-containing culture plate was placed on a platform and then immersed in a tank (0.5 W/cm2 with a frequency of 1.7 MHz in continuous waves) containing degassed water (16 × 4.5 cm). A transducer emitting plane waves with 48-mm-diameter was fixed at the bottom of the tank, allowing the ultrasound beams to point upward. The distance between the bottom of the culture plate and the transducer was 2.5 cm.

2.7. Sinlet Oxygen (1O2) Detection Using a Chemical Probe

A chemical trap DPBF has been used to detect 1O2 [44]. A DMSO solution of MB (2 mL, with 1 absorbance (OD) of at 670 nm) was mixed with DPBF (with 1 absorbance (OD) of at 418 nm). The mixed solution was sonicated in a glass vessel (diameter of 2.5 cm) for 10 min with an ultrasound device (CDS-100) at 42 kHz. The absorption spectra of the sample solution after ultrasonic treatment were recorded using a UV–Vis Spectrophotometer (Thermo Genesys 6, Madison WI, USA).

2.8. Double Stain Apoptosis Detection (Hoechst 33342/PI)

We used a staining assay, propidium iodide (PI, P3566, Invitrogen, Waltham, Massachusetts, USA) and Hoechst 33342 (H-1399, Invitrogen, USA), to characterize SDT-mediated phototoxicity by using a fluorescence microscope, which were stained after sonicating performances. The blue-fluorescence dye Hoechst 33342 (ex/em~350/461 nm) stains the condensed chromatin more brightly in apoptotic cells than the chromatin in normal cells. The PI, red-fluorescence dye (ex/em~535/617 nm), is only permeant to dead cells through the damaged member. Thus, the staining pattern resulted from the simultaneous use of these dyes makes it possible to distinguish normal (blue−/red−), apoptotic (blue+/red−), and dead cell (blue+/red+) populations by flow cytometer and fluorescence microscopy [45,46].

3. Results

3.1. Molecular Basic Spectroscopic Properties

Figure 3a–c shows the solvent effects on the absorption and fluorescence spectra of the three phenothiazine derivatives. The absorption spectrum curve of MB6C shows a relative redshift (725 nm) in the water environment with a lower extinction coefficient, which is indicative of aggregation with a higher dimer ratio (shoulder 650 nm) than in other solvents. The opposite trend is observed in MBOH with progressively diethanolated analogs of methylene blue. This fact confirmed that the peak broadening is not observed in MBOH. Moreover, we observe that MB and MBOH do not dissolve in ethyl acetate and toluene as MB6C does. This means that MBOH is relatively more hydrophilic while MB6C is more hydrophobic with respect to MB. The octanol-buffer partition coefficients were studied to check the LogP of these compounds. Figure 3d clearly shows that MB (LogP = −0.1) and MBOH (LogP = −0.54) are hydrophilic, with more than 90% in the aqueous phase. The longer-chain analogs MB6C ((LogP = +1.3) are more hydrophobic, which causes 90% partition in the octanol phase. Please note that the NMR chemical shifts for these three molecules are very similar. In particular, the aromatic region (6~9 ppm, Figure 3e) shows three sets of chemical shifts: doublet, doublet–doublet, and a set of meta doublets. This is the standard spectrum of the 3,6-disubstituted phenothiazinium core. Thus, we speculate that there is no difference in the electronic configurations of these three compounds, which is why they reveal similar optical behaviors in most of the solvents in Figure 3. However, when MB and MBOH are dissolved in EA and MB6C in water, they present apparent differences compared to other solvents. We inferred that this result can be caused by the molecular structure, which results in the observed solubility and the tendency of molecules toward aggregation.

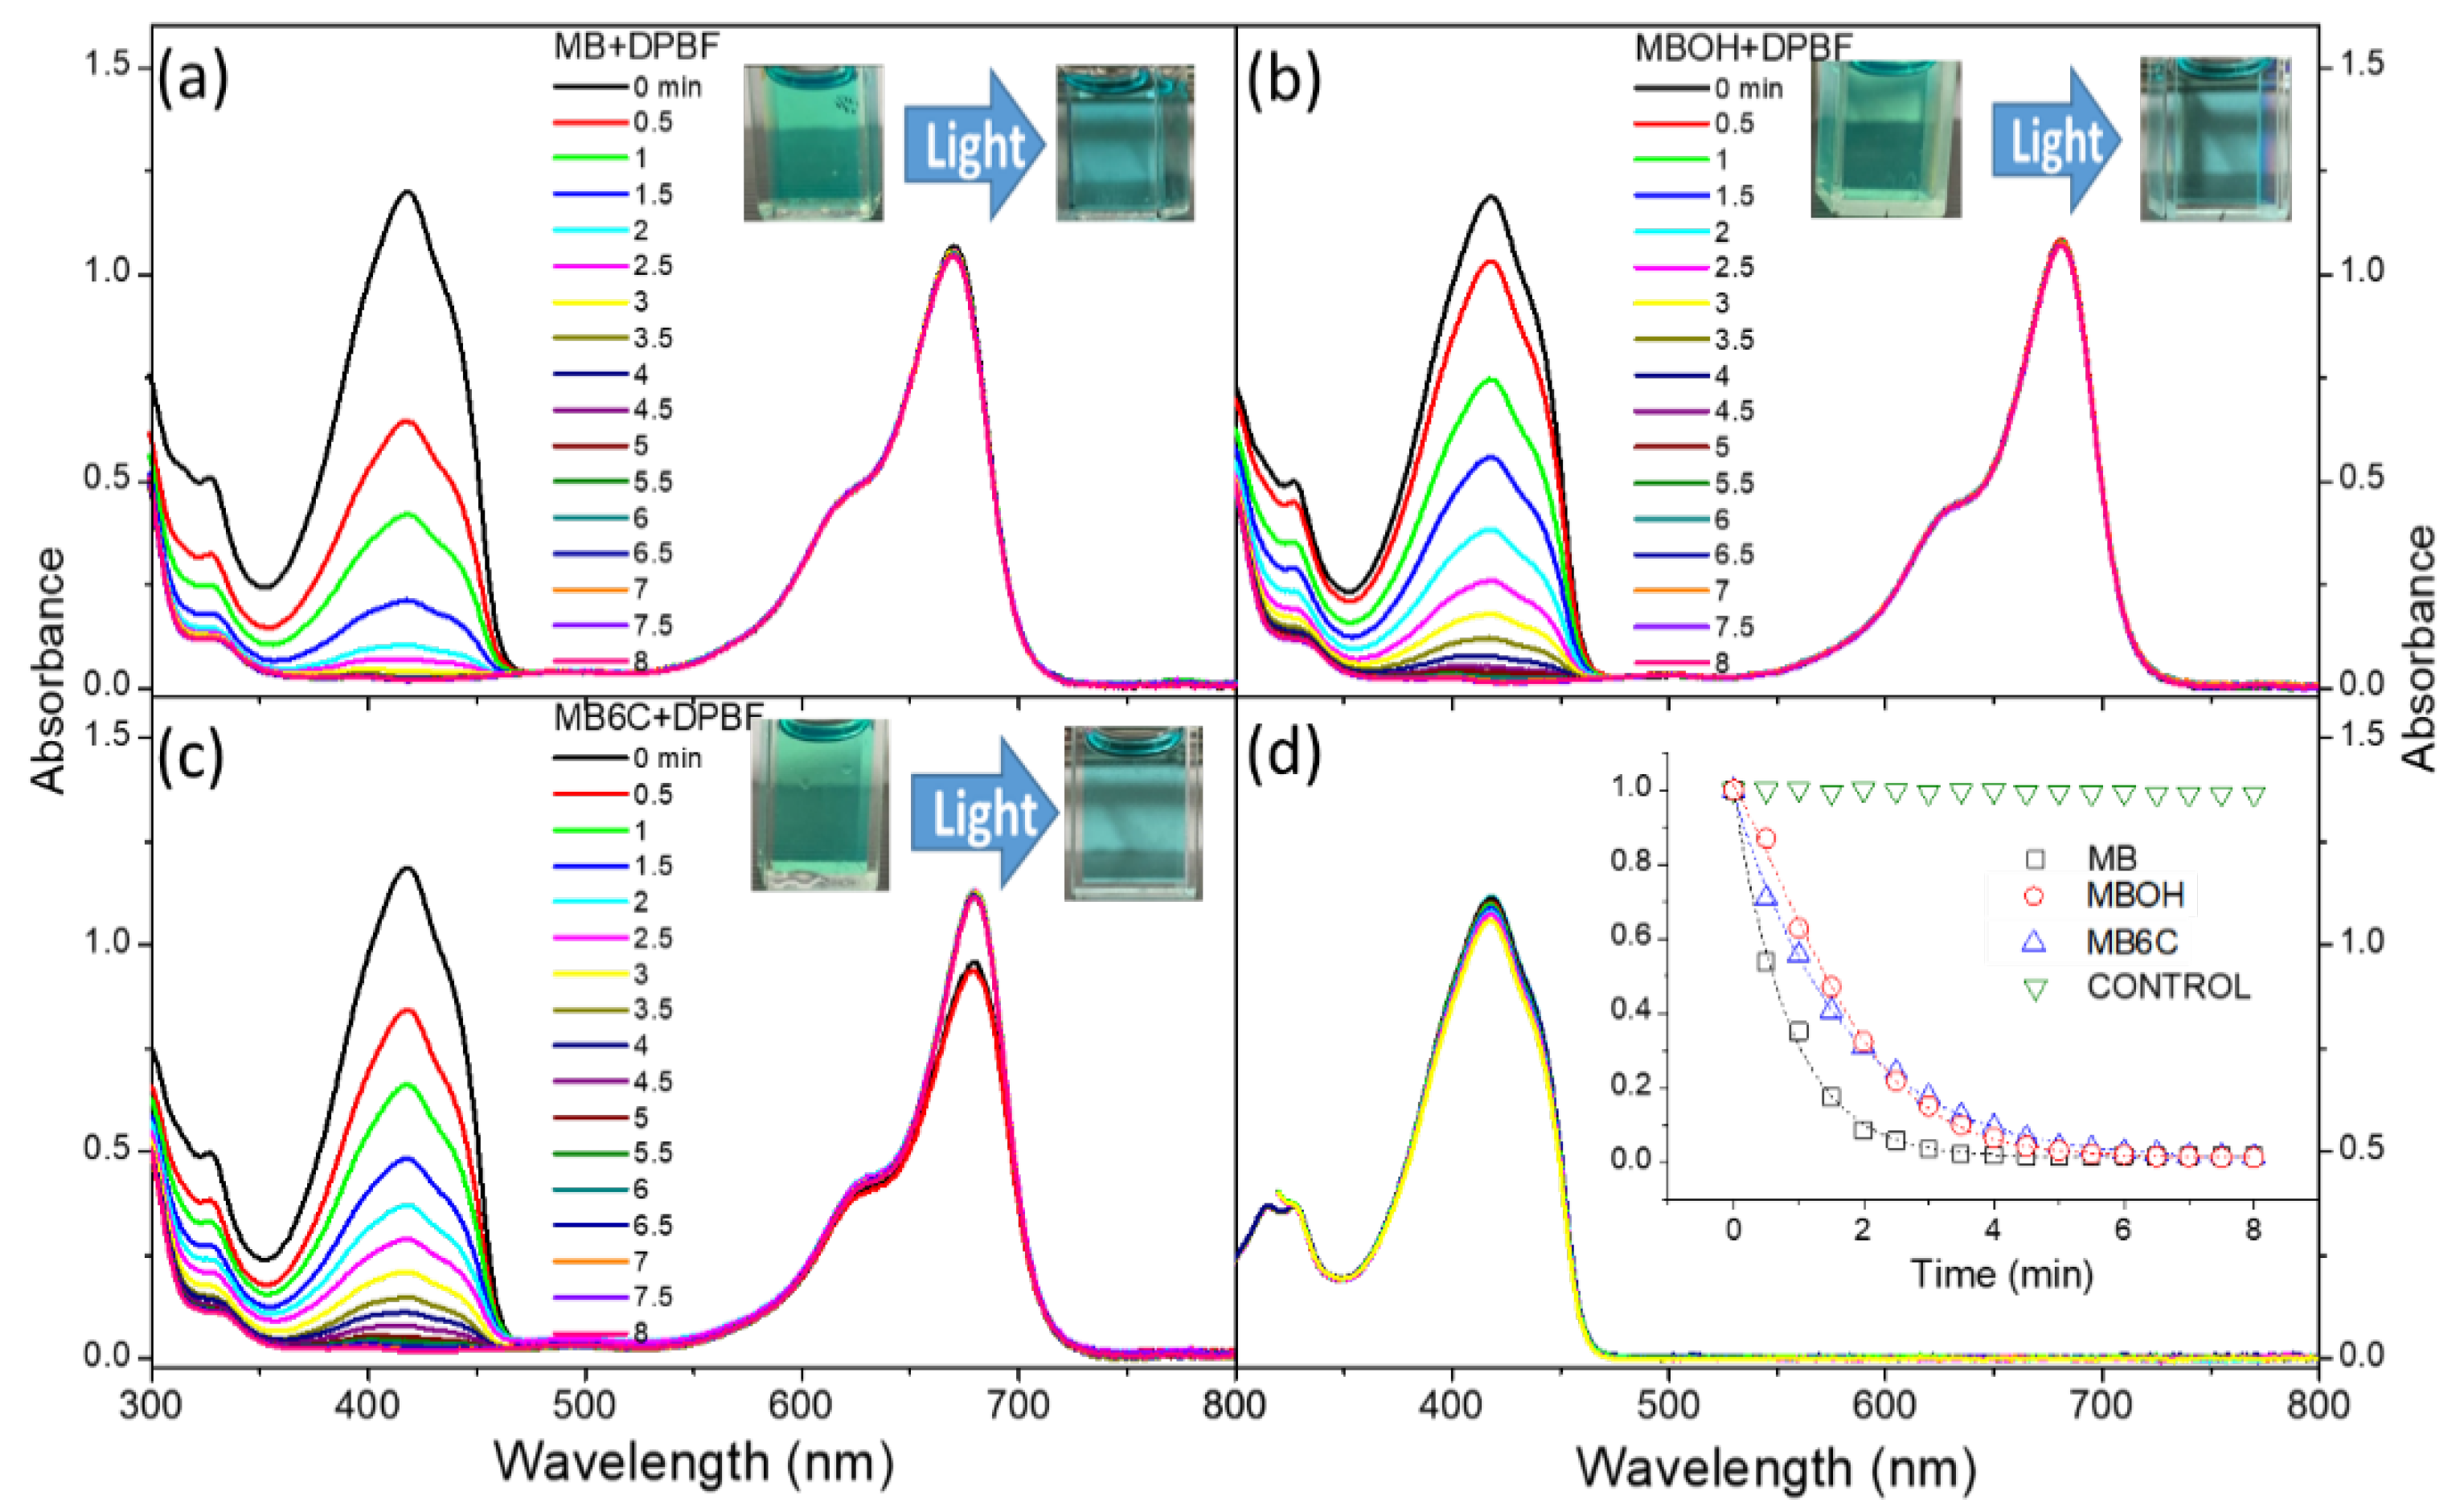
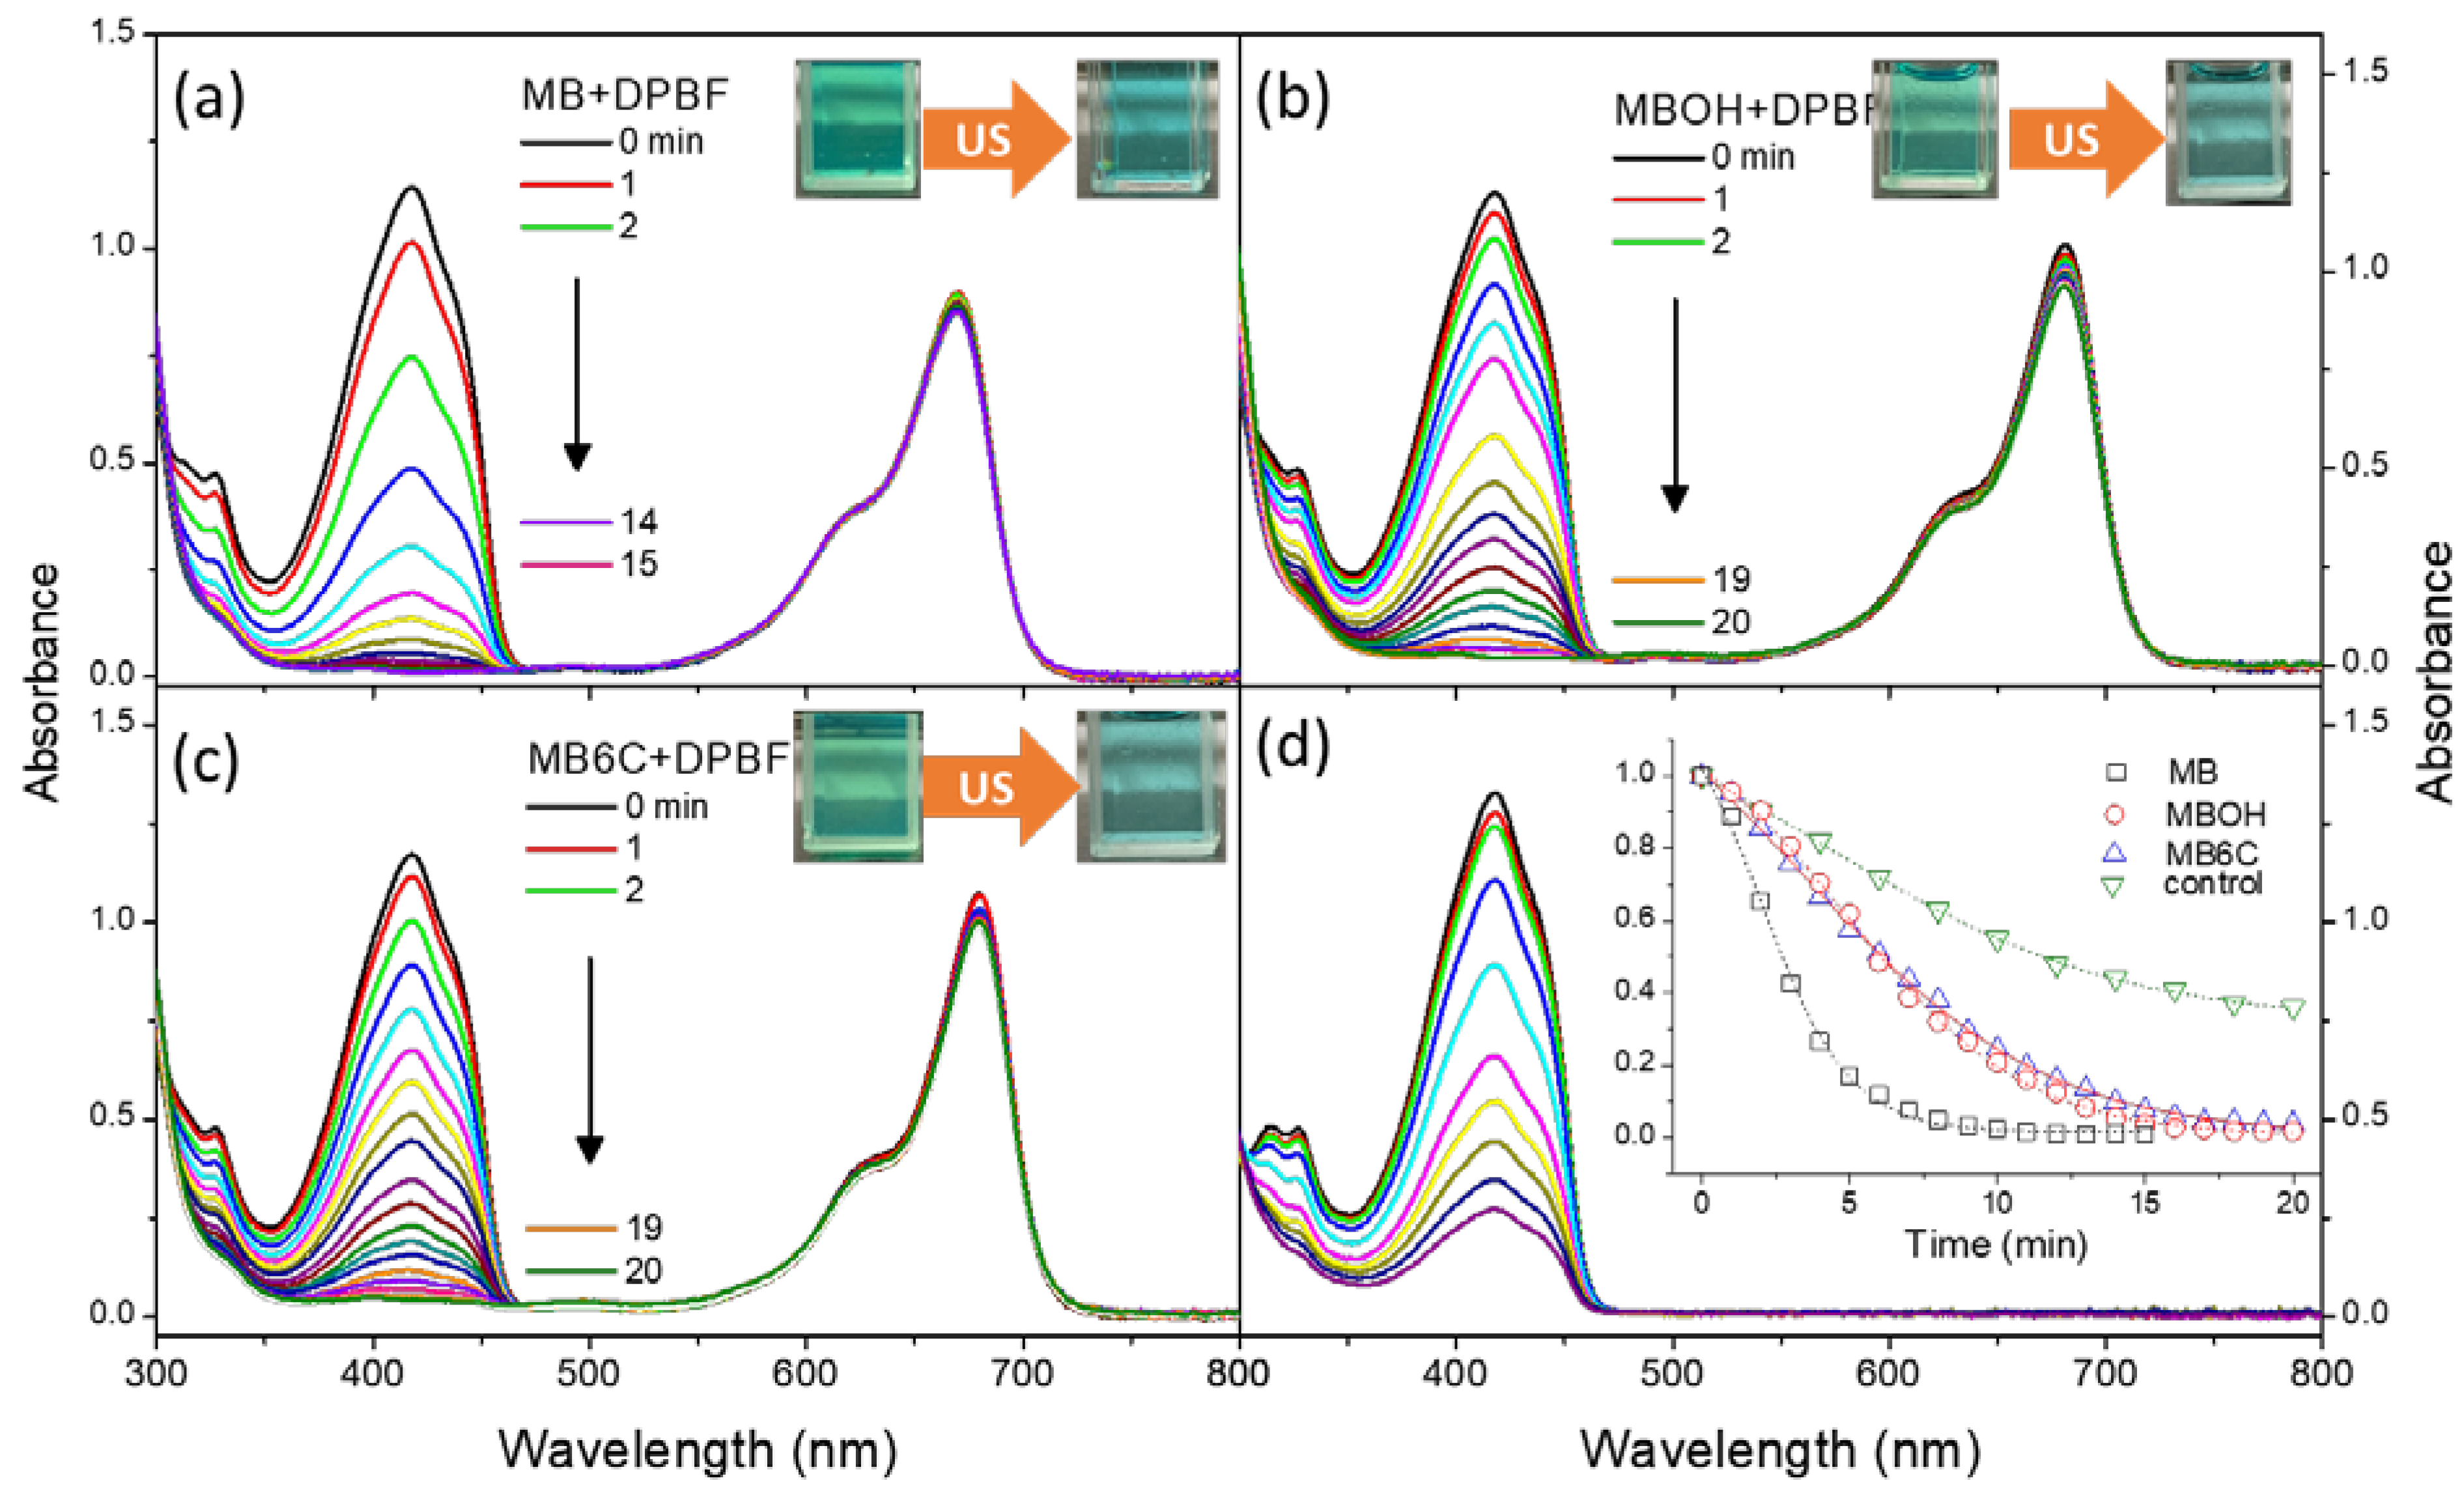
3.2. Generation and Stability of Singlet Oxygen

The singlet oxygen yields were checked by tracing the variation of the known singlet oxygen reactor 1,3-diphenylisobenzofuran (DPBF) with photo/sonosensitizer-generated singlet oxygen. The oxidative rates of DPBF by these compounds in DMSO solvent were investigated under light irradiation/ultrasonic waves. By following the disappearance of the 418 nm absorbance band of DPBF at the initial concentration of 50 μM in the presence of 15 μM of these compounds, it is shown that singlet oxygen generation occurs during the reaction. Methylene blue (MB) is a well-known type II ROS photosensitizer; here, we use MB as the singlet oxygen generation standard. Figure 4a–c shows the changes in the absorption spectra of DPBF in MB, MBOH, and MB6C after light (510 nm long pass, light power 15 mW/cm2 with variable irradiating times) illumination. All the absorption peaks of DPBF at 418 nm decrease with increasing irradiation time. Meanwhile, the control assay in Figure 4d with their decreasing behavior shows no degradation of the DPBF trap without the addition of the compound. These curves inserted in Figure 4d show that MB exhibits better singlet oxygen generation ability in DMSO solvent.
A similar trend is also found in the ultrasonicated singlet oxygen generation assay. Figure 5a–c shows that the absorption peaks of DPBF in phenothiazine derivative-containing DMSO solution decrease with increasing ultrasonic oscillating (using a 42 kHz/35-watt ultrasound source) processing time. It must be stated here that the DPBF will also be quenched when subjected to light irradiation. Thus, to avoid the absorption energy of DPBF, we used the light output of the 510 nm long pass as the light source in Figure 4. However, ultrasound cannot avoid this phenomenon. During the experiment, the entire dish was surrounded by ultrasonic energy in the tank, and the free DPBF was also affected (Figure 5d). There are other ways by which the ultrasound mechanism can generate ROS, and it is also possible to consume free DPBF without a photosensitizer (sonosensitizer). Although it was observed that US can also cause free DPBF to disintegrate in the blank experiment, we can judge that the three molecules indeed have the potential to be sonosensitizers, as shown in Figure 5d, and the rate of singlet oxygen generation by these phenothiazines is as follows: MB > MB6C > MBOH. Nevertheless, we conclude that both MB-OH and MB6C can successfully produce singlet oxygen under luminescence and US conditions.

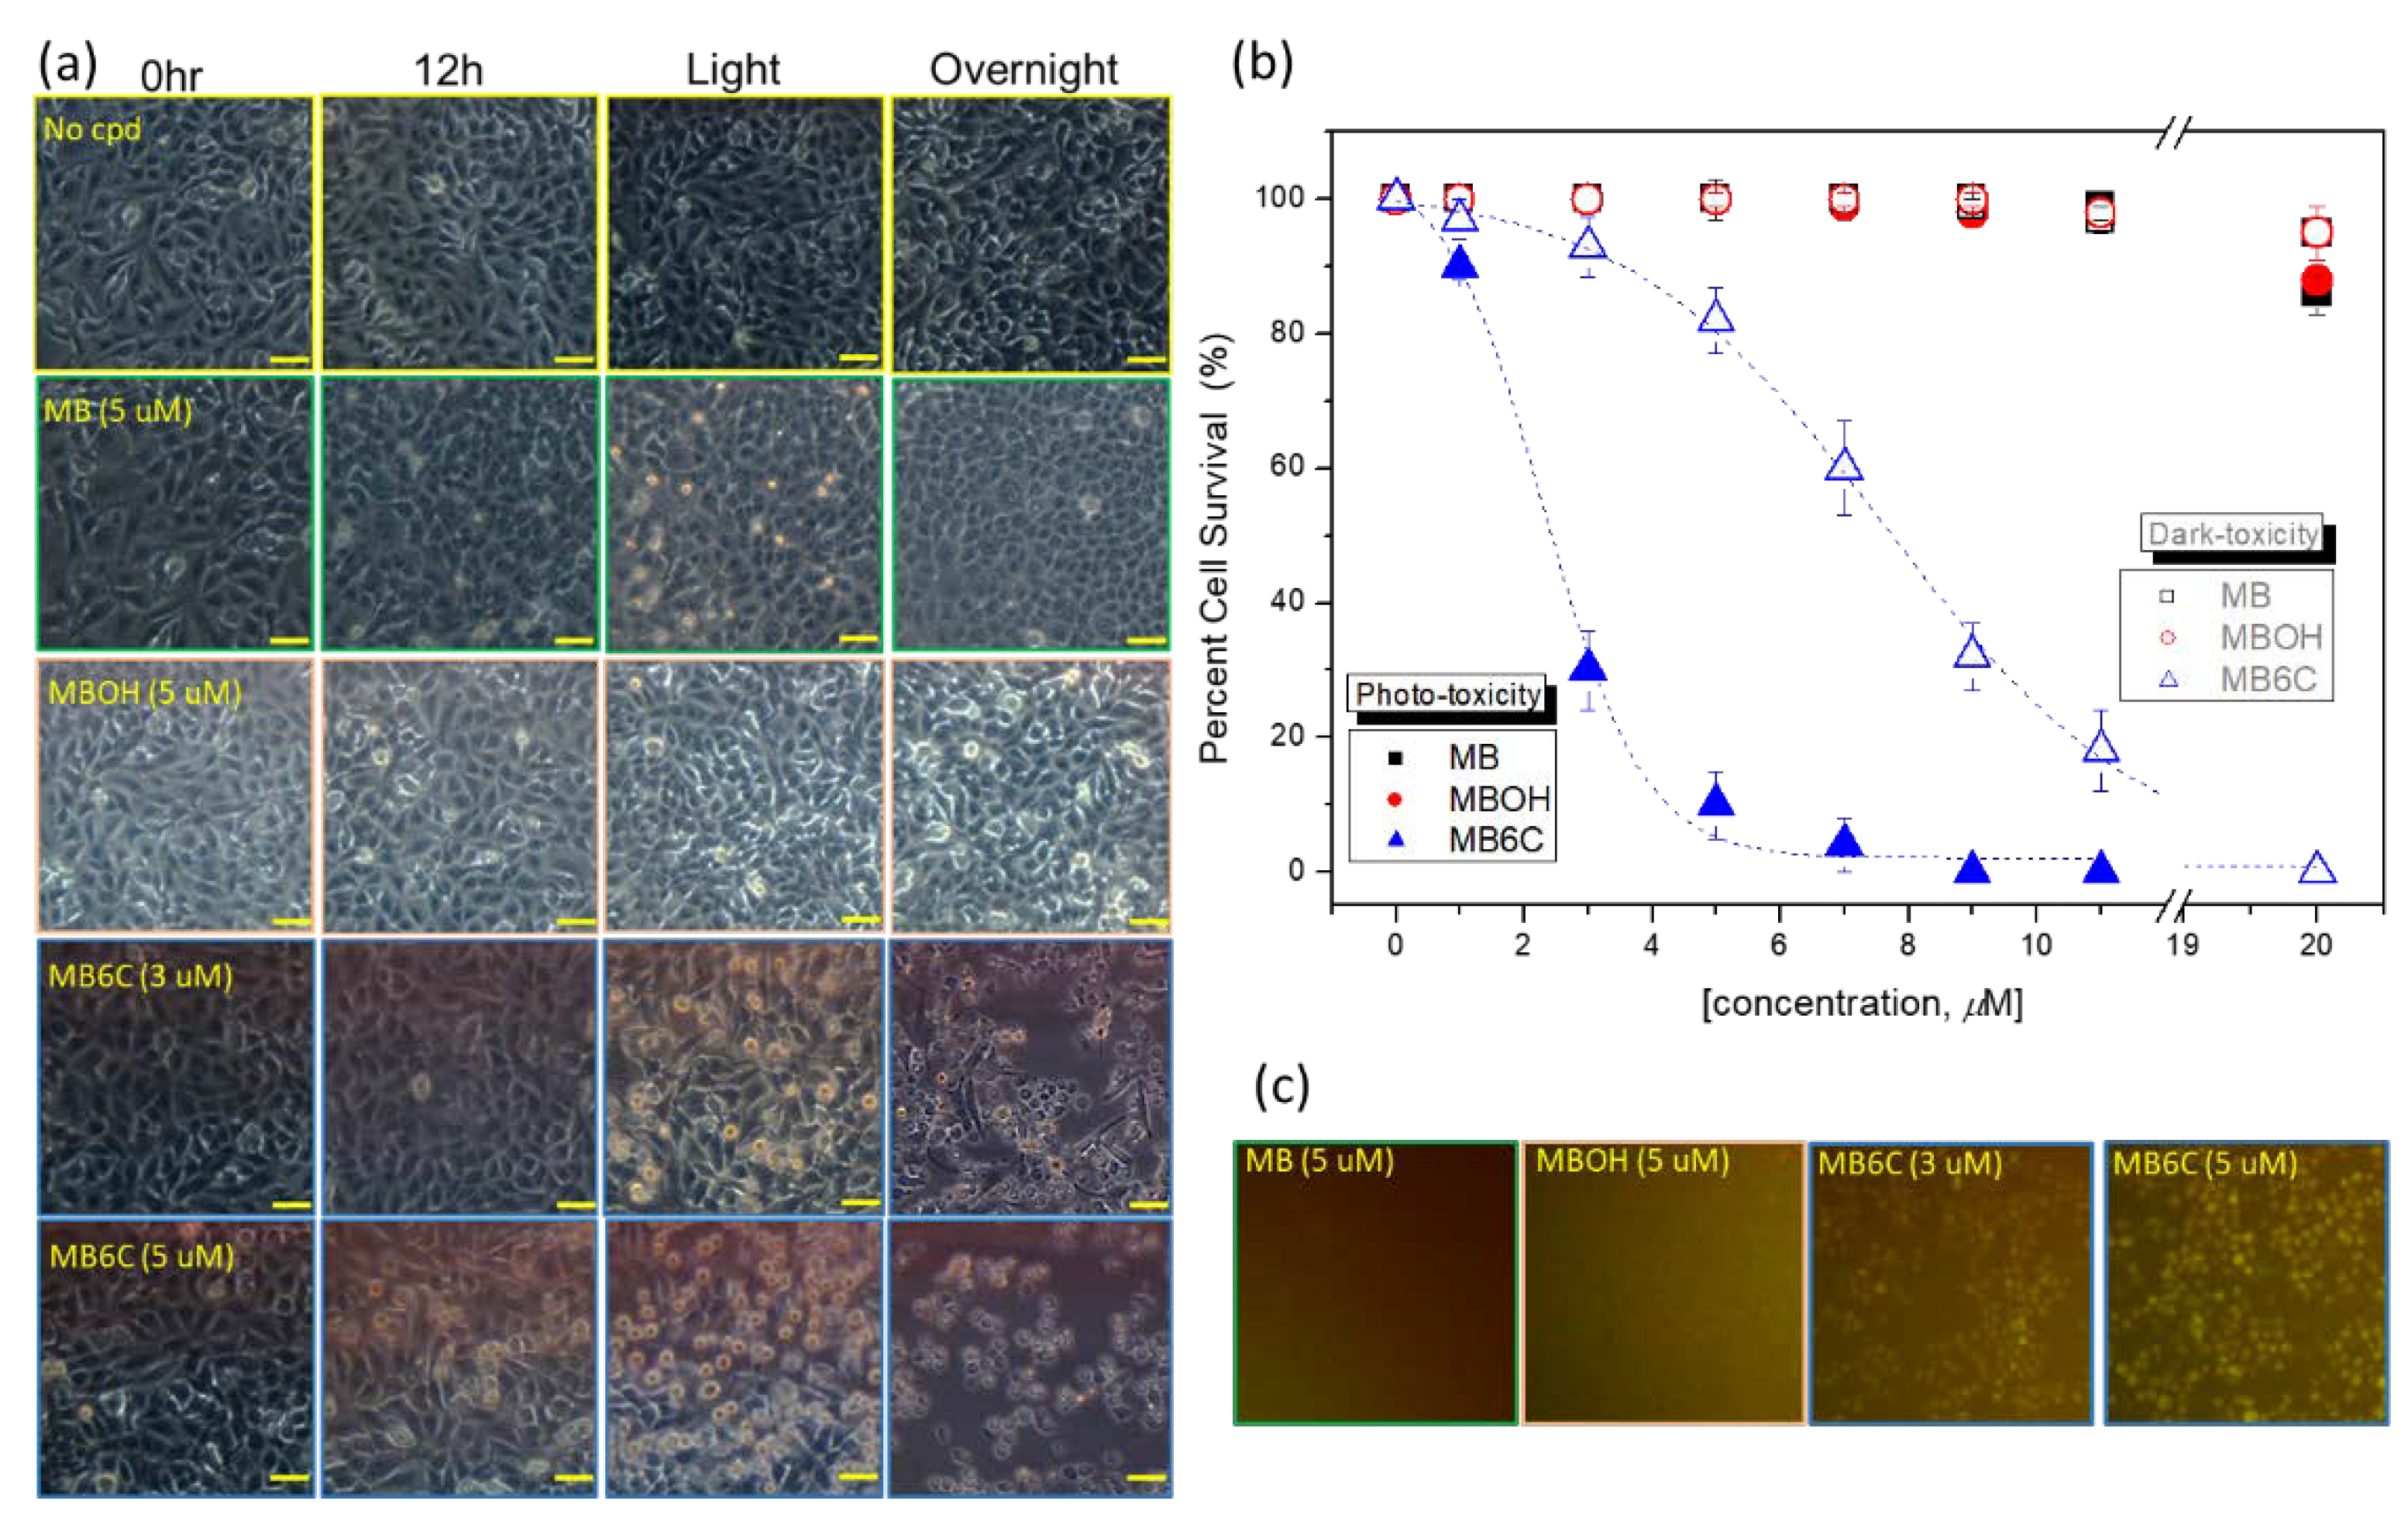
3.3. Cellular Toxicity

The combination of light illumination and photosensitizer resulted in cellular phototoxicity. Figure 6a presents the cell morphologies from A549 lung cancer cells incubated with or without phenothiazine derivatives before and after irradiation, and then cell death was estimated overnight. Figure 6b summarizes the concentration-dependent dark toxicity and phototoxicity cell viability plots. The A549 lung cancer cell lines display no determinable dark toxicity or phototoxicity with MB and MBOH up to a concentration of 20 μM. MB6C shows more efficient dark toxicity (with EC50 at ~7 μM) and phototoxicity (with EC50 at ~2.5 μM) than the others, although this compound offers a lower singlet oxygen quantum yield than MB. Figure 6a also shows that cells become highly condensed after ROS are triggered from MB6C, and the cell morphology clearly shows that in the 5 μM condition, the cells are slightly dark-toxic before irradiation. Increasing the chain length from methyl to n-hexyl results in an increase in intracellular toxicity. This means that there is no correlation between intracellular phototoxicity and ROS generation ability. We infer that the different cellular toxicities of these phenothiazine derivatives are most likely due to cellular uptake, as shown in Figure 6c. We tried to quantitively assess the compound accumulation in the cells and found that only MB6C presents clearer intracellular fluorescent image signals, even though the emissions of these molecules are all weak and similar, as shown in Figure 3. There is no doubt that MB shows no toxicity in our experimental concentration range because it is known to present low cellular toxicity EC50 values of 147 μM in dark toxicity and 54 μM in phototoxicity [42]. MBOH presents very low cellular dark toxicity and phototoxicity, which probably due to its low logP (higher hydrophilicity than MB), causing the low cellular uptake of the compound.
The above results suggest that MB6C is a potential reagent for studying intracellular photosensitization, the oxidative stress of PDT. Meanwhile, we expect that MB6C should exhibit more efficient SDT than MB and MBOH. Following to the incubation of the cells with MB6C for 24 h and the exposure to ultrasonication for 20 min and then culture overnight, Figure 7a shows that the cells exhibit different morphologies and become somewhat condensed. A further cell death occurs after repeating one cycle of ultrasonication and incubation (total: ultrasonicate then incubation overnight ×2). The EC50 values for SDT of MB6C are ~5 μM and ~1.5 μM for one and two cycles of ultrasonicated treatments, respectively. Herein, the ultrasound power must be adjusted to avoid damaging the cells without molecular incubation. There is no doubt that MB6C is a potential reagent for SDT. Table 1 shows the dark toxicity, phototoxicity, and sonotoxicity of the phenothiazines in A549 cells after 12 h of incubation.
As can be seen from the results in Figure 3 and Figure 4, increasing the alkyl chain length and altering the hydrophilicity of the NR2 did not change the singlet oxygen generate ability. On the other hand, the bio-assay result reveled that longer chain methylene blue MB6C showed improved intracellular phototoxicity with a higher uptake. These results are consistent with the literature [42]. Despite this, as can be seen from Figure 3c, we still need to be concerned about the intracellular aggregation problem of MB6C. Thus, as demonstrated in Figure S7, the concentration effect of these phenothiazine derivatives was checked and it was found that more hydrophilic MBOH seems to have no apparent aggregation, while MB showed more obvious aggregation (wavelength 610 nm) at high concentration. In contrast, based on specific absorption spectral shifts and patterns, accompanied with the almost complete quenching of emission, we inferred that MB6C was able to aggregate through a different mechanism, which could cause the inactivation of optical behaviors, such as emission and singlet oxygen generation. Furthermore, the SOSG assay in Figure S8 pointed out that the compound MB6C actually presented a weaker ability for singlet oxygen generation in aqueous solution.
The preceding discussion seems to indicate that MB6C is not suitable for applying PDT in water condition, let alone SDT. However, our bioassay results presented the positive responses. MB6C implemented intracellular fluorescence images, better cellular uptake, phototoxicity, and ultrasonic toxicity over MB and MBOH. These phenomena suggested that MB6C is unlikely to stay in a hydrophilic environment in the cells so that it could exhibit above optical behavior. Proposing the cell death mechanism for MB6C-induced SDT, Figure S9 shows the double stain result from Hoechst/PI and we observed, during the current period of SDT execution, apparent blue emission enhancement in the nucleus but no red fluorescence. It was inferenced that DNA condensed while the nuclear member is intact. The nucleus then dramatically presented red fluorescence enhancement from PI after the second ultrasonication proceeding. This is a symptom of the rupture of the nuclear membrane damage during a later period of sonication. That is, this cell death pathway is more or less related to pro/anti-proteins in mitochondrial [47], and this phenomenon seems to be consistent with the inferences above, in the early stage of cell death (staining with the two probes, immediately after ultrasonication).
We prepared and studied phenothiazine derivatives, the analogs of MB, and evaluated their ROS to improve phototoxicity and sonotoxicity against cancer cells in vitro. Compound MB6C is more efficient than other compounds with particular cellular toxicity. Based on our studies, spectral photo- and sonodynamic activity levels correlate with the cellular phenothiazine levels and subcellular behaviors of these photosensitizers or sonosensitizers. All these MB analogs are localized in the cytoplasm, with MB6C presenting the highest uptake. We infer that this is why MB6C exhibits better PDT and SDT. However, upon exposure to light, MB6C does not relocalize into the nucleus, as MB does [39]. This phenomenon also does not occur in ultrasonicated systems. Therefore, MB6C, a more hydrophobic MB analog, shows significantly improved PDT and SDT. In addition, this compound makes it possible to avoid the problems of PDT/SDT-induced photosensitizer/sonosensitizer relocation to the nuclear, which causes mutagenicity.

4. Conclusions

We synthesized two symmetrical phenothiazine derivatives, in which the methyl groups of methylene blue were substituted by hexyl and hydroxyethyl chains. Spectral studies indicate that the intrinsic photosensitizing ability was not altered. Here, the first conclusion is that these MB analogs exhibit a sonosensitizing ability with a similar tendency to photosensitizing ability. This means that MB, MBOH, and MB-6C can be potential photosensitizers and sonosensitizers. However, in terms of the in vitro phototoxicity and sonotoxicity after cell-assays, a more hydrophobic MB6C, implemented intracellular fluorescence images, better cellular uptake, phototoxicity, and ultrasonic toxicity over MB and MBOH can result in the improved PDT and SDT of methylene blue derivatives. Eventually, potential PDT and SDT candidate MB6C exhibits efficient intracellular phototoxicity and sonotoxicity with IC50 values of ~2.5 µM and ~5 µM, respectively. In addition, MB6C is excluded from the nucleus, thus reducing the mutagenic potential of PDT and SDT. Investigations utilizing animal testing are currently underway.

Supplementary Materials

The following supporting information can be downloaded at: www.mdpi.com/article/10.3390/app12157819/s1, Figure S1: H1 NMR spectrum of MBOH in DMSO-d6 solution (400 MHz). Figure S2: C13 NMR spectrum of MBOH in DMSO-d6 solution (400 MHz). Figure S3: H1 NMR spectrum of MB6C in DMSO-d6 solution (400 MHz). Figure S4: C13 NMR spectrum of MBOH in DMSO-d6 solution (400 MHz). Figure S5: Electrospray ionization mass spectra (ESI-MS) of MBOH (M/Z). Figure S6: Electrospray ionization mass spectra (ESI-MS) of MB6C (M/Z). Figure S7: Concentration effect absorption (a) and emission (b,c) spectra of compound MB (top), MBOH (middle) and MB6C (bottom). The emission spectra was collected by exciting dimer form (b) and monomer form (c), respectively. Figure S8: The emission spectra recorded for the Singlet Oxygen Sensor Green (SOSG) in the presence of three MB derivatives as a function of illumination time. Following the experimental condition in Section 2.6.1 of manuscript, and the excitation wavelength for the SOSG was 490 nm. The result also shows the singlet oxygen generation plots, and the rate of singlet oxygen generation by compounds is as follows: MB~ MBOH > MB6C. Figure S9: Following the experimental condition of Figure 7: (a) Before ultrasonication (no Hoechst or PI treatment). (b) Cells were treated with Hoechst and PI once after ultrasonication. (c) second cycle of ultrasonication and then overnight. The images of Hoechst-stained cells were collected by exciting with a blue light which was guided through a 370 ± 10 nm bp filter, and the emission wavelength rang was collected through a 450 nm lp filter (A cube). The images of PI-stained cells were excited by a green light which was guided through a 530 ± 20 nm bp filter, and the emission wavelength rang was collected through a 590 nm lp filter (N cube). Under this light intensity condition, the red emission was from PI, not MB6C.

Author Contributions

Conceptualization, C.-C.C. and T.-P.H.; Data curation, C.-F.H. and H.-J.W.; Formal analysis, C.-F.H. and M.A.; Funding acquisition, T.-P.H.; Investigation, H.-J.W. and M.A.; Methodology, H.-J.W.; Writing—original draft, C.-C.C.; Writing—review & editing, T.-P.H. All authors have read and agreed to the published version of the manuscript.

Funding

This research was funded by the Ministry of Science and Technology (MOST 110-2113-M-005-022 -) and (MOST 110-2634-F-005-006 -) of Taiwan.

Institutional Review Board Statement

Not applicable.

Informed Consent Statement

Not applicable.

Data Availability Statement

Data sharing is not applicable to this article.

Conflicts of Interest

The authors declare no conflict of interest.

References

  1. Siegel, R.L.; Miller, K.D.; Jemal, A. Cancer statistics, 2019. CA Cancer J. Clin. 2019, 69, 7–34. [Google Scholar] [CrossRef] [PubMed] [Green Version]
  2. Meng, Z.; Zhou, X.; Xu, J.; Han, X.; Dong, Z.; Wang, H.; Zhang, Y.; She, J.; Xu, L.; Wang, C.; et al. Light-Triggered In Situ Gelation to Enable Robust Photodynamic-Immunotherapy by Repeated Stimulations. Adv. Mater. 2019, 31, e1900927. [Google Scholar] [CrossRef] [PubMed]
  3. Song, W.; Kuang, J.; Li, C.-X.; Zhang, M.; Zheng, D.; Zeng, X.; Liu, C.; Zhang, X.-Z. Enhanced Immunotherapy Based on Photodynamic Therapy for Both Primary and Lung Metastasis Tumor Eradication. ACS Nano 2018, 12, 1978–1989. [Google Scholar] [CrossRef] [PubMed]
  4. Hu, D.; Sheng, Z.; Gao, G.; Siu, F.; Liu, C.; Wan, Q.; Gong, P.; Zheng, H.; Ma, Y.; Cai, L. Activatable albumin-photosensitizer nanoassemblies for triple-modal imaging and thermal-modulated photodynamic therapy of cancer. Biomaterials 2016, 93, 10–19. [Google Scholar] [CrossRef]
  5. Qian, X.; Zheng, Y.; Chen, Y. Micro/Nanoparticle-Augmented Sonodynamic Therapy (SDT): Breaking the Depth Shallow of Photoactivation. Adv. Mater. 2016, 28, 8097–8129. [Google Scholar] [CrossRef]
  6. Tsolekile, N.; Nelana, S.; Oluwafemi, O.S. Porphyrin as Diagnostic and Therapeutic Agent. Molecules 2019, 24, 2669. [Google Scholar] [CrossRef] [Green Version]
  7. Lebedeva, N.S.; Gubarev, Y.A.; Koifman, M.O.; Koifman, O.I. The Application of Porphyrins and Their Analogues for Inactivation of Viruses. Molecules 2020, 25, 4368. [Google Scholar] [CrossRef]
  8. Malatesti, N.; Munitic, I.; Jurak, I. Porphyrin-based cationic amphiphilic photosensitisers as potential anticancer, antimicrobial and immunosuppressive agents. Biophys. Rev. 2017, 9, 149–168. [Google Scholar] [CrossRef] [Green Version]
  9. Yumita, N.; Nishigaki, R.; Umemura, K.; Umemura, S.-I. Hematoporphyrin as a Sensitizer of Cell-damaging Effect of Ultrasound. Jpn. J. Cancer Res. 1989, 80, 219–222. [Google Scholar] [CrossRef]
  10. Gao, F.; He, G.; Yin, H.; Chen, J.; Liu, Y.; Lan, C.; Zhang, S.; Yang, B. Titania-coated 2D gold nanoplates as nanoagents for synergistic photothermal/sonodynamic therapy in the second near-infrared window. Nanoscale 2019, 11, 2374–2384. [Google Scholar] [CrossRef]
  11. Yang, B.; Chen, Y.; Shi, J. Reactive Oxygen Species (ROS)-Based Nanomedicine. Chem. Rev. 2019, 119, 4881–4985. [Google Scholar] [CrossRef] [PubMed]
  12. Deepagan, V.G.; You, D.G.; Um, W.; Ko, H.; Kwon, S.; Choi, K.Y.; Yi, G.-R.; Lee, J.Y.; Lee, D.S.; Kim, K.; et al. Long-Circulating Au-TiO2 Nanocomposite as a Sonosensitizer for ROS-Mediated Eradication of Cancer. Nano Lett. 2016, 16, 6257–6264. [Google Scholar] [CrossRef] [PubMed]
  13. Pan, X.; Bai, L.; Wang, H.; Wu, Q.; Wang, H.; Liu, S.; Xu, B.; Shi, X.; Liu, H. Metal-Organic-Framework-Derived Carbon Nanostructure Augmented Sonodynamic Cancer Therapy. Adv. Mater. 2018, 30, e1800180. [Google Scholar] [CrossRef] [PubMed]
  14. Miyoshi, N.; Igarashi, T.; Riesz, P. Evidence against singlet oxygen formation by sonolysis of aqueous oxygen-saturated solutions of Hematoporphyrin and Rose Bengal: The mechanism of sonodynamic therapy. Ultrason. Sonochem. 2000, 7, 121–124. [Google Scholar] [CrossRef]
  15. Yumita, N.; Iwase, Y.; Nishi, K.; Komatsu, H.; Takeda, K.; Onodera, K.; Fukai, T.; Ikeda, T.; Umemura, S.-I.; Okudaira, K.; et al. Involvement of Reactive Oxygen Species in Sonodynamically Induced Apoptosis Using a Novel Porphyrin Derivative. Theranostics 2012, 2, 880–888. [Google Scholar] [CrossRef] [PubMed]
  16. Yumita, N.; Okuyama, N.; Sasaki, K.; Umemura, S.-I. Sonodynamic therapy on chemically induced mammary tumor: Pharmacokinetics, tissue distribution and sonodynamically induced antitumor effect of gallium–porphyrin complex ATX-70. Cancer Chemother. Pharmacol. 2007, 60, 891–897. [Google Scholar] [CrossRef]
  17. Chen, H.; Zhou, X.; Gao, Y.; Zheng, B.; Tang, F.; Huang, J. Recent progress in development of new sonosensitizers for sonodynamic cancer therapy. Drug Discov. Today 2014, 19, 502–509. [Google Scholar] [CrossRef]
  18. Hiraoka, W.; Honda, H.; Feril, L.B.; Kudo, N.; Kondo, T. Comparison between sonodynamic effect and photodynamic effect with photosensitizers on free radical formation and cell killing. Ultrason. Sonochem. 2006, 13, 535–542. [Google Scholar] [CrossRef]
  19. Li, C.; Zhang, K.; Wang, P.; Hu, J.; Liu, Q.; Wang, X. Sonodynamic antitumor effect of a novel sonosensitizer on S180 solid tumor. Biopharm. Drug Dispos. 2014, 35, 50–59. [Google Scholar] [CrossRef]
  20. McEwan, C.; Owen, J.; Stride, E.; Fowley, C.; Nesbitt, H.; Cochrane, D.; Coussios, C.; Borden, M.; Nomikou, N.; McHale, A.P.; et al. Oxygen carrying microbubbles for enhanced sonodynamic therapy of hypoxic tumours. J. Control. Release 2015, 203, 51–56. [Google Scholar] [CrossRef]
  21. Costley, D.; Nesbitt, H.; Ternan, N.; Dooley, J.; Huang, Y.; Hamblin, M.R.; McHale, A.P.; Callan, J.F. Sonodynamic inactivation of Gram-positive and Gram-negative bacteria using a Rose Bengal–antimicrobial peptide conjugate. Int. J. Antimicrob. Agents 2017, 49, 31–36. [Google Scholar] [CrossRef] [PubMed] [Green Version]
  22. Zheng, X.; Liu, W.; Ge, J.; Jia, Q.; Nan, F.; Ding, Y.; Wu, J.; Zhang, W.; Lee, C.-S.; Wang, P. Biodegradable Natural Product-Based Nanoparticles for Near-Infrared Fluorescence Imaging-Guided Sonodynamic Therapy. ACS Appl. Mater. Interfaces 2019, 11, 18178–18185. [Google Scholar] [CrossRef] [PubMed]
  23. Liu, Y.; Bai, H.; Wang, H.; Wang, X.; Liu, Q.; Zhang, K.; Wang, P. Comparison of hypocrellin B-mediated sonodynamic responsiveness between sensitive and multidrug-resistant human gastric cancer cell lines. J. Med. Ultrason. 2019, 46, 15–26. [Google Scholar] [CrossRef]
  24. Chen, J.; Luo, H.; Liu, Y.; Zhang, W.; Li, H.; Luo, T.; Zhang, K.; Zhao, Y.; Liu, J. Oxygen-Self-Produced Nanoplatform for Relieving Hypoxia and Breaking Resistance to Sonodynamic Treatment of Pancreatic Cancer. ACS Nano 2017, 11, 12849–12862. [Google Scholar] [CrossRef]
  25. Zhang, L.; Yi, H.; Song, J.; Huang, J.; Yang, K.; Tan, B.; Wang, D.; Yang, N.; Wang, Z.-G.; Li, X. Mitochondria-Targeted and Ultrasound-Activated Nanodroplets for Enhanced Deep-Penetration Sonodynamic Cancer Therapy. ACS Appl. Mater. Interfaces 2019, 11, 9355–9366. [Google Scholar] [CrossRef]
  26. Wan, G.-Y.; Liu, Y.; Chen, B.-W.; Liu, Y.-Y.; Wang, Y.; Zhang, N. Recent advances of sonodynamic therapy in cancer treatment. Cancer Biol. Med. 2016, 13, 325–338. [Google Scholar] [CrossRef] [Green Version]
  27. Nomikou, N.; Sterrett, C.; Arthur, C.; McCaughan, B.; Callan, J.F.; McHale, A.P. The Effects of Ultrasound and Light on Indocyanine-Green-Treated Tumour Cells and Tissues. ChemMedChem 2012, 7, 1465–1471. [Google Scholar] [CrossRef]
  28. Zheng, L.; Sun, X.; Zhu, X.; Lv, F.; Zhong, Z.; Zhang, F.; Guo, W.; Cao, W.; Yang, L.; Tian, Y. Apoptosis of THP-1 Derived Macrophages Induced by Sonodynamic Therapy Using a New Sonosensitizer Hydroxyl Acetylated Curcumin. PLoS ONE 2014, 9, e93133. [Google Scholar] [CrossRef] [PubMed]
  29. Wang, X.; Ip, M.; Leung, A.W.; Yang, Z.; Wang, P.; Zhang, B.-T.; Ip, S.-P.; Xu, C. Sonodynamic action of curcumin on foodborne bacteria Bacillus cereus and Escherichia coli. Ultrasonics 2015, 62, 75–79. [Google Scholar] [CrossRef] [PubMed]
  30. Tian, Y.; Cheng, J.; Sun, X.; Guo, S.; Cao, W.; Chen, H.; Jin, Y.; Li, B.; Wang, H.; Zhou, Q.; et al. Effects of 5-aminolevulinic acid-mediated sonodynamic therapy on macrophages. Int. J. Nanomed. 2013, 8, 669–676. [Google Scholar] [CrossRef] [PubMed] [Green Version]
  31. Chen, H.; Gao, W.; Yang, Y.; Guo, S.; Wang, H.; Wang, W.; Zhang, S.; Zhou, Q.; Xu, H.; Yao, J.; et al. Inhibition of VDAC1 prevents Ca2+-mediated oxidative stress and apoptosis induced by 5-aminolevulinic acid mediated sonodynamic therapy in THP-1 macrophages. Apoptosis 2014, 19, 1712–1726. [Google Scholar] [CrossRef] [PubMed]
  32. Teranishi, R.; Matsuda, T.; Yuba, E.; Kono, K.; Harada, A. Sonodynamic Therapeutic Effects of Sonosensitizers with Different Intracellular Distribution Delivered by Hollow Nanocapsules Exhibiting Cytosol Specific Release. Macromol. Biosci. 2019, 19, e1800365. [Google Scholar] [CrossRef] [PubMed]
  33. Liang, S.; Deng, X.; Xu, G.; Xiao, X.; Wang, M.; Guo, X.; Ma, P.; Cheng, Z.; Zhang, D.; Lin, J. A Novel Pt–TiO2 Heterostructure with Oxygen-Deficient Layer as Bilaterally Enhanced Sonosensitizer for Synergistic Chemo-Sonodynamic Cancer Therapy. Adv. Funct. Mater. 2020, 30, 1908598. [Google Scholar] [CrossRef]
  34. Aghahosseini, F.; Arbabi-Kalati, F.; Fashtami, L.A.; Djavid, G.E.; Fateh, M.; Beitollahi, J.M. Methylene blue-mediated photodynamic therapy: A possible alternative treatment for oral lichen planus. Lasers Surg. Med. 2006, 38, 33–38. [Google Scholar] [CrossRef] [PubMed]
  35. Orth, K.; Beck, G.; Genze, F.; Rück, A. Methylene blue mediated photodynamic therapy in experimental colorectal tumors in mice. J. Photochem. Photobiol. B 2000, 57, 186–192. [Google Scholar] [CrossRef]
  36. Wainwright, M.; Crossley, K. Methylene Blue—A Therapeutic Dye for All Seasons? J. Chemother. 2002, 14, 431–443. [Google Scholar] [CrossRef]
  37. Schirmer, R.H.; Coulibaly, B.; Stich, A.; Scheiwein, M.; Merkle, H.; Eubel, J.; Becker, K.; Becher, H.; Müller, O.; Zich, T.; et al. Methylene blue as an antimalarial agent. Redox Rep. 2003, 8, 272–275. [Google Scholar] [CrossRef] [PubMed] [Green Version]
  38. Komori, C.; Okada, K.; Kawamura, K.; Chida, S.; Suzuki, T. The sonodynamic antitumor effect of methylene blue on sarcoma180 cells in vitro. Anticancer Res. 2009, 29, 2411–2415. [Google Scholar] [PubMed]
  39. Xiang, J.; Xia, X.; Jiang, Y.; Leung, A.W.; Wang, X.; Xu, J.; Wang, P.; Yu, H.; Bai, D.; Xu, C. Apoptosis of ovarian cancer cells induced by methylene blue-mediated sonodynamic action. Ultrasonics 2011, 51, 390–395. [Google Scholar] [CrossRef] [PubMed]
  40. Xiang, J.; Leung, A.W.; Xu, C. Effect of Ultrasound Sonication on Clonogenic Survival and Mitochondria of Ovarian Cancer Cells in the Presence of Methylene Blue. J. Ultrasound Med. 2014, 33, 1755–1761. [Google Scholar] [CrossRef]
  41. Delport, A.; Harvey, B.H.; Petzer, A.; Petzer, J.P. Methylene Blue Analogues with Marginal Monoamine Oxidase Inhibition Retain Antidepressant-like Activity. ACS Chem. Neurosci. 2018, 9, 2917–2928. [Google Scholar] [CrossRef] [PubMed]
  42. Mellish, K.J.; Cox, R.D.; Vernon, D.I.; Griffiths, J.; Brown, S.B. In Vitro Photodynamic Activity of a Series of Methylene Blue Analogues. Photochem. Photobiol. 2002, 75, 392–397. [Google Scholar] [CrossRef]
  43. De Crozals, G.; Farre, C.; Sigaud, M.; Fortgang, P.; Sanglar, C.; Chaix, C. Methylene blue phosphoramidite for DNA labelling. Chem. Commun. 2015, 51, 4458–4461. [Google Scholar] [CrossRef] [PubMed]
  44. Gollnick, K.; Griesbeck, A. Singlet oxygen photooxygenation of furans: Isolation and reactions of (4 + 2)-cycloaddition products. Tetrahedron 1985, 41, 2057–2068. [Google Scholar] [CrossRef]
  45. Cao, H.; Li, C.; Qi, W.; Meng, X.; Tian, R.; Qi, Y.; Yang, W.; Li, J. Synthesis, cytotoxicity and antitumour mechanism investigations of polyoxometalate doped silica nanospheres on breast cancer MCF-7 cells. PLoS ONE 2017, 12, e0181018. [Google Scholar] [CrossRef] [PubMed] [Green Version]
  46. Prasad, R.; Koch, B. In vitro Anticancer Activities of Ethanolic Extracts of Dendrobium crepidatum and Dendrobium chrysanthum against T-cell lymphoma. J. Cytol. Histol. 2016, 7, 432. [Google Scholar] [CrossRef] [Green Version]
  47. Lai, Y.-C.; Su, S.-Y.; Chang, C.-C. Special Reactive Oxygen Species Generation by a Highly Photostable BODIPY-Based Photosensitizer for Selective Photodynamic Therapy. ACS Appl. Mater. Interfaces 2013, 5, 12935–12943. [Google Scholar] [CrossRef] [PubMed]
Scheme 1. Synthetic steps and conditions of these phenothiazine derivatives.
Applsci 12 07819 sch001
Figure 1. Schematic diagram of light source conditions. The proprietary mirror module (400~700 nm) with only the desired wavelength range (white light) from the xenon light source (a). The system could also emit 510~700 nm by the bandpass 510 nm filter (b). The 15 mW/cm2 light power was output to the dish surface (c).
Applsci 12 07819 g001
Figure 2. Schematic diagram of ultrasonic instruments used for different purposes in this experiment. (A) ROS experiment; (B) Cell experiment.
Applsci 12 07819 g002
Figure 3. Absorption (left) and emission (right) spectra of 15 μM concentrations of the compounds MB (a), MBOH (b), and MB6C (c) in different solvents. Excitation wavelength emission spectra are depicted as absorption maxima. The partition ratios diagram of octanol/buffer solutions (d) and the comparison of the NMR chemical shifts (aromatic region) for these three molecules (e).
Applsci 12 07819 g003
Figure 4. Absorption spectra variations of DPBF mix (a) MB, (b) MBOH, and (c) MB6C in DMSO under an irradiation environment, as described in the experimental section. The control experiment without adding a compound is shown in (d), and the insert shows the comparison of DPBF oxidation rates by singlet oxygens of the above experimental results.
Applsci 12 07819 g004
Figure 5. Absorption spectra variations of DPBF mixing (a) MB, (b) MBOH, and (c) MB6C in DMSO under an ultrasound environment. The control experiment without adding a compound is shown in (d), and the insert shows the comparison of DPBF oxidation rates by the singlet oxygens of the above experimental results.
Applsci 12 07819 g005
Figure 6. (a) Several extracted bright-field photodamage photographs from A549 lung cancer cells incubated with or without phenothiazine derivatives, 5 μM MB, MBOH, and MB6C and 3 μM of MB6C, for 12 h in order to check the dark toxicity. Then cells were irradiated with an average 18 J·cm−2 of light source (510 nm lp) for 20 min and cell deaths were estimated after a further 12 h. (b) Dark toxicity and phototoxicity cell viability plots of A549 cells treated with variable concentrations of phenothiazine derivatives, as in the experiment in (a). Each datapoint is the average from three separate experiments. (c) Fluorescent photodamage images extracted from experiment (a) to check the cellular uptake for every compound in (a).
Applsci 12 07819 g006
Figure 7. (a) Bright-field sonodamage images from A549 lung cancer cells incubated with or without phenothiazine derivatives, 5 μM MB, MBOH, and MB6C and 3 μM MB6C, for 12 h and then ultrasonicated for 20 min (conditions are as described in the experimental section, scale bar: 50 μm). (b) Cell sonotoxicity plots of A549 cells treated with variable concentrations of phenothiazine derivatives, as in experiment (a) but ultrasonicated twice; each datapoint is the average of three individual experiments.
Applsci 12 07819 g007
Table 1. LogP (octanol: buffer partition coefficients) values, dark-, photo- and sonotoxicities of the phenothiazine derivatives after 12 h incubation in A549 cancer cells.
LogPToxicity (IC50, μM)
Dark-Photo-Sono- *
MB−0.1>20>20>20
MBOH−0.54>20>20>20
MB6C+1.3~7~2.55 (×1), 1.5 (×2)
* The EC50 values for SDT of MB6C is ~5 μM and ~1.5 μM for one and two cycles of US treatments, respectively.
Publisher’s Note: MDPI stays neutral with regard to jurisdictional claims in published maps and institutional affiliations.

