Article

Wavefront Aberration Measurement Deflectometry for Imaging Lens Tests

1
College of Electronics & Information Engineering, Sichuan University, Chengdu 610065, China
2
School of Aeronautics & Astronautics, Sichuan University, Chengdu 610065, China
3
Research Center of Laser Fusion, China Academy of Engineering Physics, Mianyang 621900, China
*
Author to whom correspondence should be addressed.
Appl. Sci. 2022, 12(15), 7857; https://doi.org/10.3390/app12157857
Submission received: 22 June 2022 / Revised: 1 August 2022 / Accepted: 3 August 2022 / Published: 4 August 2022
(This article belongs to the Section Optics and Lasers)

Abstract

:
Lenses play an important role in imaging systems. Having an effective way to test the aberrations of imaging lenses is important. However, the existing methods cannot satisfy the requirements in some conditions. To overcome these difficulties, wavefront aberration measurement deflectometry (WAMD) is proposed in this paper, which can reconstruct the wavefront aberrations of imaging lenses by measuring the angular aberrations. The principle of WAMD is analyzed in detail, and the correctness and feasibility of the proposed method are verified by both a simulation and an experiment. A telephoto lens and a single imaging lens were tested in an experiment, and the RMS errors were 166.8 nm (5.71%) and 58.9 nm (4.74%), respectively, as compared with the interferometer’s results. This method is widely applicable with relatively reasonable accuracy. It has potential to be applied in the lens manufacturing and alignment process.

1. Introduction

Lenses play an important role in imaging systems. The performance of an imaging lens is affected by its aberration, which is introduced by both the manufacturing tolerance of the lenses and lens alignment. Therefore, a feasible method for measuring the wavefront aberrations of imaging lenses is important. A few methods have been proposed to test the aberrations of imaging lenses. The existing methods mainly include the Foucault knife-edge test, the Ronchi test, the star test, the interferometry test, and the Hartmann–Shack test, etc. The Foucault knife-edge test uses a knife edge to block out one part of the rays and analyzes the shadow that appears over the aberrated region. Although some algorithms have been proposed for quantitative measurement, the Foucault knife-edge test is still mainly used for qualitative analysis [1,2,3]. The Ronchi test measures the aberrations of imaging lenses with the interference patterns produced by a grating. However, the accuracy is limited when the light source does not have good monochromaticity, and strict alignment is needed for the grating [1,4,5]. The star test analyzes the aberrations by examining the images of a point source formed by the lenses under test (LUT) and compares them with the ideal image form, which depends heavily on experience [1]. The interferometry test is a widely accepted method that obtains the wavefront aberration by measuring the optical path difference (OPD) [6,7,8]. The interferometry test can achieve very high accuracy. However, it has limitations in its dynamic range and is easily affected by the environment. When the aberrations are too large, the dense interferometric fringe patterns cannot be analyzed correctly. In addition, the cost of an interferometer is high, which makes it difficult to be widely used. The Hartmann–Shack test is a popular method that uses lenslet arrays to sample the wavefront and obtain the slope data [9,10]. Then, the slope data are used to reconstruct the wavefront by integration. However, the resolution of it is limited by the number of lenslet arrays.
In this paper, to overcome the difficulties mentioned above, we propose wavefront aberration measurement deflectometry (WAMD), which is based on the theory of phase measuring deflectometry (PMD). As an effective method for measuring the surface shapes of specular optical elements, PMD has received wide attention [11,12]. PMD has the advantages of high accuracy, low costs, a large dynamic range, and so on, and it can also be used to measure the transmitted wavefronts of transparent optical elements. Some methods have been proposed to obtain the transmitted wavefronts of specific optical elements, which is very helpful for further studies of transmitted metrology [13,14,15]. In recent years, Jiang et al. presented a technique by which to test the wavefront aberration of a phase object based on the transmitted fringe deflectometry [16]. In Jiang’s method, the propagation directions of light rays before and after deflection by a phase object under test are obtained by moving the screen. Then, the wavefront aberrations of the reference wavefront and deformed wavefront are obtained. The difference between the two wavefronts is the wavefront aberration caused by the phase object. Their method requires a complicated calibration and measurement process (a time-consuming iteration process is required, and the screen needs to be moved several times), which makes it difficult to be applied to online measurement. Wang et al. proposed a computer-aided calibration method [17,18]. They used the wavefront difference between the ideal system model and the actual test system to achieve a simultaneous multi-surface measurement of freeform refractive optics and were able to remove the alignment error, as well as the lens manufacturing tolerance, by optimization. However, what they finally obtained was only the transmitted wavefront, rather than the real wavefront aberration in geometrical optics.
Compared with traditional methods [1,2,3,4,5,6,7,8,9,10], WAMD is more flexible and can achieve sub-wavelength-level accuracy. Although its accuracy cannot achieve the same level as that of interferometry test, it can work in situations where the aberration is too large to be tested by an interferometer [6,7,8]. Moreover, the measurement facilities are simple and the measurement procedure is easy to operate. It can be applied to measure the aberrations of components in a laser inertial confinement fusion (ICF) facility, such as a tilted lens with a large angle in the ICF’s final optics assembly [19,20]. For this kind of lens, WAMD is a useful in situ or online method for measuring aberration due to gravity. Compared with recent works [16,17,18], WAMD concentrates on measuring the wavefront aberrations of imaging lenses to estimate their working performances. WAMD does not require complicated algorithms or intricate experimental processes. It does not require any iteration or error-compensating processes, and the experimental facilities do not need to be moved during the measurement process, making WAMD time efficient and avoiding a large amount of computation. Moreover, it can measure lenses containing multiple pieces of elements.
The structure of this paper is organized as follows. In Section 2, the principle of WAMD is introduced. A numerical simulation of a plano-convex lens and a telephoto lens to verify the correctness and accuracy of this method is described in Section 3. The feasibility of WAMD was verified by an experiment and is described in Section 4. Section 5 discusses the main error sources, and Section 6 concludes the work.

2. Principles

According to the theory of geometrical optics, when a ray is refracted by an imaging lens, due to the aberration, the refracted ray, which is also called the aberrated ray, deviates from the ideal ray, and the angle between the ideal ray and the aberrated ray is the angular aberration ( α in Figure 1a). Additionally, from the viewpoint of a wavefront, an aberrated wavefront leaves from the exit pupil of the lens, and the optical path difference between the aberrated wavefront and the reference wavefront is the wavefront aberration of the lens ( W in Figure 1a). The relationship between W and α [21,22] can be expressed as:
Δ W ( x , y ) x ( x A x I ) × n R tan α x × n Δ W ( x , y ) y ( y A y I ) × n R tan α y × n
where α x and α y are the angular aberrations in the x and y directions, respectively; ( x A , y A ) and ( x I , y I ) are the coordinates of the aberrated ray at point A and the ideal ray at point I , respectively; and n is the refractive index of the image space medium. R is the radius of curvature of the reference wavefront, which is equal to the distance from the focus I to the exit pupil plane. Thus, using I , A , and R , the angular aberration α x and α y can be worked out according to Equation (1). Then, the wavefront aberration of the imaging lens can be obtained by integrating the angular aberration α x and α y .
However, it is a nearly impossible mission to find the deviation angles of a bunch of incident rays in practice. Thus, the viewpoint of the reverse Hartmann test was adopted in the WAMD to avoid this difficulty [23]. A ray sketch of the WAMD is illustrated in Figure 1b. A pinhole camera is placed at the paraxial focus of the imaging lens, which can be regarded as a ‘point source’. It can be assumed that a ray emitted from the pinhole reaches the screen after being refracted by the lens. Then, the corresponding point on the screen is ‘seen’ by the camera. For an ideal lens (without aberration), the emitted rays from the pinhole are parallel to the optical axis after being refracted by the lens, and point S 1 is ‘seen’ by the camera. However, for an actual lens (with aberration), the ray deviates from the parallel direction, and the camera ‘sees’ another point S 2 on the screen. Therefore, a certain angle ( β in Figure 1b) between the ideal ray and the aberrated ray exists. For lenses with aberration, although the angle α is not angle β , the difference can usually be ignored [24,25]. According to the theory of geometrical optics, rays being refracted by the lens leave from the exit pupil, but it is difficult to determine the position of the exit pupil, which is usually the virtual image of the stop of the lens. Therefore, the coordinates of the rays on the first surface of the lens are used to replace those on the exit pupil, as is shown in Figure 1b, as angle β is equal to angle γ , which can be obtained with the coordinates of F and S 2 . Therefore, the angular aberration β can also be equally expressed as:
tan α x tan β x = x S 2 x F D tan α y tan β y = y S 2 y F D
( x S 2 , y S 2 ) and ( x F , y F ) represent the intersection coordinates of the aberrated ray on the screen and the first surface of the lens, respectively; D is the distance between the first surface of the lens and the screen. Thus, by obtaining the coordinates of F and S 2 in the experiment, the angular aberration β can be measured according to Equation (2). Then, the wavefront aberration of the imaging lens can be obtained by integrating the angular aberration β x and β y .

3. Numerical Simulations

To verify the correctness and accuracy of our proposed method, numerical simulations were conducted. Based on ray-tracing in computers, the WAMD model for wavefront aberration measurement was established using numerical software, and a plano-convex lens and a telephoto lens were tested (the parameters of the lenses under test are shown in Figure 2). The length between the pinhole camera and the screen was set as 1100   mm , and the pinhole was located at the second focal point of the lenses under test. It was assumed that the emergent rays from the pinhole of the camera passed through the LUT. The coordinates ( x F , y F , z F ) and ( x S 2 , y S 2 , z S 2 ) obtained by ray-tracing were taken into Equation (2). Then, the obtained angular aberrations were used to reconstruct the wavefront aberrations by the modal method [26], and the results are given below.
For the plano-convex lens, the actual wavefront aberration with parallel light beams entering from the flat surface and leaving the convex surface is shown in Figure 3a. The wavefront aberration reconstructed by WAMD is shown in Figure 3b. The difference between Figure 3a,b is shown in Figure 3c, which shows that the difference was smaller than 1.23   % in RMS and 0.89   % in PV. Additionally, Figure 3d compares the Zernike coefficients of Figure 3a,b. The result shows that the error of WAMD is small. The simulation result for the telephoto lens is given in Figure 4, in which the actual aberration, the reconstructed aberration, and their difference are shown, respectively. It was observed that the difference was smaller than 6.32   % in RMS and 7.59   % in PV. The main error can be attributed to the wrong power. However, defocus was not considered as one of the monochromatic aberrations because it is closely related to the position of the image plane. Therefore, the correctness and accuracy of WAMD were verified.
Without the loss of generality, lenses with different parameters were simulated to determine the feasibility of the proposed method. Symmetrical biconvex lenses were adopted, and their aperture diameters and radius of curvatures were changed, respectively, in the simulation. The aperture diameter increased from 10   mm to 100   mm , as shown in Figure 5a. The radius of curvature increased from 150   mm to 600   mm , as shown in Figure 5b. For all of these simulated lenses, WAMD performed well and the errors were all smaller than 1.93   % in RMS. The correctness and accuracy of WAMD were further verified.

4. Experiment

Next, to verify the feasibility of WAMD, an experimental setup was built, as shown in Figure 6a. The lenses to be tested and a CCD camera (TXG12, Baumer, Switzerland) with an external pinhole (working as a projection center of the camera) were aligned on the optical axis. An LCD screen (E-2M21GM, MTIPH, China)was installed perpendicular to the optical axis of the system. The resolution of the CCD camera was 1296 × 966 pixels with a pixel size of 3.75   μ m , and the resolution of the screen was 1600 × 1200 pixels with a pixel size of 0.2705   mm . In our experiment, the distance between the camera and the screen was 1005.8 mm.
In the experiment, we calibrated the directions of the emergent rays (represented by I S 0 in Figure 7) at first by recording the phase shifting patterns displayed on the screen without the LUT in the system. The phase was extracted with the phase shifting algorithm, [27] and then the intersection coordinates ( x S 0 , y S 0 ) of the rays on the screen were obtained, as shown in Figure 7. Combining the pinhole position with the coordinates ( x S 0 , y S 0 ) , the ray directions p was calibrated. Then, the intersection coordinates ( x F , y F ) of the rays and the first surfaces of the LUT, shown in Figure 1b, were obtained by ray-tracing with the ray directions p and the nominal structure parameters of LUT. After this, the lens to be tested was aligned into the system, and the phase shifting patterns captured by the camera were distorted due to the aberration of the LUT. Then, the coordinates ( x S 2 , y S 2 ) on the screen were obtained by the phase shifting algorithm. The angular aberration of the lens can be calculated by Equation (2) with the two sets of coordinates ( x F , y F ) , ( x S 2 , y S 2 ) and the distance D . Finally, the wavefront aberration can be determined by the modal method.
The single plano-convex lens and the telephoto lens mentioned in the simulation were tested in the experiment under the same circumstances, and the results measured by WAMD were compared with those measured by an interferometer (DynaFiz UHR1200, Zygo, Middlefield, CT, USA). Since the defocus aberration is greatly affected by the distance between the interferometer and the focal point of the LUT, the first four terms of the Zernike polynomials were removed in the results. For the single plano-convex lens (Edmund Optics #63-483; the parameters are shown in Figure 2a), the result is shown in Figure 8. The results measured by WAMD and the interferometer appear close to each other, and spherical aberration was measured with reasonable accuracy. The RMS of the difference reached 58.9   nm ( 4.74   % ). The difference between them is mainly constituted by coma and astigmatism, which is caused by the inaccuracy of the alignment tools used, resulting in a tilt and off-axis of the LUT. The telephoto lens tested in the experiment consisted of two single lenses (#63-561, Edmund Optics, US; GL13-040-080, Golden Way Scientific, Beijing, China) and had the structural parameters shown in Figure 2b without aberration optimization. The result for the telephoto lens is shown in Figure 9 in which we can observe that the wavefront aberration measured by WAMD was nearly the same as that measured by the interferometer. The RMS of the difference was 166.8   nm ( 5.71   % ). The spherical aberration was measured accurately, and the fifth, seventh, and eighth terms were measured effectively. The result verified the feasibility of this method.

5. Discussion

In the experiment section, the differences between the results measured by WAMD and Zygo interferometer can be partly attributed to the accuracy of the alignment tools. This speculation was verified by the simulation, as shown in Figure 10. The plano-convex lens measured in the experiment was simulated, and alignment errors were introduced intentionally. The results are shown in Figure 10. Figure 10a shows the actual wavefront aberration when the LUT was accurately aligned on the optical axis of the measurement system. When the LUT was 5   mm off axis in the x-direction and rotated 1 ° about the x-axis, the wavefront aberration measured by WAMD is shown in Figure 10b. Figure 10c shows the error in this condition, and the corresponding Zernike coefficients are compared in Figure 10d. From the simulation results shown in Figure 10, it can be observed that when the lens was not aligned accurately on the optical axis of the measurement system, additional errors (mainly coma and astigmatism) were introduced into the measurement result, which were similar to some of the errors existing in the experiment. Therefore, it can be predicted that the measurement accuracy can be further improved with more accurate alignment tools.

6. Conclusions

In conclusion, we propose WAMD for measuring the wavefront aberration of various imaging lenses. Based on the reverse ray-tracing method, WAMD is elaborated clearly and the feasibility of this method is proved by both the simulation and the experiment. The experimental results show that the accuracy of this method can reach 58.9   nm in the measurement of a single lens, and 166.8   nm accuracy was reached when a telephoto lens was measured. WAMD has the advantages of broad applicability, high efficiency, high resolution, a simple structure, low costs, and reasonable accuracy. It provides a new method for aberration tests. In future research, this method will be developed further to measure the aberration of an inclined lens with a large aperture. Additionally, more complicated lenses will be tested to explore the range of applications of this method.

Author Contributions

Conceptualization, L.Y., D.L., and Y.R.; methodology, L.Y., D.L., and Y.R.; software, L.Y., D.L., Y.R., X.Z., and R.W.; data curation, L.Y., D.L., Y.R., and K.X.; writing—original draft preparation, L.Y.; writing—review and editing, D.L., X.Z., and R.W. All authors have read and agreed to the published version of the manuscript.

Funding

This research was funded by National Natural Science Foundation of China (grant number: U20A20215 and 61875142) and Sichuan University (grant number: 2020SCUNG205).

Institutional Review Board Statement

Not applicable.

Informed Consent Statement

Not applicable.

Data Availability Statement

Not applicable.

Conflicts of Interest

The authors declare no conflict of interest.

References

  1. Malacara, D. Optical Shop Testing, 3rd ed.; John Wiley & Sons: New York, NY, USA, 2007. [Google Scholar]
  2. Rodríguez, G.; Villa, J.; Martínez, G.; de la Rosa, I.; Ivanov, R. Towards the automatization of the Foucault knife-edge quantitative test. In Proceedings of the Third International Conference on Applications of Optics and Photonics, Faro, Portugal, 8–12 May 2017; SPIE: Bellingham, WA, USA, 2017; Volume 10453, pp. 431–438. [Google Scholar]
  3. Hernández-Delgado, J.; Malacara-Hernández, Z.; Malacara-Doblado, D.; Vázquez-Dorrío, B.; Malacara-Hernández, D. Local Curvatures and Its Measurements of an Optical Surface or a Wavefront: A Review. Opt. Eng. 2022, 61, 50901. [Google Scholar] [CrossRef]
  4. Aguirre-Aguirre, D.; Granados-Agustín, F.S.; Cornejo-Rodríguez, A. Obtaining the wavefront in the Ronchi test using only one Ronchigram with random coefficients of aberration. In Proceedings of the 22nd Congress of the International Commission for Optics: Light for the Development of the World, Puebla, Mexico, 15–19 August 2011; SPIE: Bellingham, WA, USA, 2011; Volume 8011, pp. 321–327. [Google Scholar]
  5. Li, P.; Tang, F.; Wang, X. Compensated Differential Zernike Fitting Method for Wavefront Aberration Metrology Based on Grating Lateral Shearing. Appl. Opt. 2022, 61, 1–9. [Google Scholar] [CrossRef] [PubMed]
  6. Twyman, F. An interferometer for testing camera lenses. Trans. Opt. Soc. 1921, 22, 174. [Google Scholar] [CrossRef]
  7. Weingaertner, I.; Schulz, M. Interferometric methods for the measurement of wavefront aberrations. In Specification and Measurement of Optical Systems; SPIE: Bellingham, WA, USA, 1993; Volume 1781, pp. 266–279. [Google Scholar]
  8. Chen, W.; Chen, L.; Zhang, X.; Zhang, Q. Geometrical Aberration Measurement by Experimental Ray-Tracing Based on Fiber Point Diffraction Interferometry. Meas. Sci. Technol. 2022, 33, 105004. [Google Scholar] [CrossRef]
  9. Neal, D.R.; Copland, J.; Neal, D.A. Shack-Hartmann wavefront sensor precision and accuracy. Proc. SPIE 2002, 4779, 148–160. [Google Scholar]
  10. Yu, J.; Fang, F.Z.; Qiu, Z.J. Aberrations measurement of freeform spectacle lenses based on Hartmann wavefront technology. Appl. Opt. 2015, 54, 986–994. [Google Scholar] [CrossRef]
  11. Markus, M.C.; Knauer, J.; Hausler, G. Phase measuring deflectometry: A new approach to measure specular free-form surfaces. SPIE Photonics Eur. 2004, 5457, 366–376. [Google Scholar]
  12. Huang, L.; Idir, M.; Zuo, C.; Asundi, A. Review of phase measuring deflectometry. Opt. Lasers Eng. 2018, 107, 247–257. [Google Scholar] [CrossRef]
  13. Canabal, H.; Alonso, J. Automatic wavefront measurement technique using a computer display and a charge-coupled device camera. Opt. Eng. 2002, 41, 822–826. [Google Scholar] [CrossRef]
  14. Knauer, M.C.; Richter, C.; Vogt, P.; Häusler, G. Measuring the refractive power with deflectometry in transmission. DGaO ISSN 2008, 109, A24. [Google Scholar]
  15. Flores, J.L.; Legarda-Saenz, R.; Garcia-Torales, G. Color deflectometry for phase retrieval using phase-shifting methods. Opt. Commun. 2015, 334, 298–302. [Google Scholar] [CrossRef]
  16. Jiang, L.L.; Zhang, X.D.; Fang, F.Z.; Liu, X.L.; Zhu, L.L. Wavefront aberration metrology based on transmitted fringe deflectometry. Appl. Opt. 2017, 56, 7396–7403. [Google Scholar] [CrossRef]
  17. Wang, D.D.; Xu, P.; Wu, Z.D.; Fu, X.Y.; Wu, R.M.; Kong, M.; Liang, J.; Zhang, B.; Liang, R.G. Simultaneous multisurface measurement of freeform refractive optics based on computer-aided deflectometry. Optica 2020, 7, 1056–1064. [Google Scholar] [CrossRef]
  18. Wang, D.D.; Yin, Y.M.; Dou, J.C.; Kong, M.; Xu, X.K.; Lei, L.H.; Liang, R.G. Calibration of geometrical aberration in transmitted wavefront testing of refractive optics with deflectometry. Appl. Opt. 2021, 60, 1973–1981. [Google Scholar] [CrossRef] [PubMed]
  19. Bonanno, R.E. Assembling and installing line-replaceable units for the National Ignition Facility. Opt. Eng. 2004, 43, 2866–2872. [Google Scholar] [CrossRef]
  20. Burkhart, S.C.; Bliss, E.; Nicola, P.D.; Kalantar, D.; Lowe-Webb, R.; McCarville, T.; Nelson, D.; Salmon, T.; Schindler, T.; Villanueva, J.; et al. National ignition facility system alignment. Appl. Opt. 2011, 50, 1136–1157. [Google Scholar] [CrossRef] [PubMed]
  21. Rayces, J.L. Exact Relation between Wave Aberration and Ray Aberration. Opt. Acta Int. J. Opt. 1964, 11, 85–88. [Google Scholar] [CrossRef]
  22. Welford, W.T. Aberrations of Optical Systems; CRC Press: Boca Ration, FL, USA, 1986. [Google Scholar]
  23. Su, P.; Khreishi, M.; Su, T.Q. Aspheric and freeform surfaces metrology with software configurable optical test system: A computerized reverse Hartmann test. Opt. Eng. 2014, 53, 031305. [Google Scholar] [CrossRef]
  24. Yoder, P.R.; Hollis, W.W. Design of a Compact Wide Aperture Fizeau Interferometer. J. Opt. Soc. Am. 1957, 47, 858–861. [Google Scholar] [CrossRef]
  25. Malacara-Hernández, D.; Malacara-Hernández, Z.; Malacara, Z. Handbook of Optical Design; CRC Press: Boca Ration, FL, USA, 2016. [Google Scholar]
  26. Zhao, C.; Burge, J.H. Orthonormal vector polynomials in a unit circle, part I: Basis set derived from gradients of Zernike polynomials. Opt. Express 2007, 15, 18014–18024. [Google Scholar] [CrossRef] [Green Version]
  27. Zuo, C.; Feng, S.; Huang, L. Phase shifting algorithms for fringe projection profilometry: A review. Opt. Lasers Eng. 2018, 109, 23–59. [Google Scholar] [CrossRef]
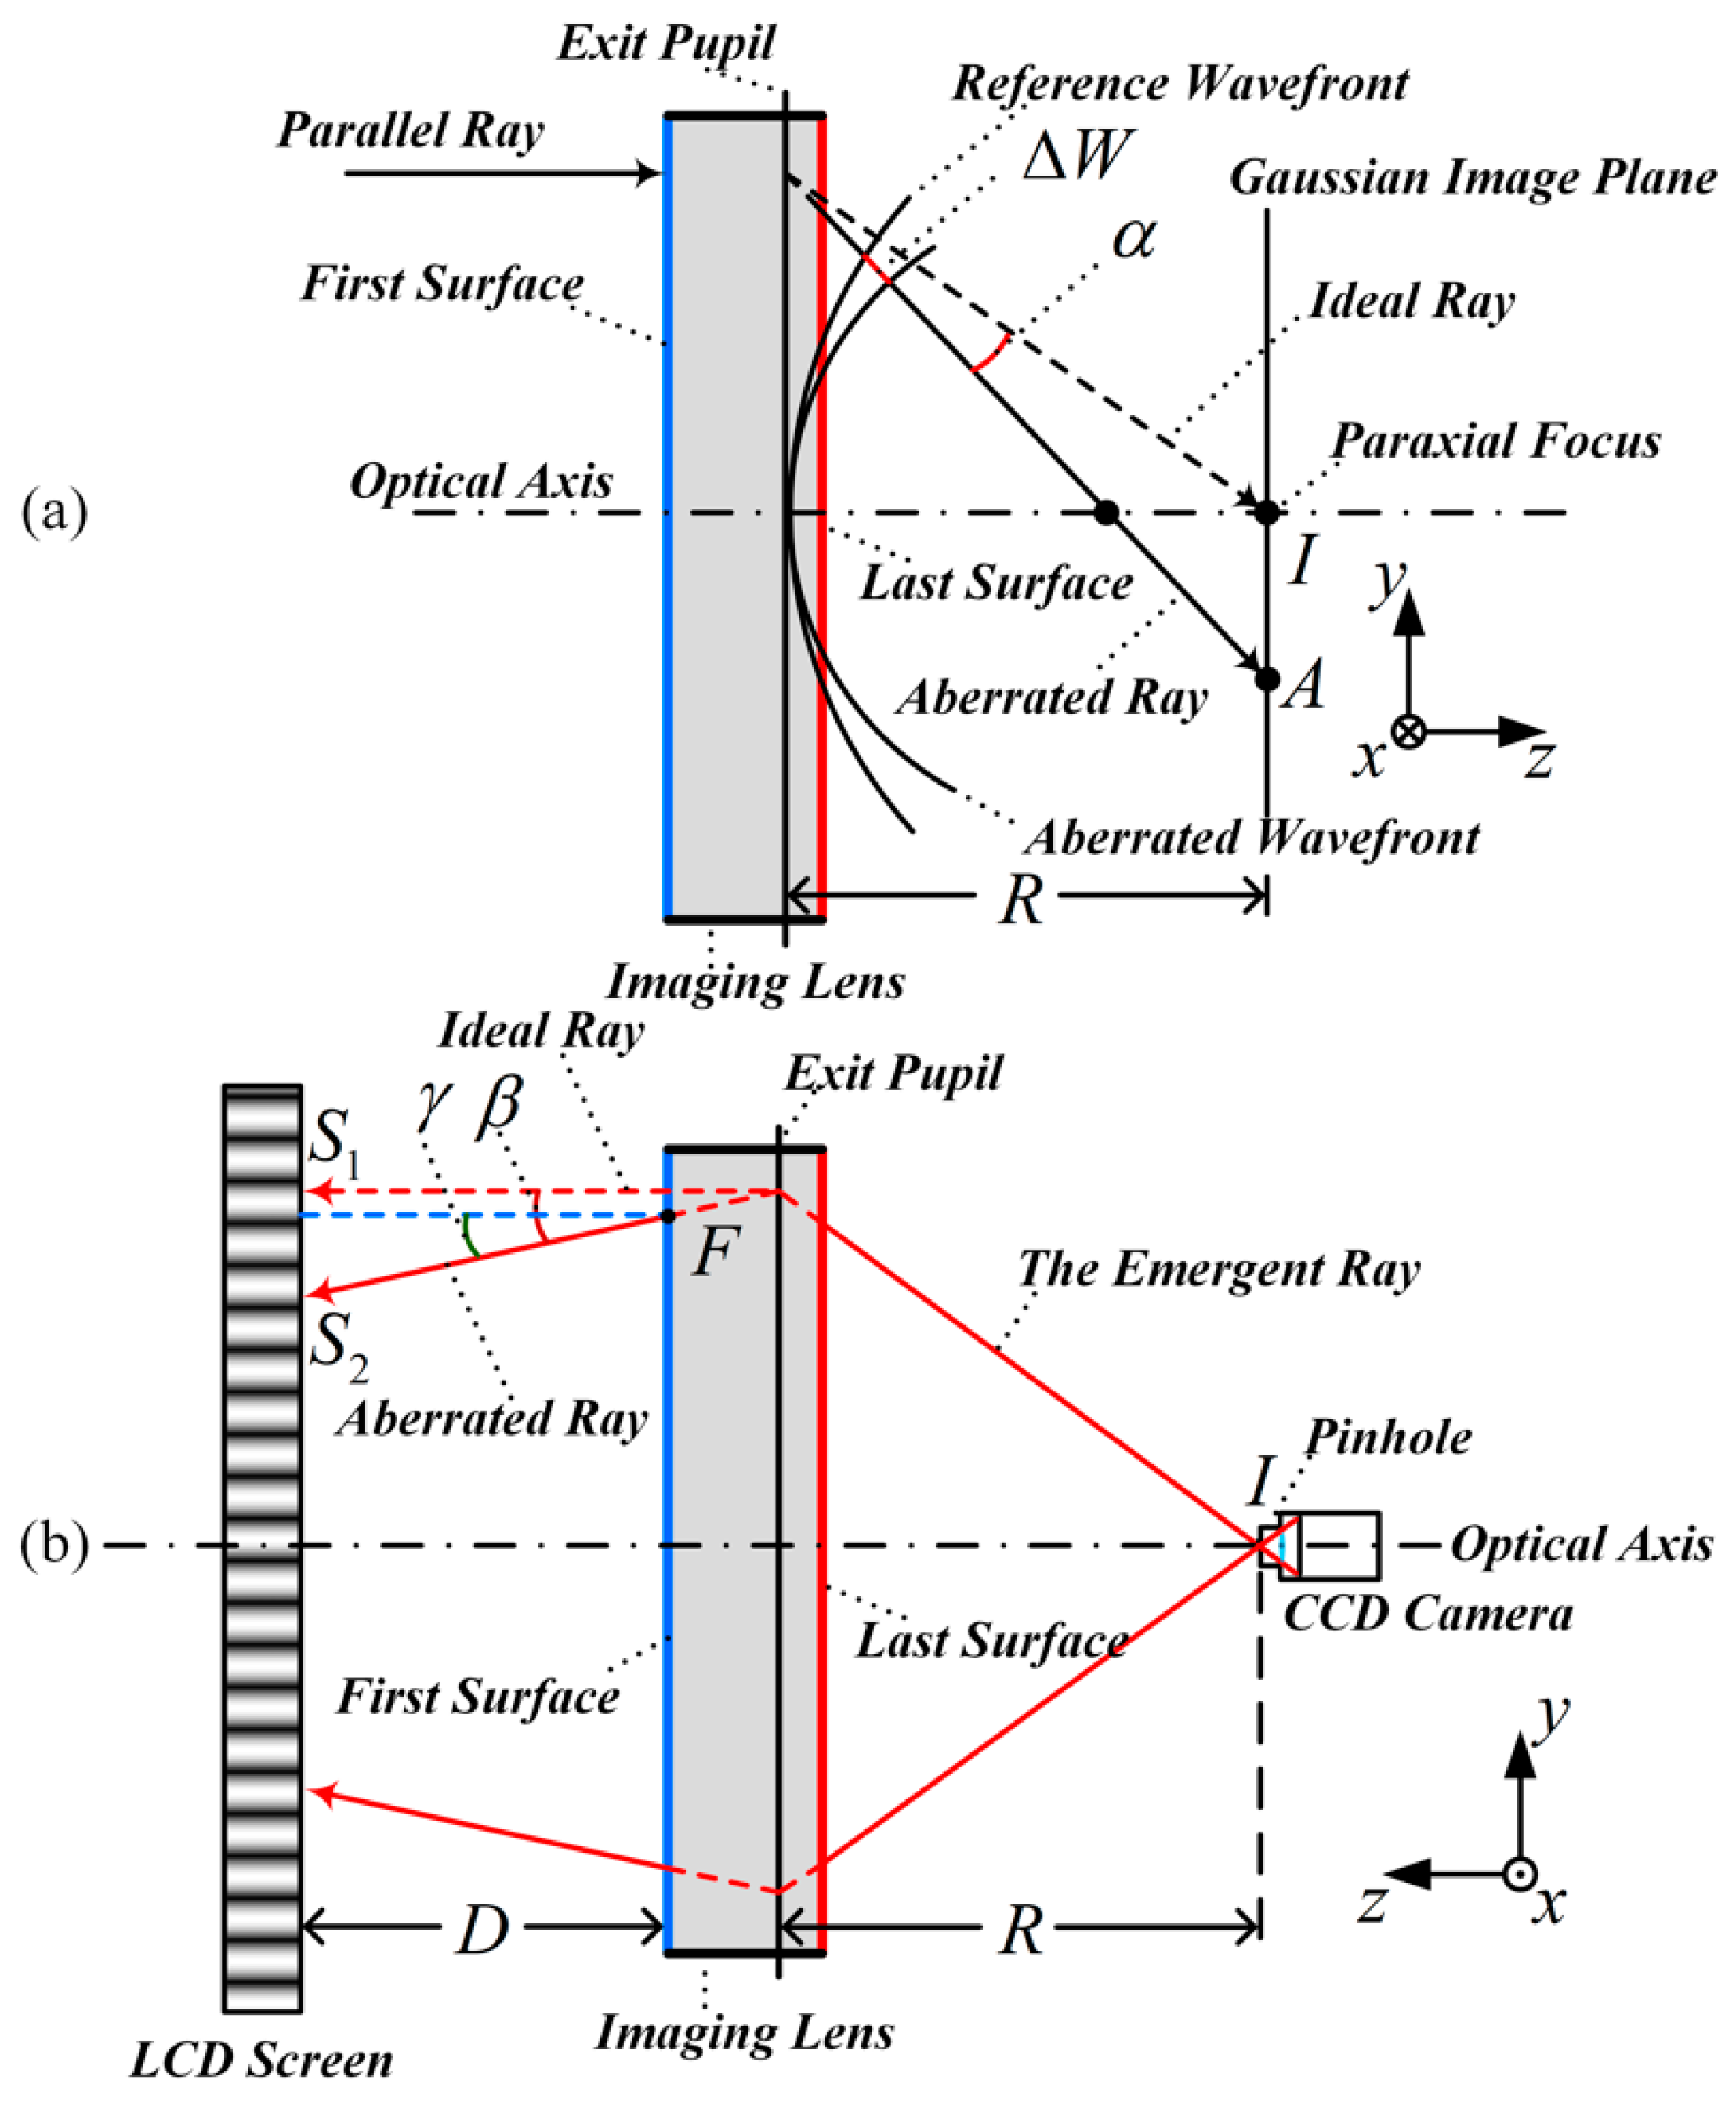
Figure 1. (a) Schematic angular aberration and wavefront aberration; (b) ray sketch of WAMD test.
Applsci 12 07857 g001
Figure 2. The parameters of imaging lenses in the simulation: (a) the parameters of the plano-convex lens; (b) the parameters of the telephoto lens.
Applsci 12 07857 g002
Figure 3. Wavefront aberration of the plano-convex lens in the simulation: (a) actual wavefront aberration; (b) wavefront aberration measured by WAMD; (c) difference between (a,b); (d) comparison of Zernike coefficients.
Applsci 12 07857 g003
Figure 4. Wavefront aberration of the telephoto lens in the simulation: (a) actual wavefront aberration; (b) wavefront aberration measured by WAMD; (c) difference between (a,b); (d) comparison of Zernike coefficients.
Applsci 12 07857 g004
Figure 5. Comparisons between the actual wavefront aberrations and wavefront aberrations measured by WAMD of: (a) lenses with different aperture diameters (radius of curvature: 500   mm ; thickness: 8   mm ; refractive index: 1.5168 ); (b) lenses with different radius of curvatures (aperture diameter: 50   mm ; thickness: 15   mm ; refractive index: 1.5168 ).
Applsci 12 07857 g005
Figure 6. (a) WAMD system in the experiment; (b) interferometry test system in the experiment.
Applsci 12 07857 g006
Figure 7. Ray sketch of the calibration strategy.
Applsci 12 07857 g007
Figure 8. Wavefront aberration of the plano-convex lens in the experiment: (a) measured by WAMD; (b) measured by a Zygo interferometer; (c) difference between (a,b); (d) comparison of Zernike coefficients.
Applsci 12 07857 g008
Figure 9. Wavefront aberration of the telephoto lens in the experiment: (a) measured by WAMD; (b) measured by a Zygo interferometer; (c) difference between (a,b); (d) comparison of Zernike coefficients.
Applsci 12 07857 g009
Figure 10. Wavefront aberration of the plano-convex lens in the simulation when alignment errors exist: (a) actual wavefront aberration; (b) wavefront aberration measured by WAMD when the LUT was 5   mm off-axis in the x-direction and rotated 1 ° about the x axis; (c) difference between (a,b); (d) comparison of Zernike coefficients.
Applsci 12 07857 g010
Publisher’s Note: MDPI stays neutral with regard to jurisdictional claims in published maps and institutional affiliations.