Article

Electrochemical Detection of Penicillin G Using Molecularly Imprinted Conductive Co-Polymer Sensor

1
Material Science Department, Faculty of Engineering, University of Mons, 7000 Mons, Belgium
2
Materia Nova, Materials R&D Center, 7000 Mons, Belgium
*
Authors to whom correspondence should be addressed.
Appl. Sci. 2022, 12(15), 7914; https://doi.org/10.3390/app12157914
Submission received: 6 July 2022 / Revised: 29 July 2022 / Accepted: 4 August 2022 / Published: 7 August 2022
(This article belongs to the Special Issue Functional Polymer Composites: Latest Advances and Prospects)

Abstract

:
Antibiotics are increasingly used to treat certain bacteria that are harmful to humans. However, their inadequate or excessive use can lead to the proliferation of certain more resistant strains, which ultimately reduces their effectiveness. To counter this, it is essential to limit the amount of antibiotics ingested, particularly through animal food, if the animals themselves have received antibiotic treatment. In the case of milk, it is necessary to be able to detect quantities of antibiotics in the range of a few parts per billion. A sensor has therefore been developed for this purpose. The sensitive layer that we propose to use in this study, is based on a molecularly imprinted conductive polymer (MICP) that allows a very specific interaction and have been integrated into electrochemical detection approaches by polymerization on electrodes. The sensor is based on the measurement of the variation in conductivity of a sensitive layer deposited between two electrodes, which is influenced by the presence of the antibiotic. Although it seems possible to further improve the performance of these sensors, their use in this field seems very promising considering the obtained results.

1. Introduction

A significant increase has been observed in the use of antibiotics, which is generally due to their specific activity against bacteria or fungi in human and animal organisms and, in addition, to their ability to increase growth rates and improve feed efficiency [1] in the field of animal husbandry. The presence of antibiotics in the environment leads to an increase in the number of multi-resistant bacteria, with serious consequences for human and animal health [2,3,4].
In Europe, in order to protect consumers from excessive consumption of these products, strict legislation has been imposed on the treatment of farm animals with antibiotics. Following this idea, food products of animal origin are subject to maximum residue limits (MRL). These limits differ for each of the antibiotics used in this field [5]. Their detection has become a major issue in many fields such as water analysis, food control, health, etc. An interesting example concerns the wide variety of antibiotics that might be found in milk, the milk matrix being one of the most complex ones.
The case of penicillin G (hereafter called PenG) is no exception to this rule. European Commission established a maximum residue limit (MRL) in milk of 4 µg/L (which is equivalent to 4 ppb or to 12 nmol/L) mentioned in its council regulation 2377/90/EC [2,5]. The choice of PenG lies essentially in the fact that this MRL imposed by the European Union is the lowest among the various potentially undesirable compounds in milk. If we manage to achieve this detection, we can assume that it will be possible to detect other compounds in higher concentration ranges.
Nowadays, the methods used for antibiotic detection in milk are mainly based on chromatographic, immunological, and microbiological test approaches [6,7,8,9,10]. The use of chromatographic methods, even if they are very sensitive, are not adapted for simple, cheap, and fast measurements, which would be the most suitable method to perform antibiotic detection in the agri-food industry. The most appropriate detection method for this type of measurement would therefore be the use of sensors.
There are a wide variety of sensors aiming to detect antibiotics, many of them are biosensors. The first specific kind of antibiotic sensors is the enzyme-based biosensors. These biosensors use enzymes to generate a specific bio-recognition reaction. This usually generates electrochemical or optical response that is often measured by surface plasmon resonance (SPR). However, these sensors are often more expensive, and the assay time is often a bit long [11,12,13].
Besides that, there are a few biosensors based on the enzymatic activity of microorganisms. In general, those kinds of biosensors are based on the measurement of the inhibition of bacterial growth due to the presence of antibiotics [6,7,8,9]. The main drawbacks of these sensors are their response time and their implementation.
The largest group of antibiotic biosensors for detection in milk is the immunosensors. They are based on the exploitation of immunochemical biorecognition reactions. Even if this kind of sensors is very selective, they suffer from long response and regeneration time [12].
Another kind of sensor used to detect antibiotics is the aptasensors. These sensors use aptamers which can be considered chemical or synthetic antibodies. They are indeed produced in vitro based on the systematic evolution of ligands by exponential enrichment. However, this kind of sensor presents a major problem in milk analyses due to the presence of proteins and fat. Moreover, the non-transparency of the samples prevents the use of optical methods. The only way to solve the problem is to perform pretreatment on milk samples [14].
A rapid, easy, and sensitive immunochromatographic test strip has been developed for the detection of Ciproflaxin in milk [15]. This method is based on antibody-antigen affinity. These tests are in the form of small narrow sheets impregnated with various compounds which show the presence or absence of molecules of interest in a medium when the strips are dipped into it. This method is one of the most used for the detection of PenG in milk.
In this method, the first antibody, labeled with a tracer (usually a dye) and complementary to the antigen to be detected, is impregnated on the surface of the strip but remains mobile. Two others are immobilized on the surface of the strip at two specific locations corresponding to the test and control windows (Figure 1).
During the analysis, the strips, often made of nitrocellulose, are dipped into the solution to be analyzed. The solution flows through the strip by capillary action and first passes through the area containing the labeled antibodies. If the antigen is present in the solution, the immune complex is formed. The solution then continues its journey to the two test windows. The test window interacts with the antigens bound to the labeled antibodies whereas the control window binds the labeled antibodies alone and not the immune complex. By comparing their coloration, it is possible to determine if the antigen to be detected is present or not in the solution being tested. Depending on the presence or absence of antigens, the test area will be colored or not, while the control area will always be colored [16].
It must be noted that it is also possible to determine the antigen coloration using spectrophotometer analysis. This makes it possible not only to determine whether or not the molecule of interest is present, but also to know in which quantity. However, this kind of device is way more cumbersome and expensive than the test strips cost.
A more recent and promising development in antibiotic sensors are the molecularly imprinted polymers (MIP) sensors. These are synthetic materials resulting from biomimicry of antibody/antigen interactions (key/lock system). The properties obtained are comparable to those of biological receptors in terms of sensitivity, but especially in terms of selectivity [17]. They present the advantage of being able to perform measurements in milk without the interference of the milk matrix [12]. This kind of materials can be coupled to chemical sensors through their combination with conducting polymers (CPs). Indeed, conducting polymers can be doped or undoped by a molecule and, hence, see their physical properties modified.
It is more interesting to choose conducting polymers because of all the quantifiable properties linked to the conductivity variation. However, lots of conducting polymers are not stable under ambient conditions. Among the stable CPs, polyanilines and polypyrrole are the two most interesting. Since the properties of polyaniline also vary with pH, polypyrrole is preferred for more stable measurements [18].
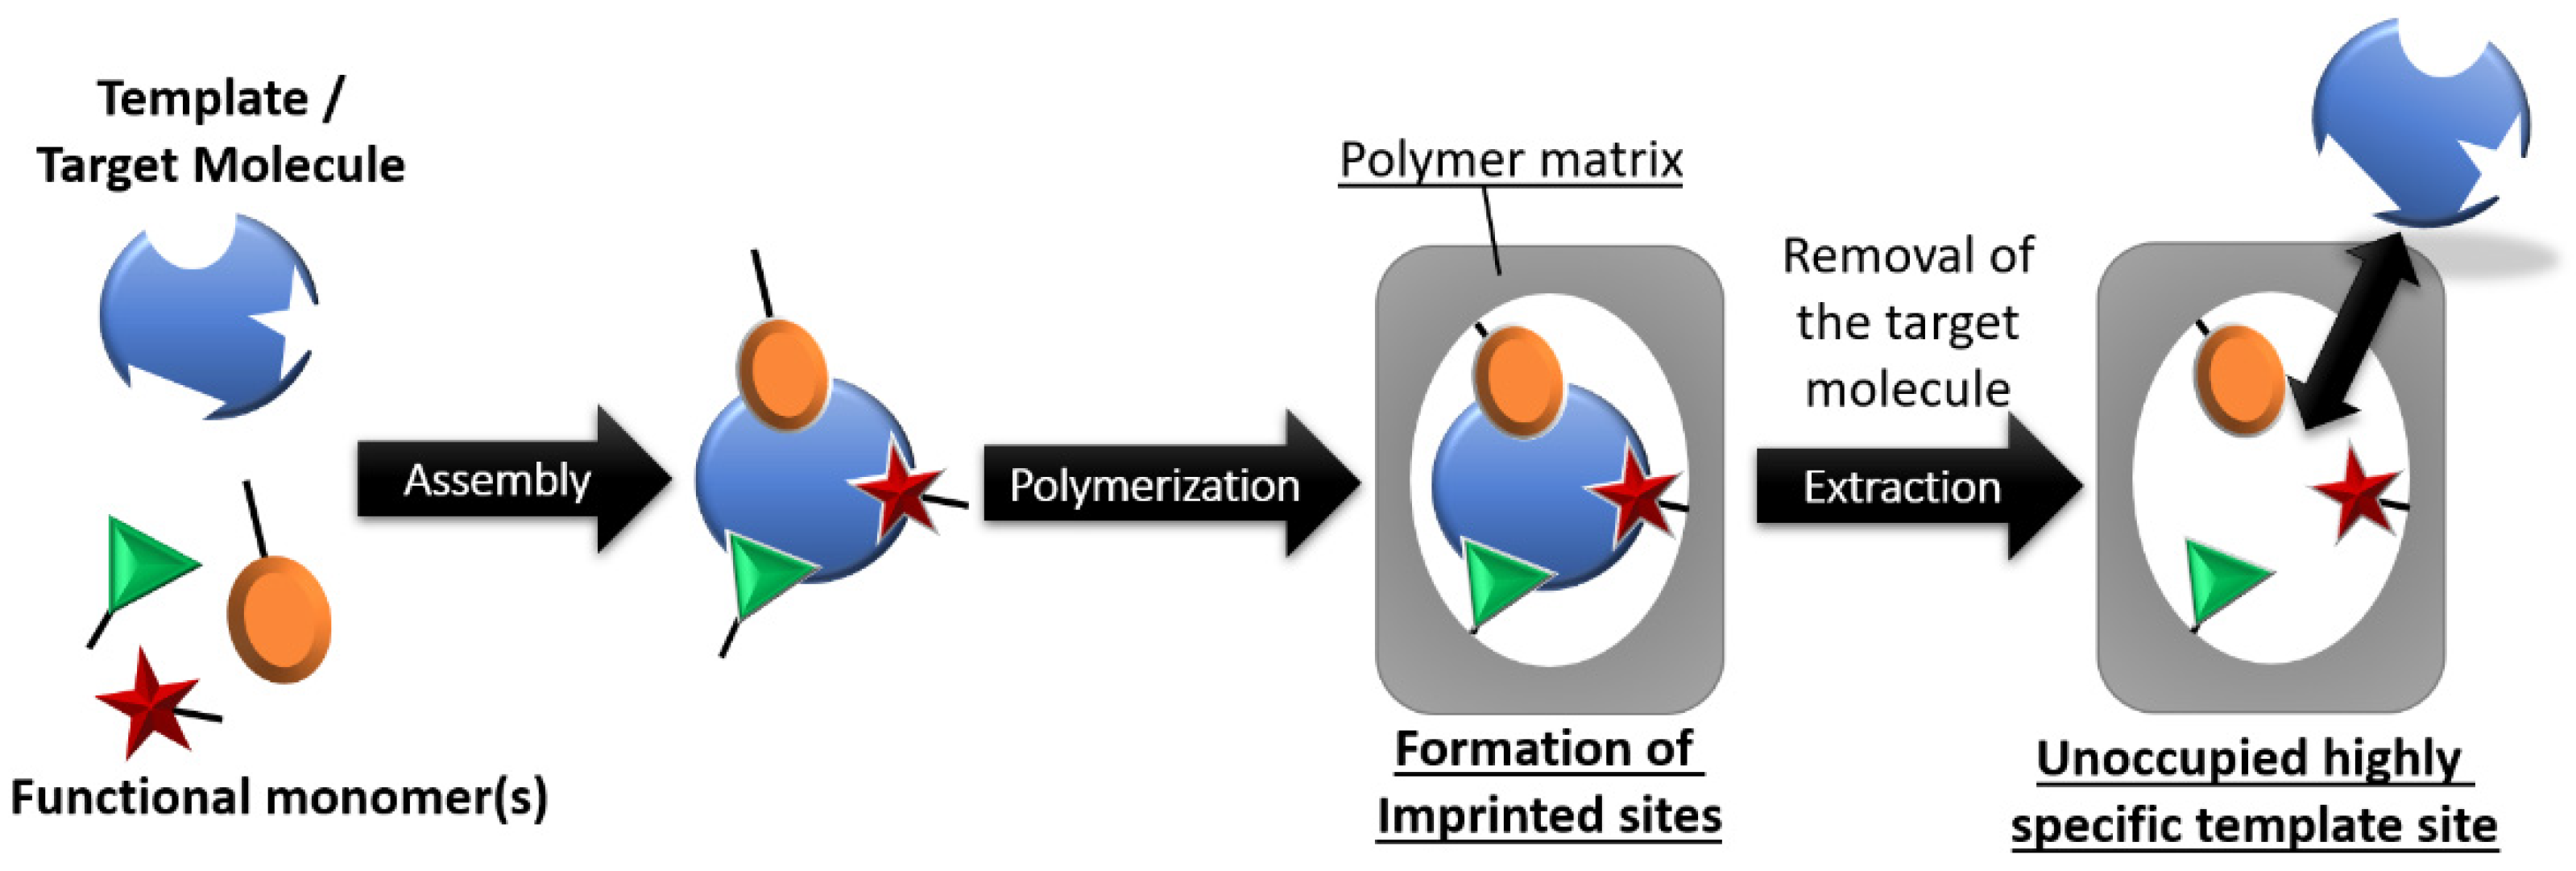
MIPs are obtained by polymerization of monomers around a template molecule. After the elimination of this molecule, the polymer obtained contains cavities, and imprints, with specific recognition sites (see Figure 2) [19]. These cavities are specific to the template used while doing the polymerization. This template will be the analyte to be detected and significantly increase the selectivity. This recognition technique is strongly inspired by the key-lock interaction process allowing the antibody to recognize antigens by binding with antigen epitopes. Molecularly imprinted polymers have therefore been nicknamed “antibody mimics”. It has been shown that they can be substituted for biological receptors in certain formats of immunoassays and biosensors.
In the case of conductive polymers, they are called molecularly imprinted conductive polymers (MICPs). For each MIP synthesis, a similar polymer without imprint will be synthesized. This is called a non-imprinted polymer (NIP or NICP in the case of a non-imprinted conductive polymer). The comparison between the MIP and the NIP will allow us to point out the interest of an imprint in the polymer instead of using the raw polymer. However, with all the polymers presented here being conductive, it will be simpler to speak about MIP and NIP. MICPs can be directly deposited on electrode surfaces by either chemical or electrochemical polymerization [4].
This work aims to develop and characterize a new sensing material based on MICPs to specifically and easily detect PenG in the liquid phase.

2. Materials and Methods

2.1. Interdigitated Electrodes on PET Substrates

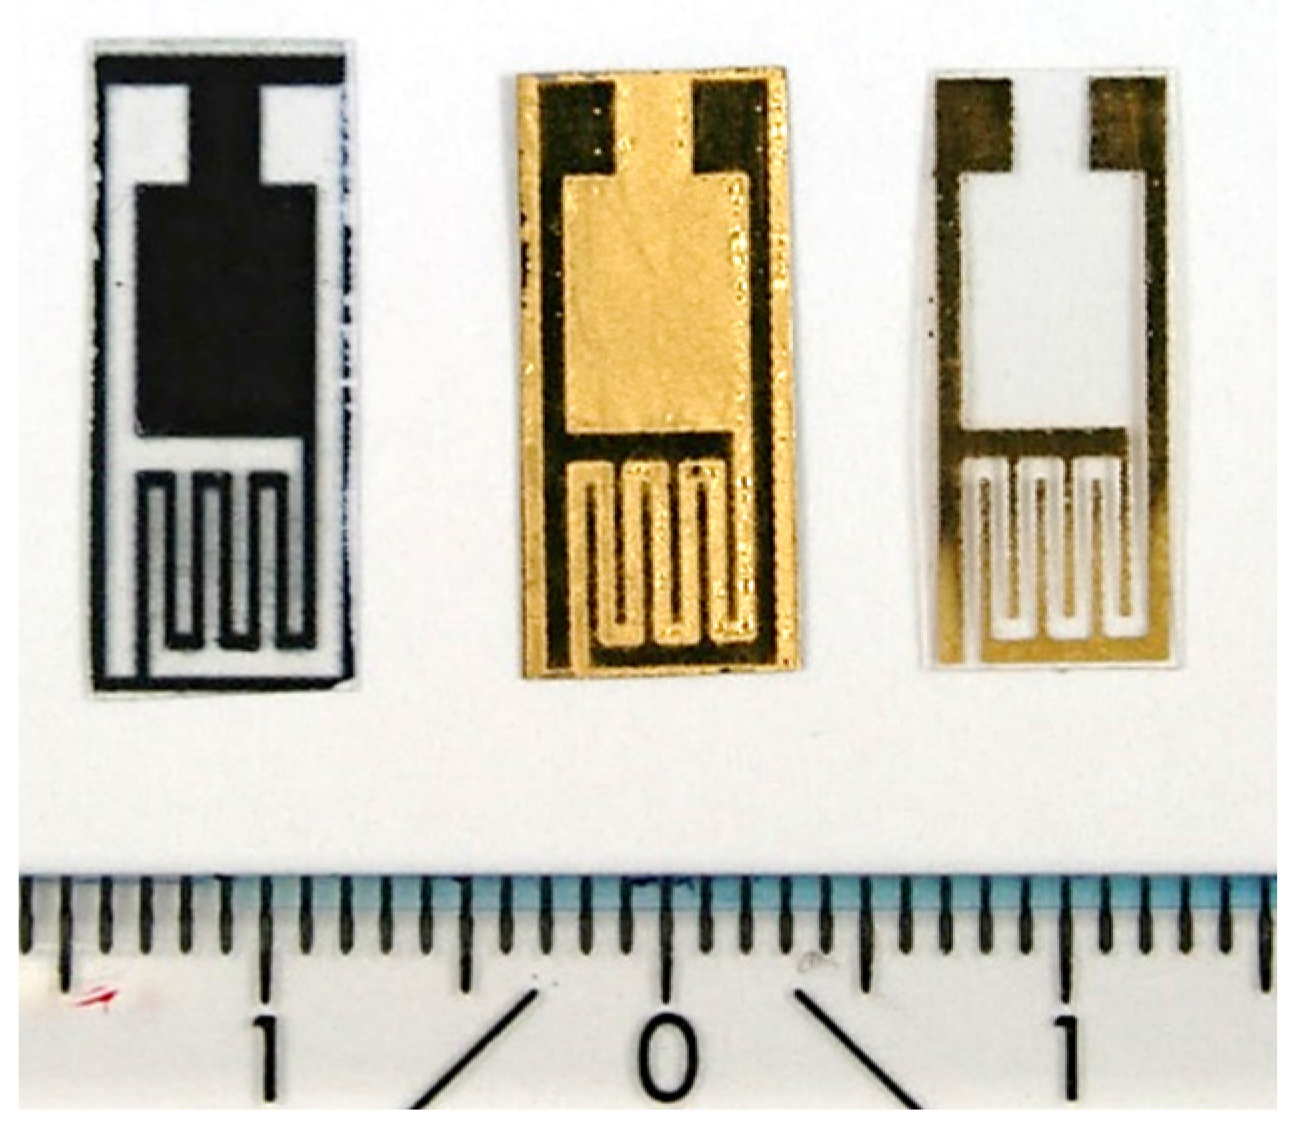
Homemade interdigitated electrodes (IDE) are disposed of on polyethylene terephthalate (PET). They are made by printing the negative part with a classical printer. The printing is then covered with a 200 nm thick gold layer using the sputtering method. Then, the substrates are immersed in an acetone solution for 2 h.
The substrates produced are shown in Figure 3.
Before doing the deposition, these substrates are cleaned with technical grade isopropanol and dried with laboratory paper. To ensure that the contact points are always accessible, these parts of the IDE are covered with adhesive paper before the polymerization step.

2.2. Chemicals

The chemicals used are mentioned below with their reference:
  • Deionized water as solvent and rinsing liquid.
  • Penicillin G (PenG) from Merck™: CAS 69-57-8 (C16H17N2NaO4S), (>96 wt.%), 356.38 g/mol.
  • Pyrrole-3-carboxylic acid (PyCOOH) from Merck™: CAS 931-03-3 (C5H5NO2) (96 wt.%), 111.10 g/mol.
  • Pyrrole (Py) from Merck™: CAS 109-97-7 (C4H5N) (98 wt.%), 67.09 g/mol.
  • Sulfuric Acid from Merck™: CAS 7664-93-9 (H2SO4) (95 wt.%), 98.08 g/mol.
  • Ammonium persulfate (APS) from Merck™: CAS 7727-54-0 ((NH4)2S2O8) (>98 wt.%), 228.2 g/mol.
  • Methanol (MeOH) from M Supelco™: CAS 67-56-1 (CH3OH) (>99 wt.%), 32.04 g/mol.
  • Hydrochloric acid from VWR Chemicals™: CAS 7647-01-0 (HCl) (>37 wt.%), 36.46 g/mol.

2.3. Equipment

Gold deposition is performed by sputtering an EM SCD 500 from Leica®.
During the polymerization, thermoregulation is guaranteed thanks to a VTF Digital Thermoregulator from VELP Scientifica®.
The potentiostat used to characterize the performances of the sensor is a Parstat® 2273 from Princeton Applied Research.
The Thickness measurements have been performed with a non-contact confocal profilometer Surface Metrology System NJHP 115/105/505™ from Nano Jura™.

2.4. Synthesis of the MICP

As is often the case when we speak about a molecularly imprinted polymer, it is more precisely a copolymer as it includes a cross-linking monomer and a functional monomer. In this work, we used pyrrole (Py) and pyrrole-3-carboxylic acid (PyCOOH). The interest of this functional monomer is essentially its ability to create hydrogen bonds with other compounds, due to its carboxylic acid function, especially with other carboxylic acid functions.
The polymerization method used is oxidative polymerization. An electron is removed from the monomer, reacting with other monomers, and leading to the beginning of polymerization.
Depending on the standard potential of the chosen oxidant, we will be in the presence of a more or less strong oxidation. However, it was observed [20] that the strength of the oxidant used will influence the crosslinking rate of the obtained polymer. It is obvious that this cross-linking will decrease the conductivity of the polymer. However, in the case of a MICP, this cross-linking will also make it possible to rigidify the structure and to ensure that a correct imprint is preserved after extraction of the target molecule. Hence, a strong oxidant will be used for the synthesis which is ammonium persulfate (APS).
For all the syntheses, the molar ratios will be respected from one synthesis to the other. The aimed ratio in accordance with what has been observed in the literature for PenG is 12 molecules of Py and 4 molecules of PyCOOH for 1 molecule of PenG. This ratio will be regularly noted as 12/4 [21,22]. The composition of the MICP polymerization solutions is the following: 8.97 × 10⁻⁴ mol/L of PenG, 3.555×10⁻³ mol/L of PyCOOH, 10−2 mol/L of Py, 0.158 mol/L of H2SO4, and 0.0355 mol/L of APS. The polymerization takes place for 20 min at 30 °C in 25 mL of water at pH 2 (adjusted with H2SO4). The APS is added about 15 min after all the other chemicals. This is the time needed to reach the working temperature, but it also allows molecules to correctly perform self-assembly before the beginning of polymerization. In order to increase the thickness of the sensitive layer, the polymerization is repeated twice in a row on the same substrate.
The SO42− ions come from H2SO4 and especially from the reduction of APS, are used as dopants for our polymer and will allow us to stabilize the charges which will travel there. However, during this synthesis, the objective is not to realize the most conductive polymer. Indeed, with a polymer that is too conductive, especially at the core, it would be difficult to see a small variation in the conductivity of the material at the surface, when in contact with the target molecule. The ideal is therefore to have a conductivity just sufficient to ensure the charge transfer from one electrode to the other. The polymer is therefore not overly doped.
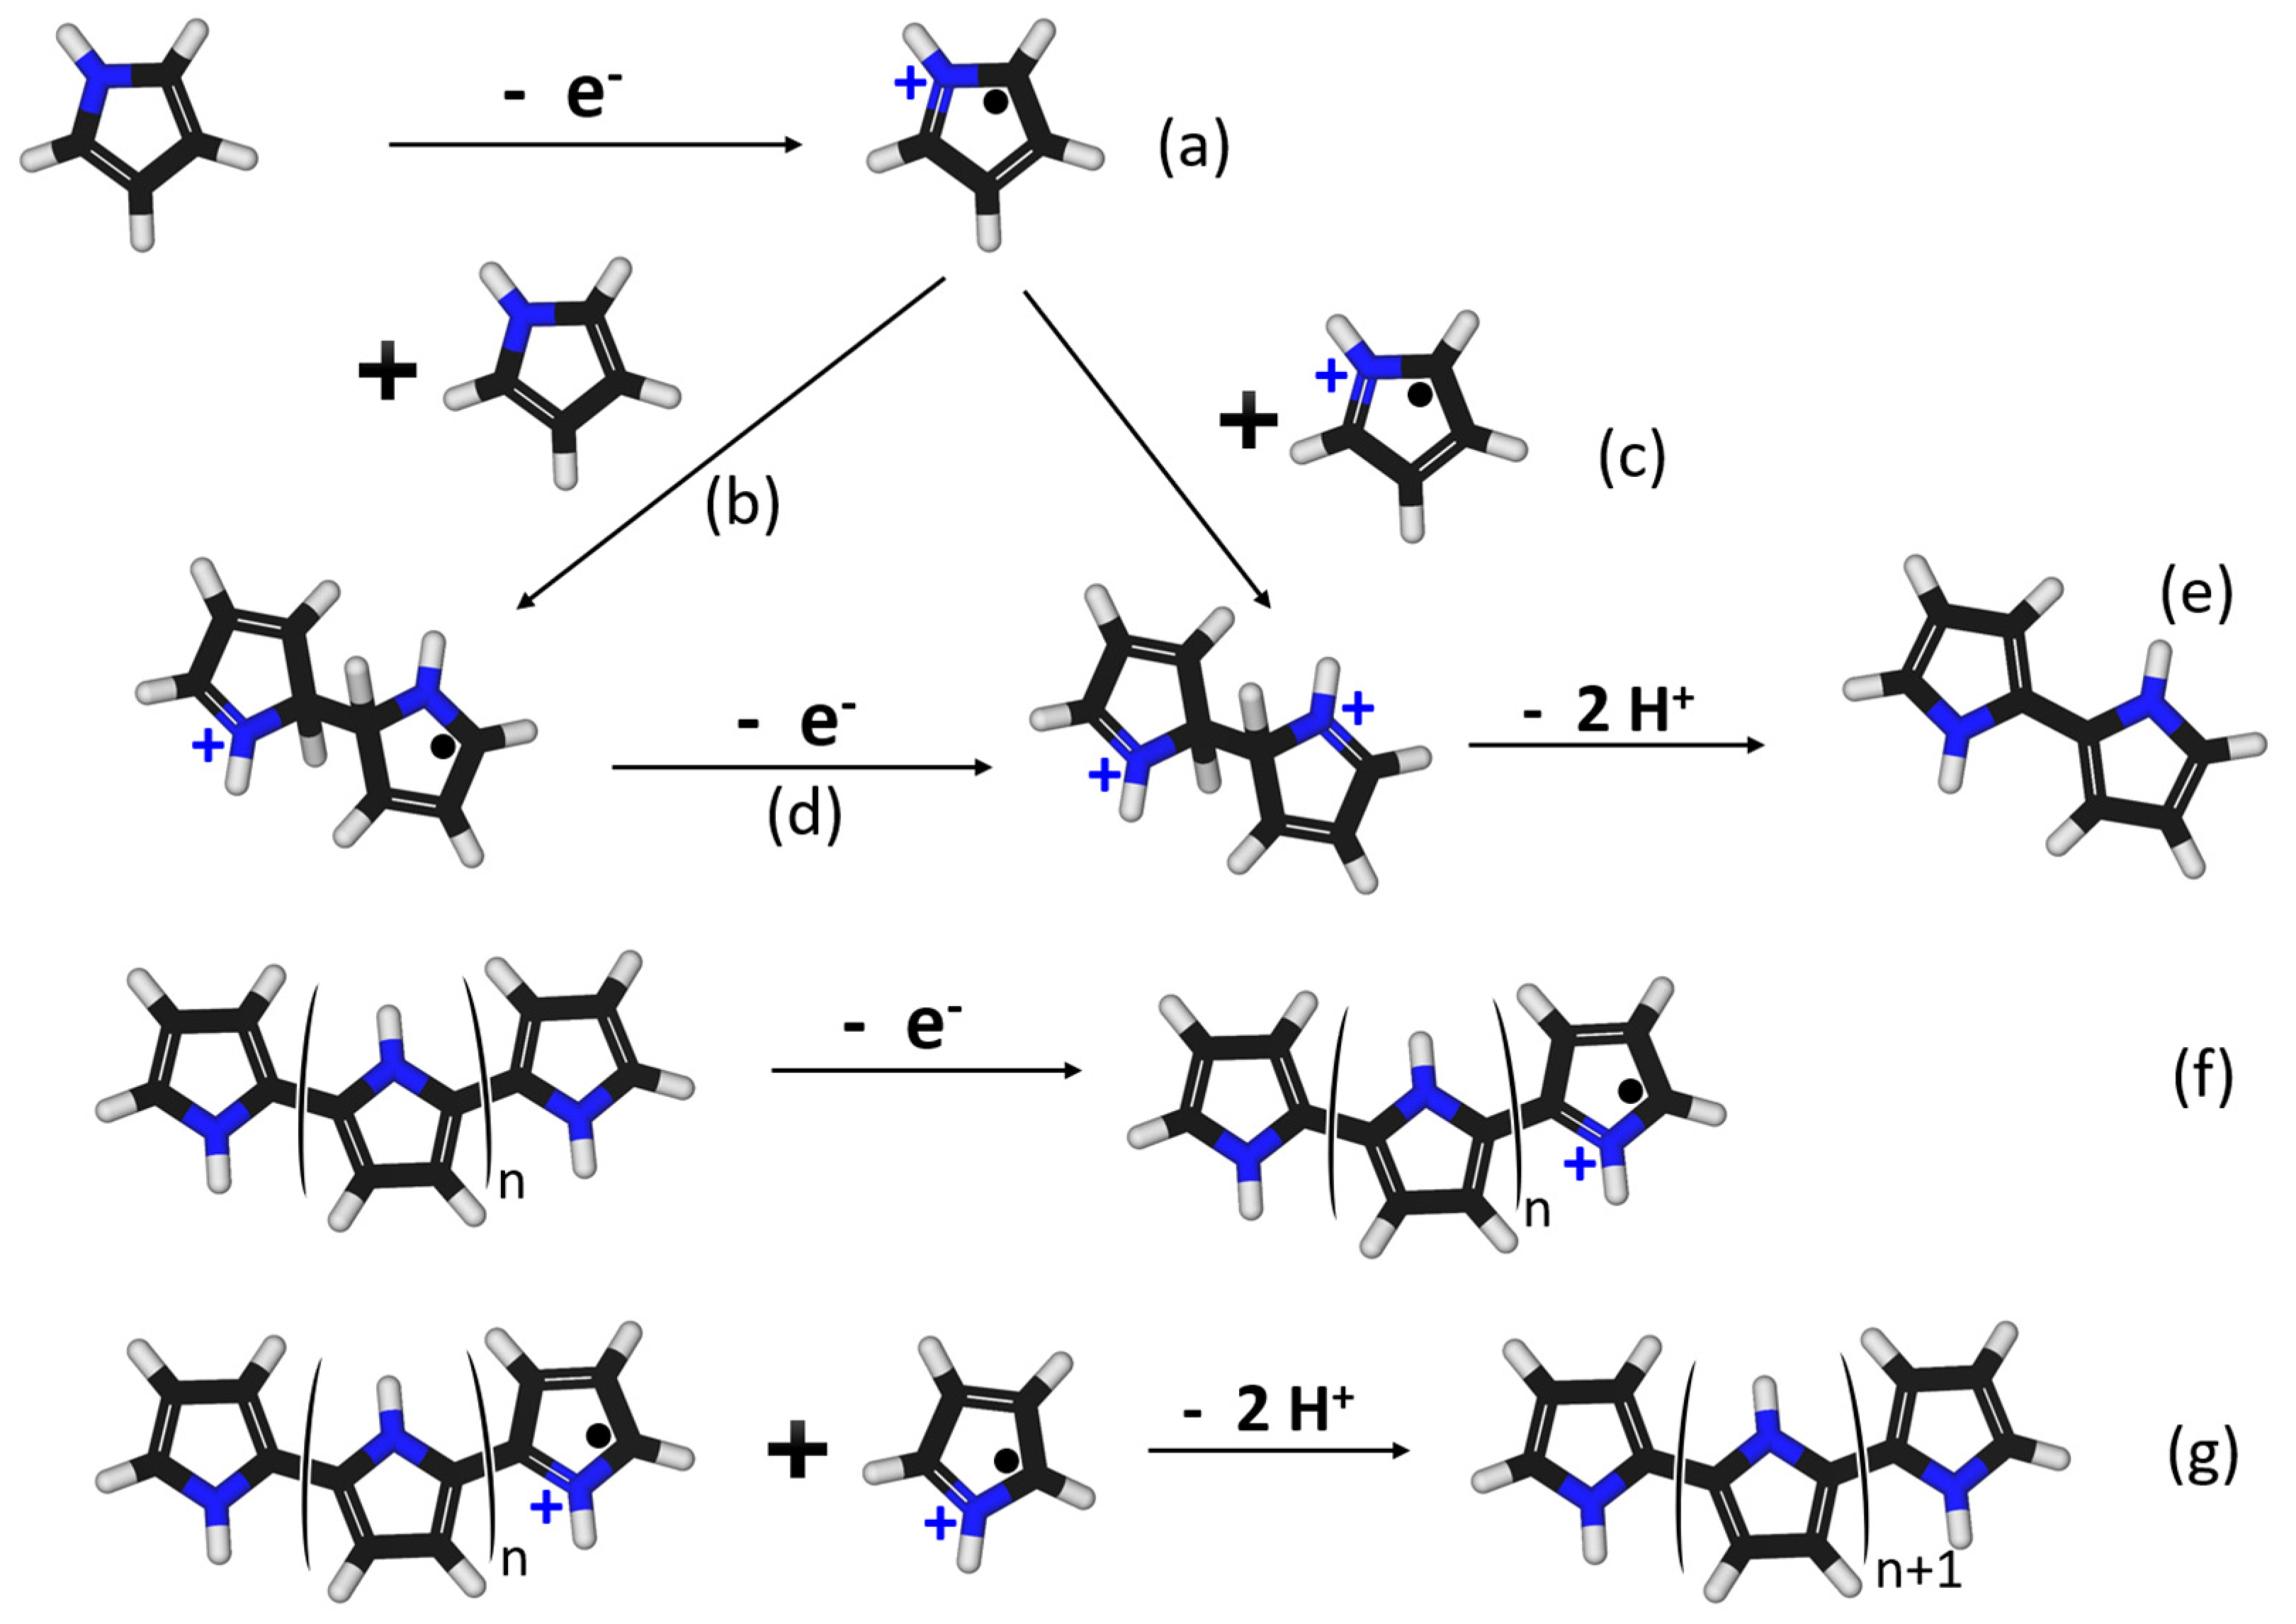
The kinetics analysis of this oxidation has been performed at different temperatures in order to fully understand the polymerization mechanisms. Yet, the mechanisms of PPy polymerization are not unanimously accepted. The most known and the most widely accepted mechanism consists in the coupling of 2 radical cations resulting from 2 pyrrole monomer oxidation as presented in Figure 4a (resulting from a potential applied at an anode for the electropolymerization, or from the reaction with a chemical oxidizing agent, for chemical oxidation) [23]. Then the coupling may occur, forming bipyrrole, the dimer (cf. Figure 4c,e) [24]. This bipyrrole dimer is oxidized again and may couple with another monomer, dimer, or oligomer (cf. Figure 4f) to finally end up with a polypyrrole chain after the reaction between two cations (cf. Figure 4g).
However, some more recent studies showed that the polymerization steps in water are a bit different. Indeed, NMR studies demonstrated that the initiation step is composed of pyrrole radical cation reacting with pyrrole monomers (cf. Figure 4b) to give a dimeric radical cation which will eventually be oxidized into a dication (cf. Figure 4d) which will be reduced into the pyrrole dimer. Following that, the propagation step will consist of the oligomer chains reacting with oxidized cationic monomers or oligomers. The termination step is the same as the one presented in the first mechanism (cf. Figure 4g) [25].
Pyrrole and 3-carboxylic acid copolymer follow the same polymerization behavior as polypyrrole. At the studied temperature, 30 °C, the polymerization kinetics between the copolymer and the homopolymer are comparable. However, it has been observed that varying the polymerization temperature can greatly alter the nature of the copolymer. It will therefore be very important to control and keep this temperature at a constant value for the different syntheses to come [26]. The main point is that the polymerization of this copolymer will be similar to that of the homopolymer, and that the functional monomer will be well integrated into the polymer alongside the cross-linking monomer. This is encouraging for the synthesis of a molecularly imprinted polymer [27,28].
This reaction decreases the pH of the solution. Under pH 4, the polymerization of pyrrole is little affected by the pH value. Above this value, the reaction is slower and requires a strong oxidizing agent.
A NICP is systematically synthesized with each MICP in order to provide a comparative analysis of the results obtained in terms of sensitivity. Their synthesis simply consists in replacing the PenG with an equivalent volume of demineralized water.
After every synthesis, samples are immersed in a mixture of methanol (98% wt.) and hydrochloric acid (fuming, 37% wt.) in a respective volume ratio of 9:1 for 2 h [29]. Then, the substrates are immersed for around 1 min in demineralized water.
Samples are stored in Petri dishes at least 24 h after the extraction step before doing any measurement.

3. Results and Discussion

3.1. Characterization

3.1.1. Extraction Efficiency

The extraction step operation is checked with a quartz crystal microbalance (QCM) device and reveals a deposit mass of 47 µg/cm² and a negative variation mass of that deposit of 0.5 µg/cm² after the extraction step, which represents about 1% of the total mass.

3.1.2. SEM Observation

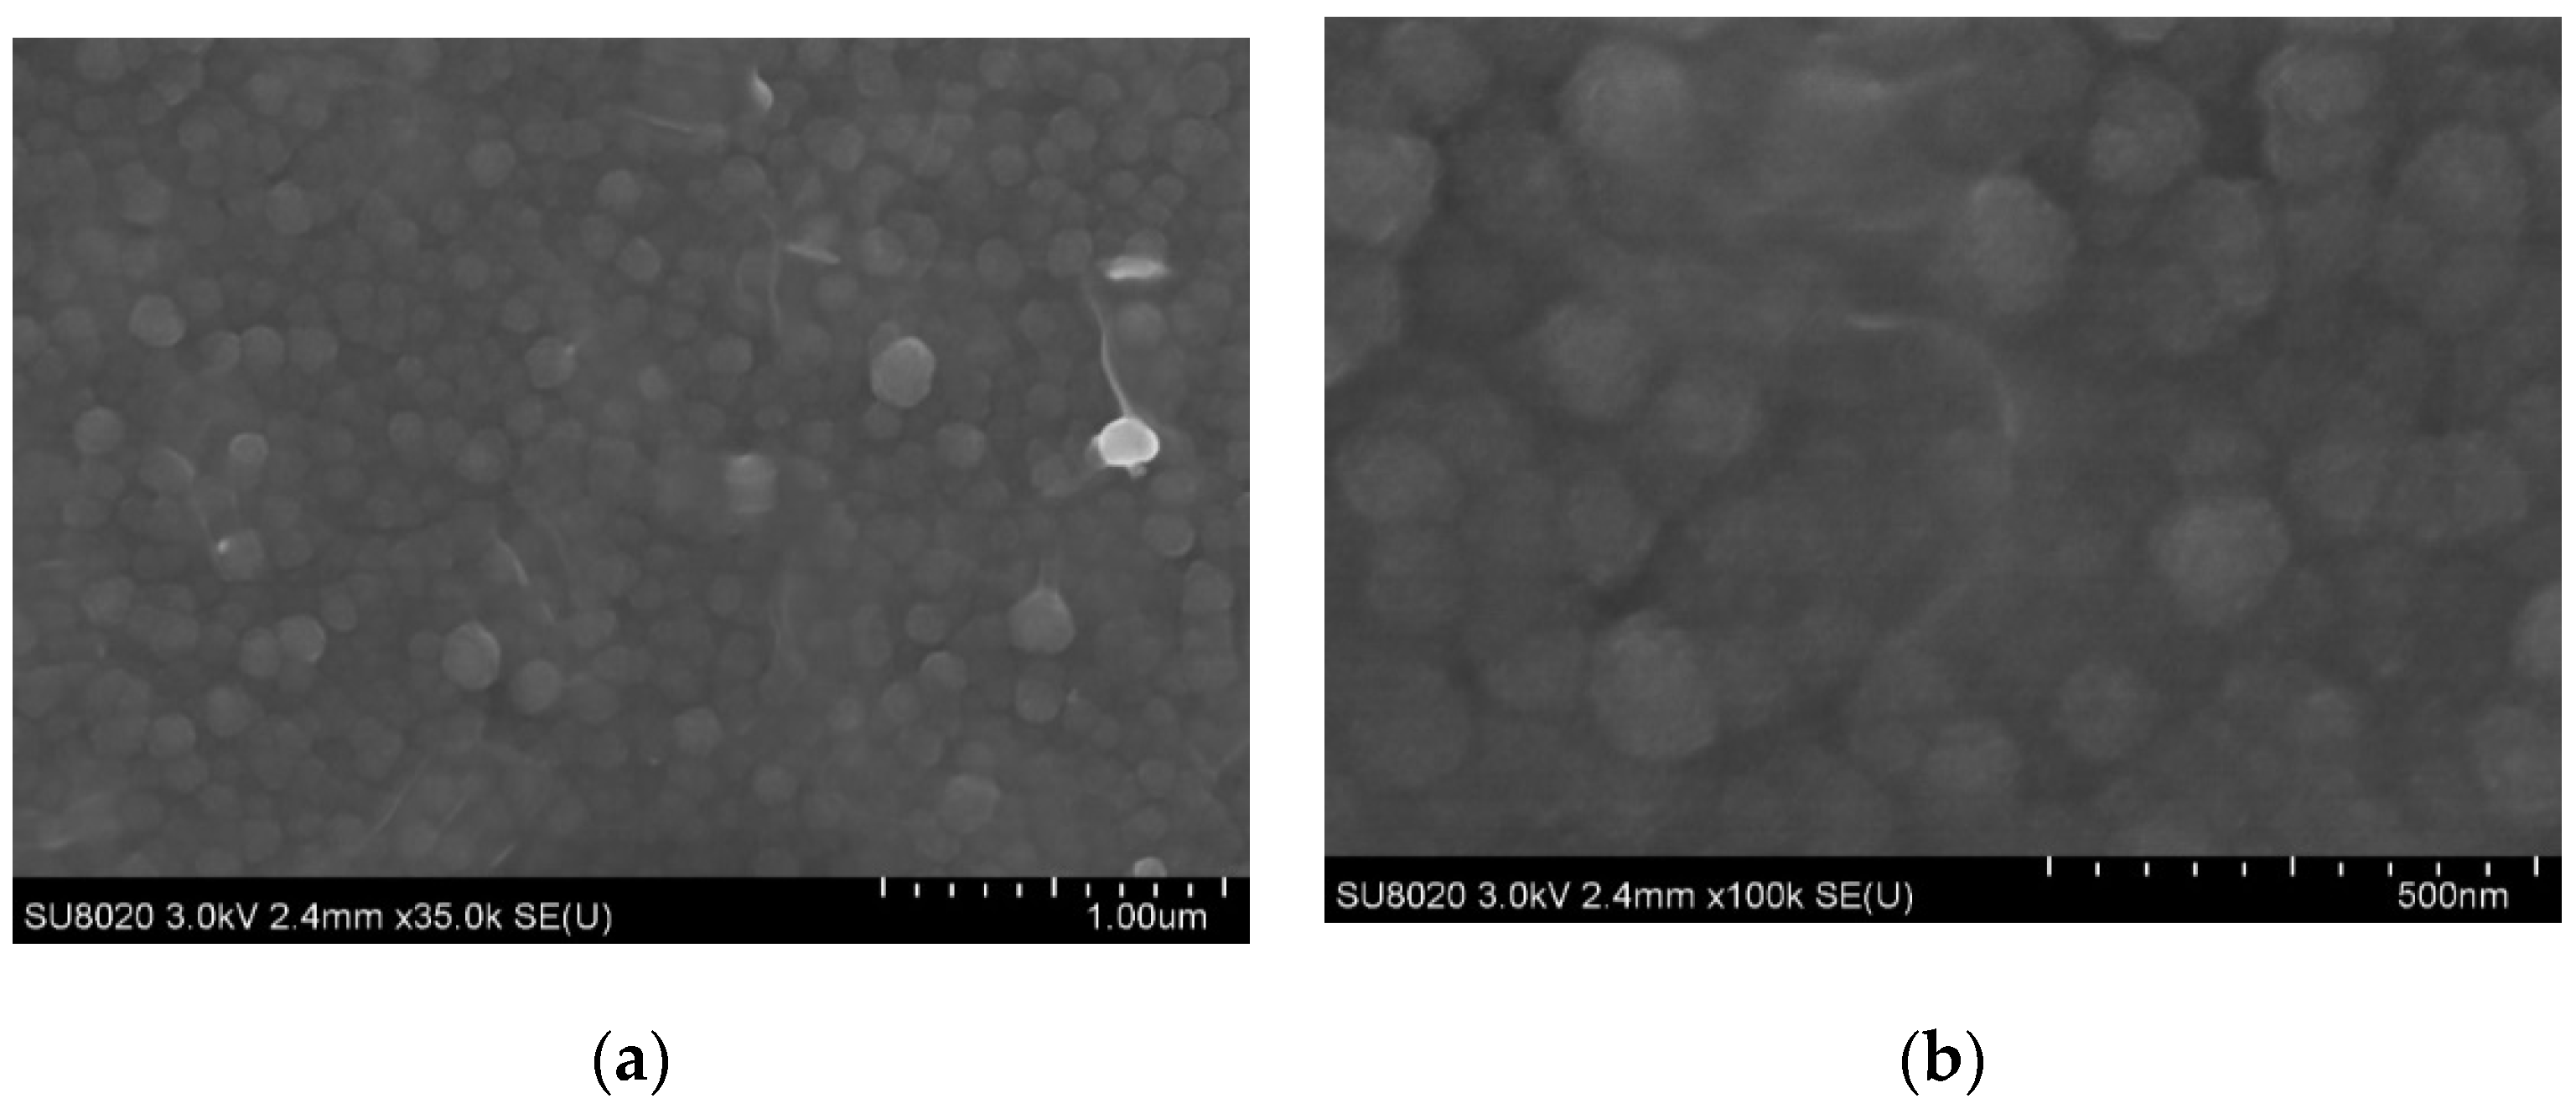
Morphological analysis has also been made on the sensitive layer. Pictures have been taken by Scanning Electron Microscopy (SEM) (see Figure 5). It clearly appears that the obtained microstructure corresponds to the common polymer microstructure, which is a cauliflower structure.

3.1.3. Thickness Measurements

Glass slides were used to conduct thickness measurements of the deposited polymer, with the profilometer, since this is one of the most uniform and planar substrates. After about 20 min of polymerization, the optimal deposit thickness is reached. The polymerization is interrupted to begin the extraction step and drying step of the polymer. Then measurements are made on multiple substrates. The mean thickness is about 1.5 µm ± 0.1 µm.

3.2. Sensor’s Performances

As the final objective of these sensors is to perform measurements in milk, in order to get as close as possible to this type of media, a phosphate-buffered saline (PBS) solution (twice diluted) is used to perform the measurements. This means that instead of using a 1× PBS solution, a 0.5× PBS solution is used. This solution has a similar conductivity and pH as milk. The measurements are performed by electrochemical impedance spectroscopy (EIS) in this solution.

3.2.1. Sensitivity

Classical EIS measurements are performed with them samples electrically linked to a potentiostat. This implies the use of a 3-electrodes system. The counter and working electrodes are linked to the two electrodes of the IDE samples (see Figure 3). As we do not need a referenced value for the potential, the reference electrode is short-circuited to the counter electrode. The measured frequencies are taken in 40 points going from 16 mHz to 1 mHz (voltage amplitude = 10 mV, 0 V bias). They are performed in 40 mL of a 0.5 PBS solution at 25 °C. Each PenG addition is performed after a measurement is done, in the PBS solution, which is stirred strongly for a minute, while the sensor is emerged. Later, the sensor is immersed again in the PBS solution and left in contact with that solution without agitation for 15 min, in order to allow the PenG to diffuse on and in the polymer matrix.
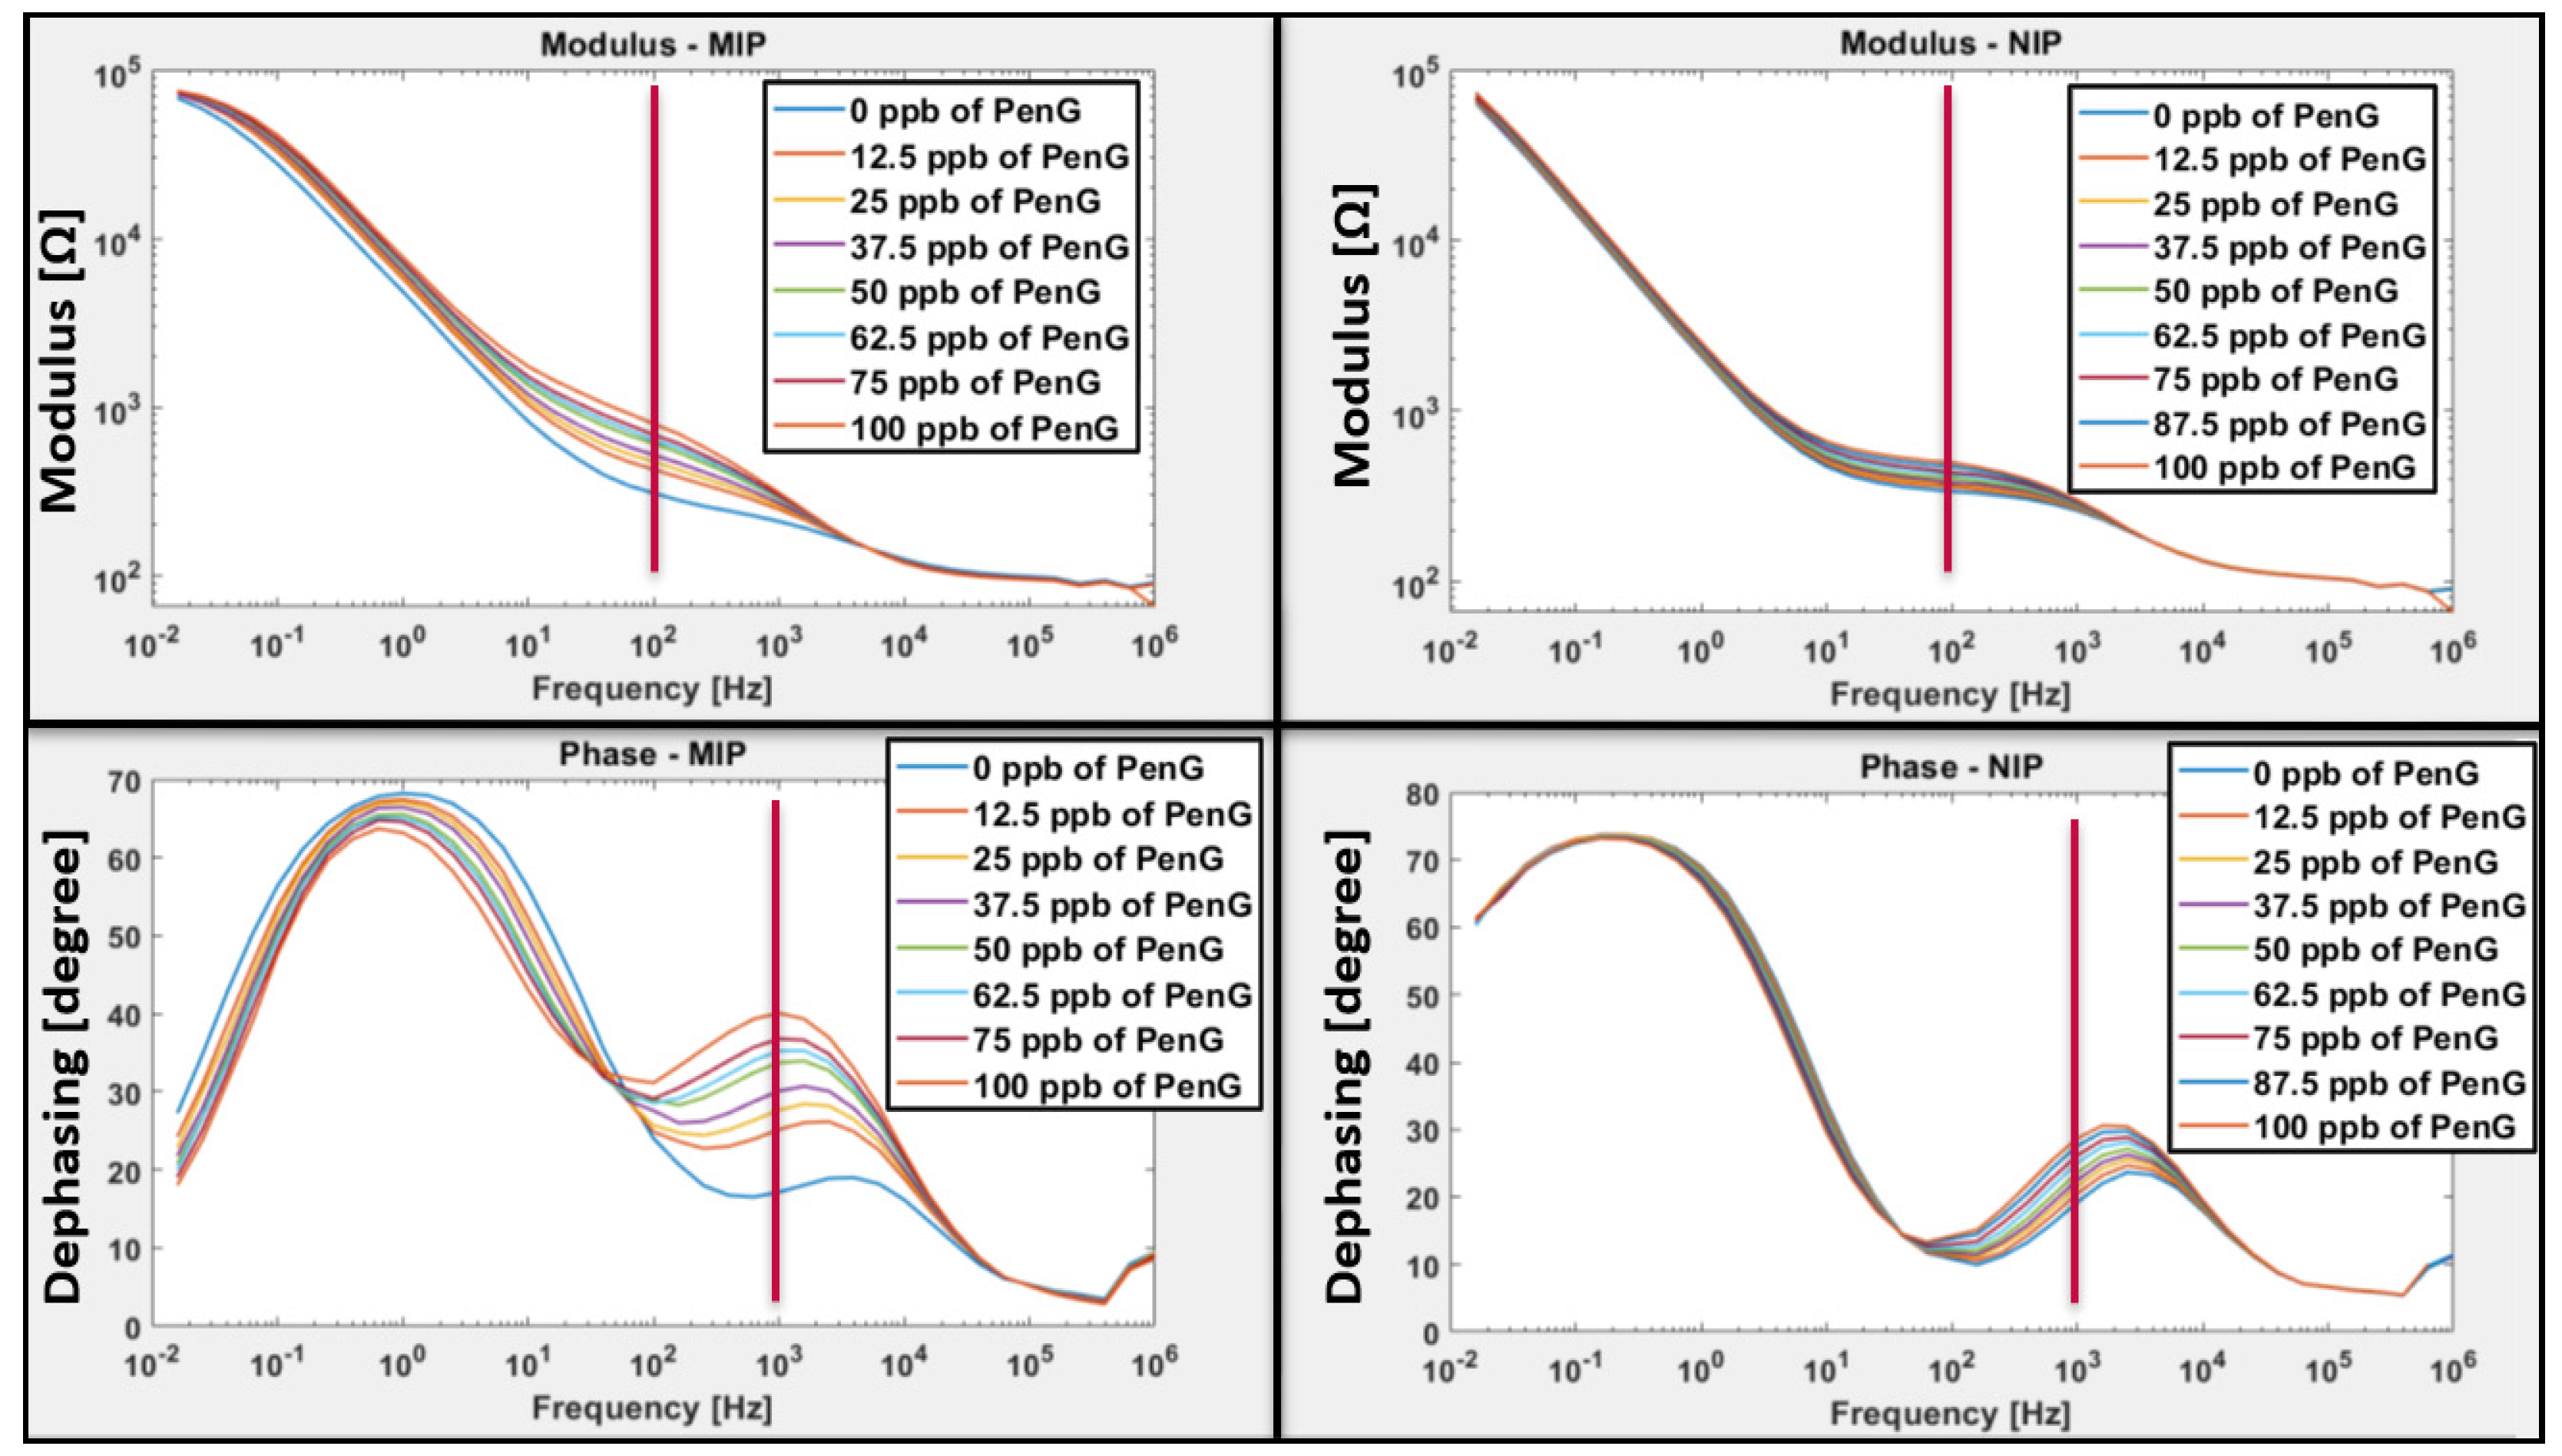
The EIS curves show indeed a clear signal variation. An example of a sensor is presented in Figure 6. The graphs show the modulus (on the upper part) and the phase (on the lower part) of the impedance. The MIP results are shown on the left and the corresponding NIP results are shown on the right. On these graphs, each data curve corresponds to a PenG concentration increase of 12.5 ppb. At 63 Hz for the magnitude and 1000 Hz for the phase, significant signal variation can be observed, and it seems quite linear. These chosen frequencies are highlighted with the red line in Figure 6.
To make the choice of the frequency more reproducible than a simple observation, an automatic analysis is performed thanks to a MatLab code designed for this analysis at all frequencies between 20 mHz and 100 kHz. Within this frequency range, the program will therefore define the frequency for which the relative variation of the phase and modulus values is the most important between the first and the last measurement. A frequency will then be chosen in each case, and the values observed for these frequencies will then be compared as a function of the concentration.
The response signal variation is presented in percent and is calculated as follows:
Signal response variation (in percent) = (R − R0)/R0 ∙ 100
With R0, the first response signal before any addition of analyte, and R, the response signal at a given concentration.
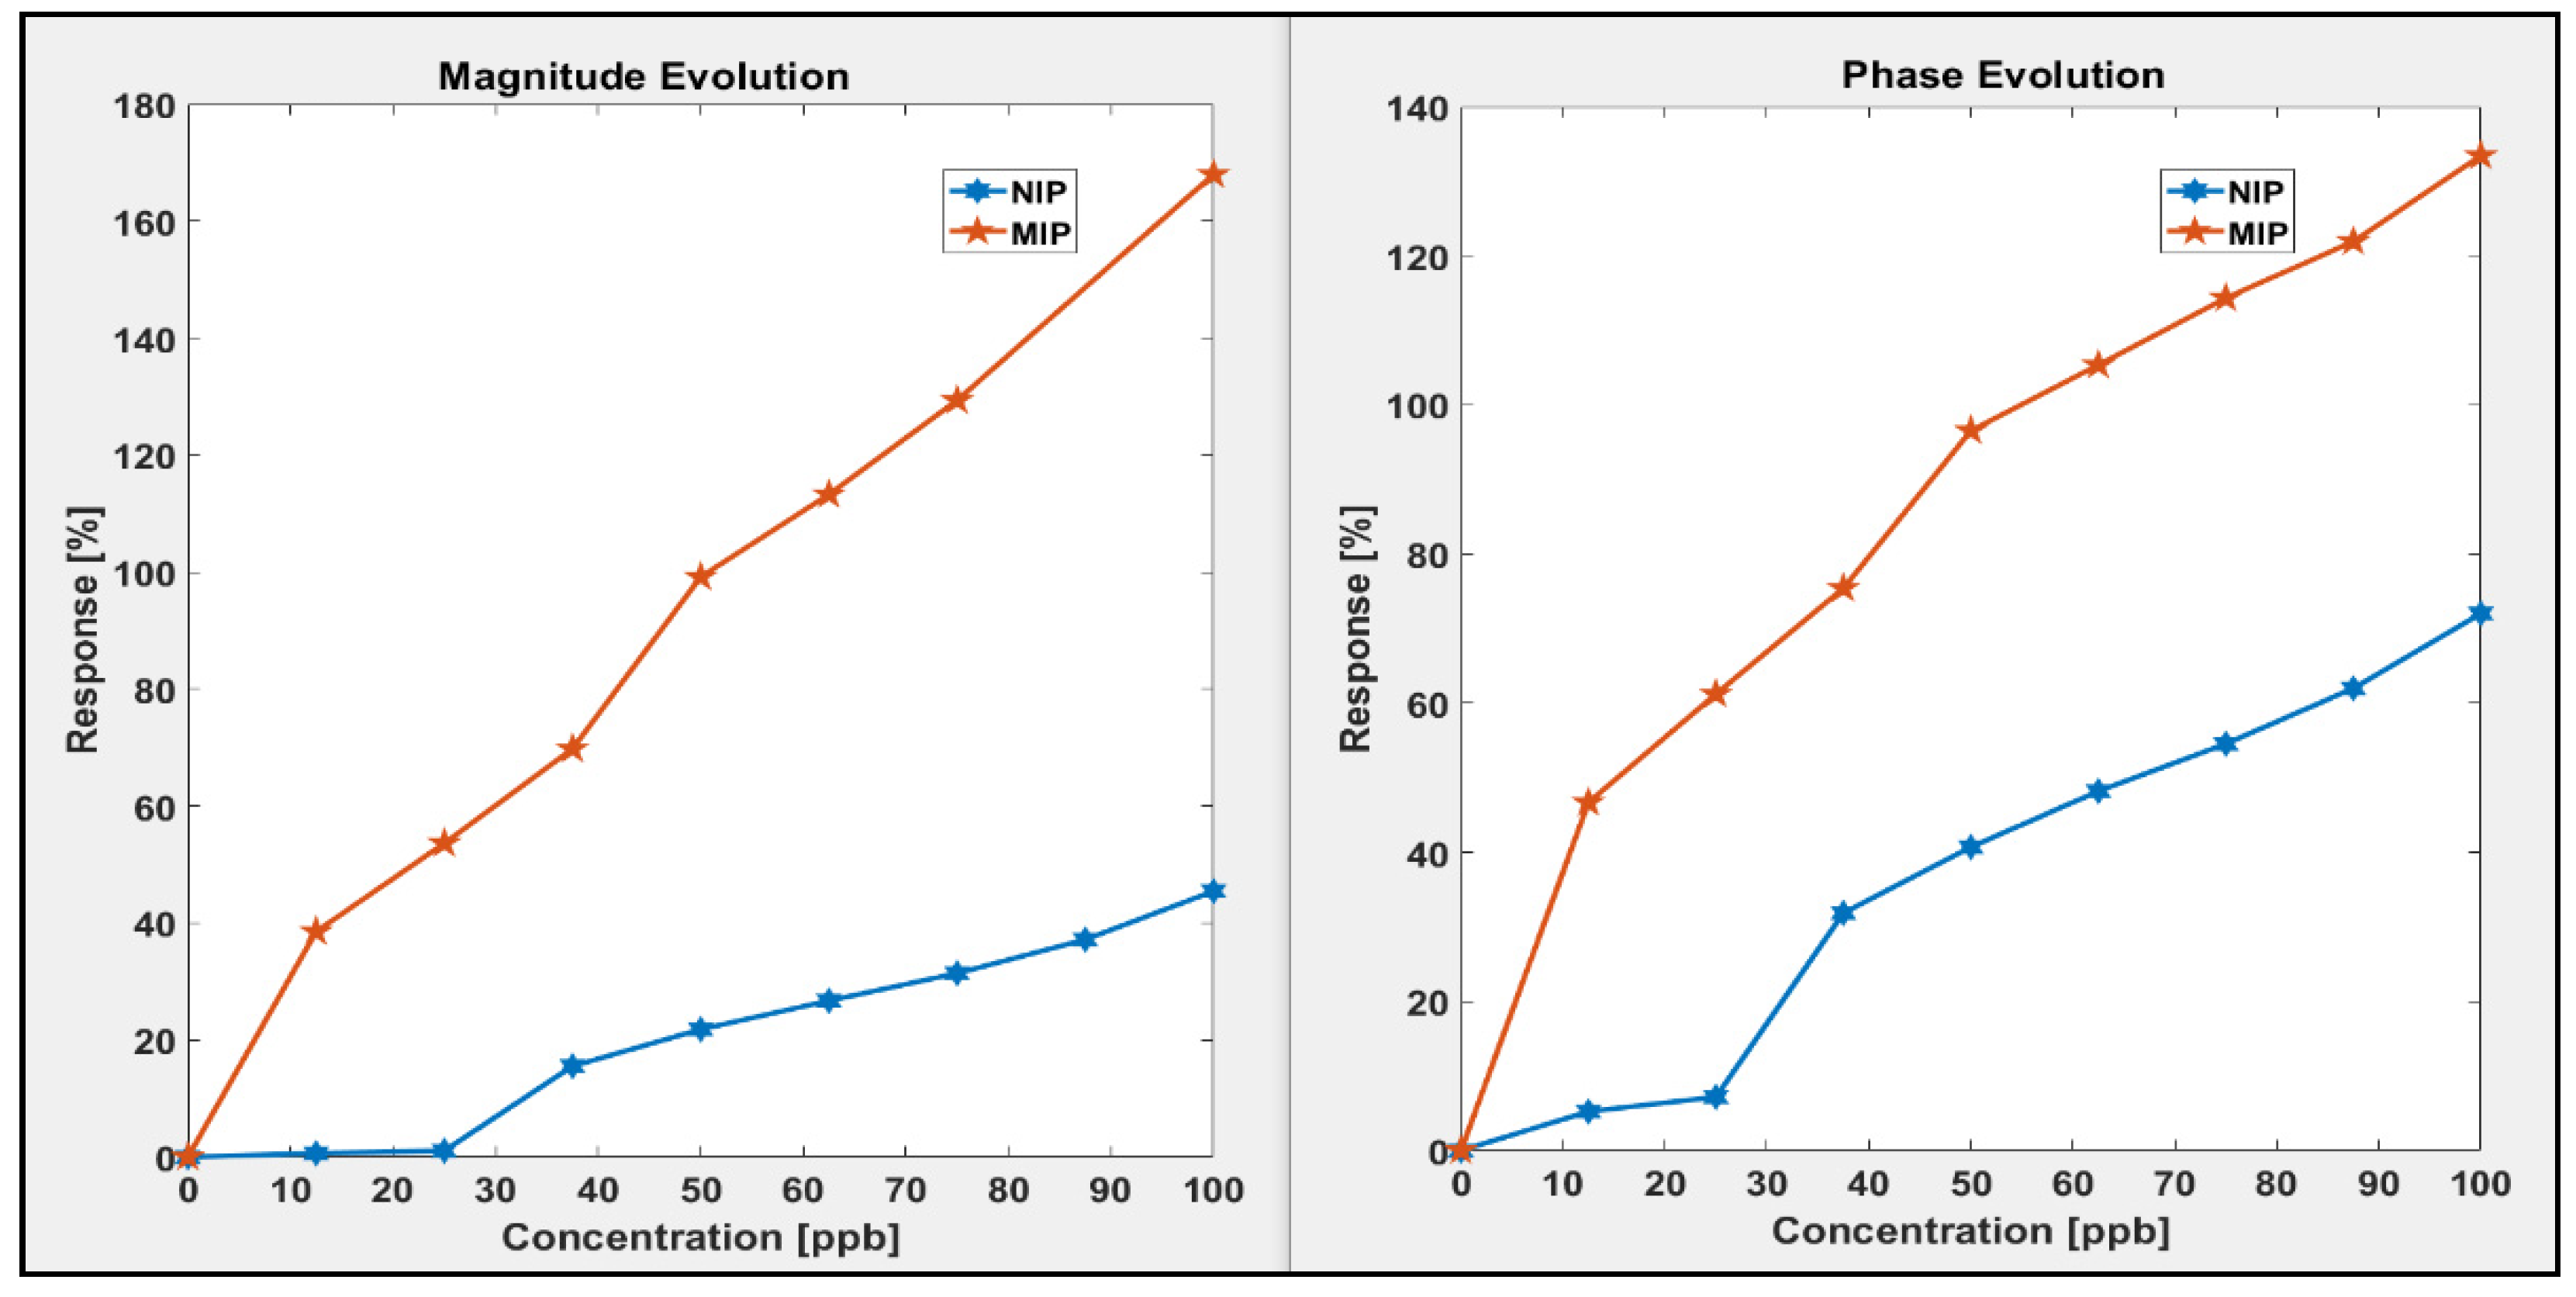
To ensure this, it is important to draw a graph of the signal response versus the PenG concentration, as it is presented in Figure 7. The curves are obtained thanks to the MATLAB code explained earlier. There, it is possible to observe the difference between the response signal of MIP and NIP. Here, it can clearly be seen that the MIP give significantly better results than the NIP, both in phase and in modulus. This demonstrates the MIP effect and its efficiency as well as the fact that the sensor is working properly.

3.2.2. Reproducibility and Selectivity

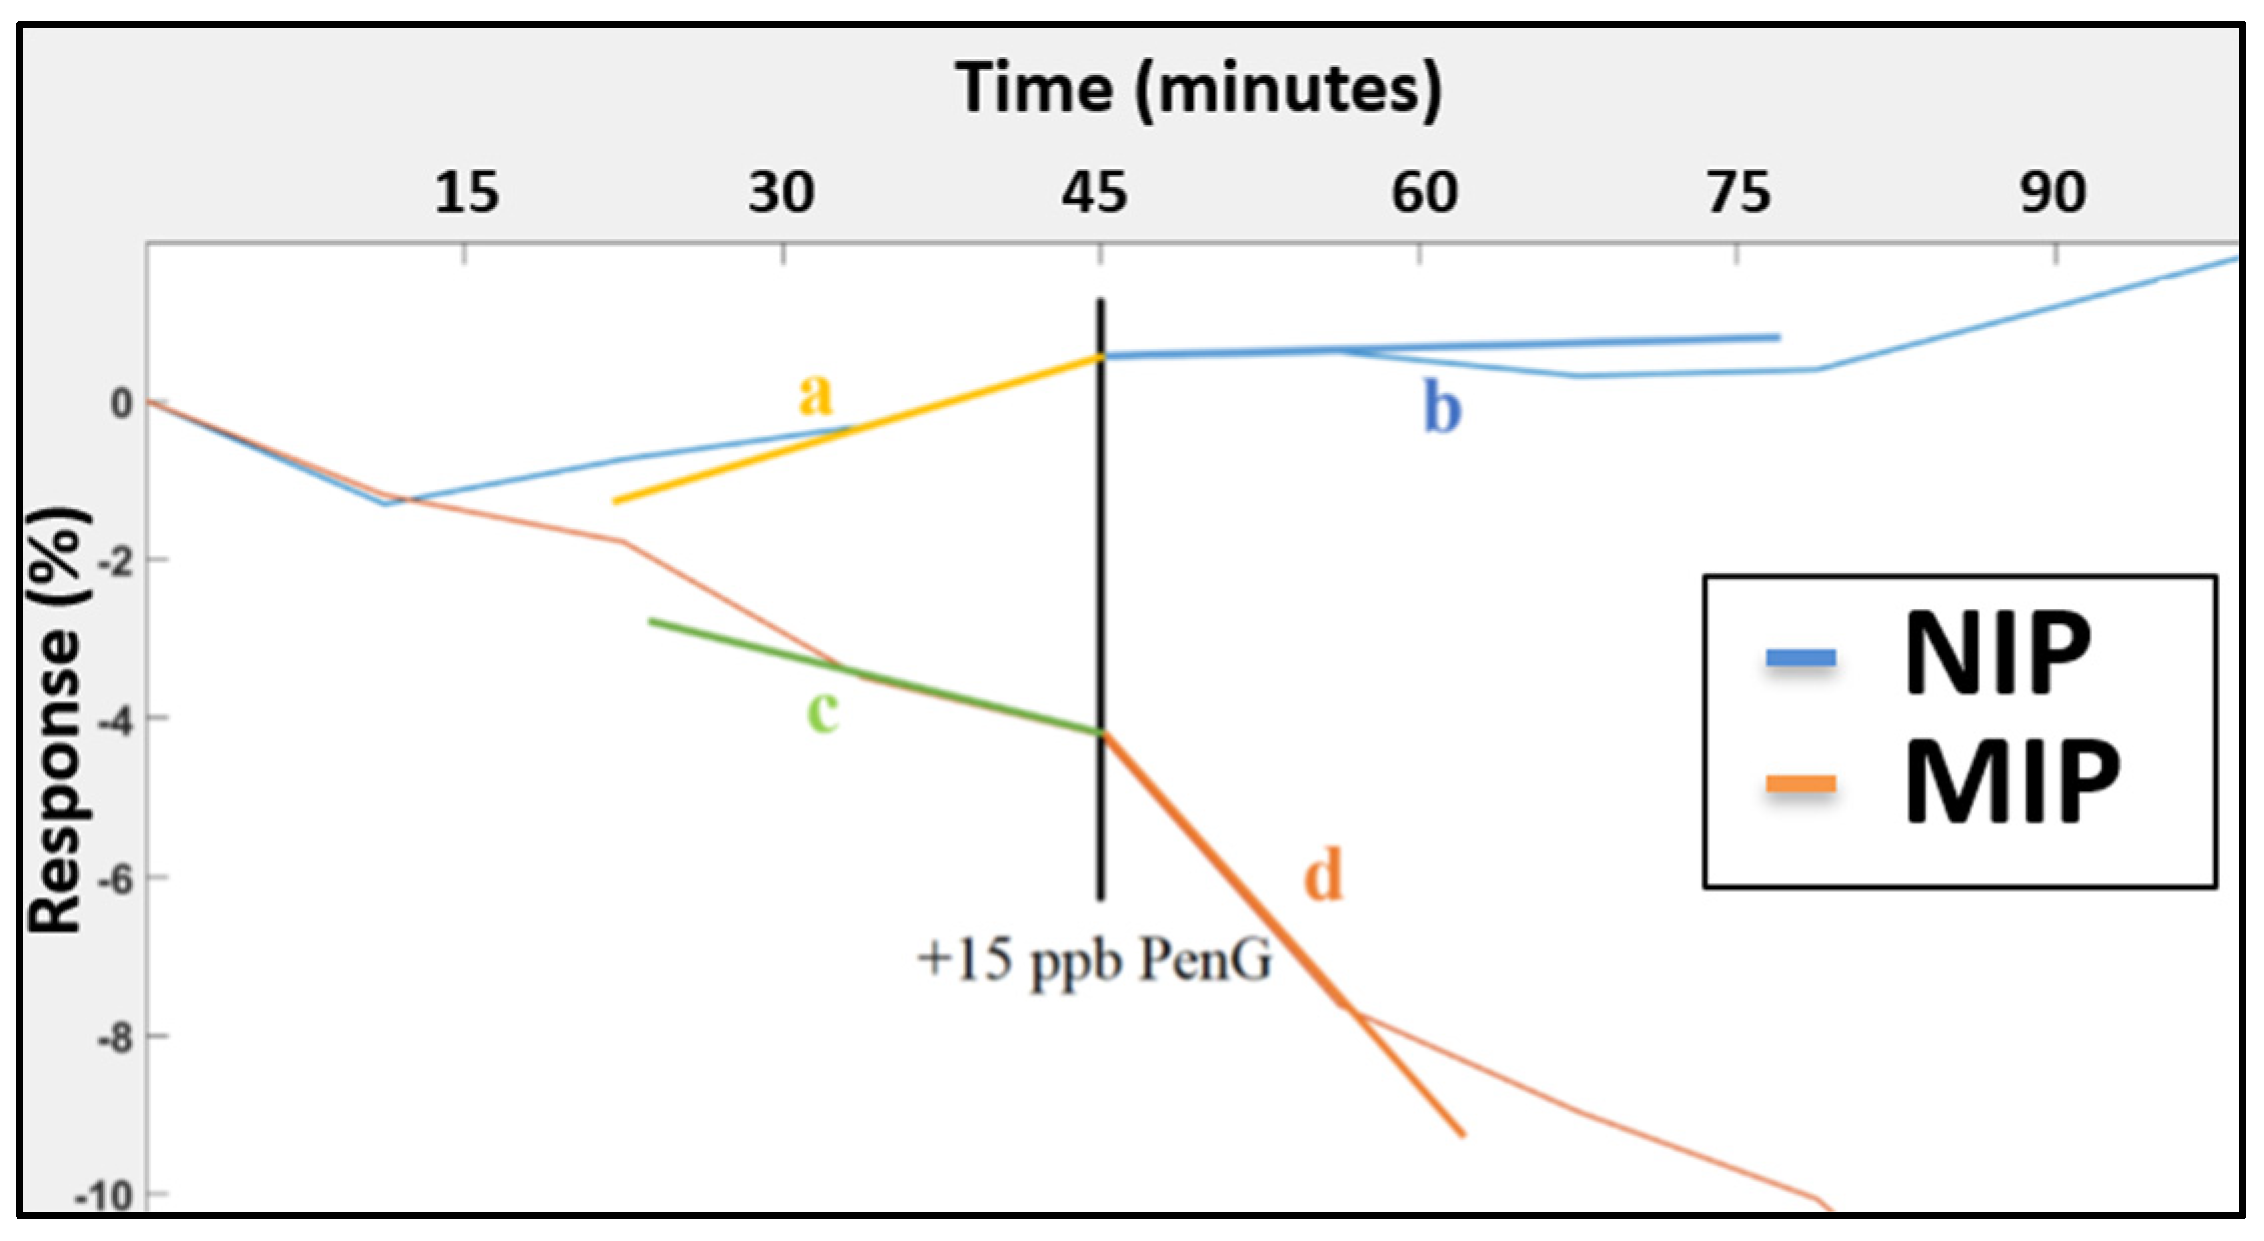
To quantify the efficiency of the detection, we characterize the evolution of the slope of the curve before and after the detection. In practice, measurements are conducted at 15 min intervals until stability is observed (characterized by at least three overlapping curves, especially on Bode diagrams). PenG is added to reach a solution concentration of 15 ppb. This addition is made just after obtaining the last stability curve. The following measurements are made 15 min later and every 15 min as well, until at least three measurements are obtained. To quantify the efficiency of the detection, the most relevant method is to characterize the evolution of the slope of the response curve (as Figure 7, for example) before and after the detection. In other words, the greater the angle between the two, the better the detection.
In the example presented in Figure 8, we can conclude that the MIP exhibits a better detection efficiency than the NIP since we measure:
MIP efficiency: |c − d| > NIP efficiency: |a − b|
Hereafter, for these experiments, the results will be expressed in this way. Since we are dealing with the slopes of lines characterizing a response in percent as a function of time, we will qualify the importance of this efficiency by arbitrary units (noted “a.u.”, thereafter).
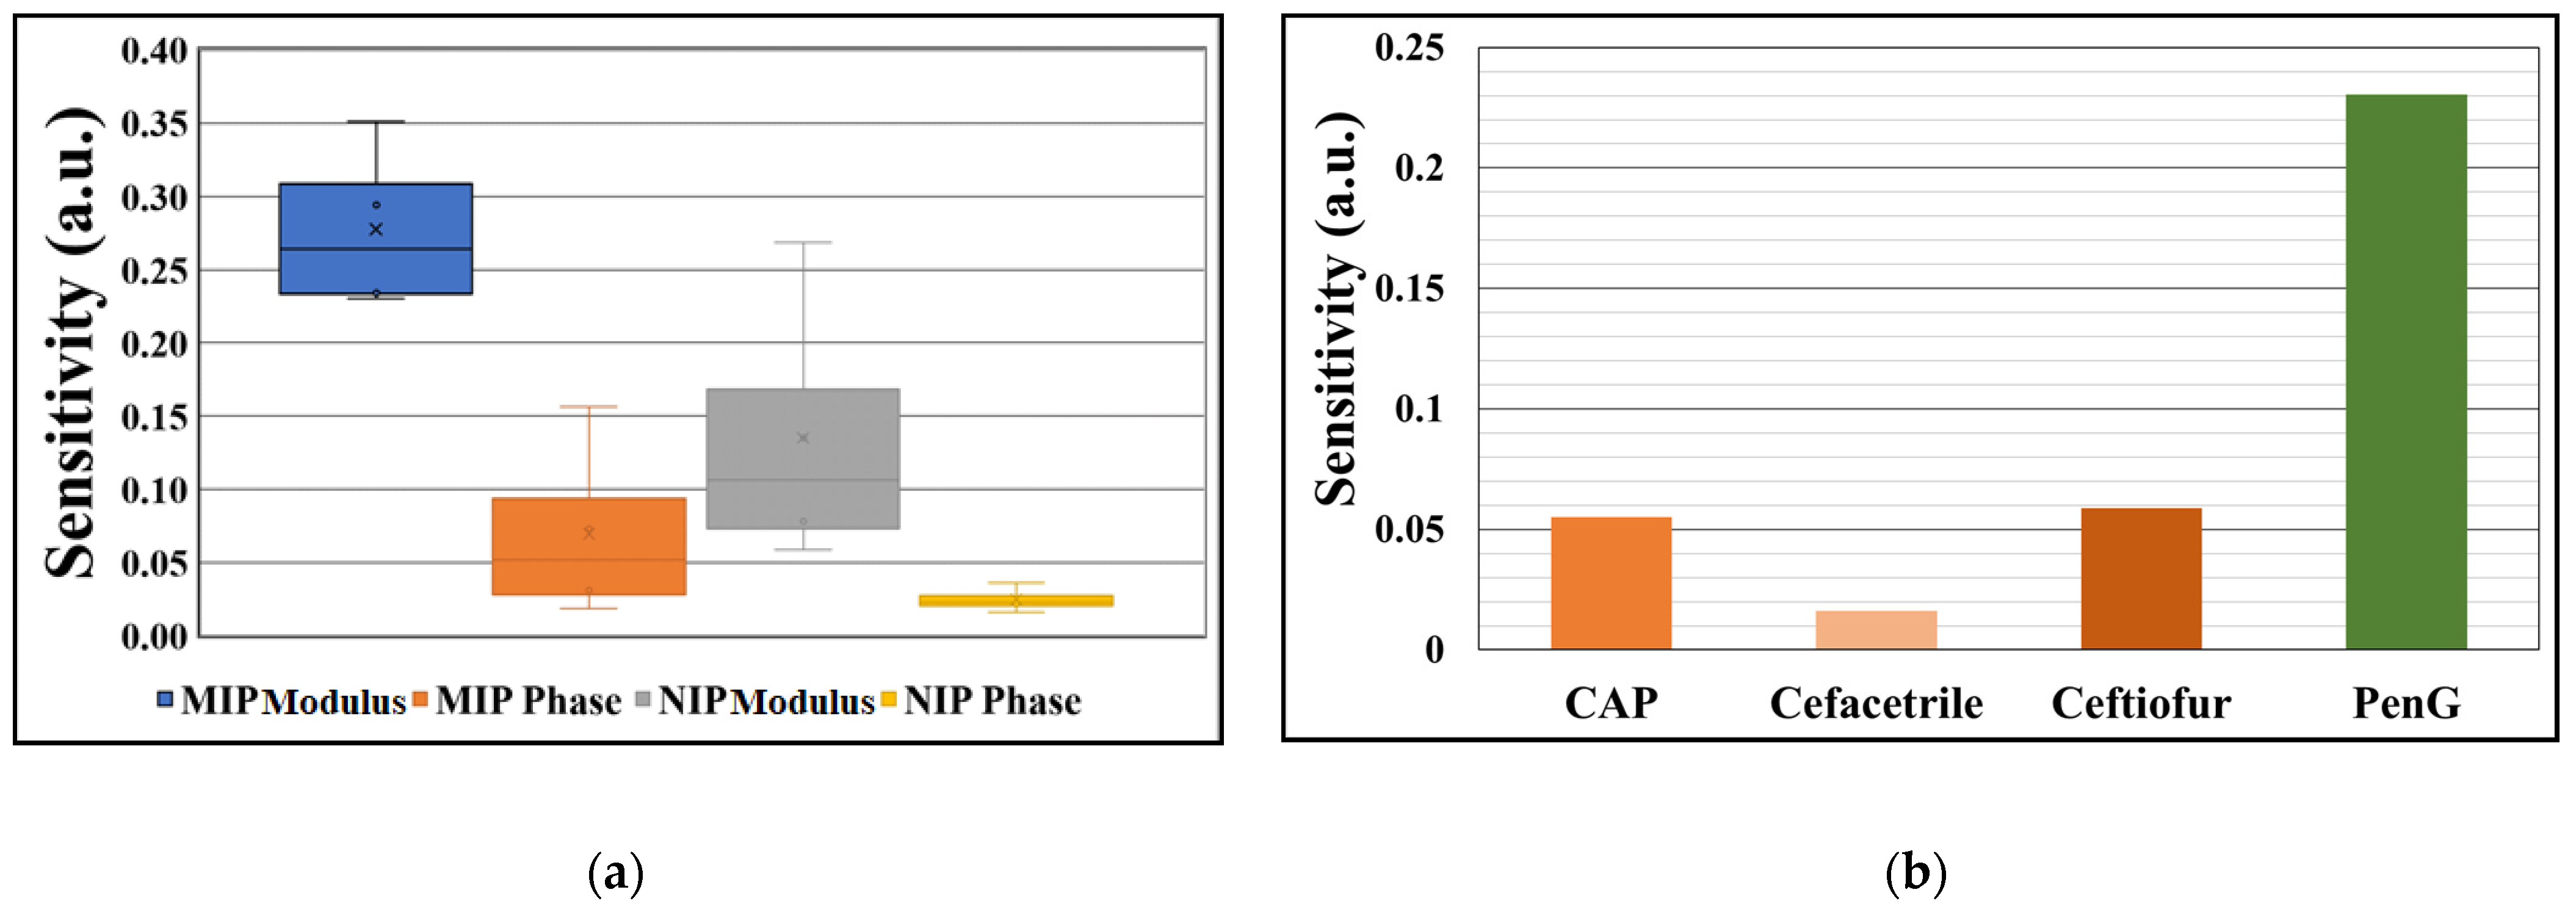
The signal variation measured for these different sensors in module and phase is presented in Figure 9a. This graph shows data from five MIP samples and four NIP samples. As expected, and as often observed, the sensitivity measured when observing the modulus is bigger than when observing the phase. It clearly appears that, for the phase as for the modulus, the sensitivity of the sensors is better for the MIPs than for the corresponding NIPs and this seems reproducible.
This kind of sensor analysis also allows to observe the reliability of the obtained measurements. In module, the average of the sensitivities is approximately 0.27 with a standard deviation of 0.05. This represents a variation of almost 20%, which is quite high. In phase, on the other hand, the results are less good. Indeed, in Figure 9a, it can be observed that the phase variation is much lower than the Modulus variation. Moreover, some phase results obtained for MIPs are close to the ones obtained for NIPs. This highlights the fact that it is preferable to work in modules and not in phases to obtain the most accurate measurements possible.
Demonstrating the selectivity of a MIP sensor is a necessary step to demonstrate the primary value of a MIP. This verification is therefore crucial to be able to affirm that this sensor is relevant. In the case of interference measurements, only MIPs are used to conduct the tests.
To verify this selectivity, the added molecule for the detection tests is generally close to the target molecule, in terms of size, functional groups, and shape. But it can also be a molecule often present in the medium interfering with the other measurement methods. Chloramphenicol (CAP) belongs to this category. It is a natural antibiotic that is artificially manufactured for veterinary and human medicine (cf. Figure 10a).
Other interferents were also used to verify the selectivity of PenG. In particular, molecules strongly similar to PenG and from the same family will be used: the β-lactams. The focus here is on Cefacetrile (cf. Figure 10b) and Ceftiofur (cf. Figure 10c).
For the interference measurements, the 15 ppb of PenG are replaced by 15 ppb of the tested interferent. The results obtained for these measurements can be observed in the Figure 9b. From left to right, the measurements are compared for CAP, Cefacetrile, and Ceftiofur for the modulus measurement. The sensitivity value is compared, for each interferent, for the addition of 15 ppb. Finally, all these values are compared with one of the sensors in contact with a solution of 15 ppb of PenG (in green).
The easiest conclusion to draw from this graph is that the modulus response when the sensor is subjected to a concentration of 15 ppb of PenG is always much higher (at least four times higher) than those observed for the same amount of the different interferents tested. We can therefore deduce from all this that the sensor seems more sensitive to PenG than to the other interferents tested, despite their similarity.

4. Conclusions

The results show the feasibility of using conductive polymers as the basis for impedimetric penicillin G sensors. In particular, a pyrrole/pyrrole-3-carboxylic acid molecularly imprinted co-polymer seems to be a suitable material for this application. The obtained sensors give good sensitivity to penicillin G. This shows the interest in synthesizing MICP instead of a common co-polymer. It has also been shown that these sensors provide reproducible and trustworthy results. Moreover, the sensors exhibit good selectivity and are less sensitive to common interferents of penicillin. The obtained response for a 15 ppb solicitation gives reproducible results, at least for the modulus.
The best sensors presented in this experimental part exhibited interesting performances. Their sensitivity seems to be nearly linear over the 12.5–100 ppb range. These detection performances are in perfect accordance with what was initially required in the specifications of the sensors.

Author Contributions

Conceptualization, D.L. and M.D. (Marc Debliquy); Investigation, H.C. and M.D. (Mariel David); Methodology, D.L.; Supervision, M.D. (Marc Debliquy); Writing—original draft, H.C.; Writing—review & editing, D.L. and M.D. (Marc Debliquy). All authors have read and agreed to the published version of the manuscript.

Funding

This research was funded by the ERDF project “Micro +”. D. Lahem acknowledges support from the program Win4Collective of Wallonia Region through the SensoPro project.

Acknowledgments

The authors would like to thank Victoria Dupiereux for her important contribution to the results presented in this article.

Conflicts of Interest

The authors state that there is no conflict of interest.

References

  1. Rehman, M.S.U.; Rashid, N.; Ashfaq, M.; Saif, A.; Ahmad, N.; Han, J.I. Global risk of pharmaceutical contamination from highly populated developing countries. Chemosphere 2015, 138, 1045–1055. [Google Scholar] [CrossRef] [PubMed]
  2. Sachi, S.; Ferdous, J.; Sikder, M.H.; Hussani, S.M.A.K. Antibiotic residues in milk: Past, present, and future. J. Adv. Vet. Anim. Res. 2019, 6, 315–332. [Google Scholar] [CrossRef] [PubMed]
  3. Pawlowski, A.C.; Wang, W.; Koteva, K.; Barton, H.A.; McArthur, A.G.; Wright, G.D. A diverse intrinsic antibiotic resistome from a cave bacterium. Nat. Commun. 2016, 7, 1–10. [Google Scholar] [CrossRef] [PubMed] [Green Version]
  4. Moro, G.; Bottari, F.; Sleegers, N.; Florea, A.; Cowen, T.; Moretto, L.M.; Piletsky, S.; De Wael, K. Conductive imprinted polymers for the direct electrochemical detection of β-lactam antibiotics: The case of cefquinome. Sens. Actuators B Chem. 2019, 297, 126786. [Google Scholar] [CrossRef]
  5. Smith, R. Commission Regulation (EU) No 330/2010. Official Journal of the European Union, 2010. Available online: https://ec.europa.eu/health/sites/health/files/files/eudralex/vol-5/reg_2010_37/reg_2010_37_en.pdf (accessed on 7 April 2022).
  6. Babington, R.; Matas, S.; Marco, M.P.; Galve, R. Current bioanalytical methods for detection of penicillins. Anal. Bioanal. Chem. 2012, 403, 1549–1566. [Google Scholar] [CrossRef]
  7. Cháfer-Pericás, C.; Maquieira, Á.; Puchades, R. Fast screening methods to detect antibiotic residues in food samples. TrAC Trends Anal. Chem. 2010, 29, 1038–1049. [Google Scholar] [CrossRef]
  8. Beltrán, M.C.; Berruga, M.I.; Molina, A.; Althaus, R.L.; Molina, M.P. Performance of current microbial tests for screening antibiotics in sheep and goat milk. Int. Dairy J. 2015, 41, 13–15. [Google Scholar] [CrossRef]
  9. Kantiani, L.; Farré, M.; Barceló, D. Analytical methodologies for the detection of β-lactam antibiotics in milk and feed samples. TrAC-Trends Anal. Chem. 2009, 28, 729–744. [Google Scholar] [CrossRef]
  10. Pietschmann, J.; Dittmann, D.; Spiegel, H.; Krause, H.J.; Schröper, F. A Novel Method for Antibiotic Detection in Milk Based on Competitive Magnetic Immunodetection. Foods 2020, 9, 1773. [Google Scholar] [CrossRef]
  11. Gustavsson, E.; Degelaen, J.; Bjurling, P.; Sternesjö, Å. Determination of β-Lactams in Milk Using a Surface Plasmon Resonance-Based Biosensor. J. Agric. Food Chem. 2004, 52, 2791–2796. [Google Scholar] [CrossRef]
  12. Kivirand, K.; Kagan, M.; Rinken, T. Biosensors for the detection of antibiotic residues in milk. In Biosensors—Micro and Nanoscale Application; InTech Open: Rijeka, Croatia, 2015. [Google Scholar] [CrossRef] [Green Version]
  13. Lamar, J.; Petz, M. Development of a receptor-based microplate assay for the detection of beta-lactam antibiotics in different food matrices. Anal. Chim. Acta 2007, 586, 296–303. [Google Scholar] [CrossRef] [PubMed]
  14. Song, K.M.; Jeong, E.; Jeon, W.; Cho, M.; Ban, C. Aptasensor for ampicillin using gold nanoparticle based dual fluorescence-colorimetric methods. Anal. Bioanal. Chem. 2012, 402, 2153–2161. [Google Scholar] [CrossRef] [PubMed]
  15. Liu, L.; Luo, L.; Suryoprabowo, S.; Peng, J.; Kuang, H.; Xu, C. Development of an Immunochromatographic Strip Test for Rapid Detection of Ciprofloxacin in Milk Samples. Sensors 2014, 14, 16785–16798. [Google Scholar] [CrossRef] [PubMed]
  16. Alidoust, M.; Baharfar, M.; Manouchehri, M.; Yamini, Y.; Tajik, M.; Seidi, S. Emergence of microfluidic devices in sample extraction; an overview of diverse methodologies, principals, and recent advancements. TrAC Trends Anal. Chem. 2021, 143, 116352. [Google Scholar] [CrossRef]
  17. Weber, P.; Riegger, B.R.; Niedergall, K.; Tovar, G.E.M.; Bach, M.; Gauglitz, G. Nano-MIP based sensor for penicillin G: Sensitive layer and analytical validation. Sens. Actuators B Chem. 2018, 267, 26–33. [Google Scholar] [CrossRef]
  18. Sapurina, I.Y.; Shishov, M.A. Oxidative Polymerization of Aniline Molecular Synthesis of Polyaniline and the Formation of Supramolecular Structures. N. Polym. Spec. Appl. 2012, 740, 251–312. [Google Scholar]
  19. Holthoff, E. Molecularly imprinted polymers enhance detection capabilities. SPIE Newsroom 2013, 2–4. [Google Scholar] [CrossRef] [Green Version]
  20. Alemán, C.; Casanovas, J.; Torras, J.; Bertrán, O.; Armelin, E.; Oliver, R.; Estrany, F. Cross-linking in polypyrrole and poly(N-methylpyrrole): Comparative experimental and theoretical studies. Polymer 2008, 49, 1066–1075. [Google Scholar] [CrossRef]
  21. Gonzalez-Vila, A.; Delius, M.; Lahem, D.; Zhang, C.; Mégret, P.; Caucheteur, C. Molecularly imprinted electropolymerization on a metal-coated optical fiber for gas sensing applications. Sens. Actuators B Chem. 2017, 244, 1145–1151. [Google Scholar] [CrossRef]
  22. Charlier, H. Chemical Sensors Based on Molecularly Imprinted Conductive Polymers for the Detection of Antibiotics; University of Mons (UMONS)-Faculty of Engineering: Mons, Belgium, 2021. [Google Scholar]
  23. Diaz, A.; Bargon, J. Handbook of Conducting Polymers; TA Skothei.: New York, NY, USA, 1986; Volume 1. [Google Scholar]
  24. Andrieux, C.P.; Audebert, P.; Hapiot, P.; Savéant, J.M. Identification of the first steps of the electrochemical polymerization of pyrroles by means of fast potential step techniques. J. Phys. Chem. 1991, 95, 10158–10164. [Google Scholar] [CrossRef]
  25. Tan, Y.; Ghandi, K. Kinetics and mechanism of pyrrole chemical polymerization. Synth. Met. 2013, 175, 183–191. [Google Scholar] [CrossRef]
  26. Clochard, M.-C.; Baudin, C.; Betz, N.; Le Moël, A.; Bittencourt, C.; Houssiau, L.; Pireaux, J.-J.; Caldemaison, D. New sulfonated pyrrole and pyrrole 3-carboxylic acid copolymer membranes via track-etched templates. React. Funct. Polym. 2006, 66, 1296–1305. [Google Scholar] [CrossRef]
  27. Khung, Y.L.; Narducci, D. Synergizing nucleic acid aptamers with 1-dimensional nanostructures as label-free field-effect transistor biosensors. Biosens. Bioelectron. 2013, 50, 278–293. [Google Scholar] [CrossRef] [PubMed]
  28. Yoon, H.; Kin, J.H.; Lee, N.; Kim, B.G.; Jang, J. A novel sensor platform based on aptamer-conjugated polypyrrole nanotubes for label-free electrochemical protein detection. ChemBioChem 2008, 9, 634–641. [Google Scholar] [CrossRef]
  29. Urraca, J.L.; Hall, A.J.; Moreno-Bondi, M.C.; Sellergren, B. A Stoichiometric Molecularly Imprinted Polymer for the Class-Selective Recognition of Antibiotics in Aqueous Media. Angew. Chem. 2006, 118, 5282–5285. [Google Scholar] [CrossRef]
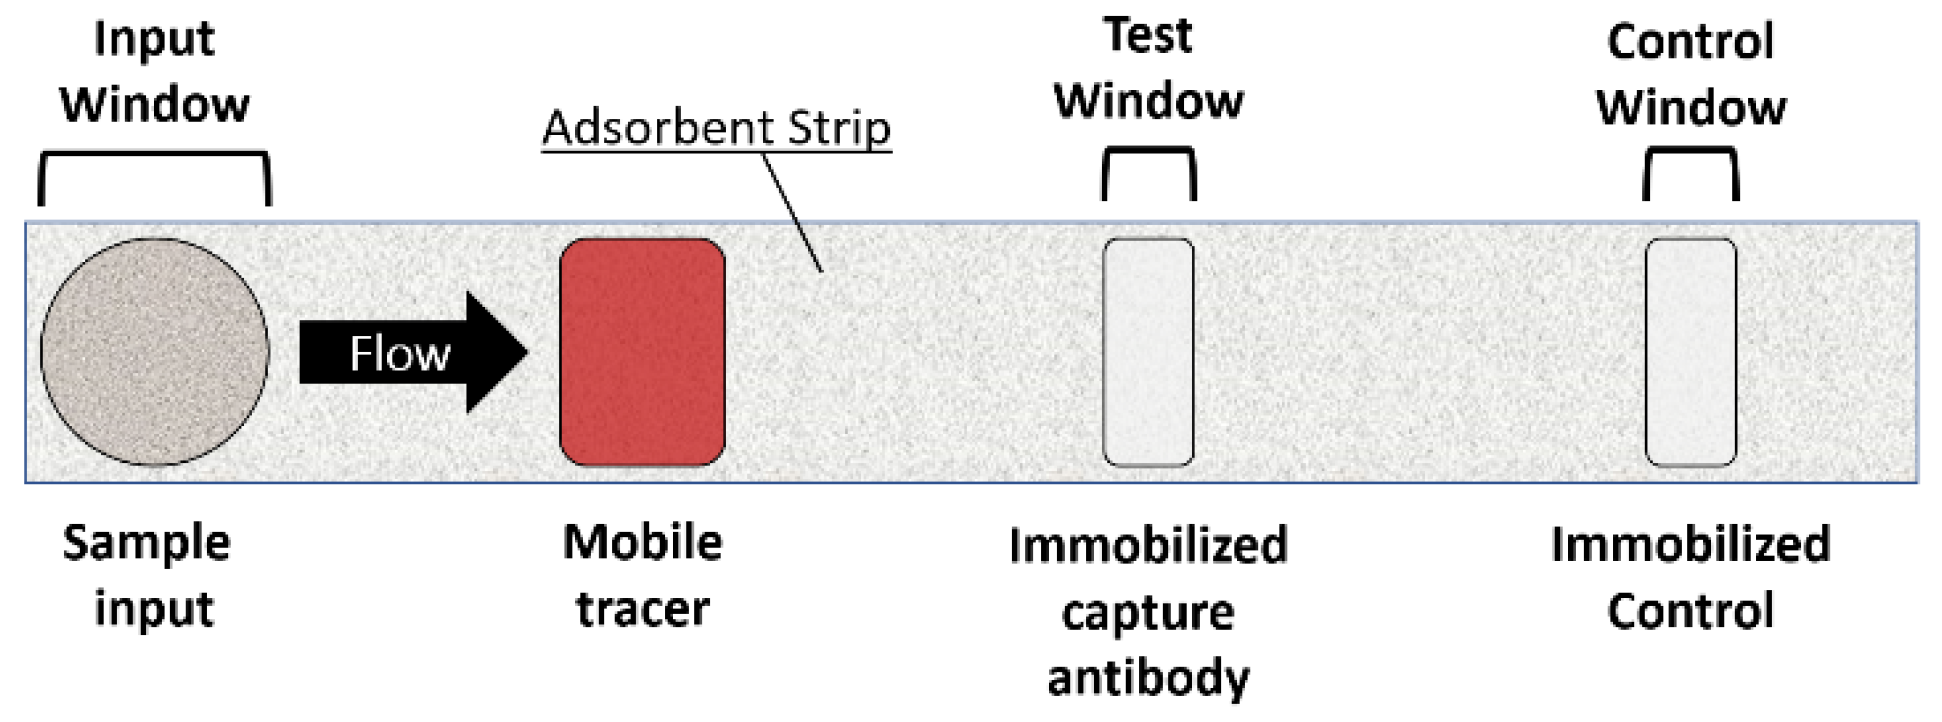
Figure 1. Diagram of an antibody-antigen test strip with its different constituents (sandwich method).
Applsci 12 07914 g001
Figure 2. Schematic representation of the synthesis and the extraction of a MIP.
Applsci 12 07914 g002
Figure 3. Substrates samples, from left to right, after printing: after gold deposit: after ink acetone removal (measurement scale in centimeters).
Applsci 12 07914 g003
Figure 4. Possible polymerization steps of pyrrole oxidative polymerization in various media; Initiation: (ae), propagation: (f), termination: (g).
Applsci 12 07914 g004
Figure 5. SEM images of a polypyrrole MIP sample taken after the extraction step (a) magnification 35,000 times; (b) magnification 100,000 times.
Applsci 12 07914 g005
Figure 6. EIS modulus (above) and phase (below) graphs for MIP (left) and NIP (right) sensors while increasing the penicillin G concentration. Chosen frequencies are highlighted thanks to the red line.
Applsci 12 07914 g006
Figure 7. Sensor’s magnitude (left) and phase (right) responses versus penicillin G.
Applsci 12 07914 g007
Figure 8. Example of how to quantify the sensors’ efficiency (with a, b, c, and d, the slope of the curves).
Applsci 12 07914 g008
Figure 9. Sensitivity of the different MIP and NIP sensors, in phase and modulus, for various sensors exposed to a 15 ppb PenG variation (n = 5) (a); Sensitivity measured in modulus for various interferents for MICP sensors at 15 ppb concentrations (comparison with PenG on the right) (b).
Applsci 12 07914 g009
Figure 10. Molecular structure of chloramphenicol (a), Cefacetrile (b), Ceftiofur (c).
Applsci 12 07914 g010
Publisher’s Note: MDPI stays neutral with regard to jurisdictional claims in published maps and institutional affiliations.