Abstract
Molecular cavities play a critical role in our understanding of molecular phenomena. Recently, a number of works on the visual analysis of protein cavity dynamics have been developed to allow experts and users to interactively research dynamic cavity data. However, previous explorations are limited to studying cavity-lining amino acids and they lack a consideration of the impact of the key amino acids, which are far away from the cavity but have an important impact on the cavity. When studying protein amino acids, biochemists use normal mode decomposition to analyze protein changes on a time scale. However, the high-dimensional parameter space generated via decomposition is too large to be analyzed in detail. We present a novel approach that combines cavity characterization and normal mode analysis (NMA) for cavity dynamics analysis to reduce and explore this vast space through interactive visualization. PNMAVis can analyze whether direct factors (cavity-lining amino acids) or indirect factors (key amino acids) affect cavity changes, through multiple linked 2D and 3D views. The visual analysis method we proposed is based on close cooperation with domain experts, aiming to meet their needs to explore the relationship between cavity stability and cavity-lining amino acids fluctuations and key amino acids fluctuations as much as possible, and also to help domain experts identify potential allosteric residues. The effectiveness of our new method is demonstrated by the case study conducted by cooperative protein experts on a biological field case and an open normal mode data set.
1. Introduction
Proteins play an essential role in life processes, and their functions are realized through interactions with ligands. These interactions generally occur at the active site, which is generally buried deep inside the protein. The cavity is the path from the protein surface to the active site. The size, shape, and physicochemical properties of the cavity are critical for accessibility and biological activity, and the accessibility of the ligand pathway is as important as the binding site itself. Therefore, the characteristics of the cavity and the amino acids that affect the properties of the cavity have been studied by biochemists [1,2].
The dynamic changes of cavities allow cavities to adapt to their respective ligands and regulate the binding process [3]. In order to explore tunneling over time, researchers often utilize molecular dynamics (MD) simulations [4,5]. However, MD simulations are computationally very demanding, and simulating large systems for a long time remains overly challenging [6]. A common replacement for MD simulations is the decomposition of protein flexibility into a set of normal modes. They cannot detect a given cavity quickly and intuitively; thus, many visualization methods have been proposed for cavity dynamics properties by researchers. There are tools such as CAVER [7], which dynamically displays the 3D structure of the protein and allows the user to visually explore the cavity (see Figure 1). AnimoAminoMiner [8] is used for the interactive exploration of protein cavities, to show the detailed tunnel profile and its temporal aggregation. However, the motions of different amino acids in proteins are commonly coupled, and the fluctuations of cavity-lining amino acids are closely related to the fluctuations of key amino acids in the protein. The main problem with these approaches is that they lack a fast and intuitive exploration of the impact on a cavity of key amino acids which are far away from that cavity.

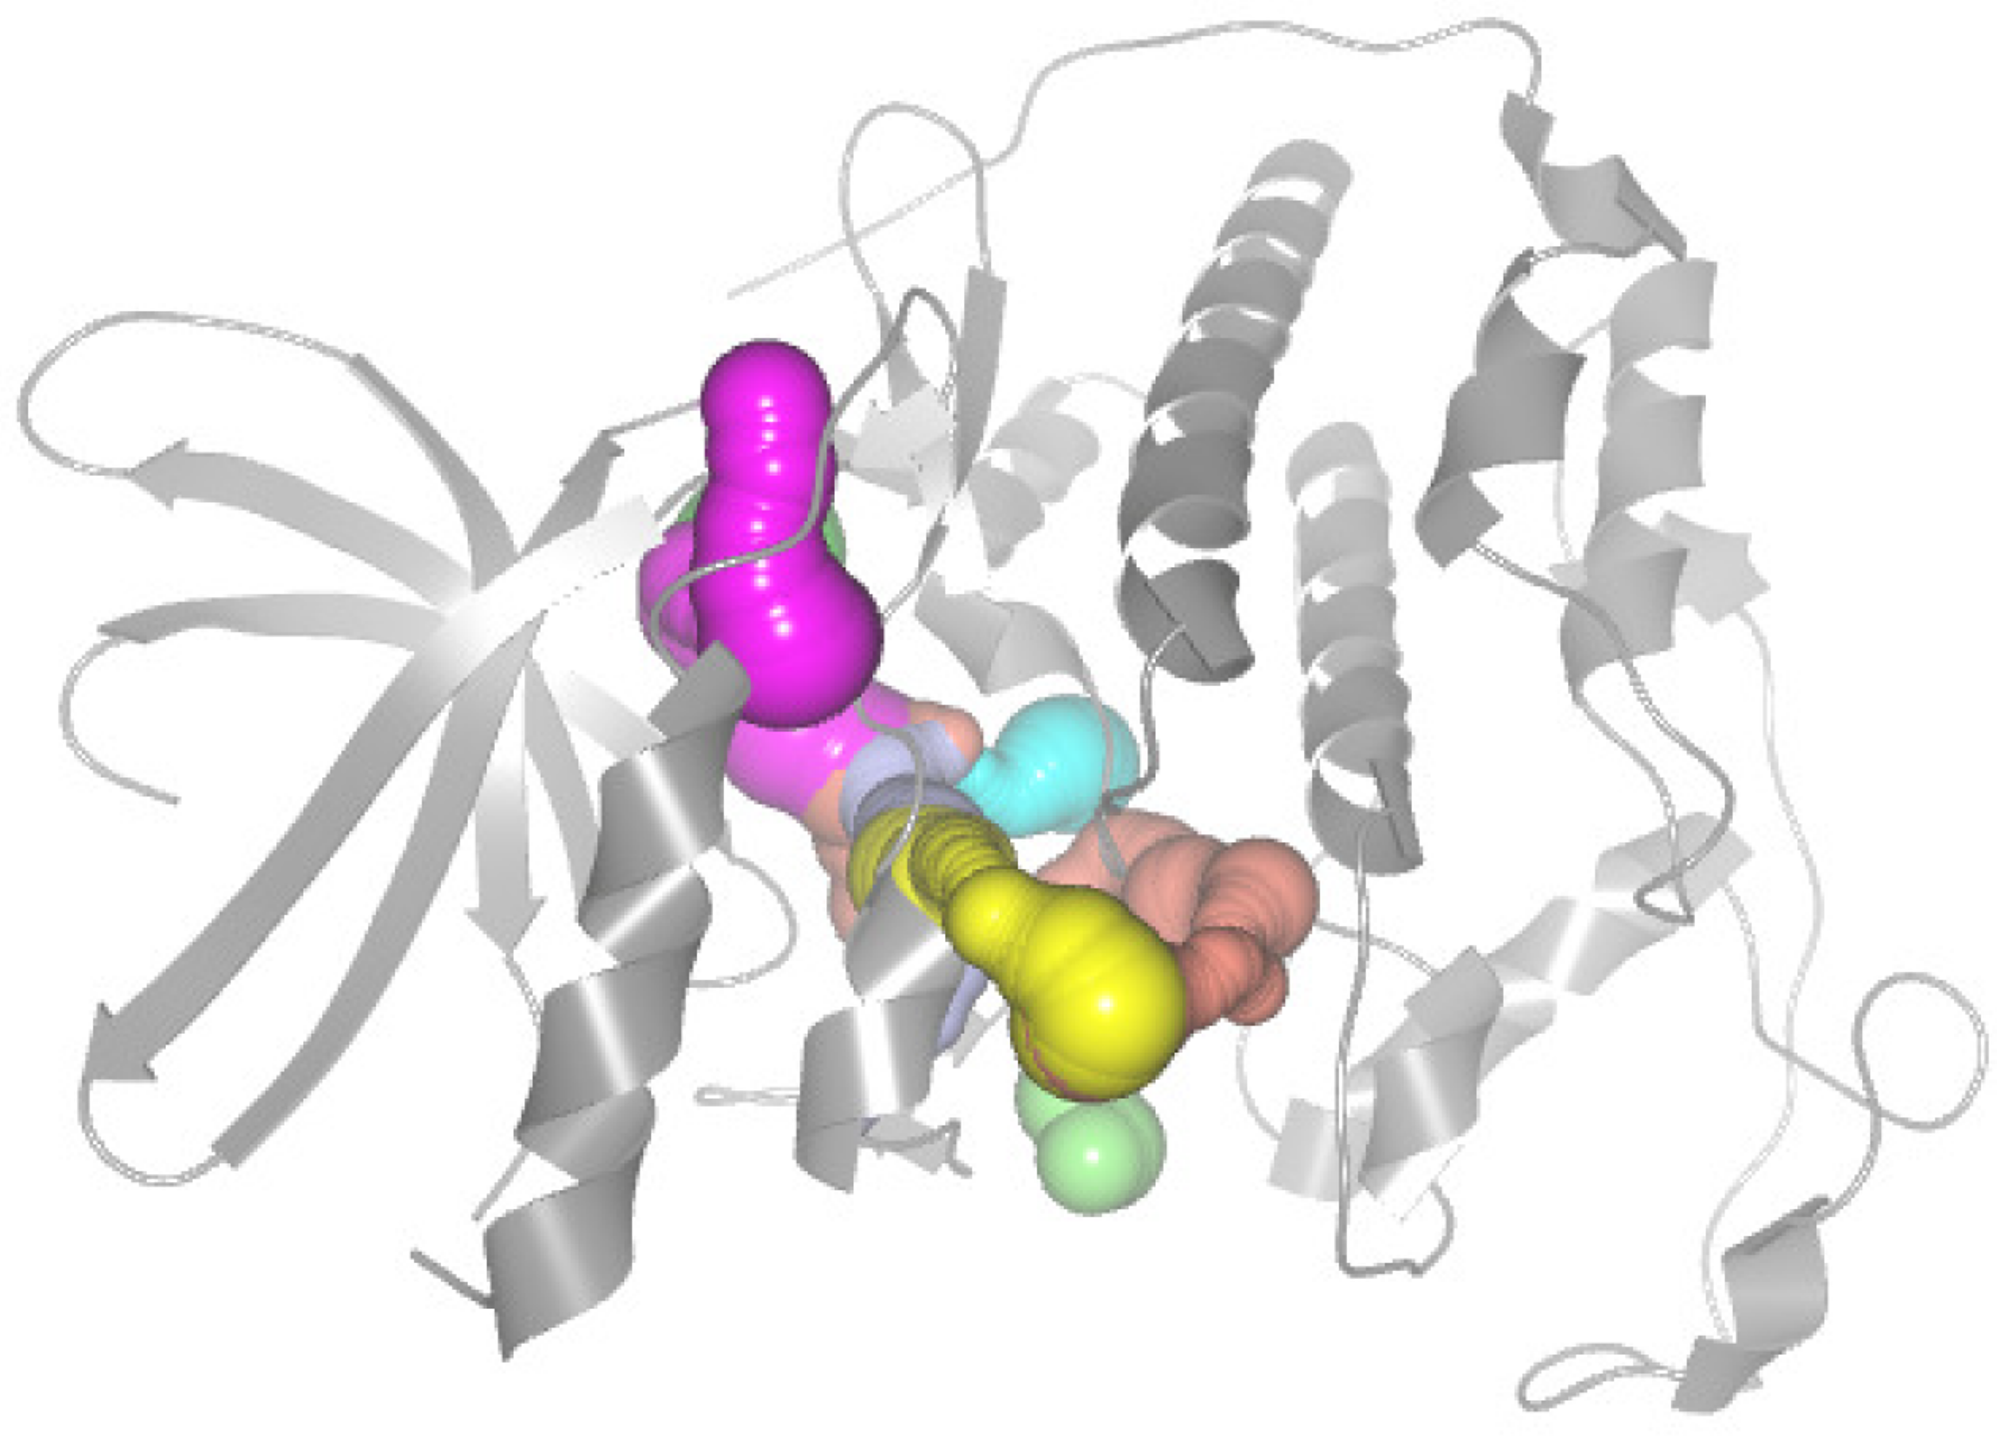
Figure 1.
The CDK2 crystal structure and its cavity are calculated by CAVER Analyst 2.0 and visualized using software PyMOL. The protein molecule is shown as a gray cartoon representation. Each cavity is distinguished by color.
To address this issue, we propose PNMAVis, an interactive visualization tool based on NMA, to analyze the dynamic changes of the cavity. The possible motions of amino acid atoms was obtained by using the coarse grain NMA method. The displacements associated with each mode be extended to trajectories, and the characterization form of cavity-lining amino acids is given after extracting the cavity. The motion states of amino acid atoms in different modes are reduced dimension and clustered, and the similarity of the motion states of the amino acid atoms is analyzed. PNMAVis is designed and implemented, including views such as Protein Cavity Detail View (PC Detail View), Amino Acid Fluctuation HeatMap View (AAF HeatMap View), Amino Acid Fluctuation Similarity Clustering View (AAFS Clustering View), Amino Acid Fluctuation Similarity Detailed Clustering View (AAFS Detailed Clustering View), Protein Cavity Dynamics Influencing Factors View (PCDIF View), and Protein Cavity Dynamics 3D View (PCD 3D View).
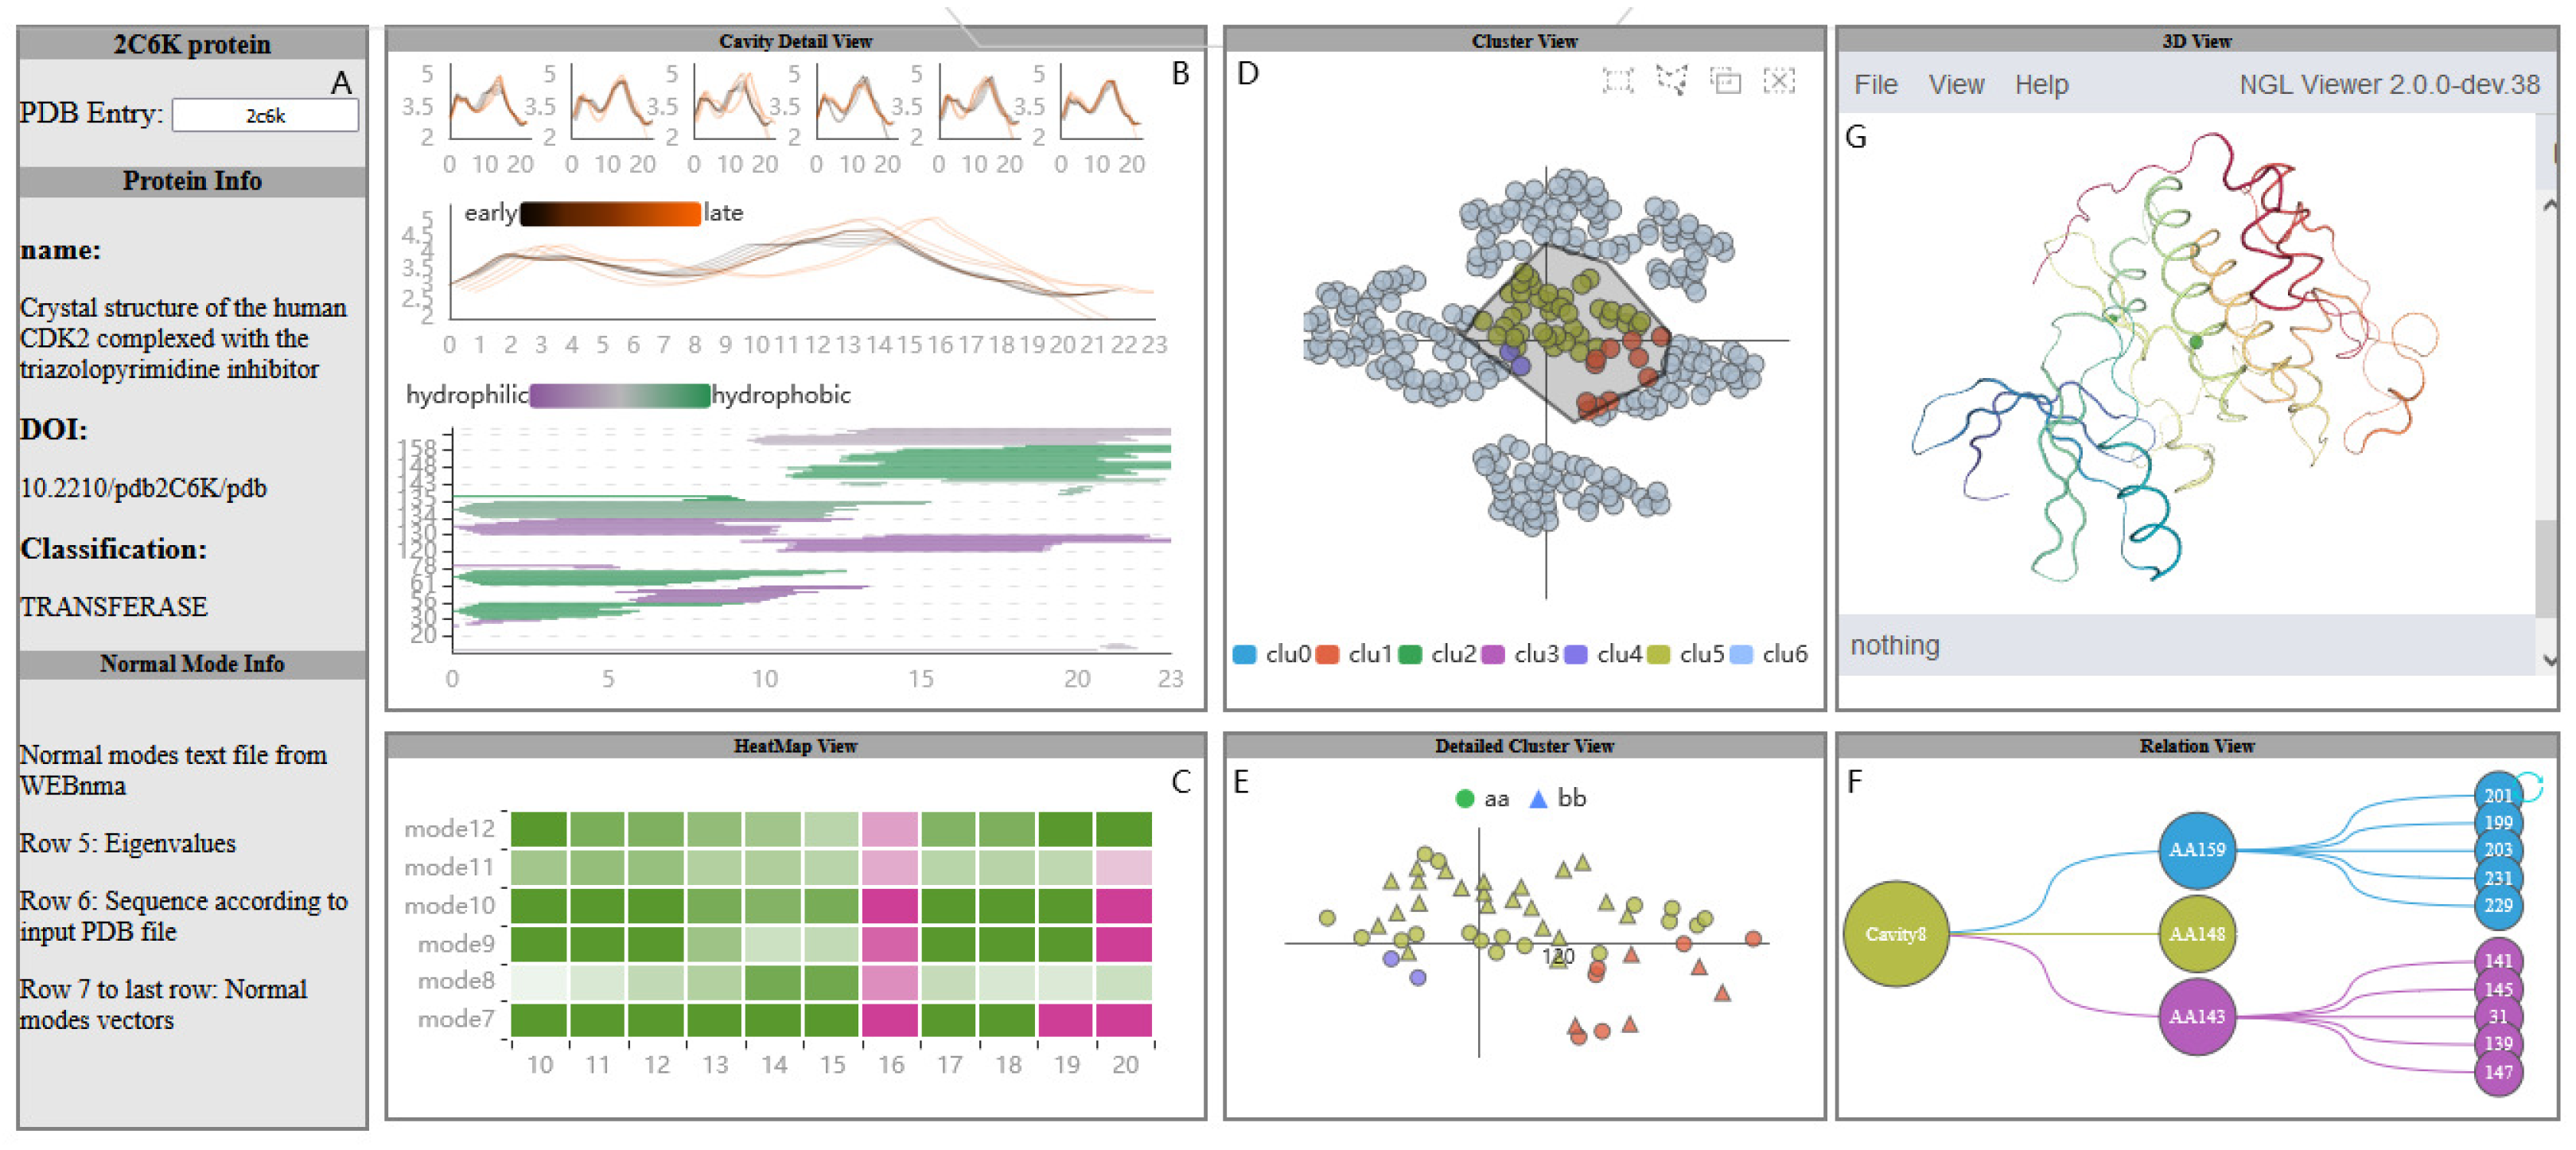
The basic information of protein is shown in Figure 2A. Having knowledge about regarding a graph’s background story influences participants’ focus areas during interactive graph explorations [9]. The PC Detail View and AAF HeatMap View are used to analyze whether the direct factor (cavity-lining amino acids) or the indirect factor (key amino acids) affects the cavity change (see Figure 2B,C). The AAFS Clustering View and the AAFS Detailed Clustering View analyze the motion correlation between cavity-lining amino acids and other amino acids, and identify key amino acids that are similar to the motion of cavity-lining amino acids (see Figure 2D,E). The key amino acids that affect the cavity-lining amino acids are shown in the PCDIF View (see Figure 2G). Finally, users are provide with the PCD 3D View to explore spatial attributes (see Figure 2F).

Figure 2.
A visual analysis system of protein normal mode for understanding cavity dynamics. The Protein View (A) displays basic protein information; The PC Detail View (B) contains the relationship between the fluctuation of the cavity-lining amino acids and the dynamics of the cavity; AAF HeatMap View (C) shows the fluctuation of amino acids under different modes; The AAFS Clustering View (D) is the visualization of the differences in the movements of amino acids in protein; AAFS Detailed Clustering View (E) describes the detailed information of a cluster; The PCDIF View (F) shows the key amino acids that affect the cavity; PCD 3D View (G) describes the change of molecule and cavity and surrounding amino acids over time.
In general, our work is to understand the cavity dynamics of protein normal mode visual analysis. The contributions of this paper are as follows:
- Quickly obtain the possible movements of cavity-lining amino acids and potential key amino acids through the coarse-grained NMA model.
- Give the characterization form of cavity-lining amino acids of the dynamic cavity, introduce the structural and biochemical properties of the cavity, and enrich the data characteristics of the cavity.
- Elaborate design 2D and 3D views to explore the direct and indirect factors that affect the dynamic characteristics of the cavity.
The rest of this paper is structured as follows. This paper first discusses the data and task abstraction that must be supported by a visual analysis system to understand the normal mode of the protein in cavity dynamics. Then, we describe the technologies and methods related to our method. Next, we introduce the data preparation of our method (Section 4). The Introduce visualization is reviewed in Section 5. In Section 6, we introduce how to conduct interactive exploration. Finally, in Section 7, we illustrate the effectiveness of our method through a case study.
2. Data and Task Abstraction
When exploring and analyzing the direct and indirect factors affecting cavity dynamics, domain experts usually try to answer the following questions:
- Q1
- Is it the cavity-lining amino acids or other key amino acids that cause the drastic change of the protein cavity?
- Q2
- Which cavity-lining amino acids of the protein cause drastic changes in the cavity?
- Q3
- Which key amino acid atoms of the protein affect the movement of cavity-lining amino acids, resulting in drastic changes in the cavity?
- Q4
- How to explore the motion correlation between cavity-lining amino acids and key amino acids?
- Q5
- What is the relationship between cavity-lining amino acids, key amino acids, and cavity motion in three-dimensional space?
To answer these questions, domain experts often use MD to simulate the possible trajectories of proteins to obtain the data of amino acid atom motion. However, these calculation methods have randomness, and so it is necessary to generate a large set of thousands of trajectories in order to draw statistically significant conclusions. A common alternative to MD simulation is to decompose the flexibility of proteins into a set of normal patterns. Using normal mode is also a difficult task, because normal mode calculation provides a considerable number of modes, but there is no information about regarding their possible participation. Without proper visual support, it becomes challenging to consider all of their potential combinations.
In order to identify the requirements of visualization technology, we conducted several informal interviews with expert collaborators from the protein direction. We jointly identified the following set of crucial tasks that must be supported by a visual analysis system to explore and analyze the normal mode of proteins for understanding cavity dynamics:
- T1: Observe the cavity dynamics in different modes, and compare and analyze the distribution and fluctuation of amino acid atoms (Q1–Q4).
- T2: Observe the key chemical and physical properties (Q1, Q2) represented by cavity-lining amino acid atoms under different modes.
- T3: It can easily reveal the relationship between cavity-lining amino acid atoms and key amino acid atoms (Q3).
- T4: The possibility of identifying key amino acids by clustering amino acids with motions similarity (Q3, Q4).
- T5: Enhance the understanding of the effect of amino acids on cavity dynamics by studying 3D structures (Q5).
- T6: Analyze the possibility of influencing the cavity-lining amino acid atoms and key amino acid atoms with drastic changes in the cavity from the biological field cases and public data sets (Q1–Q5).
3. Related Work
Our approach builds on several aspects of previous work on molecule cavity and normal mode analysis. We have divided the related works into three sections accordingly.
3.1. Normal Mode Analysis
Normal modes classify all available motions that a system can undergo, given its 3D structure, and they are essentially large, non-uniform vector fields (at discrete locations) [10]. Normal mode is an evaluation of system interaction. In the context of biology, normal patterns represent all of the internal dynamics of proteins. Doruker et al. [11] showed that the correlation determined from the GNM (Gaussian network model, which is a minimalist NMA model used to study biomolecules) and MD simulation is similar. Compared with the method of using MD simulation to calculate the similarity, NMA takes less time and is more convenient to use. In recent years, NMA has become an important tool for studying biomolecules. This technique was first utilized because of its relatively modest computational demands, but even now, when more complex calculations are routinely performed, NMA has remained of value because of the type of information that it can provide. In order to transform from one functional conformation to another, a protein will deform from its normal mode space according to a specific subset of modes. José et al. [12] naturally reproduces the collective functional motions of biological macromolecules by using NMA. In order to link the intrinsic dynamics of proteins with their functions, domain experts usually use protein conformations obtained by various experiments. For example, Tama and Sanejouand [13] evaluated the transition of normal mode between two known functional states. NMA is also used to capture the inherent flexibility of proteins. Byška et al. [10] proposed the inference of relevant protein function from single structure dynamics through protein tunnel analysis while considering normal mode combinations spanning the whole normal mode space. At present, the study of allosteric sites based on protein dynamics has attracted much attention. Huang [14] uses elastic net for the NMA calculation of the network model, and studies the influence of sites on protein movement characteristics. Based on this, our work uses the protein dynamics information provided by the normal mode to study the relationship between key amino acids and cavity-lining amino acids on the cavity, and analyzes the reasons for the dynamic changes of the cavity.
3.2. Molecular Cavity Calculation and Extraction
Current methods for cavity calculation are divided into four categories: grid-based, probe-based, Voronoi-based, and surface-based. The first approach to compute and visualize cavities was POCKET [15], developed by Levitt and Banaszak in 1992. This method extracts cavities by simplifying the protein to a hard-sphere model and simplifying the possible ligand positions to discrete points. Due to hardware limitations, the grid-based methods are not suitable for larger structures without drastically reducing the grid resolution. One solution to solve this problem is to use the Voronoi-based method. The Voronoi-based method has been proven to be suitable for detecting pathways in molecules, and is suited for working with large molecules. The protein is often simplified by using the atom positions or the hard-sphere model. Moreover, the edges of Voronoi diagrams automatically provide geometrically optimal molecular paths based on the restriction. Because of the lining atom sequence is easier to achieve, a Voronoi-based method is adopted to extract the cavity in our work. The probe-based method uses the spatial expansion of ligands to calculate molecular paths and cavities. Most of the techniques approximate the ligand by using a single hard-sphere. In contrast to most of the previous approaches, the protein is not purely restricted to the hard-sphere model, but to a molecular surface model. The molecular surfaces-based method defines an interface of the molecule and its environment [16]. Therefore, they can be used to define cavities as well. Many computer-aided drug design tools supporting these computational models are available, such as POCKET [15], LIGSITE [17], and D3Pockets [18], which use a grid computing model; CAVER and FPocket [19] use a Vonoroi computing model. MSPocket [20] uses a surface computational model; PASS [21] and ROLL [22] use a probe ball computational model. In addition, there are also some hybrid computational models, such as KVFinder [23] and CavVis [24], which are based on a mixture of mesh and probe ball. Our work employs CAVER Analyst 2.0, which is a software program for the analysis of access pathways to buried active sites in proteins in long molecular dynamics (MD) simulations. This tool uses a method based on the Voronoi diagram to calculate the cavity. The calculation process of the tool is divided into two steps; firstly, the cavities of different time slices are calculated according to set parameters, and secondly, the correspondence between cavities and time is identified by via hierarchical clustering. The final output result is a cavity data set that changes with time, with other information such as cavity bottleneck, radius, length, and so on.
For extracting the sequence of the molecular cavity, our first consideration is to calculate the set of amino acids around the molecular cavity. These amino acids are often referred to as cavity-lining amino acids. There are many ways to calculate cavity-lining amino acids. In most methods, the distance between two samples is set to 0.1 (Å) on the centerline of the molecular cavity. In each sample, the four nearest atoms are detected. These four atoms are called cavity-lining atoms, and the amino acids to which they belong are labeled as molecular cavity-lining amino acids. In our work, the CAVER 3.0 [7] method is used to calculate the sequence of molecular cavities that need to be extracted. To take the sequence of the molecular cavity, users need to enter the list of spheres that form the molecular cavity and the list of surrounding amino acids, as well as additional information. The molecular cavity sphere with the largest radius relative to the surrounding atoms is located on the centerline of the cavity. The combination of molecular cavity spheres forms the approximate shape of the molecular cavity.
3.3. Visualization Method of Molecular Cavity Dynamics
Protein function is usually related to protein cavity and their dynamics; there are many studies that analyze cavity dynamics, such as VMD [25] and PyMOL [26]. Besides, there are also some web-based tools; for instance, LiteMol [27]. However, with increasing computational power, it is possible to generate very long and complex simulations, which are cumbersome to explore using the traditional 3D animations of protein movements. Byška et al. [28] employed a design Interactive Focus + Context Visualization methodology to improve 3D animations of long and crowded MD simulations. Another approach proposed by Patro et al. [29] summarizes the MD simulations using a state transition graph between the keyframes. To better understand the cavity, Lindow et al. [30] proposed a tool to calculate the cavity structure using the Voronoi diagram method, so that users can interactively calculate, select, and visualize dynamic cavities. There are also some non-spatial methods for exploring cavities. Kolesar et al. [31] proposed a technique for the spatial reformation of the tunnel surface 2D space. Byska et al. [8] proposed a 2D visualization and drawing method to further study the shape and characteristics of selected cavities in dynamic molecular data. D. Guo [32] proposed a spatio-temporal multiple molecular cavity visualization and visual analysis method, allowing domain experts to process their work at any scale of semantic abstraction. The existing representation of cavities is not sufficient to directly support the analysis of th etopological properties of molecular cavities. So, D. Guo [33] proposed a vectorized representation method based on cavity atomic sequences, which allows the combining of the topological attributes to analyze very large sets of conformations containing hundreds of thousands of cavities. In addition, interactive visual analysis is a combination of spatial visualization and non-spatial visualization. Burch et al. [34] proposed that it is beneficial to combine several static and dynamic visualizations. Based on multiple linked 2D and 3D Views, Pierre Bedoucha et al. [10] were able to quickly and flexibly explore a single mode and its influence on the tunnel dynamics related to protein function.
While the methods mentioned above are used to identify amino acids surrounding the cavity, it is not only the cavity-lining amino acids that affect the properties of the cavity, but also the distant amino acids. Experts should find out the reasons for the dynamic changes of the cavity to use gene-editing technology to mutagenize the active site. So, we designed a system that can be interactively explored to help domain experts identify the key amino acids that affect the cavity (T1–T6).
4. Data Preparation
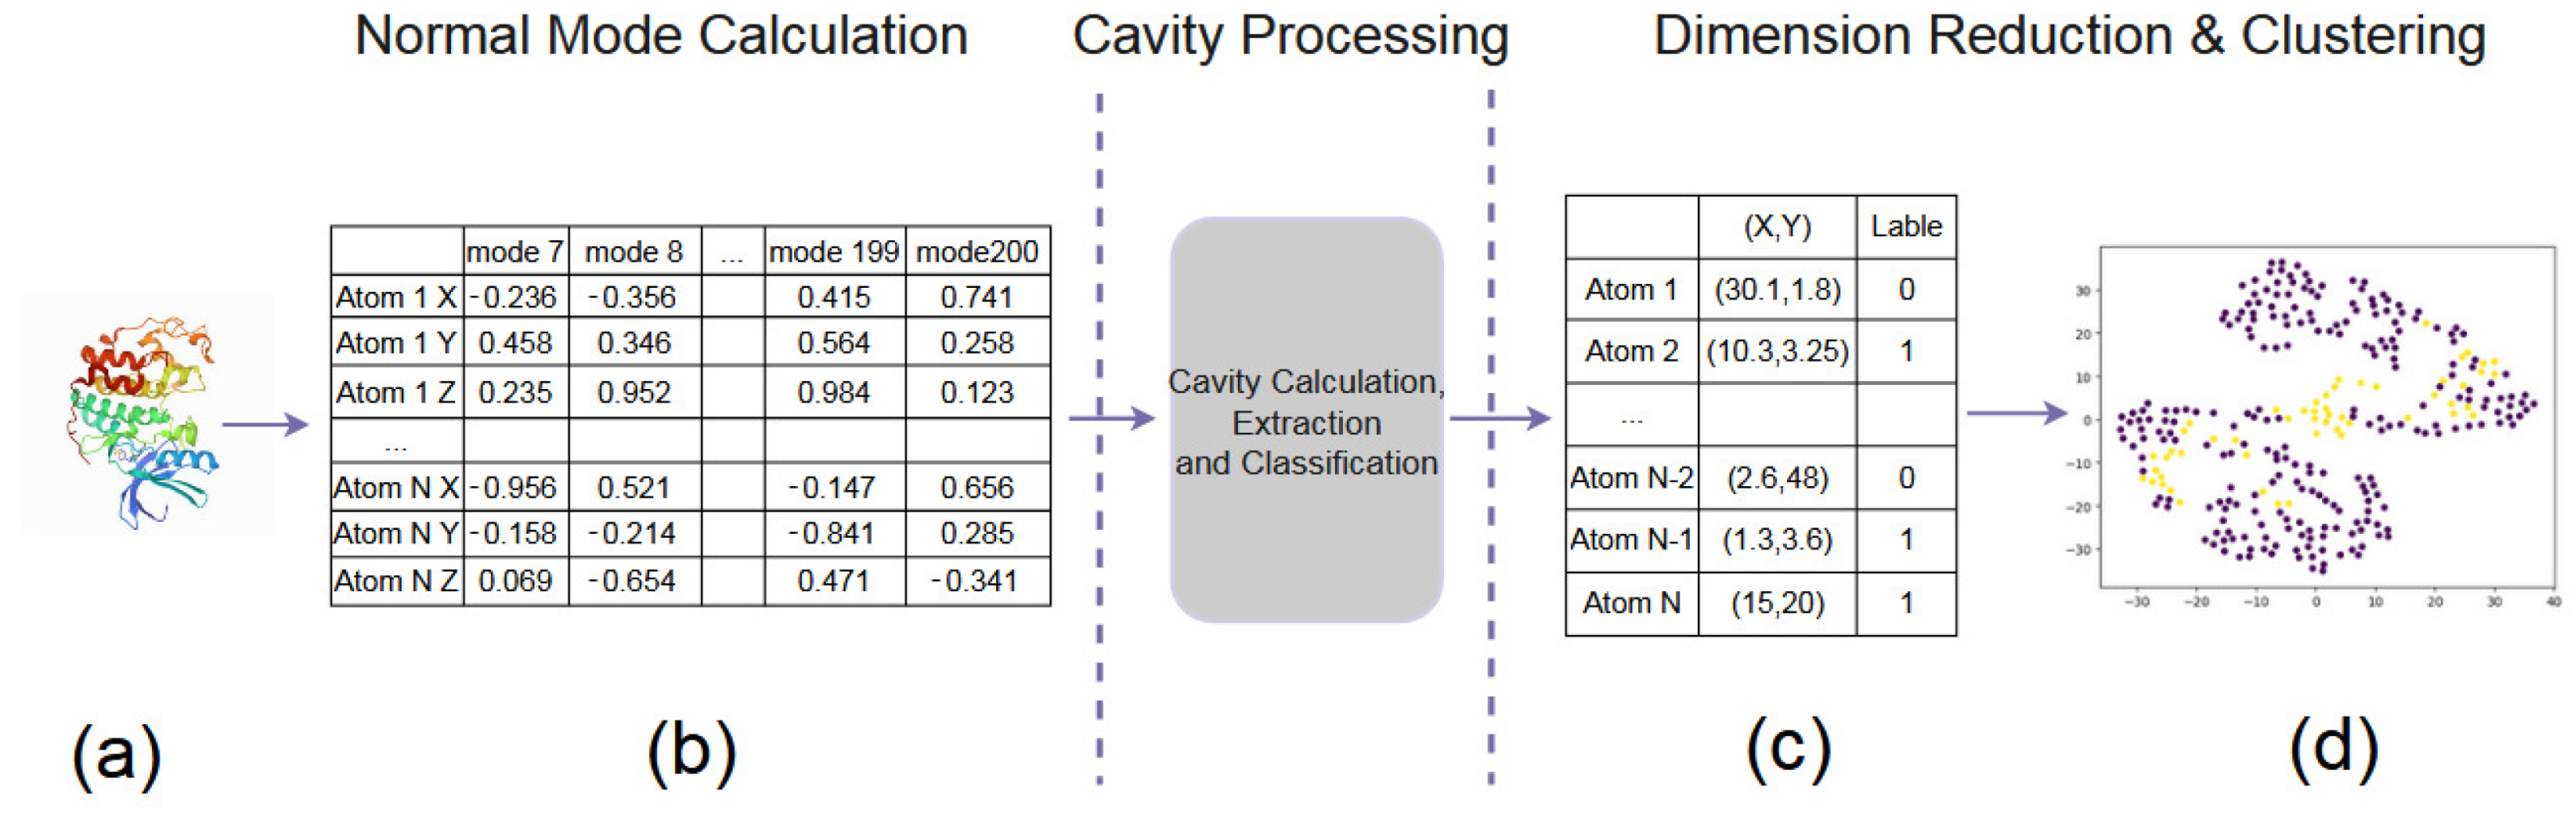
Our data preparation pipeline is summarized as follows, including Normal Mode Calculation, Cavity Processing, and Dimension Reduction & Clustering (see Figure 3), which is designed to extract cavities, calculate amino acids around the cavities, and obtain key amino acids affecting the cavities. The purpose is to calculate the probable motion of amino acid atoms, calculate the cavity, and extract the cavity and the cavity-lining amino acid atom. After obtaining the motion similarity between amino acid atoms, the cavity-lining amino acid atoms and key amino acid atoms that affect the cavity change are explored (T1–T6).
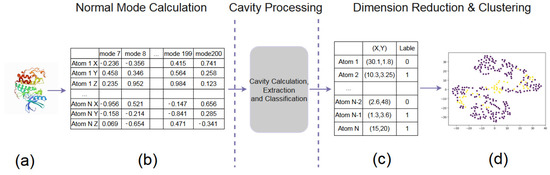
Figure 3.
The pipeline of our data preparation. (a) A PDB file. (b) Normal Mode Calculation. (c) Cavity Processing. (d) Dimension Reduction & Clustering.
4.1. Normal Mode Calculation
The root-mean-square fluctuation data and normal modes (eigenvectors) of amino acid atoms were obtained byvia normal mode calculation (T1). This vector contains the possible motion directions of each amino acid atom in different modes. Normal mode calculation can be carried out with different granularity, including all atom calculations and coarse-grained (CG) normal mode calculation. In this paper, we mainly focus on the CG method, in which only one atom is considered for each amino acid (the -carbon of each amino acid), because it is possible to study larger systems. The normal modes for all proteins were computed using the WEBnm@ [35] tool. WEBnm@ employs the Elastic Network Model (ENM) with the C force field developed by Hinsen et al. In the elastic network model, the mass of each amino acid is represented by the position of its C atom. The force between atoms is described as an interaction matrix. By solving the eigenvalue decomposition of the matrix, normal modes are obtained, where N is the number of -carbons in the model. Each mode k contains a set of N three-dimensional vector sets , which describes the independent periodic motion of the whole system around the initial position . All possible motions of each protein particle i can be reconstructed by the equation:
with denoting the thermal amplitude per mode k, being its frequency (linked to the eigenvalue from the original eigenproblem), the phase shift, and the mass of the considered particle i. It is important to note that thermal amplitude is a function of the given normal mode frequency, highlighting the fact that the lowest-frequency modes are also displaying the largest motions [10]:
with is the Boltzmann constant, and the temperature T is set to 300. It describes and normalizes the amplitude of a normal mode k by informing only about the particles’ position extrema. The root-mean-square fluctuations of the atom are formulated as follows:
In Formula (3), is the considered the mass of particle i, represents the frequency of each mode j, and represents the coordinates of atom i on the simple vibration mode j.
In addition, the first six modes (also called trivial modes) are rigid-body transformations, and therefore, are not of interest. When domain experts analyze normal modes, they usually consider only the lowest frequency modes, also known as the slow modes, as they have been shown to experimentally and computationally relate to protein function [36,37]. Therefore, we used six low-frequency modes for visual analysis and used all modes for data processing.
4.2. Cavity Processing
By extending the displacement related to each mode to the trajectory, the trajectory sampling data of the protein is obtained. Calculate the cavity by processing the trajectory data of the normal mode, and extract the cavity sequence and cavity-lining amino acid atoms (T1,T5). During cavity processing, there are three main steps. In the first step, the displacements associated with each mode be extended to trajectories with LiteMol. In the second step, Voronoi-based methods have been applied to the processing of trajectories for normal mode, and using of the CAVER Analyst 2.0 software has made the analysis of cavities in snapshots generated from trajectories more accurate and convenient. CAVER Analyst 2.0 calculates the cavities contained in the input molecule at all time steps, and gets through hierarchical clustering correspondence between cavity and time. The calculated data set describes the changes in the cavity over time, and other auxiliary information. The last step in the cavity processing task is to use the above data to extract the cavity-lining amino acids. The amino acids are defined as cavity-lining amino acids if their distance to the cavity centerline is the smallest of four amino acids. It is possible to use any other algorithm for the detection of cavity-lining amino acids. Our method can be easily adjusted to any of the existing solutions. It requires as input only the list of spheres forming the cavity body, and the list of surrounding atoms and amino acids with additional information, such as their spatial orientation, type, or physicochemical properties.
4.3. Dimension Reduction & Clustering
The motion state of amino acid atoms in different modes is dimensionality reduced and clustered to obtain the similarity data of the motion state of amino acid atoms (T4). The motions of all amino acids in proteins are coupled, the motions of cavity-lining amino acids are influenced by key amino acids. These key amino acids are not around the cavity, but cause changes in cavity dynamics. If two amino acids are relatively similar in motion in 200 modes, this is evidence that the two amino acids are strongly correlated in motion. As shown in Figure 3b, the amino acid movements of protein is depicted with 200 dimensional vectors obtained by via the normal model, which is well over the capability of human visual cognition. For an amino acid atom, there are 600 features of three-dimensional coordinates as three features in 200 motion situations. Therefore, we use the t-SNE for dimensionality reduction, which is a nonlinear dimensionality reduction algorithm that is ideal for reducing high-dimensional data to two or three dimensions. The t-SNE accomplishes the task of retaining the clustering information in the higher dimensions and finding the projection points corresponding to the higher dimensional data in the lower dimensions, so that the reduced results are consistent with the clustering information of the original data. The results of dimensionality reduction are shown in the Figure 3c. The distance between each pair of points largely describes the correlation between amino acids in the high-dimensional semantic space. In other words, when two points are close to each other, the movements of amino acids will be similar. Clustering of the dimensionality-reduced data is performed using Kmeans, an unsupervised clustering algorithm. For a given set of samples, the samples are divided into k clusters according to the size of the distance between them, so that the points within the clusters are as closely connected as possible while leaving the distance between clusters as large as possible (Figure 3d). In our work, we use the Euclidean distance for our distance metric, as shown in the Formula (4).
5. Visualization
Our visual analysis system is designed to make it easy for users to analyze and understand cavity dynamics. The system consists of six views: PC Detail View, AAF HeatMap View, AAFS Clustering View, AAFS Detailed Clustering View, PCDIF View, and PCD 3D View (T1–T6). The PC Detail View includes the Length–Width View and HeatMap. The Length–Width View shows the variation of the cavity radius and other characteristics over time (T2), while the AAF HeatMap View shows the fluctuation of amino acids in the low-frequency modes (T1). Analyze is performed as to whether the direct factor (cavity-lining amino acids atom) or indirect factor (key atom) affects the cavity change through the PC Detail View and AAF HeatMap View. The AAFS Clustering View is used to show the differences in the movements of amino acids in the protein (T4). The detailed information of the cluster is viewed through the Detailed Cluster View (T4). The AAFS Clustering View and AAFS Detailed Clustering View can analyze the motion correlations between cavity-lining amino acid atoms and other atoms, and identify key atoms that are similar to cavity-lining amino acid atoms. The key amino acids affecting the cavity are shown in PCDIF View (T3). As the exploration of the spatial properties is required, our work remedies this drawback by providing the users with a PCD 3D View (T5). The following is a detailed description of each of our views.
5.1. Protein Cavity Detail View and Amino Acid Fluctuation HeatMap View
To explore the direct factors of cavity dynamics, it is necessary to compare and analyze the distribution and fluctuation of amino acids in the cavity. However, direct analysis of large amounts of data is a challenging task; therefore, appropriate visualization is needed to help users discover information quickly and visually. For example, through the PC Detail View, we can find the cavity-lining amino acid atoms that users are more interested in and that have more research value. Observe the fluctuations of cavity-lining amino acid atoms and other amino acid atoms through the AAF HeatMap View, to analyze whether the direct factor or indirect factor affects the cavity change (T1,T2).
The PC Detail View shows the changes in cavity width along its centerline, and represents all amino acids surrounding the cavity at a particular centerline location in molecular trajectories (T2). This view can observe the cavity dynamics in different modes and explore the cavity-lining amino acids atom that cause drastic changes in the cavity. As shown in Figure 4, the PC Detail View is divided into three parts. The top part shows an overview of the Length–Width View of the cavity in the low-frequency modes, with the horizontal coordinates representing the length of the cavity and the vertical coordinates representing the radius of the cavity, and allows the user to discover the cavity dynamics in the different modes. The middle part shows the changes in cavity width along its centerline, starting from the active site on the left side, where the black line represents the early state of the cavity and the orange line the late state of the cavity. The Length–Width View can clearly observe that the volume of the first half of the cavity is relatively stable in this mode, and the latter half changes violently. The bottom part represents all amino acids surrounding the cavity at a particular centerline location in molecular dynamics; the vertical arrangement of strips represents individual amino acids, where the color of the vertical represents the hydrophobicity of the amino acids. The closer to purple, the stronger the hydrophilicity, and the closer to green, the stronger the hydrophobicity. In the bottom figure, we can observe the amino acid atom number, occurrence frequency, and hydrophilicity that affect the volume changes in the second half of the cavity.
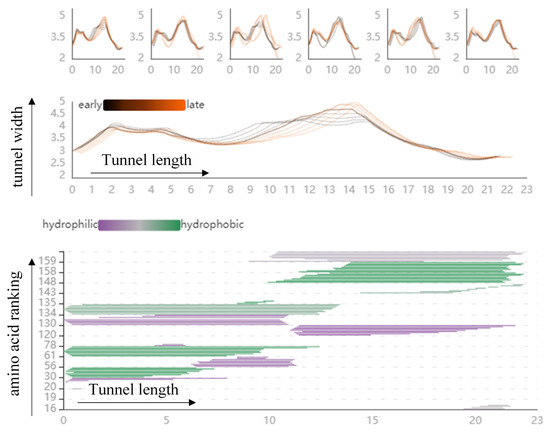
Figure 4.
The PC Detail View shows the direct factors that affect the dynamic changes of the cavity. The top part shows an overview of the length and width view of the cavity in the low-frequency modes. The middle part shows the changes in cavity width along its centerline, starting from the active site on the left side, where the black line represents the early state of the cavity and the orange line the late state of the cavity. The bottom part represents all amino acids surrounding the cavity at a particular centerline location in molecular dynamics.
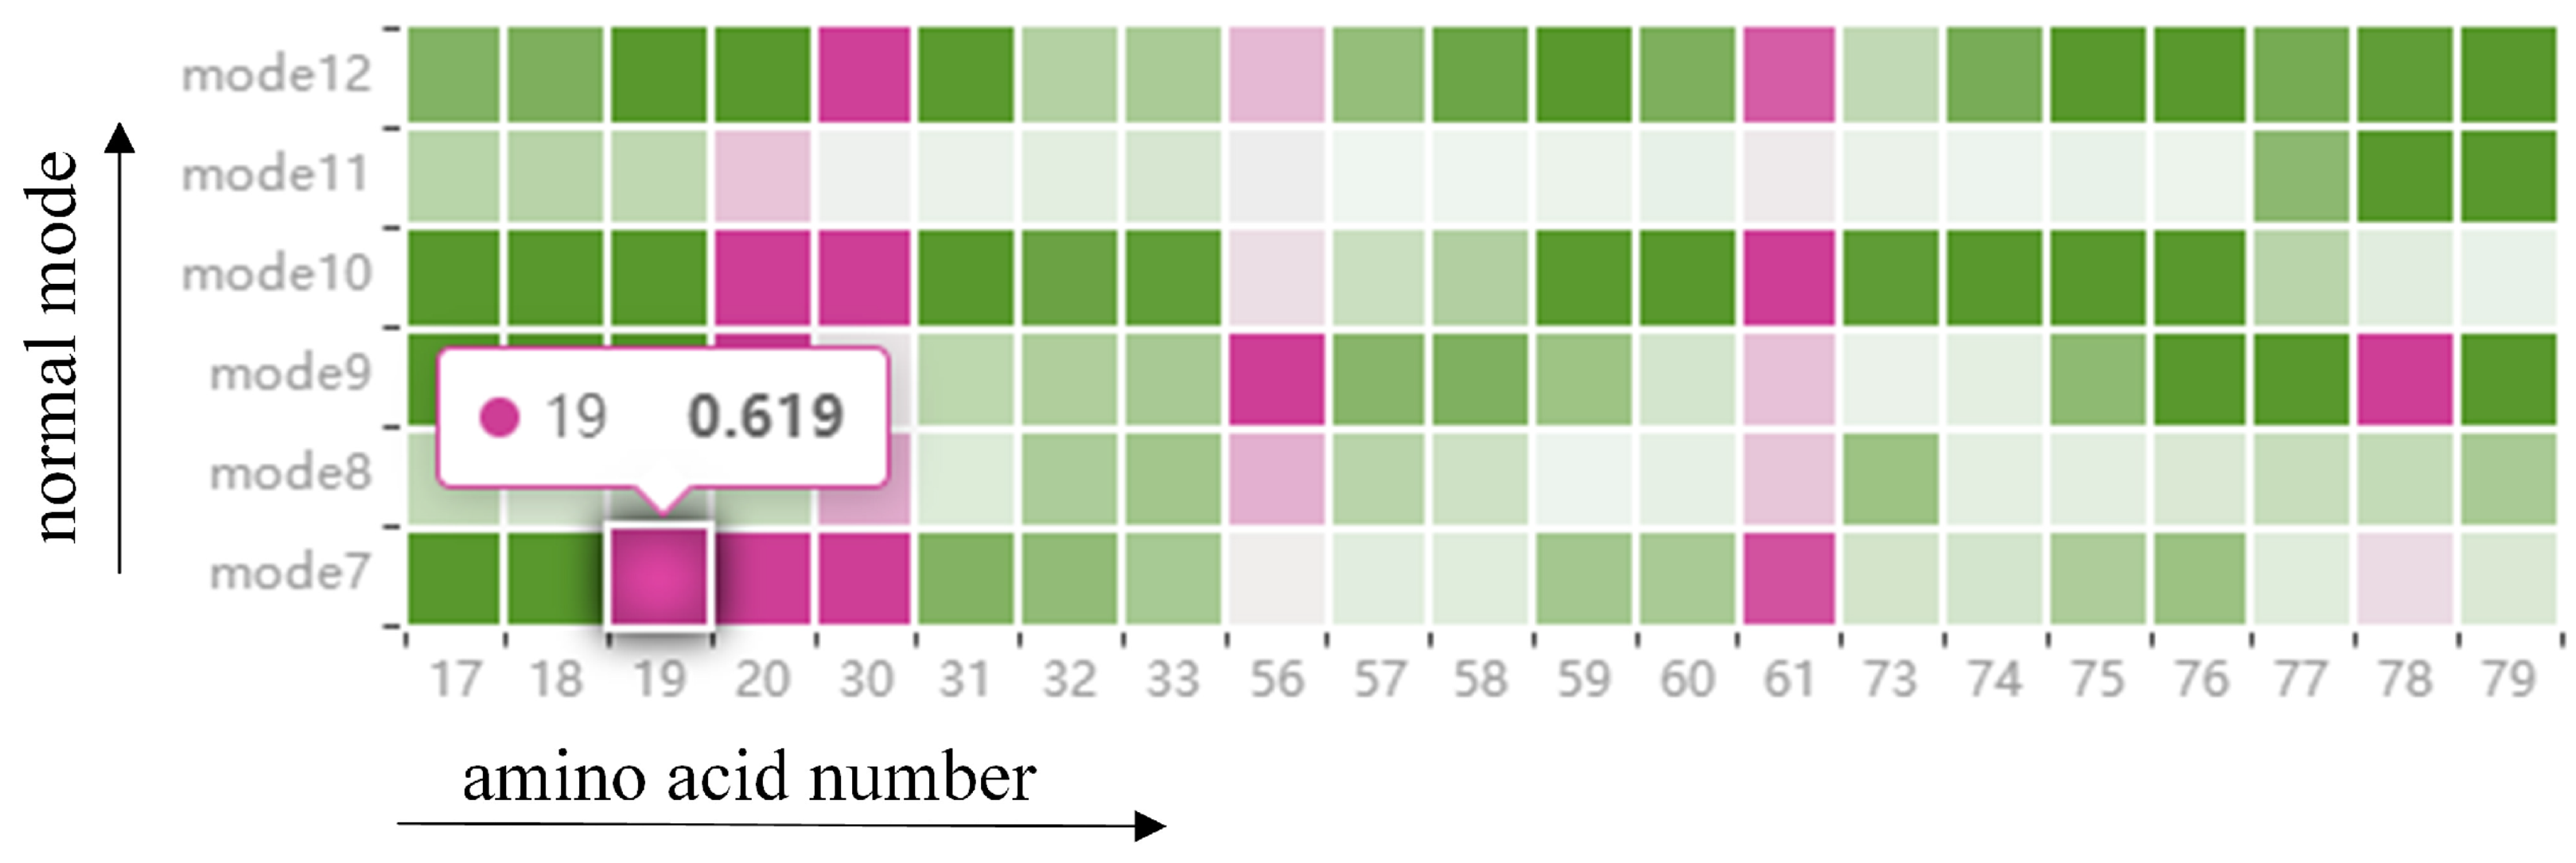
Information on the fluctuations of amino acids is given in a HeatMap (see Figure 5). The graph contains all the amino acids around the cavity, as described above, and once the amino acids around the cavity have been identified from the cavity amino acid distribution graph, the fluctuations of those amino acids in that mode be observed from the HeatMap (T1). Each grid in the HeatMap represents the displacement of the cavity-lining amino acids encoded by color. Pink means that the amino acid is present around the cavity, and green means that it is not present around the cavity, where the shade of color represents the level of fluctuation of the amino acid. The fluctuation degree is determined by using the root-mean-square fluctuation of atoms in normal mode calculation. For example, a grid with a horizontal coordinate of 19 and a vertical coordinate of mode 7 means that in mode 7, amino acid 19 appears around the cavity and the displacement is 0.691. Through this figure, we can observe the fluctuations of cavity-lining amino acids that users pay attention to in different modes, and analyze whether this atom is a direct factor affecting the cavity change. If it is not a direct factor, the user can observe the fluctuations of other atoms through the HeatMap to analyze whether there are key atoms affecting the fluctuations of cavity-lining amino acid atoms, which can be used as an indirect factor to affect the change of cavity.

Figure 5.
The HeatMap shows the fluctuation of amino acids around the cavity. Each grid in the HeatMap represents the displacement of the cavity-lining amino acids, encoded by color. Pink means that the amino acid is present around the cavity, and green means that it is not present around the cavity, where the shade of color represents the level of fluctuation of the amino acid.
5.2. Amino Acid Fluctuation Similarity Clustering View and Detailed Clustering View
The AAFS Clustering View and AAFS Detailed Clustering View can show the motions of amino acid atoms in multiple modes, so as to analyze the motion correlation between cavity-lining amino acid atoms and other atoms, and identify key atoms that are similar in motion to cavity-lining amino acid atoms (T4). The PC Detail View and AAF HeatMap View are analyzed for a single mode by selecting the mode of interest by the user, so as to find out the cavity-lining amino acid atoms of the direct factor affecting the cavity, and the key atoms of the indirect factor. In order to more comprehensively analyze the correlation between cavity-lining amino acid atoms and key atoms in motion, this paper designs a AAFS Clustering View to overview and select amino acid clusters with similar motions, and then shows the key elements with similar motions to cavity-lining amino acid atoms through Detailed Cluster View details.
The AAFS Clustering View (see Figure 6) is the core view of our system, which provides a two-dimensional mapping of the clustering results (T4). Many studies have shown that multidimensional data visualization technology is helpful to understand clustering [38,39]. We embed the 292 amino acids in the protein into the 2D view, and if two points are closer, it means that the two amino acids are closer in motion. From the figure, it can be visualized that the clustering results have been divided into 7 categories, and different colors represent different clusters. The clustering analysis is based on similarity. The similarity between patterns in a cluster is greater than the similarity between patterns that are not in the same cluster. When the mouse has hovered over a point in the 2D plot, the amino acids sequence number of the point is displayed, as well as the two-dimensional displacement vector. In addition, users are able to select areas of interest on this view and then explore them in detail.
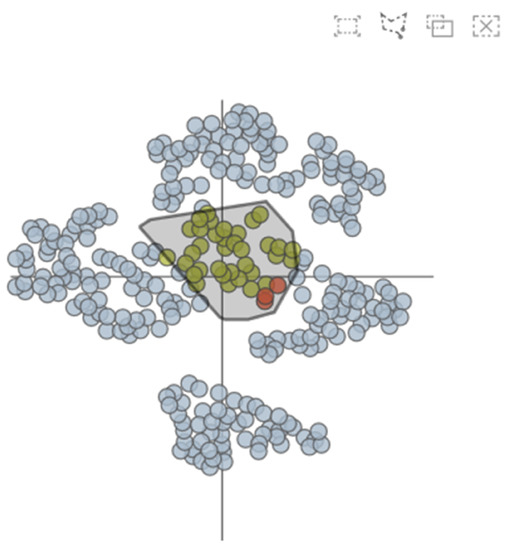
Figure 6.
The AAFS Clustering View shows the results after dimensionality reduction & clustering.
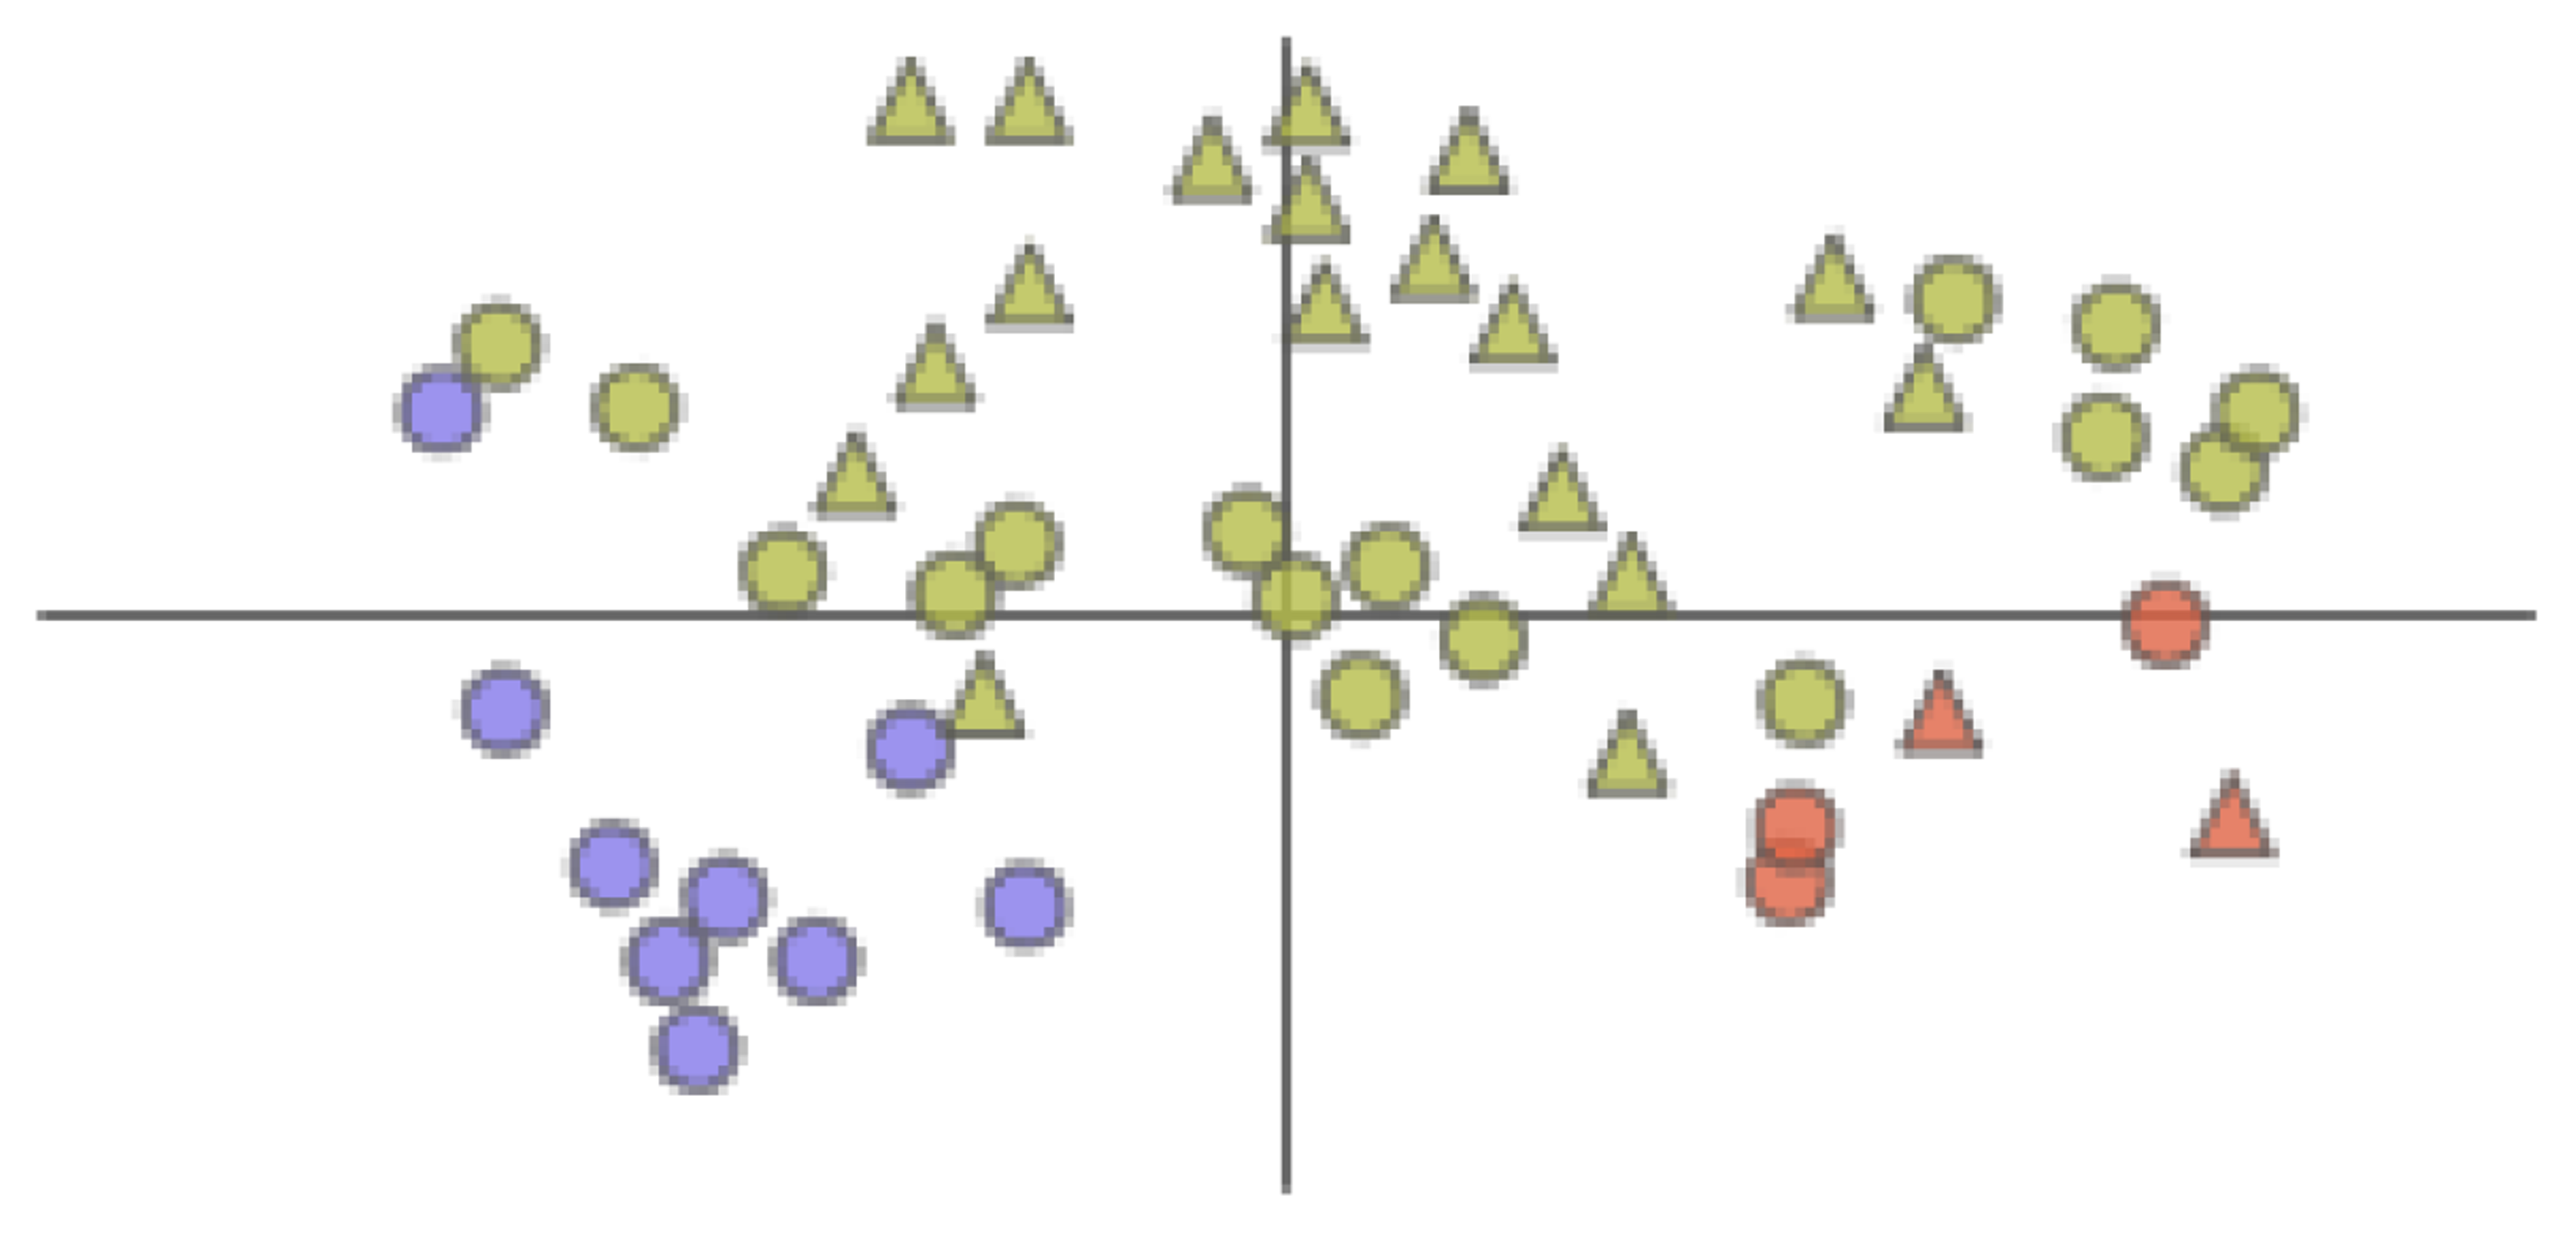
The AAFS Detailed Clustering View (see Figure 7) is a detailed display of the clustering subspace.
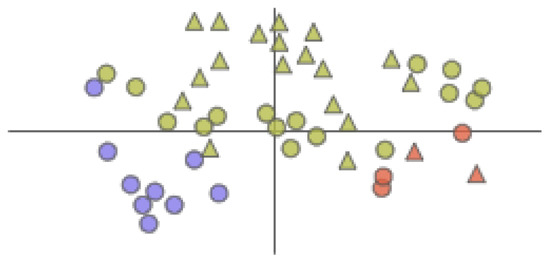
Figure 7.
The AAFS Detailed Clustering View displays the clustering subspace of the AAFS Clustering View. Different colors represent different clusters. The triangles in the plot represent the mapping of cavity-lining amino acids, and the circles represent the mapping of other amino acids.
The figure is a view of the cluster brush, allowing any cluster to be explored in detail (T4). The graph visualizes the distribution of cavity-lining amino acids and key amino acids in the cluster subspace. The triangles in the plot represent the mapping of cavity-lining amino acids, and the circles represent the mapping of other amino acids. If the two points in the figure are closer, it means that the movements of the two amino acids are more similar; therefore, the user identifies the key amino acids from the plot that moves similarly to each cavity-lining amino acid. In addition, when the user hovers over the corresponding legend, the sequence number of the amino acid contained in that type be displayed. Users combine these two graphs to find which amino acids are strongly correlated with the cavity-lining amino acids in movement, and these amino acids are likely to be mutation sites or allosteric sites.
5.3. Protein Cavity Dynamics Influencing Factors View
At the end of the analysis of the above diagram, the user is able to identify the direct and indirect amino acids that affect a certain part of the cavity, but it is difficult to have a clear idea of all the influencing factors, so it is necessary to design a diagram that outlines all the relationships between them (T3).
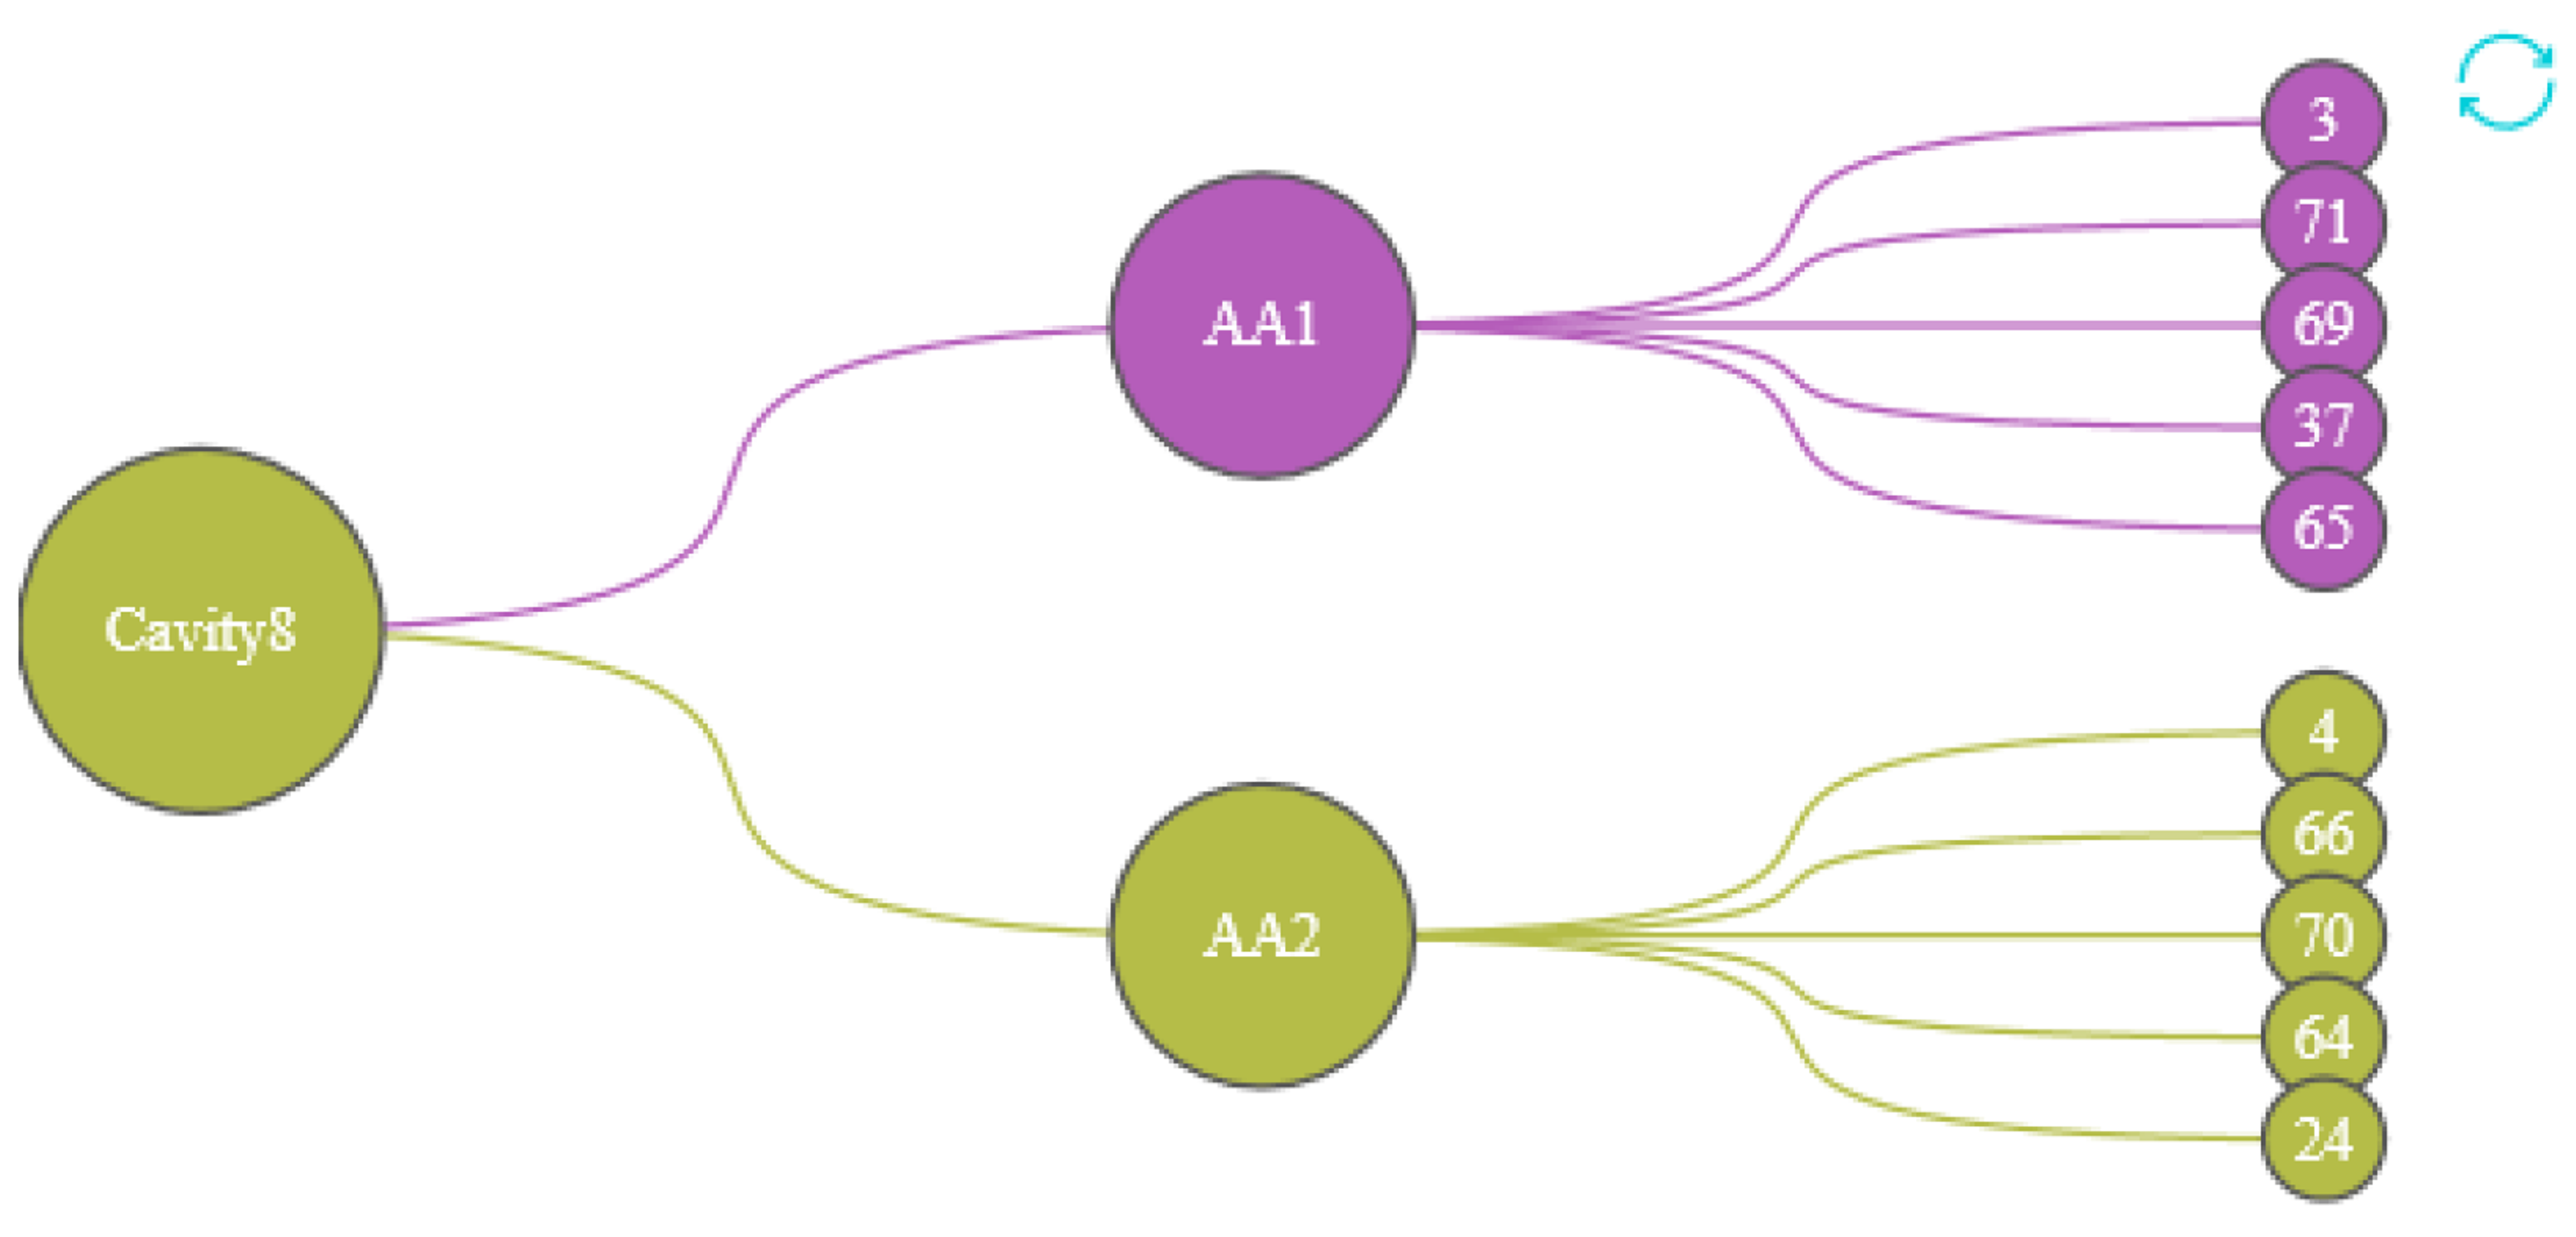
We designed the Protein Cavity Dynamics Influencing Factors View to show this, as shown in the Figure 8. The first layer of the view represents the cavity number, with the color of the node inheriting the cluster 5 (the cluster in which most of the cavity-lining amino acids are distributed); the second layer indicates the user of the cavity-lining amino acid selected in the cavity amino acid distribution map, with the color of the node representing the cluster in which that amino acid is distributed. The amino acids in the third layer are the top 5 amino acids that have a strong influence on the movement of the cavity-lining amino acids in the second layer, and the color of this node also represents the cluster in which this amino acid is distributed. By analyzing the graph as a whole, the user has a clear idea of the amino acids that affect any part of the cavity.
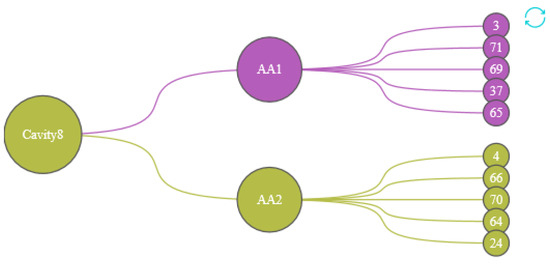
Figure 8.
The first layer represents the cavity number, the second layer represents the cavity-lining amino acids that affect the cavity, and the third layer of amino acids affects the cavity dynamics by affecting the amino acids in the second layer. The colors of the nodes are inherited from the AAFS Clustering View.
5.4. Protein Cavity Dynamics 3D View
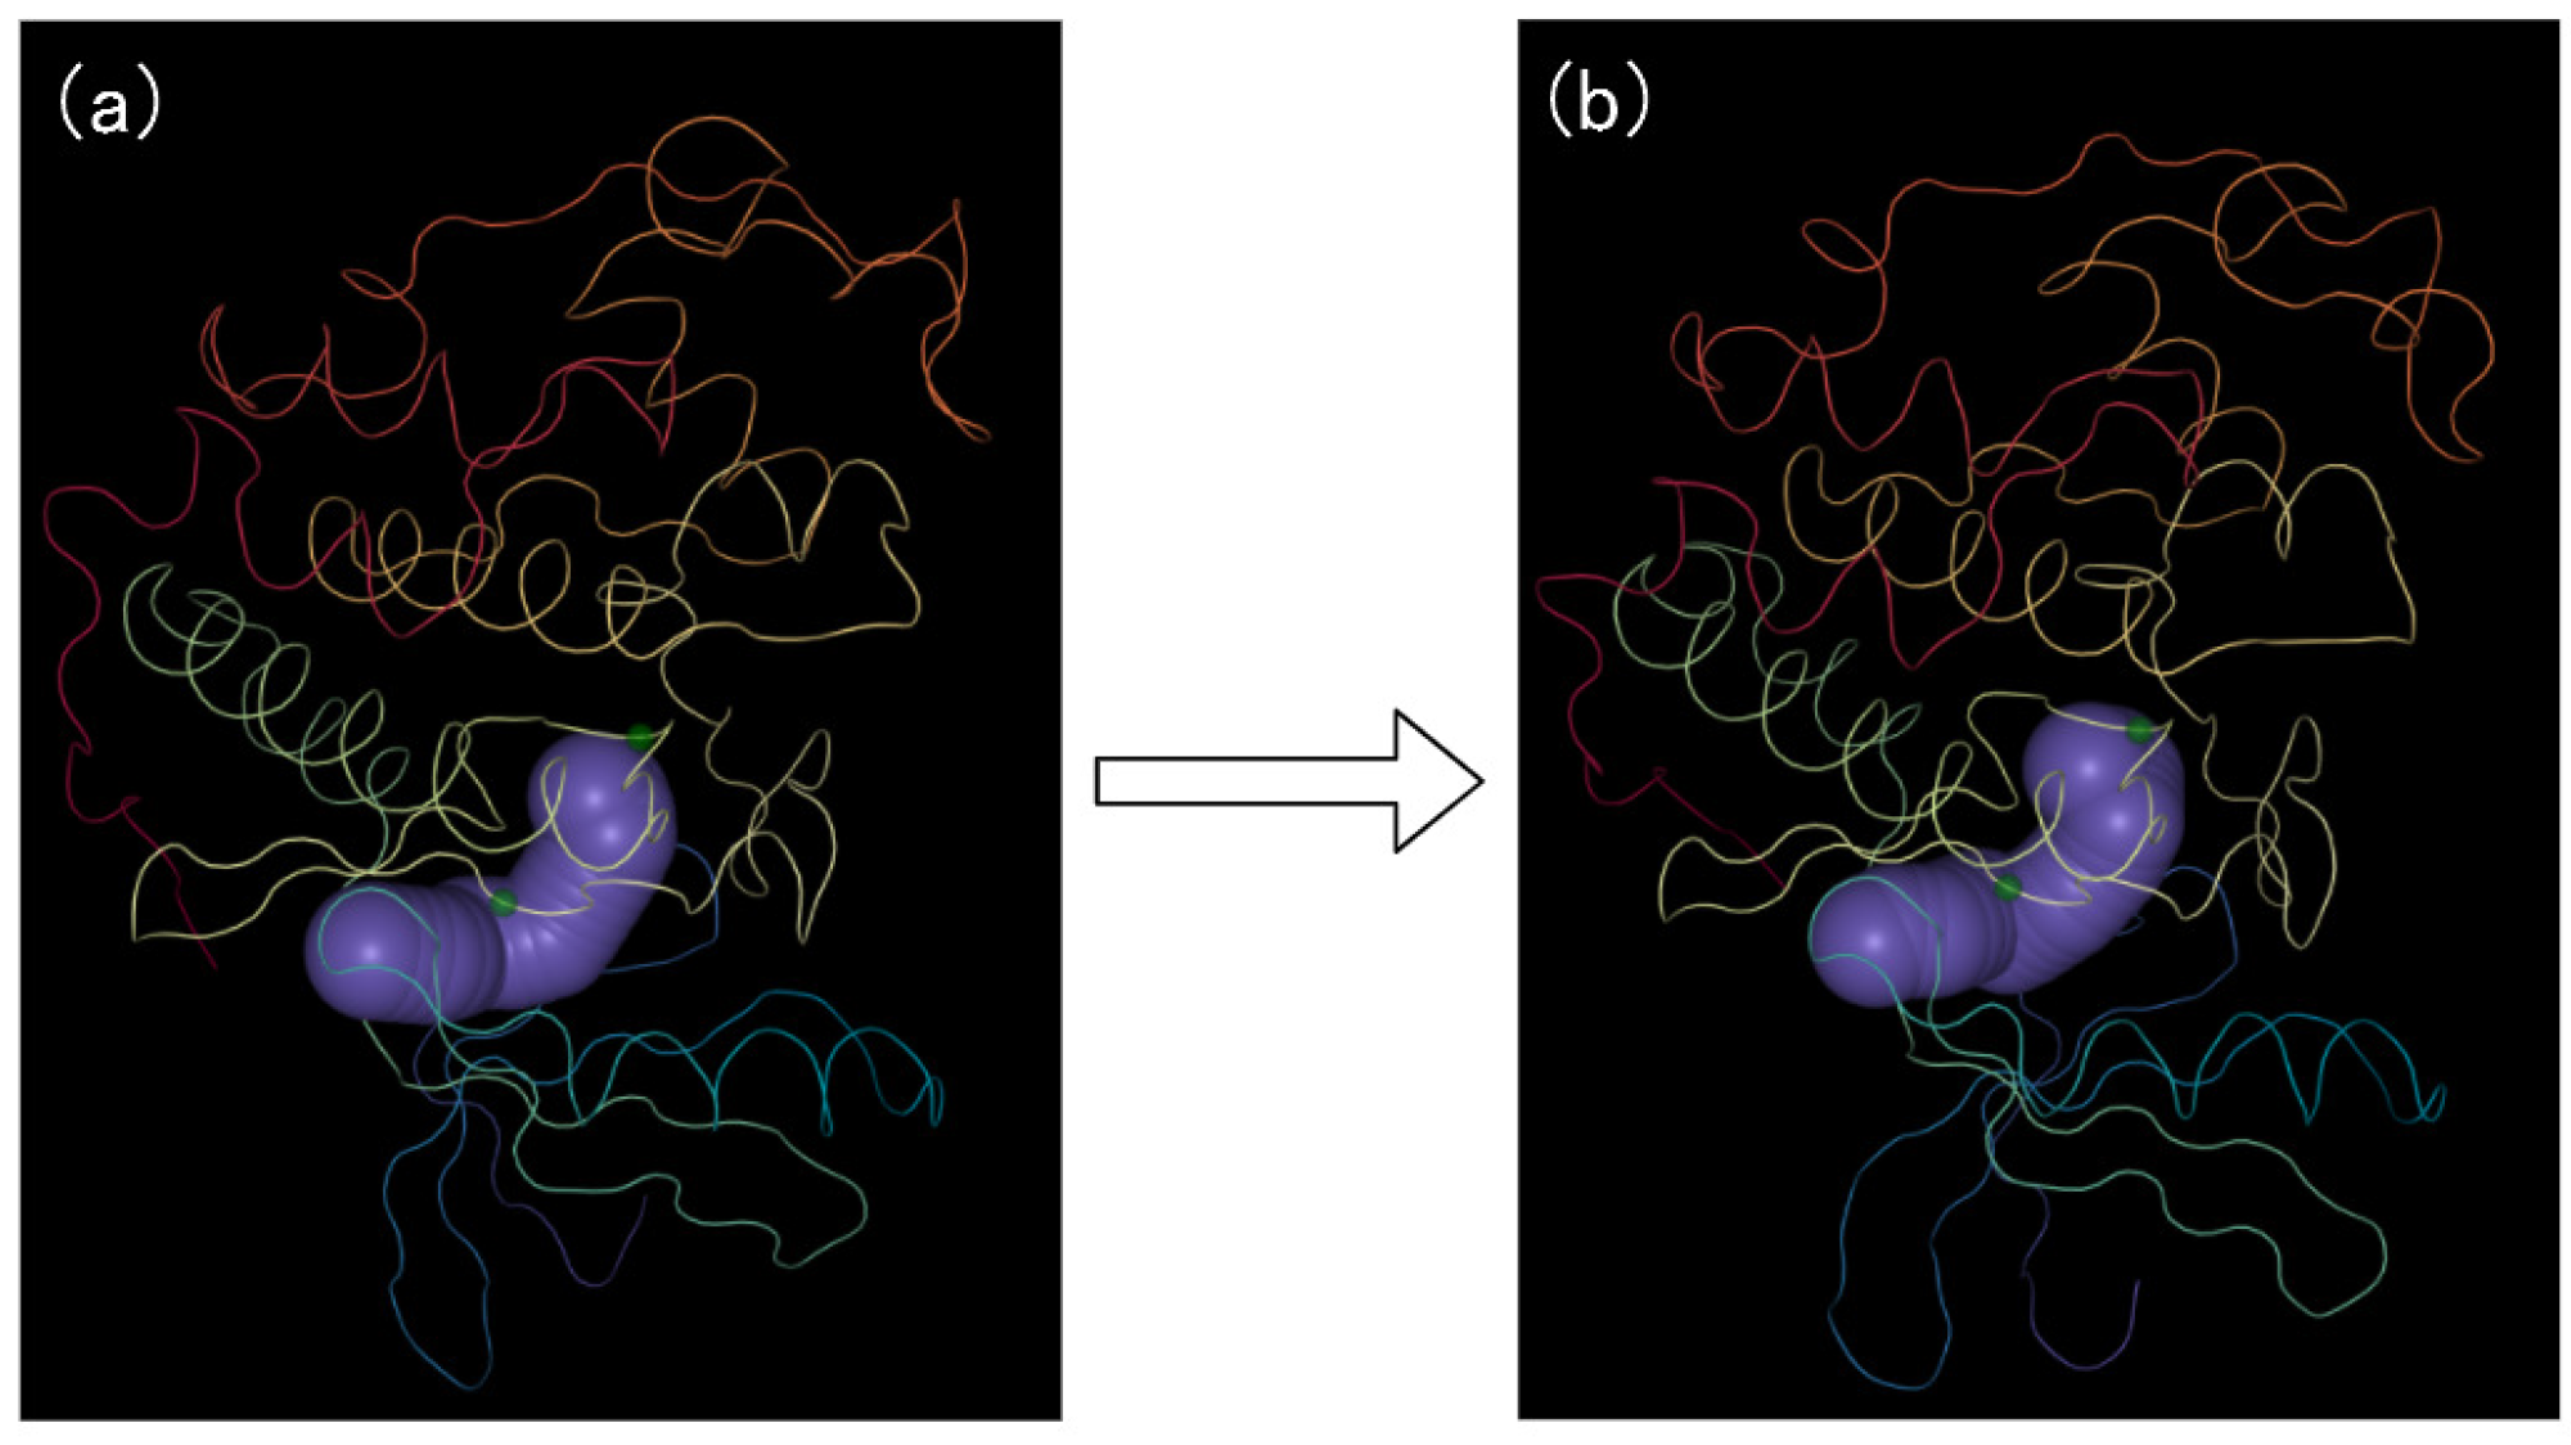
While the views described in previous sections provide an overview of key amino acid exploration. However, history confirms that for a proper understanding of the biological behavior, an in-depth investigation of the 3D structure is crucial [40], and cannot be fully replaced by sole statistical analysis (T5). The domain experts have confirmed that 3D animations are still important as an exploratory tool, as well as for presenting their findings. In our work, the 2D view completely abstracts the spatial characteristics of the protein. Therefore, the PCD 3D View (see Figure 9) is used to strengthen the understanding of the influence of the key amino acids on the cavity dynamics, and allows it to spatially resolve this information. The PCD 3D View supports the currently selected cavity, and the amino acids are visualized in the context of the relevant protein molecule. Users can highlight key amino acids and amino acids around the active site in the view. Through the PCD 3D View (see Figure 9), a user could easily identify the relation between the movements of the amino acids and the motions of the cavity. The movements of key amino acids and the cavity-lining amino acids cause the dynamic changes of the cavity.
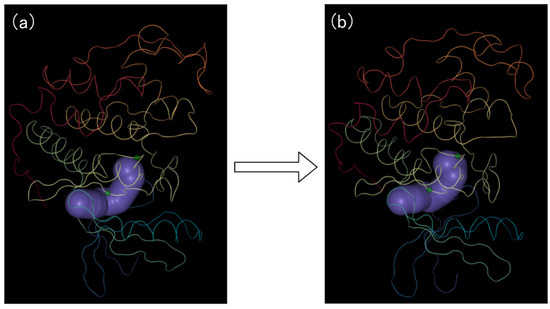
Figure 9.
The PCD 3D View shows the protein structure, cavities, and amino acids dynamically changing over time. (a) represents the initial conformation of the molecular motion; (b) represents the end conformation of the molecular motion. The cavity is shown in purple. The protein molecule cartoon is shown in multiple colors.
6. Interactive Exploration
Analyzing the reasons that affect the dynamic changes of the cavity requires interactive operations between multiple views (see Figure 10). The main purpose of our interaction is to simplify complex processes. Through our approach, users can intuitively and quickly obtain the knowledge that they are interested in (T1–T6).
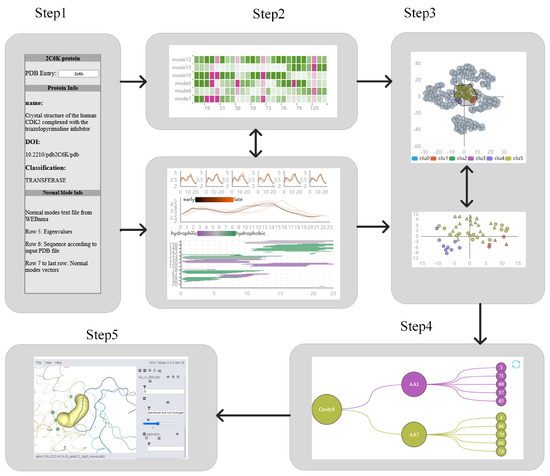
Figure 10.
The interactive exploration process. Our exploration process is divided into 5 steps, namely, the overview of basic protein information, discovering the influence of cavity-lining amino acids on the cavity, identifying key amino acids, exploring the relationship among key amino acids and the cavity, and 3D exploration.
The basic information about the protein, active site, and normal mode is displayed in textual form on the far left of the system. The PC Detail View shows the dynamics of the cavity over time and the changes of amino acids around the cavity, from which the user can find the direct factors affecting the cavity. The top part of the figure shows an overview of the cavity aspect view in low mode. When the users click on a different mode, the Length–Width View and the amino acids distribution map of the cavity change accordingly. The middle part will show the length and width of the cavity at each time slice, and the bottom part will show the distribution of amino acids around the cavity. Users can view the fluctuations of amino acids inside the cavity through the HeatMap, so that they can better understand what is causing the dynamic defense of the cavity. The fluctuations of cavity-lining amino acids are closely related to the fluctuations of key amino acids. Therefore, the method of t-SNE + K-means was used in this system for dimensionality reduction clustering, and mapped in the 2D table. The detailed view of the clustering will show the boxed amino acids if the user can make a selection in the AAFS Clustering View. In the Detailed Cluster View, the triangles represent amino acids in the cavity, and the circles are other amino acids, enhancing the domain expert’s understanding of the changing lumen dynamics. The final PCD 3D View will display contextual information about the lumen and key amino acids and show them over time, and to visualize the impact of key amino acids and cavity-lining amino acids.
7. Results
7.1. Case Study
To evaluate the usability of our method, the crystal structure of CDK2 (PDB code: 2C6K [41]) was uploaded as the input structure (T6). Recent research [14] shows that the Arg 150 and Tyr 180 were recognized as key amino acids affecting the active sites. We calculate 200 normal modes of CDK2 through the WEBnm@ tool, and obtain the root-mean-square fluctuation data of amino acid atoms and the simple vibration mode vector. The cavity was calculated by using LiteMol and Caver Analyst 2.0, and the cavity sequence and cavity-lining amino acids were extracted. The normal mode is reduced and clustered by using t-SNE and K-means. The data format is shown in Figure 3. Based on this case, the following interactive analysis was carried out.
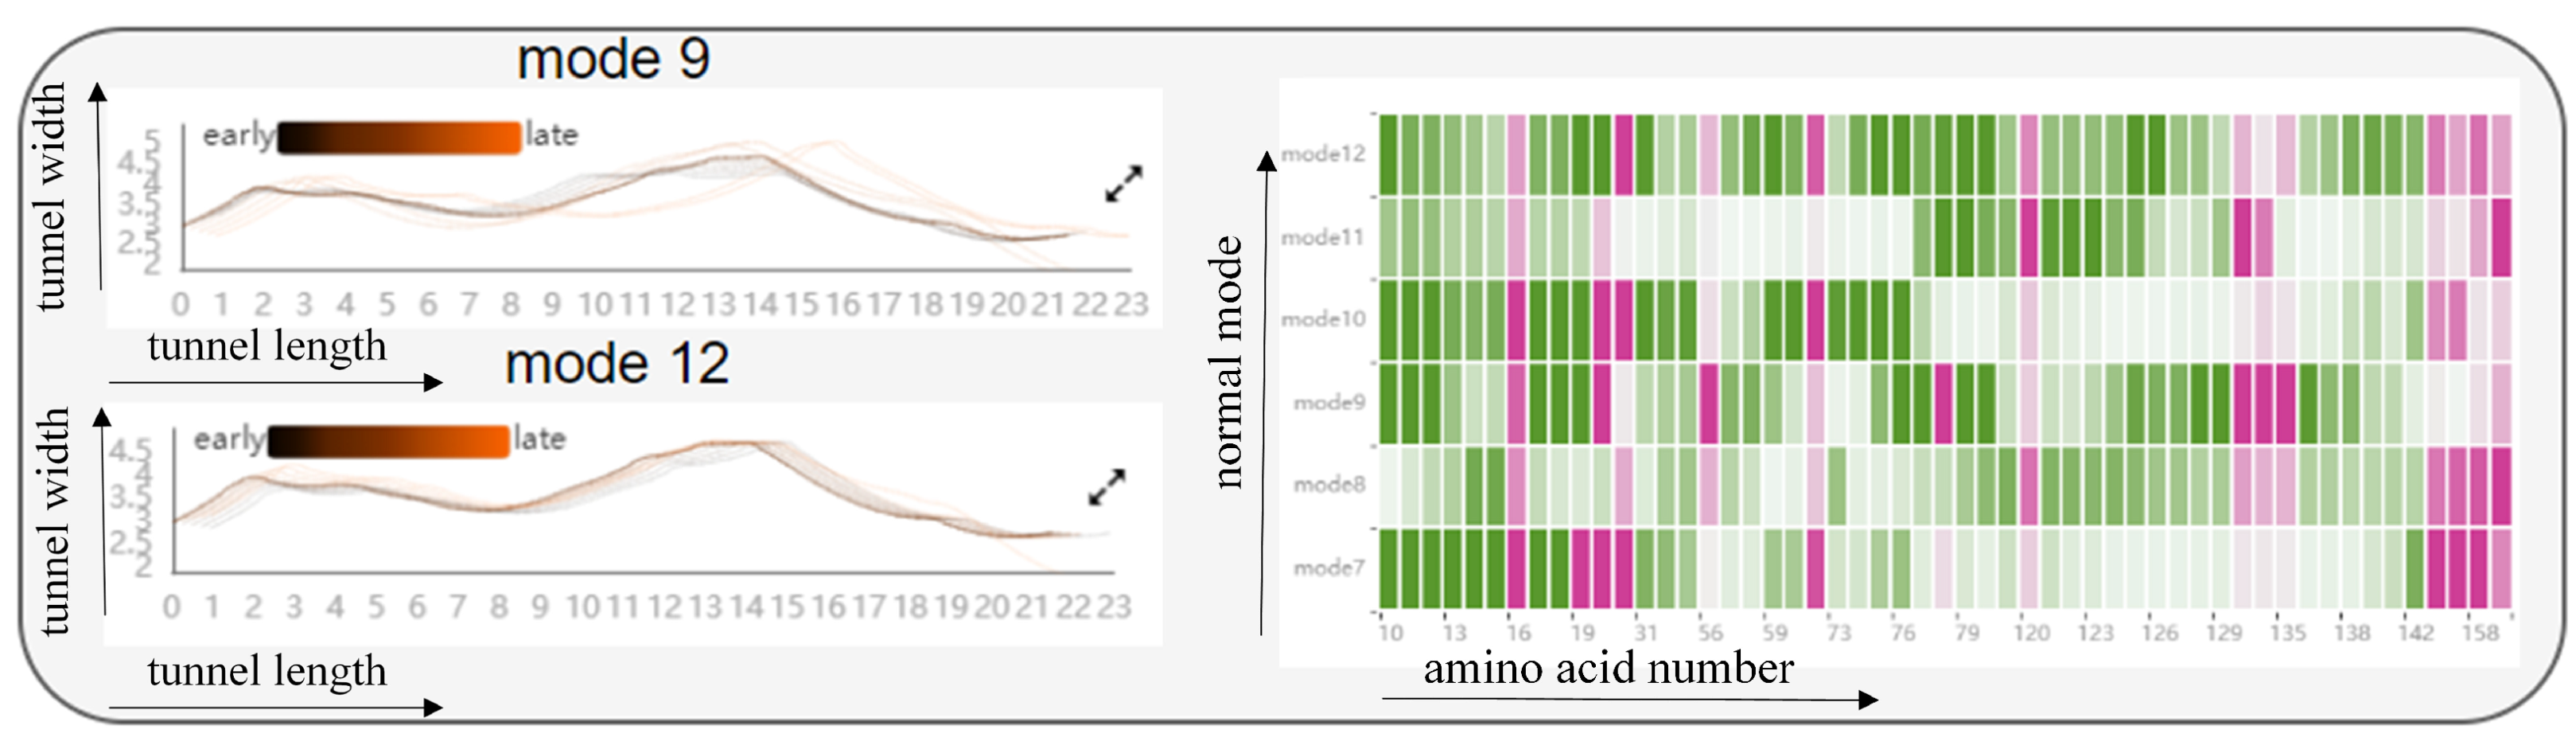
Firstly, regarding the effect of cavity-lining amino acids on the cavity, we designed the Cavity Length–Width View, the Cavity-lining Amino Acid Distribution View, and the AAF HeatMap View (see Figure 11 and Figure 12). These views show static information about the radius of the molecular cavity, the distribution of the surrounding amino acids, and the properties of the amino acids at different time slices, while it allows users to explore the fluctuations of cavity-lining amino acids at different times slices. As shown in the Figure 11, the AAF HeatMap View shows that any of the amino acids in mode 12 fluctuate strongly, and as these amino acid fluctuations are relatively consistent overall, the Cavity Length–Width View reveals that the changes in the cavity remain unremarkable. In contrast to this is mode 9, where there is a clear difference in the amino acid fluctuations, with some amino acids fluctuating strongly and others fluctuating less, and the distribution of these dramatically fluctuating amino acids is highly dispersed. Ultimately, we can see from the Cavity Length–Width View that the cavity of mode 9 is changing strongly. From these findings, we can conclude that the scattered, disordered movement of amino acids around the cavity has a greater effect on the cavity than the overall, regular movement.

Figure 11.
The graph shows the relationship between the fluctuations of amino acids around the cavity, and the radius of the cavity by means of a HeatMap and two line graphs: from the HeatMap, we can see that the fluctuations of amino acids around the cavity in mode 12 are all violent, while in mode 9, some of the amino acids around the cavity are violent and some fluctuate very little; from the two line graphs, we can observe that the cavity in mode 9 changes more significantly, while the cavity in mode 12 hardly changes at all. The black line represents the early state of the cavity and the orange line the late state of the cavity. Pink means that the amino acid is present around the cavity, and green means that it is not present around the cavity, where the shade of color represents the level of fluctuation of the amino acid.
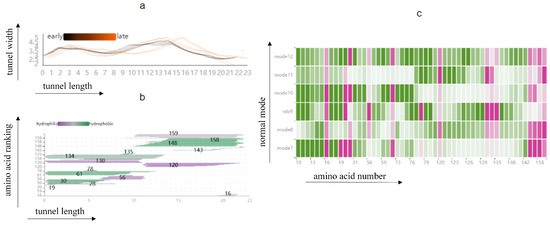
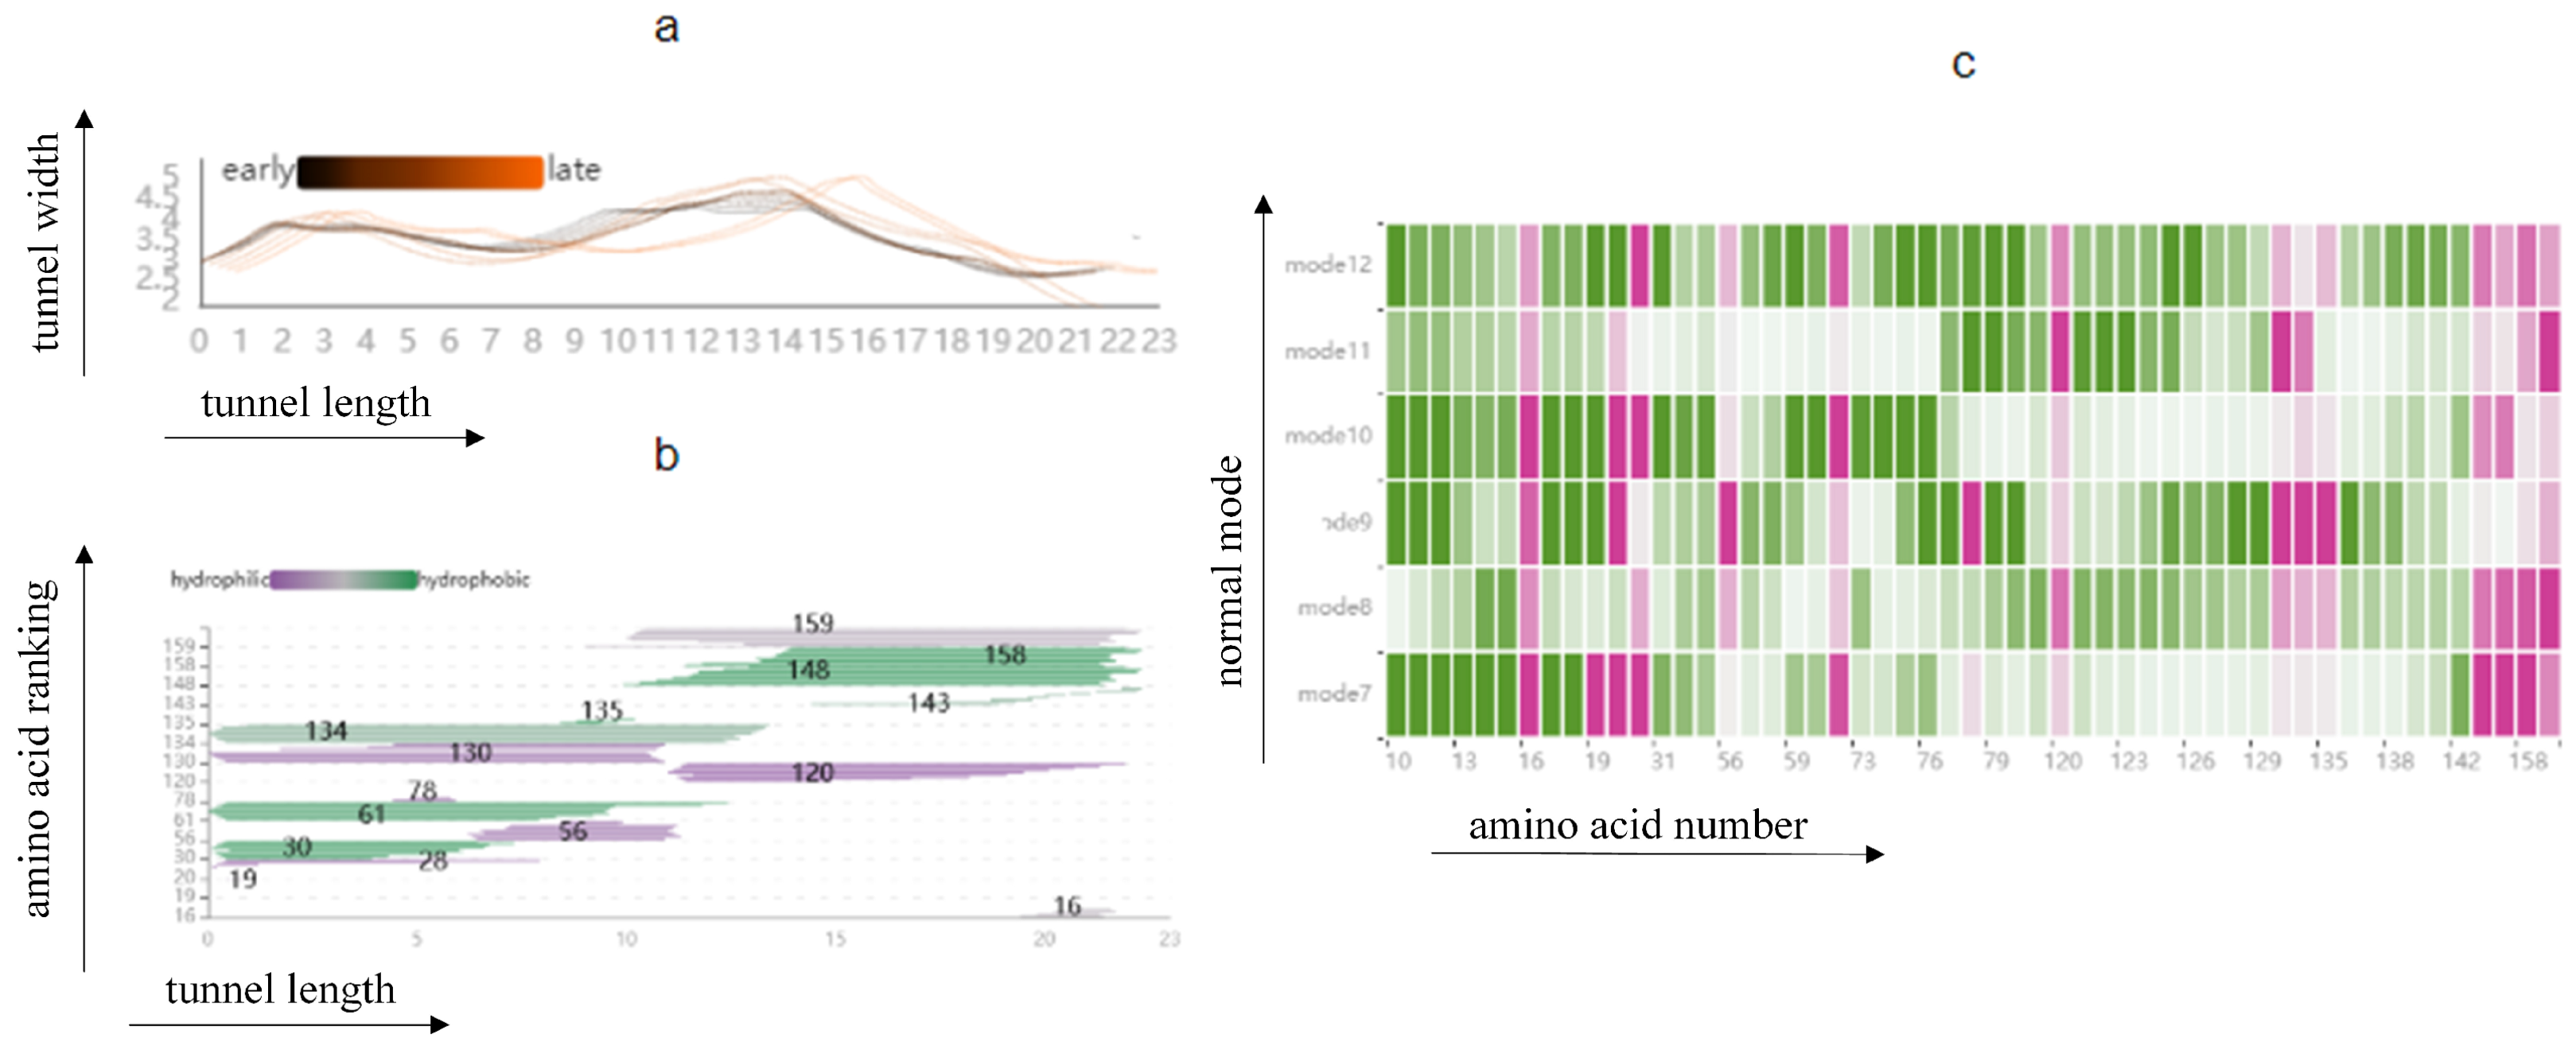
Figure 12.
The graph shows information about the cavity and its surrounding amino acids: (a) Line graph showing the change in cavity radius and length with time; (b) histogram combined with line graph illustrating the distribution of amino acids around the cavity; (c) HeatMap showing the fluctuation of amino acids around the cavity.
In addition, the distribution of amino acids around the cavity and their properties can be analyzed in depth using the Cavity Length–Width View, the Cavity-lining Amino Acid Distribution View, and the AAF HeatMap View (Figure 12). The Cavity Length–Width View shows a visible change in radius in the second half of the cavity in mode 9. The Cavity-lining Amino Acid Distribution View shows the amino acid numbers around the second half of the cavity, which are 158, 148, 143, 120, and 16. Finally, we find from Figure 12c that these cavity-lining amino acids fluctuate little, except for amino acid 16, which fluctuates very similarly across the six modes. Therefore, we reasonably guess that it is not only the violent fluctuation of cavity-lining amino acid 16 that affects the strong change in the lower half of the cavity, but also the fluctuation of key amino acids that may affect the fluctuation of amino acid atoms in other cavity-lining amino acids, thus affecting the change of the cavity.
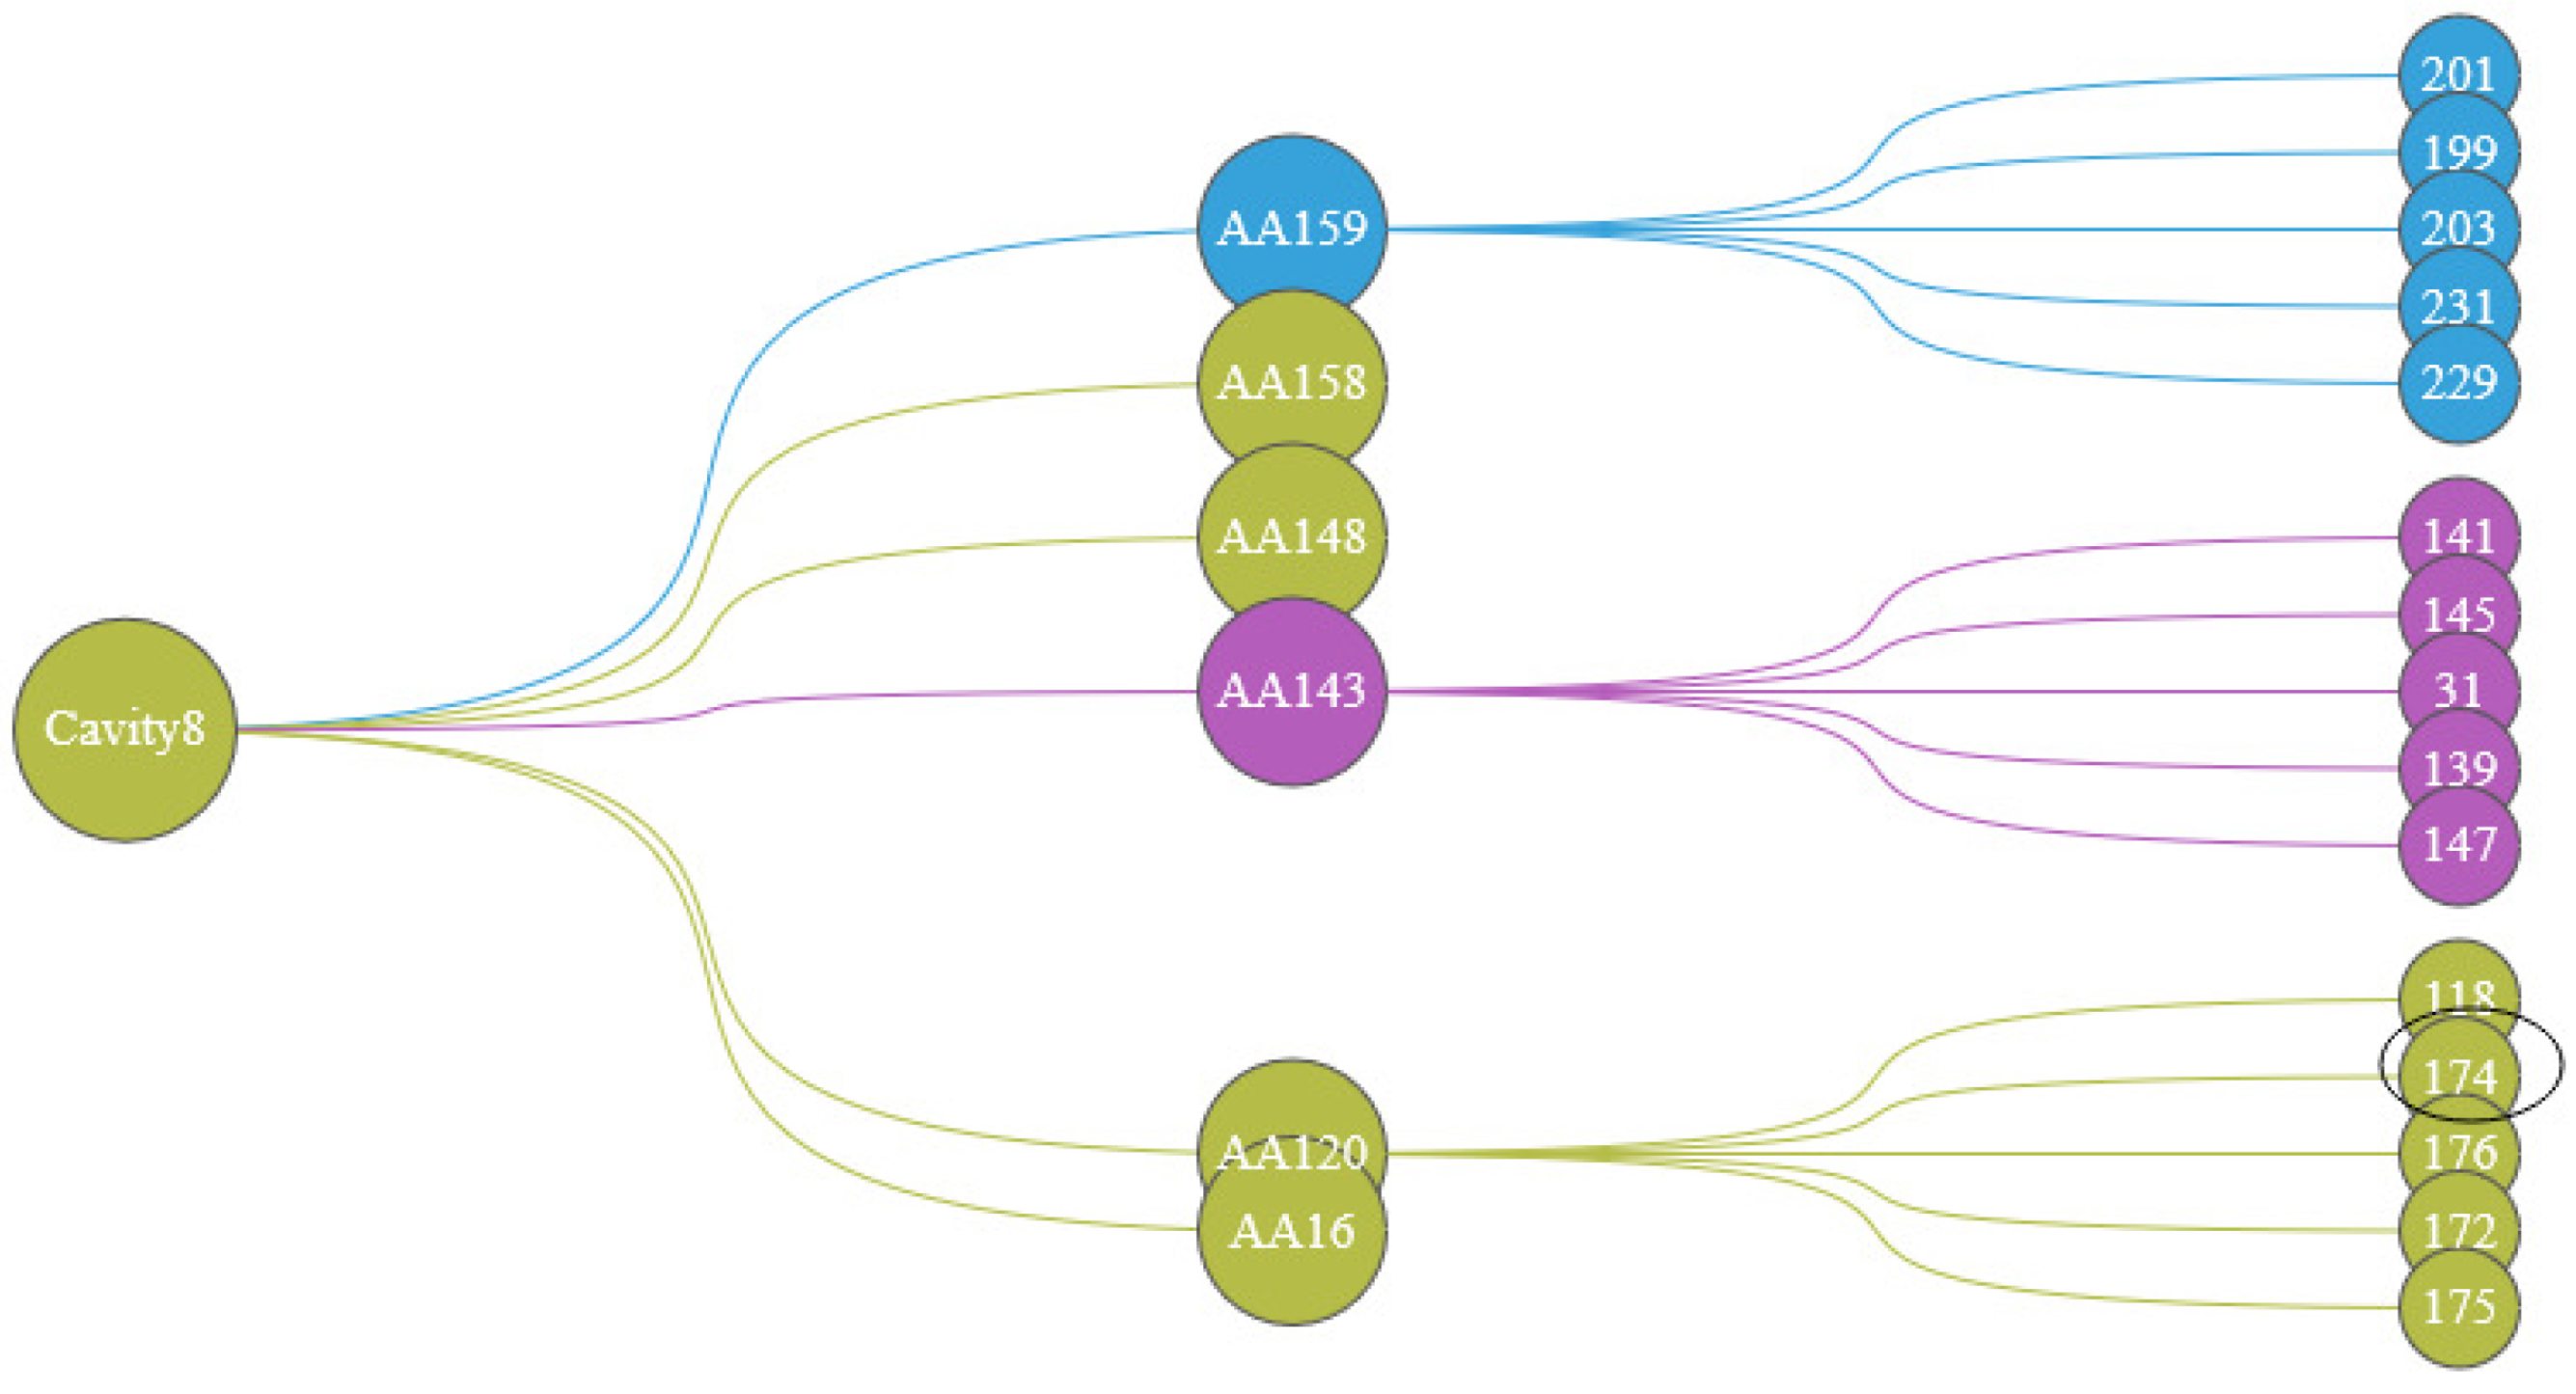
In order to further analyze the indirect factors that may affect the dynamics of the cavity, we show the relationship between amino acids in the Protein Cavity Dynamics Influencing Factors View. We can see from the cavity amino acids distribution diagram (Figure 12b) that the reason for the greater cavity change is that the amino acids 159, 158, 148, 143, 120, and 16 fluctuate greatly. Click on the histogram area of these six amino acids, The PCDIF View will show the key amino acids that affect the movements of these six amino acids (Figure 13). We also found that the allosteric site 174 affects the cavity by affecting the fluctuations of the cavity-lining amino acids 120. Through the hydrophilicity of cavity-lining amino acids atoms and the frequency of their occurrence in the cavity trajectory, we may pay more attention to amino acid 120. The key atoms that affect the cavity-lining amino acid atom 120 are 118, 174, 176, 172, and 175.

Figure 13.
The PCDIF View shows the effect of amino acids on the cavity, with the first layer representing cavity 8, the second layer representing the amino acids surrounding that cavity (AA 159, AA 158, AA 148, AA 143, AA 120, AA 16), and the third layer representing the key amino acids that affect the cavity’s dynamics. The color of the node representing the cluster in which that amino acid is distributed.
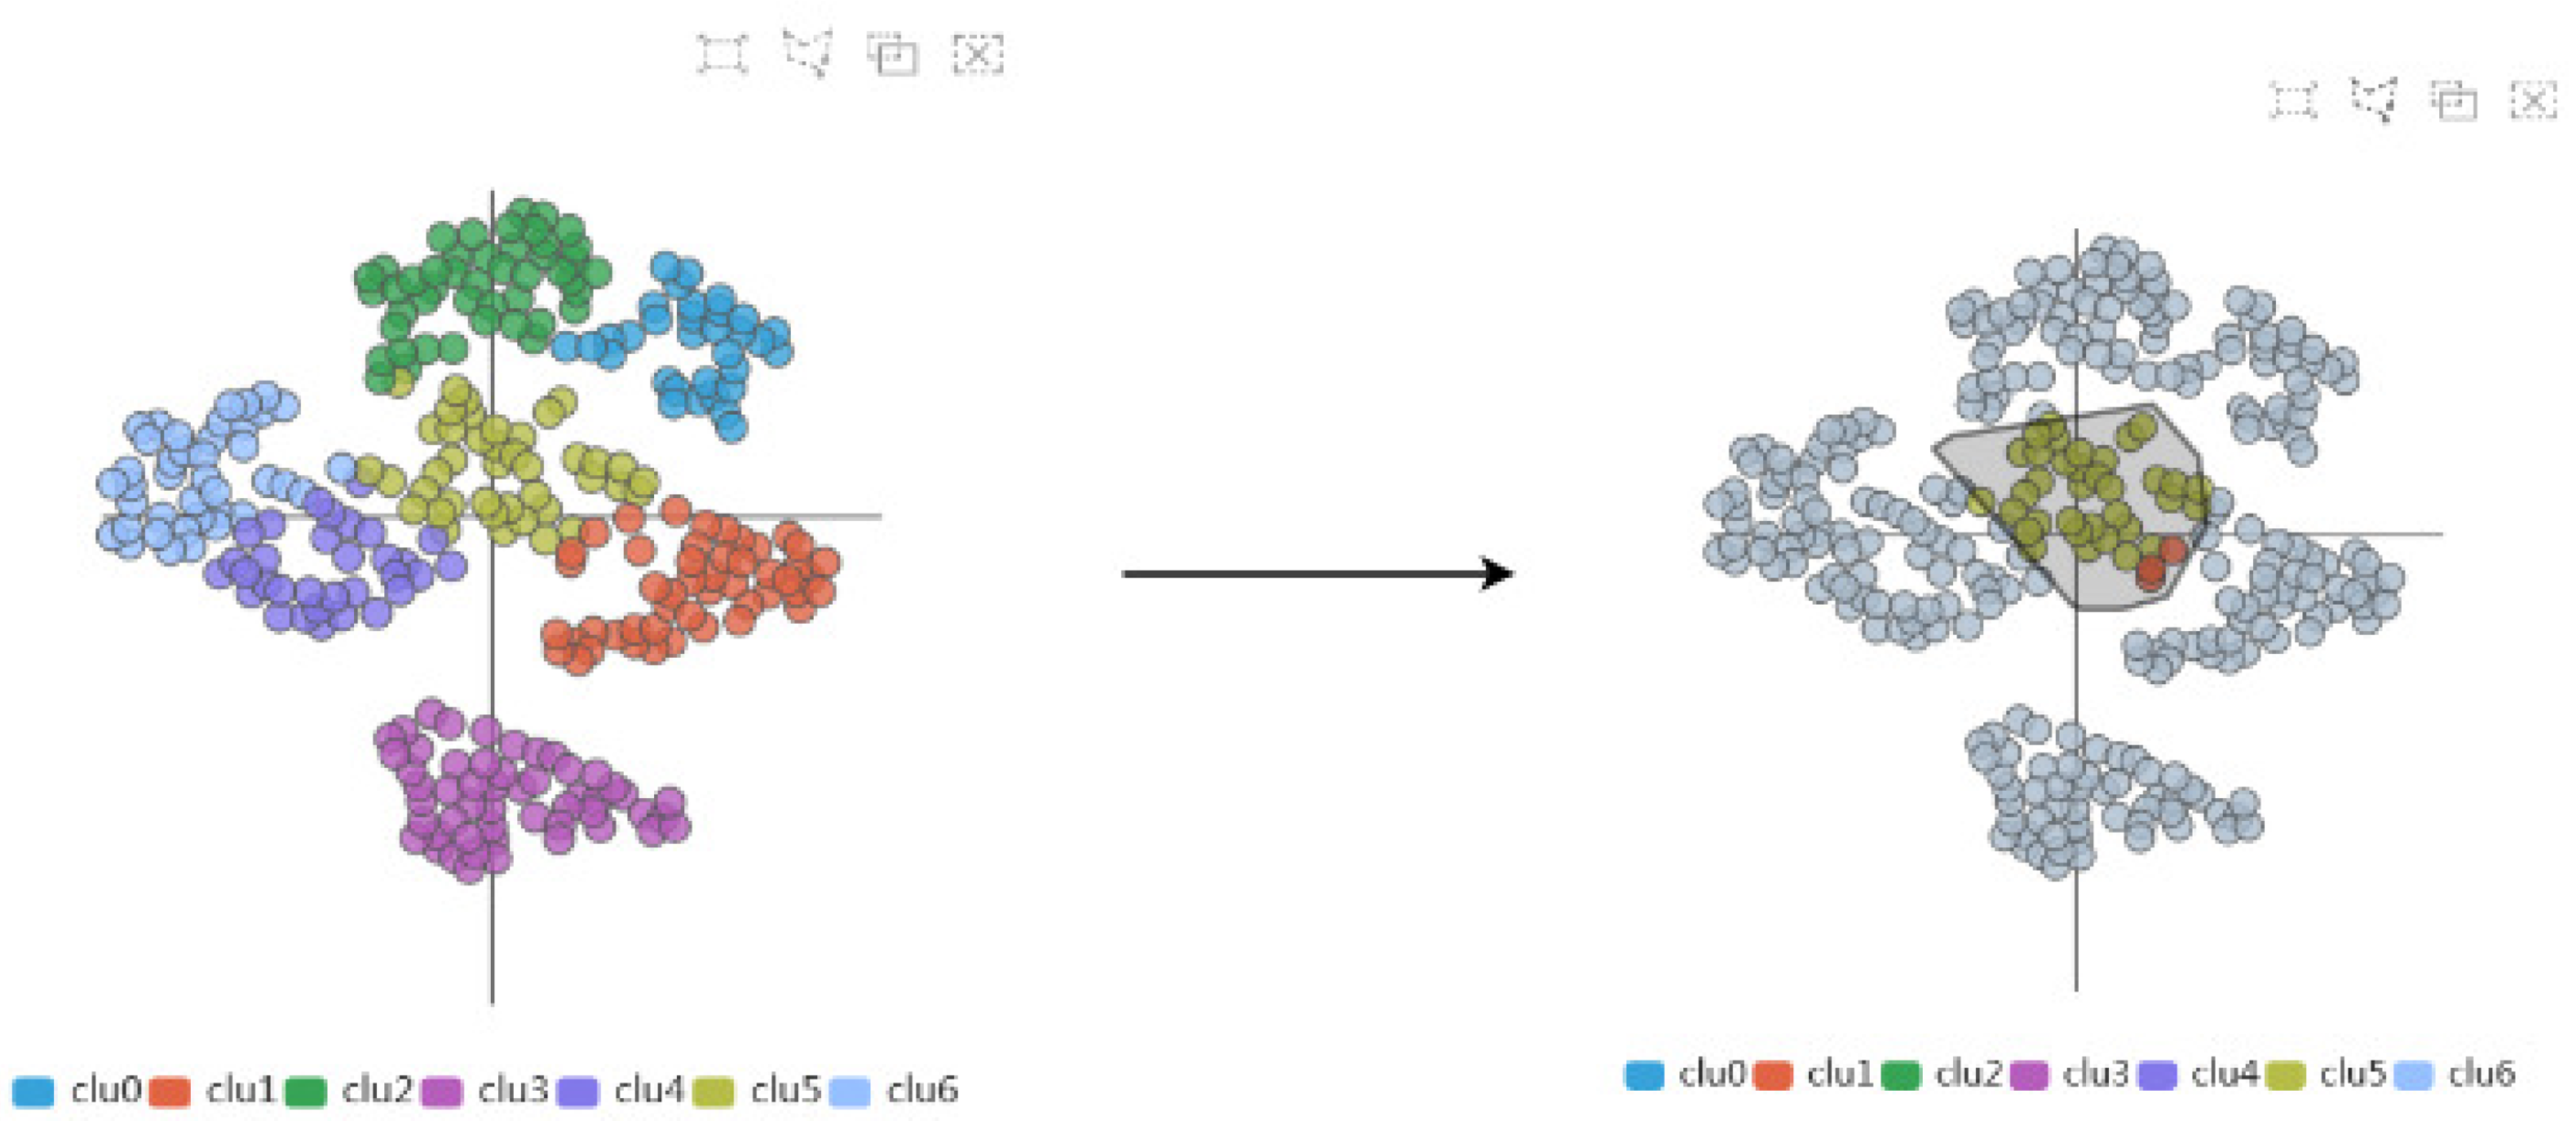
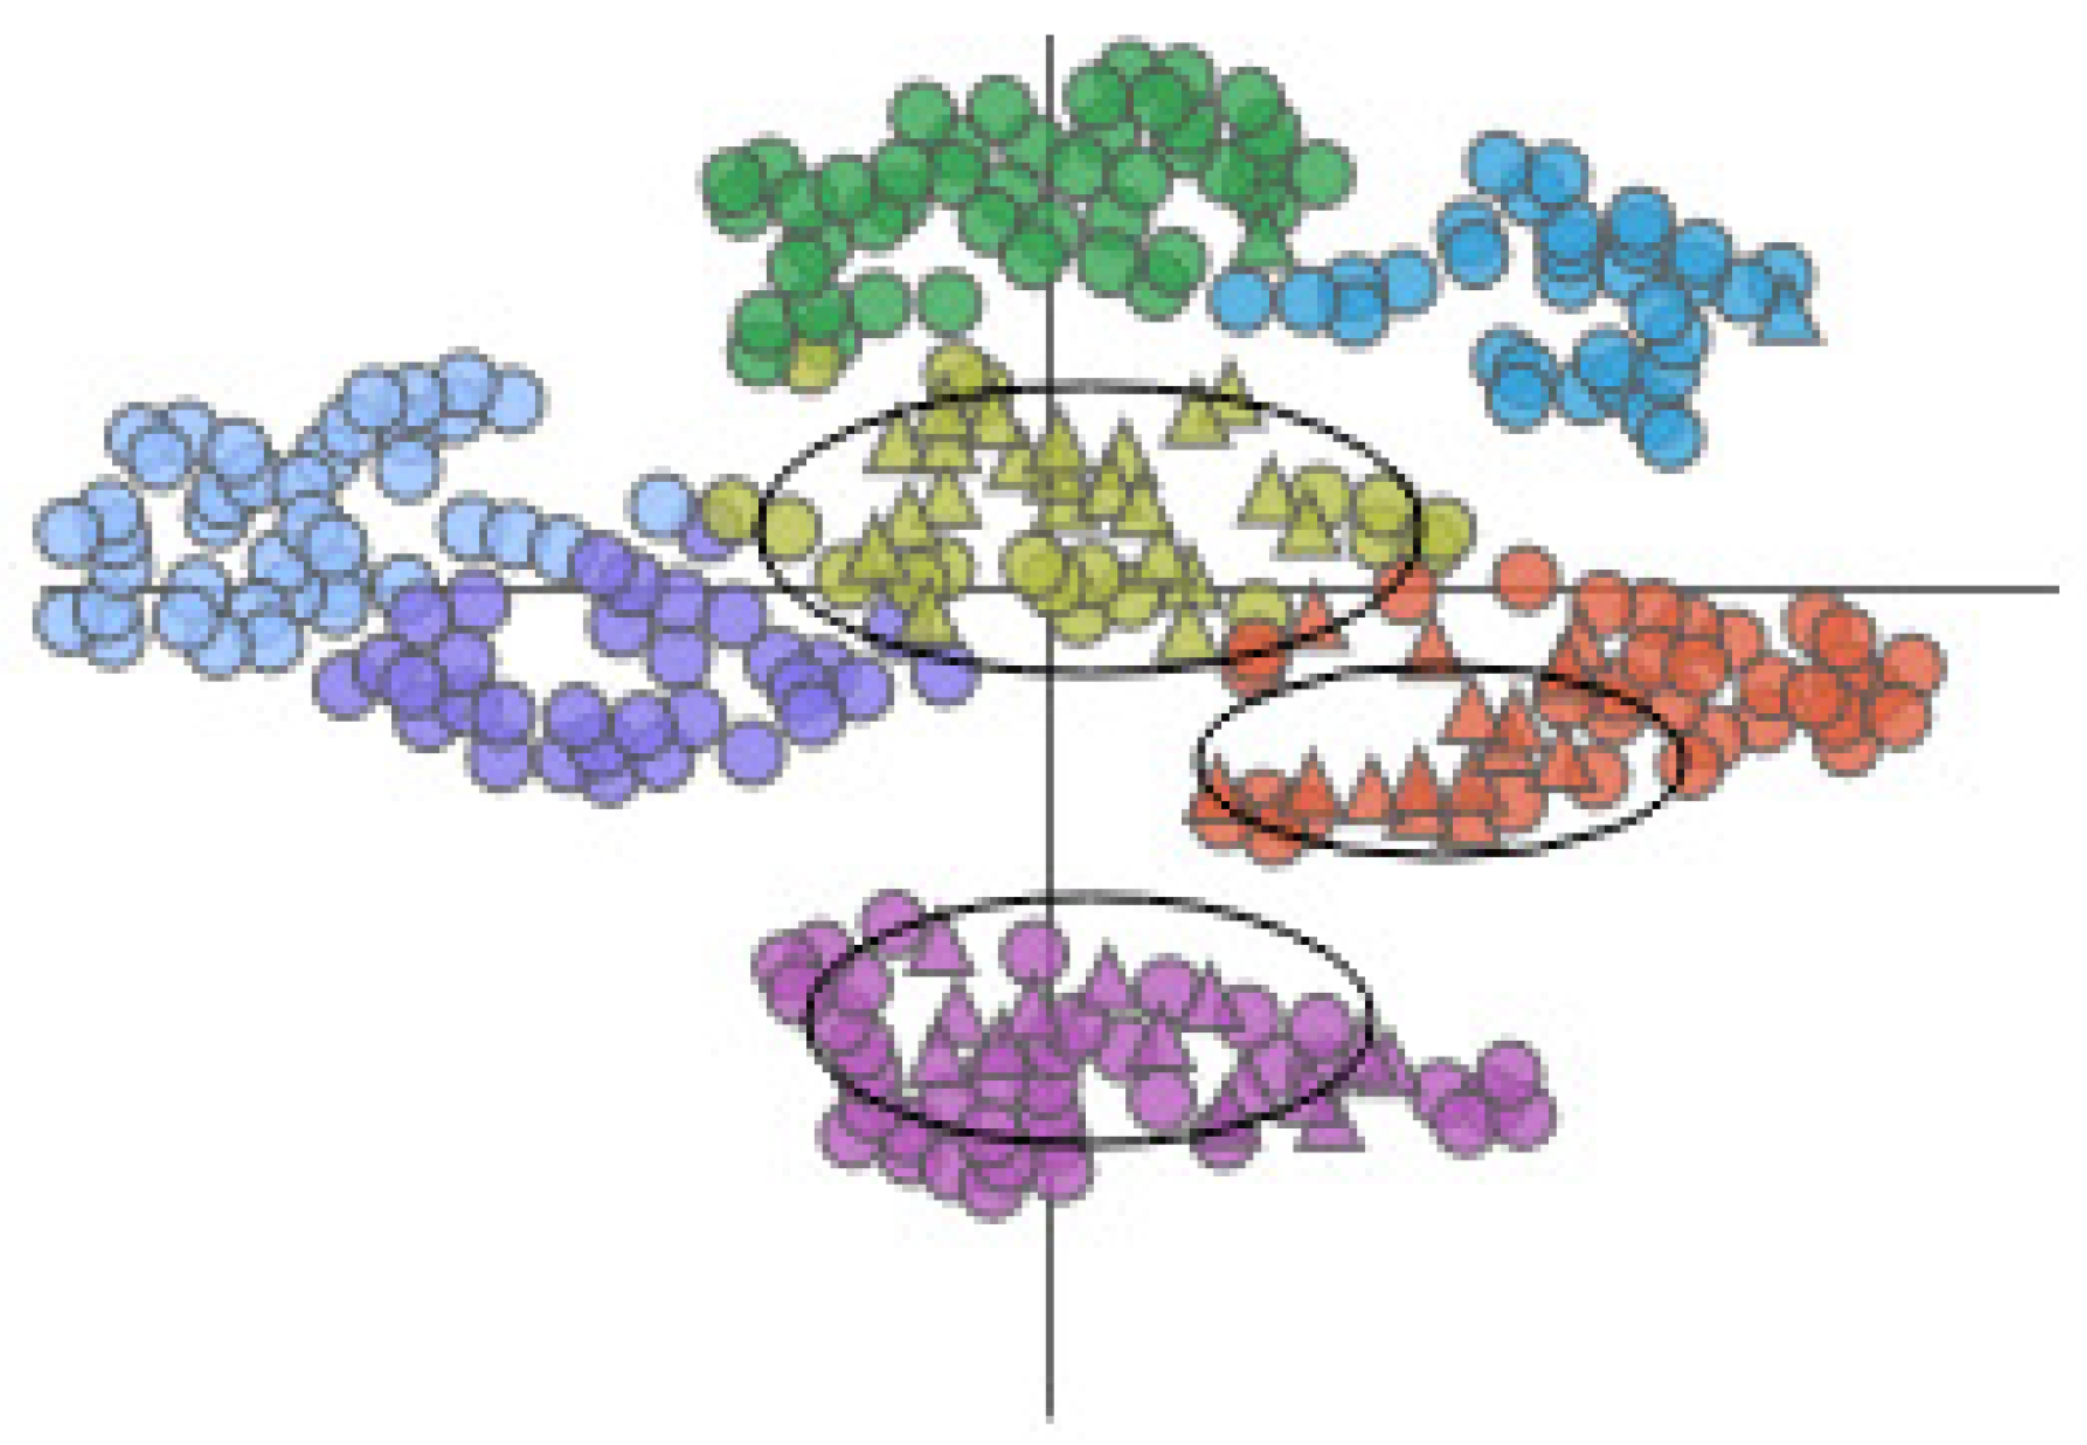
Secondly, through the AAFS Clustering View and the AAFS Detailed Clustering View, we can more comprehensively analyze the key atoms that are more similar to the cavity-lining amino acid atoms in multimodality. It has been shown that the cavity allosteric sites are closely related to the motions of the cavity-lining amino acids. However, finding relationships from a large amount of data is a difficult task; therefore, it is necessary to reduce the dimensionality of the normal mode data. The amino acids displacement data after dimensional reduction clustering is depicted as a 2D scatter plot (see Figure 14). The plot is checked by the user, and the details of the plot will be visible in the detailed view. In the detailed view, the small triangles mainly represent the cavity-lining amino acids, and the small circles represent the amino acids. The colors of these elements are inherited from the above diagram and represent the different clusters. Combining these two diagrams, we can see that most of the cavity-lining amino acids are distributed in cluster 5, with a few in clusters 1 and 3 (see Figure 15). We also find that the amino acids around the cavity generally fluctuate slightly (the amino acids were mostly distributed near the coordinate axis), indicating that the cavity is relatively stable. In biology, stable cavities are more suitable for complex reactions.

Figure 14.
The AAFS Clustering View frame selection process. We can select any region in the AAFS Clustering View, and the corresponding details will be displayed in the AAFS Detailed Clustering View.

Figure 15.
The AAFS Detailed Clustering View shows the distribution of selected amino acids, where the black oval marks the cavity-lining amino acids. Different colors represent different clusters. The triangles in the plot represent the mapping of cavity-lining amino acids, and the circles represent the mapping of other amino acids.
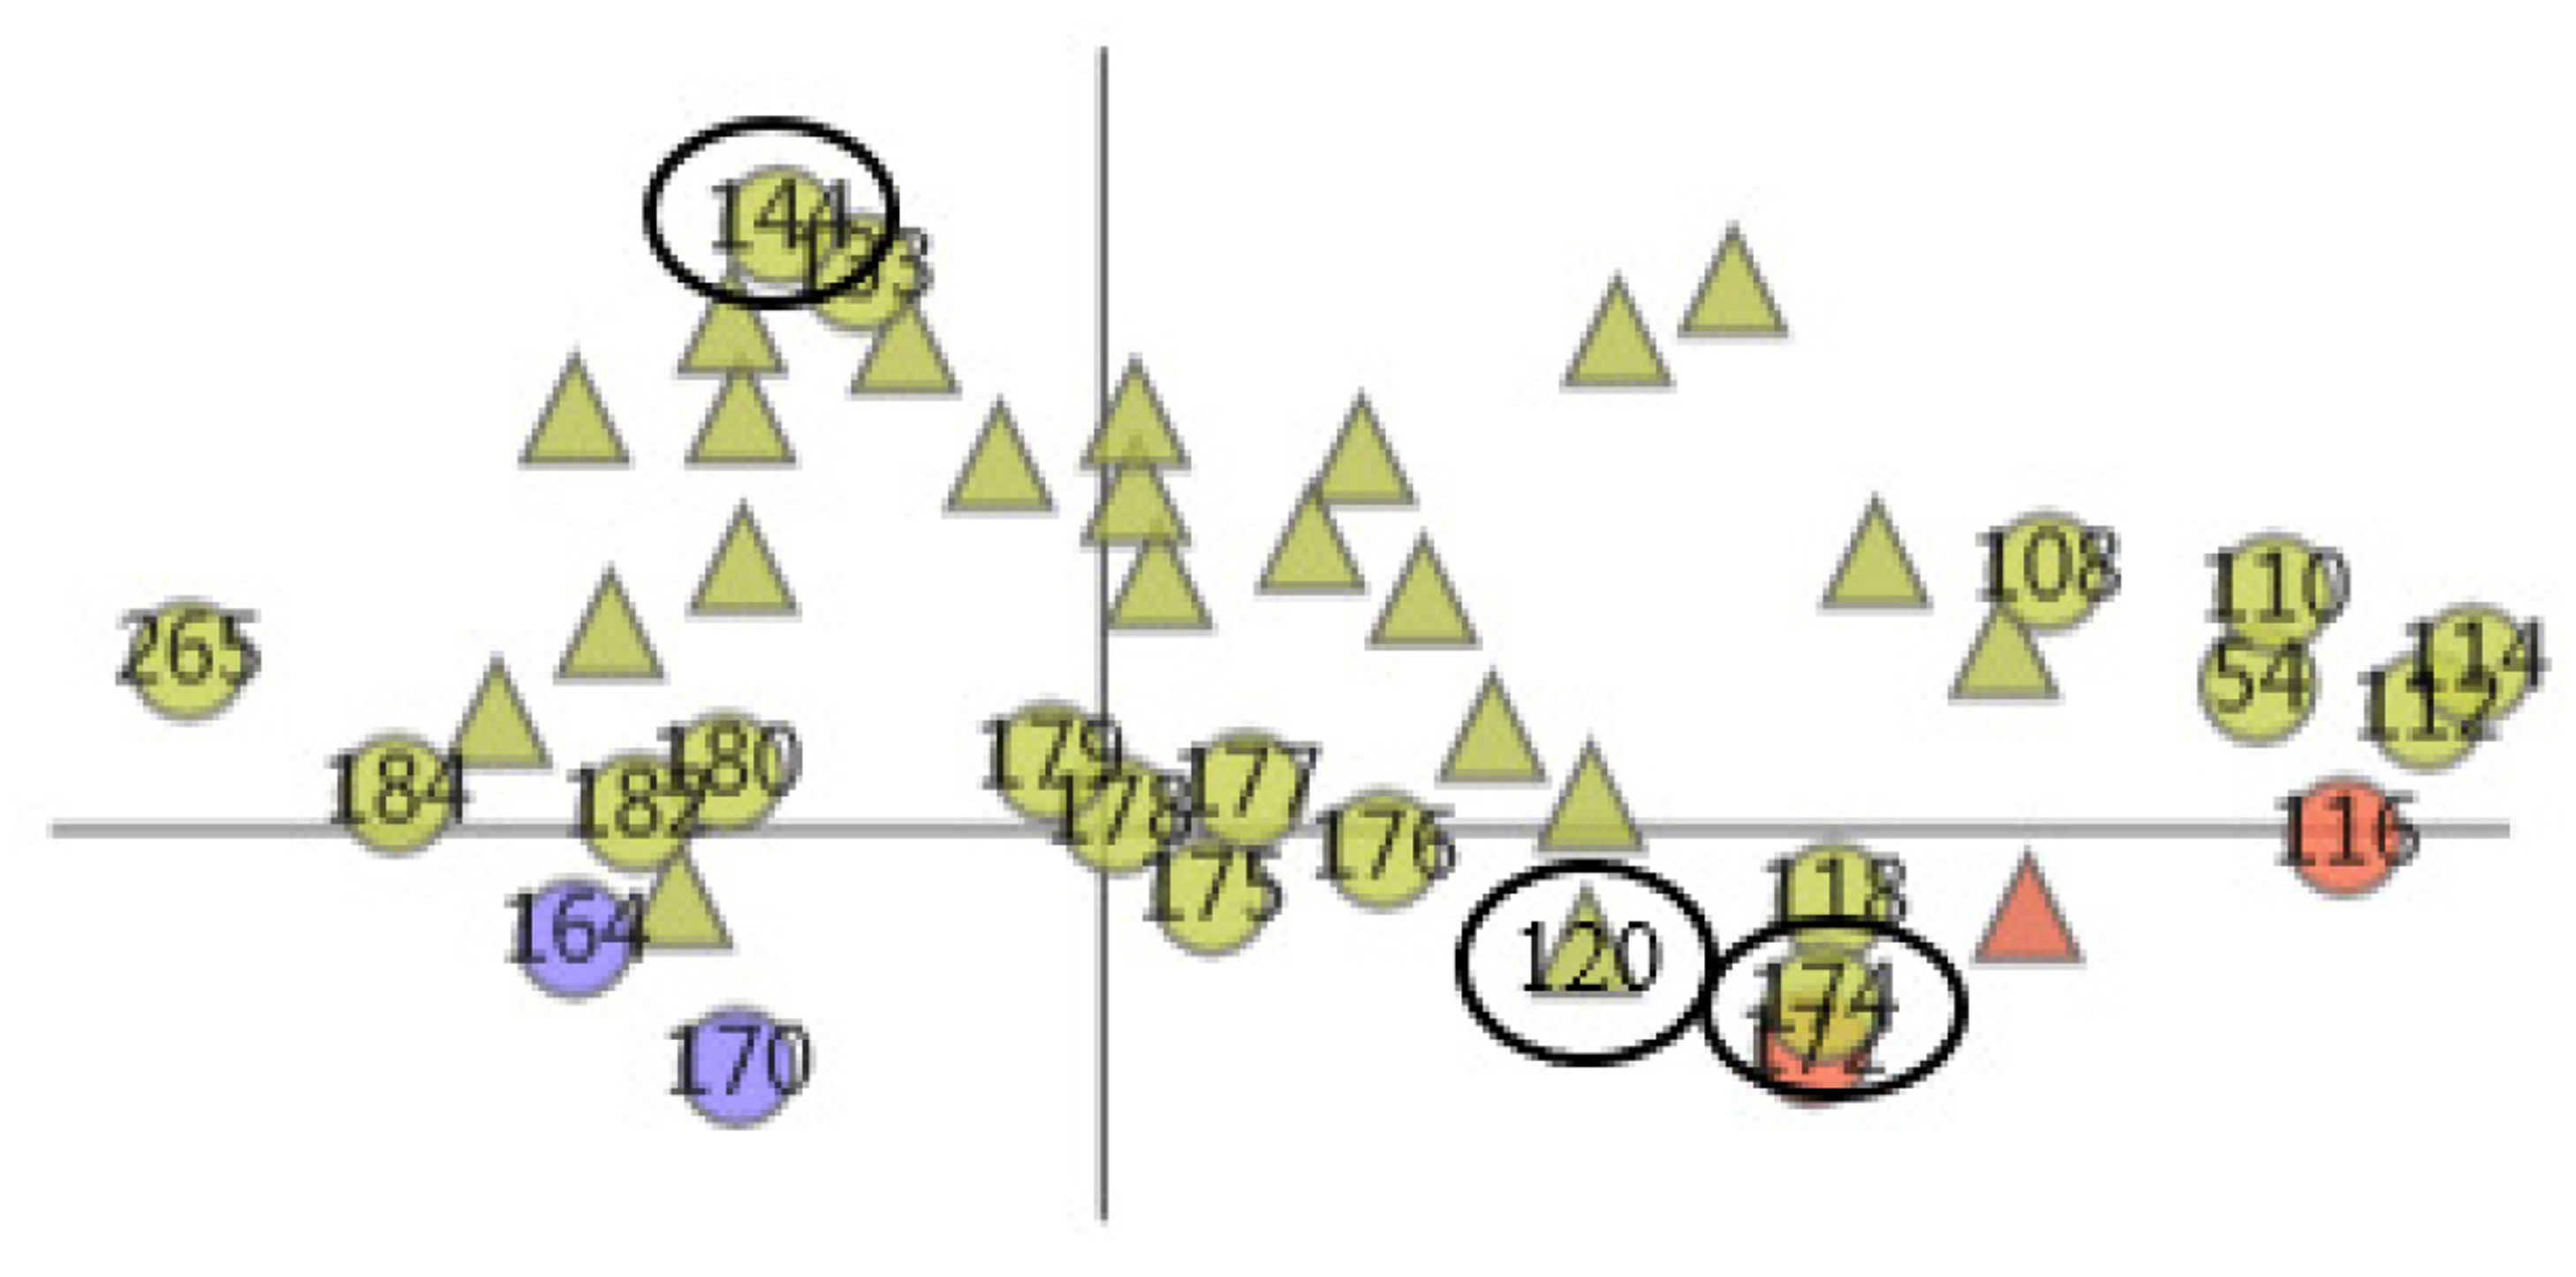
Then, we selected cluster 5. With the help of the AAFS Detailed Clustering View (see Figure 16), we observed there is not only is there similarity of motion between the cavity-lining amino acid atoms, but also between other amino acid atoms in this cluster. In the PCDIF View, we found that the key atoms that affect the cavity-lining amino acid atom 120 are 118, 174, 176, 172, and 175. Through the AAFS Detailed Clustering View of cluster 5, we found that 118, 174, 176, 172, and 175 all appeared around the cavity-lining amino acid atom 120, which also proved the correctness of finding the key atoms through the PC Detail View, the HeatMap, and the PCDIF View in our method, to a certain extent. Among the key atoms, 174 is the one closest to 120. We reasonably believe that amino acid atom 174 is the most close to the cavity-lining amino acid atom motion mode, and is the most critical atom. The active sites (144 and 174) have been confirmed in previous papers. This is consistent with our speculation that the key atom 174 affects the cavity wall by affecting the fluctuation of cavity-lining amino acid atom 120. At present, most allosteric sites are discovered by biologists by chance or are predicted by via machine learning methods. Through the visual exploration of our system, we found that the known allosteric sites were located in cluster 5. Therefore, we reasonably guess that other amino acids in the cluster are also likely to be allosteric sites. Unfortunately, more studies are needed to prove its effectiveness in the future.

Figure 16.
The AAFS Detailed Clustering View shows the distribution of selected amino acids, where the black oval marks the identified allosteric sites. Different colors represent different clusters. The triangles in the plot represent the mapping of cavity-lining amino acids, and the circles represent the mapping of other amino acids.
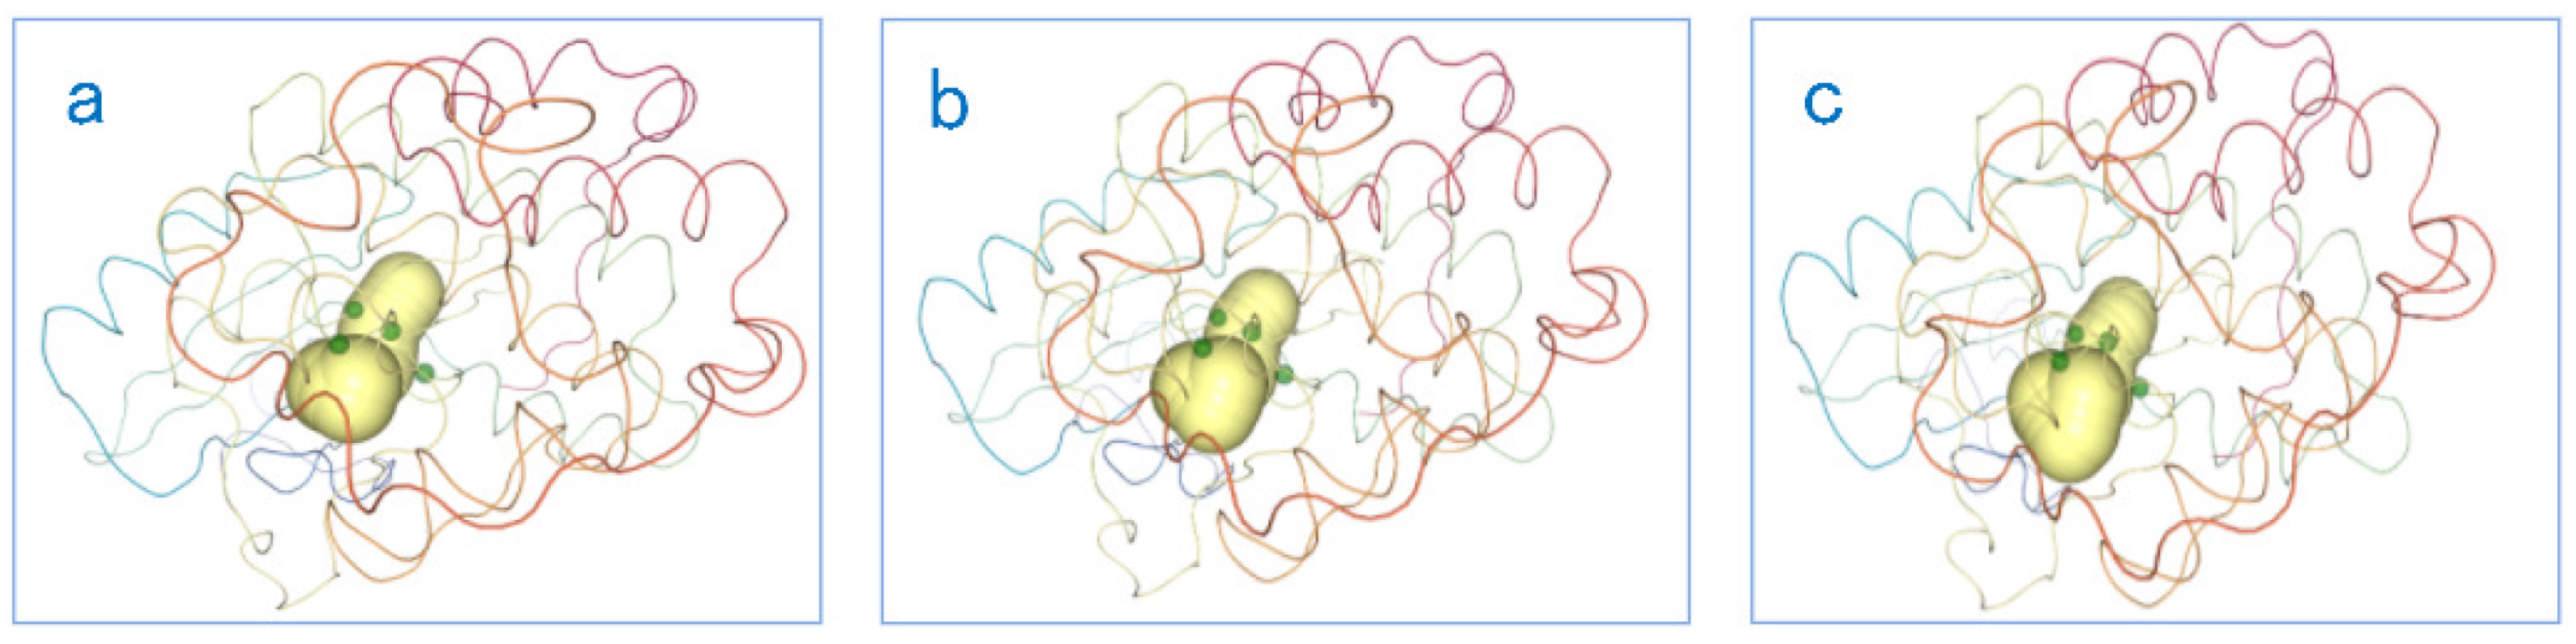
Finally, our system also provides a PCD 3D View (see Figure 17) display to better explore the impacts of key amino acids on the cavity-lining amino acids, which in turn affect the cavity. The PCD 3D View supports dynamic displays. From the PCD 3D View, we can clearly see how the key amino acids move together with the amino acids around the active sites, thereby affecting the cavity around the active sites. This allows experts in the field to see the direct and indirect factors that cause the dynamic changes of the cavity more clearly. As shown in the Figure 17, we selected several keyframes for static analysis. It can be seen in the figure that under the joint movement of key amino acids and active site amino acids, occurs dynamic changes in the cavity active site area.
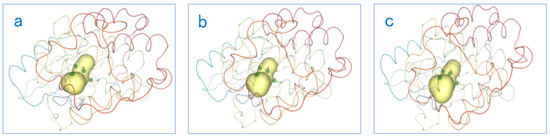
Figure 17.
The PCD 3D View shows several keyframes: the dynamic changes of cavities and amino acids over time. The yellow area in the figure represents the cavity, and the small green dots represent the amino acids. From figure (a–c), we can find that the shape of the cavity has changed, and the positions of these amino acids has also changed.
By interactively exploring 2D and 3D Views, our approach helps users to identify direct and indirect factors that influence the dynamical properties of the cavity and that help them to identify the allosteric sites or mutation sites.
7.2. Feedback
After the protein experts completed the case study, we arranged an informal interview with them again to evaluate the design of our visualization system in detail. In general, they all agreed that our solution helps them analyze whether the direct factor (cavity-lining amino acid atom) or the indirect factor (key atom) affecting the cavity change in an interactive way, and that it is faster than ever before.
The team of collaborators found that through the PC Detail View, they could easily find the cavity-lining amino acid atoms that they were more interested in and thought to be more valuable for research. They confirmed that this enabled them to quickly examine the data and present the cavity-lining amino acid atoms that caused cavity changes in a clear and easy to understand manner. The AAF HeatMap View helped them to observe the fluctuations of cavity-lining amino acids atom under different modes, and analyze whether the atom is a direct factor affecting the change of cavity. In addition, the AAF HeatMap View can help them observe the fluctuations of other atoms, and analyze whether there are key atoms that affect the fluctuations of cavity-lining amino acid atoms, and that affect the cavity changes as an indirect factor. Team members of the collaborators also highly appreciated the AAFS Clustering View and AAFS Detailed Clustering View. They said that this helped them compare the similarities and relationships between the movements of cavity-lining amino acid atoms and key atoms under various modes. They also often make choices when studying data details. With regard to this task, they pointed out that it would be beneficial if they were able to browse the history of all selections and visual changes. In addition, collaborator team members often used interactive links between the PC Detail View, the AAF HeatMap View, and the PCDIF View. It enabled them to quickly check the movements of cavity-lining amino acid atoms and their key atoms, and analyze whether the changes in cavity shape are directly or indirectly affected by amino acids. Our system has enabled cooperating experts in the field of proteins to interactively explore the relationship between cavity stability and cavity-lining amino acid atoms and their key atoms, which is also helpful for them to identify allosteric residues. Finally, experts in the field of proteins are interested in exploring other properties of key amino acids besides sports properties. This reveals a limitation of our current solution.
8. Discussion and Conclusions
In this paper, a new interactive visualization method to understand the dynamics of cavities has been presented. The method uses visualization techniques to process high-dimensional normal mode data, and allows the user to explore the cavity, as well as aid the user in the discovery of aliasing sites. The method has three advantages over previous approaches:
- (1)
- Our work realizes a set of linked 2D and 3D Views, which can be explored interactively to quickly locate the direct factors (cavity-lining amino acid atoms) and indirect factors (key atoms) that affect the dynamic characteristics of the cavity.
- (2)
- Using normal mode data to establish the relationship between cavity-lining amino acid atom movement, key amino acid atom movement, and cavity shape changes, so as to help users find potential allosteric sites.
- (3)
- The system utilizes multiple views from multiple perspectives for the user to explore the stability of the cavity, including cavity characteristics and the properties of the amino acids surrounding the cavity.
To explore and to validate the effectiveness of our method, a predicted allosteric site has been supported by previous reports or internal experimental studies, such as CDK2 (PDB code: 2C6K [41]). The results show that by interactively exploring the system, we find that the known allosteric sites are in the same cluster as the majority of the cavity-lining amino acids; thus, we reasonably believe that other amino acids (excluding cavity-lining amino acids) in this cluster are also potentially allosteric sites (T1–T6).
Our method is designed to help users to explore the dynamics of cavities, and to help them identify key amino acids. However, when we consider the effects of distant amino acids on the cavity, our method only considers the motion properties of the amino acids, and ignores other properties of the amino acids, such as whether it has allosteric properties, the cavity in which the amino acid is located, etc. In the future, we plan to combine other properties of amino acids with normal mode data, in order to discover aliasing pockets by combining visualization methods, which is an interesting direction for future work.
Author Contributions
Conceptualization, D.G. and L.F.; methodology, D.G. and L.F.; software, Y.G. and T.Z.; validation, Y.W. and T.Z.; formal analysis, D.G.; investigation, L.F.; resources, L.F.; data curation, Y.G. and L.F.; writing—original draft preparation, L.F.; writing—review and editing, Y.W. and L.F.; visualization, L.F. and T.Z.; supervision, X.X.; funding acquisition, D.G. All authors have read and agreed to the published version of the manuscript.
Funding
This work was supported in part by grants from the National Key R&D Program of China and the National Science Foundation of China (Grant no. 61802334, no. 61902340), Natural Science Foundation of Hebei Province (F2022203015), and Innovation Capability Improvement Plan Project of Hebei Province (22567637H).
Data Availability Statement
Not applicable.
Acknowledgments
The authors wish to thank Ximing Xu in Chinese Marine University for his advice on domain knowledge. We are very grateful for the experimental data provided by Caver Analyst 2.0 [42] and WEBnm@ [35].
Conflicts of Interest
The authors declare no conflict of interest. The funders had no role in the design of the study; in the collection, analyses, or interpretation of data; in the writing of the manuscript, or in the decision to publish the results.
References
- Koudelakova, T.; Chaloupkova, R.; Brezovsky, J.; Prokop, Z.; Sebestova, E.; Hesseler, M.; Khabiri, M.; Plevaka, M.; Kulik, D.; Smatanova, I.K.; et al. Engineering enzyme stability and resistance to an organic cosolvent by modification of residues in the access tunnel. Angew. Chem. 2013, 125, 2013–2017. [Google Scholar] [CrossRef]
- Pavlova, M.; Klvana, M.; Prokop, Z.; Chaloupkova, R.; Banas, P.; Otyepka, M.; Wade, R.C.; Tsuda, M.; Nagata, Y.; Damborsky, J. Redesigning dehalogenase access tunnels as a strategy for degrading an anthropogenic substrate. Nat. Chem. Biol. 2009, 5, 727–733. [Google Scholar] [CrossRef]
- Klvana, M.; Pavlova, M.; Koudelakova, T.; Chaloupkova, R.; Dvorak, P.; Prokop, Z.; Stsiapanava, A.; Kuty, M.; Kuta-Smatanova, I.; Dohnalek, J.; et al. Pathways and mechanisms for product release in the engineered haloalkane dehalogenases explored using classical and random acceleration molecular dynamics simulations. J. Mol. Biol. 2009, 392, 1339–1356. [Google Scholar] [CrossRef]
- Hensen, U.; Meyer, T.; Haas, J.; Rex, R.; Vriend, G.; Grubmüller, H. Exploring protein dynamics space: The dynasome as the missing link between protein structure and function. PLoS ONE 2012, 7, e33931. [Google Scholar] [CrossRef] [Green Version]
- Sykora, J.; Brezovsky, J.; Koudelakova, T.; Lahoda, M.; Fortova, A.; Chernovets, T.; Chaloupkova, R.; Stepankova, V.; Prokop, Z.; Smatanova, I.K.; et al. Dynamics and hydration explain failed functional transformation in dehalogenase design. Nat. Chem. Biol. 2014, 10, 428–430. [Google Scholar] [CrossRef]
- Shaw, D.E.; Maragakis, P.; Lindorff-Larsen, K.; Piana, S.; Dror, R.O.; Eastwood, M.P.; Bank, J.A.; Jumper, J.M.; Salmon, J.K.; Shan, Y.; et al. Atomic-level characterization of the structural dynamics of proteins. Science 2010, 330, 341–346. [Google Scholar] [CrossRef] [Green Version]
- Chovancova, E.; Pavelka, A.; Benes, P.; Strnad, O.; Brezovsky, J.; Kozlikova, B.; Gora, A.; Sustr, V.; Klvana, M.; Medek, P.; et al. Caver 3.0: A tool for the analysis of transport pathways in dynamic protein structures. PLoS Comput. Biol. 2012, 8, e1002708. [Google Scholar] [CrossRef] [Green Version]
- Byška, J.; Muzic, M.L.; Groller, M.E.; Viola, I.; Kozlikova, B. Animoaminominer: Exploration of protein tunnels and their properties in molecular dynamics. IEEE Trans. Vis. Comput. Graph. 2015, 22, 747–756. [Google Scholar] [CrossRef] [PubMed]
- Zhao, Y.; Shi, J.; Liu, J.; Zhao, J.; Zhou, F.; Zhang, W.; Chen, K.; Zhao, X.; Zhu, C.; Chen, W. Evaluating effects of background stories on graph perception. IEEE Trans. Vis. Comput. Graph. 2021. [Google Scholar] [CrossRef]
- Bedoucha, P.; Reuter, N.; Hauser, H.; Byška, J. Visual exploration of large normal mode spaces to study protein flexibility. Comput. Graph. 2020, 90, 73–83. [Google Scholar] [CrossRef]
- Doruker, P.; Atilgan, A.R.; Bahar, I. Dynamics of proteins predicted by molecular dynamics simulations and analytical approaches: Application to α-amylase inhibitor. Proteins Struct. Funct. Bioinform. 2000, 40, 512–524. [Google Scholar] [CrossRef]
- López-Blanco, J.R.; Aliaga, J.I.; Quintana-Ortí, E.S.; Chacón, P. imods: Internal coordinates normal mode analysis server. Nucleic Acids Res. 2014, 42, 271–276. [Google Scholar] [CrossRef] [PubMed]
- Tama, F.; Sanejouand, Y.H. Conformational change of proteins arising from normal mode calculations. Protein Eng. 2001, 14, 1–6. [Google Scholar] [CrossRef] [PubMed]
- Song, K.; Liu, X.; Huang, W.; Lu, S.; Shen, Q.; Zhang, L.; Zhang, J. Improved method for the identification and validation of allosteric sites. J. Chem. Inf. Model. 2017, 57, 2358–2363. [Google Scholar] [CrossRef]
- Levitt, D.G.; Banaszak, L.J. Pocket: A computer graphies method for identifying and displaying protein cavities and their surrounding amino acids. J. Mol. Graph. 1992, 10, 229–234. [Google Scholar] [CrossRef]
- Feng, L.; Wang, F.; Zhang, J.; Tang, Y.; Zhao, J.; Zhou, L.; Wang, J.; Guo, D.; Singh, A.K. Particle-based calculation and visualization of protein cavities using SES models. IEEE J. Biomed. Health Inform. 2021, 26, 2447–2457. [Google Scholar] [CrossRef]
- Hendlich, M.; Rippmann, F.; Barnickel, G. Ligsite: Automatic and efficient detection of potential small molecule-binding sites in proteins. J. Mol. Graph. Model. 1997, 15, 359–363. [Google Scholar] [CrossRef]
- Chen, Z.; Zhang, X.; Peng, C.; Wang, J.; Xu, Z.; Chen, K.; Shi, J.; Zhu, W. D3pockets: A method and web server for systematic analysis of protein pocket dynamics. J. Chem. Inf. Model. 2019, 59, 3353–3358. [Google Scholar] [CrossRef]
- Schmidtke, P.; Guilloux, V.L.; Maupetit, J.; Tufféry, P. Fpocket: Online tools for protein ensemble pocket detection and tracking. Nucleic Acids Res. 2010, 38 (Suppl. S2), W582–W589. [Google Scholar] [CrossRef] [Green Version]
- Zhu, H.; Pisabarro, M.T. Mspocket: An orientation-independent algorithm for the detection of ligand binding pockets. Bioinformatics 2011, 27, 351–358. [Google Scholar] [CrossRef] [Green Version]
- Brady, G.P.; Stouten, P.F. Fast prediction and visualization of protein binding pockets with pass. J. Comput.-Aided Mol. Des. 2000, 14, 383–401. [Google Scholar] [CrossRef] [PubMed]
- Yu, J.; Zhou, Y.; Tanaka, I.; Yao, M. Roll: A new algorithm for the detection of protein pockets and cavities with a rolling probe sphere. Bioinformatics 2010, 26, 46–52. [Google Scholar] [CrossRef] [PubMed] [Green Version]
- Oliveira, S.H.; Ferraz, F.A.; Honorato, R.V.; Xavier-Neto, J.; Sobreira, T.J.; de Oliveira, P.S. Kvfinder: Steered identification of protein cavities as a pymol plugin. BMC Bioinform. 2014, 15, 197. [Google Scholar] [CrossRef] [PubMed] [Green Version]
- Simões, T.M.; Gomes, A.J. Cavvis—A field-of-view geometric algorithm for protein cavity detection. J. Chem. Inf. Model. 2019, 59, 786–796. [Google Scholar] [CrossRef]
- Humphrey, W.; Dalke, A.; Schulten, K. Vmd: Visual molecular dynamics. J. Mol. Graph. 1996, 14, 33–38. [Google Scholar] [CrossRef]
- DeLano, W.L. Pymol: An open-source molecular graphics tool. CCP4 Newsl. Protein Crystallogr. 2002, 40, 82–92. [Google Scholar]
- Sehnal, D.; Deshpande, M.; Vařeková, R.S.; Mir, S.; Berka, K.; Midlik, A.; Pravda, L.; Velankar, S.; Koča, J. Litemol suite: Interactive web-based visualization of large-scale macromolecular structure data. Nat. Methods 2017, 14, 1121–1122. [Google Scholar] [CrossRef]
- Byška, J.; Trautner, T.; Marques, S.M.; Damborský, J.; Kozlíková, B.; Waldner, M. Analysis of long molecular dynamics simulations using interactive focus+context visualization. Comput. Graph. Forum J. Eur. Assoc. Comput. Graph. 2019, 38, 441–453. [Google Scholar] [CrossRef]
- Patro, R.; Ip, C.Y.; Bista, S.; Thirumalai, D.; Cho, S.S.; Varshney, A. Mdmap: A system for data-driven layout and exploration of molecular dynamics simulations. In Proceedings of the 2011 IEEE Symposium on Biological Data Visualization (BioVis), Providence, RI, USA, 23–24 October 2011; pp. 111–118. [Google Scholar] [CrossRef] [Green Version]
- Lindow, N.; Baum, D.; Bondar, A.N.; Hege, H.C. Exploring cavity dynamics in biomolecular systems. BMC Bioinform. 2013, 14 (Suppl. 19), S5. [Google Scholar] [CrossRef] [Green Version]
- Furmanová, K.; Jareová, M.; Byka, J.; Jurík, A.; Parulek, J.; Hauser, H.; Kozlíková, B. Interactive exploration of ligand transportation through protein tunnels. BMC Bioinform. 2017, 18 (Suppl. S2), 22. [Google Scholar] [CrossRef] [Green Version]
- Guo, D.; Han, D.; Xu, X.; Ye, K.; Nie, J. Spatiotemporal multiscale molecular cavity visualization and visual analysis. J. Vis. 2020, 23, 661–676. [Google Scholar] [CrossRef]
- Guo, D.; Wang, Q.; Liang, M.; Liu, W.; Nie, J. Molecular cavity topological representation for pattern analysis: A nlp analogy-based word2vec method. Int. J. Mol. Sci. 2019, 20, 6019. [Google Scholar] [CrossRef] [PubMed] [Green Version]
- Burch, M.; Ten Brinke, K.B.; Castella, A.; Peters, G.K.S.; Shteriyanov, V.; Vlasvinkel, R. Dynamic graph exploration by interactively linked node-link diagrams and matrix visualizations. Vis. Comput. Ind. Biomed. Art 2021, 4, 23. [Google Scholar] [CrossRef] [PubMed]
- Tiwari, S.P.; Fuglebakk, E.; Hollup, S.M.; Skjærven, L.; Cragnolini, T.; Grindhaug, S.H.; Tekle, K.M.; Reuter, N. Webnm@ v2.0: Web server and services for comparing protein flexibility. BMC Bioinform. 2014, 15, 427. [Google Scholar] [CrossRef] [PubMed] [Green Version]
- Hinsen, K.; Thomas, A.; Field, M. Analysis of domain motion in large proteins. Proteins Struct. Funct. Bioinform. 1999, 34, 369–382. [Google Scholar] [CrossRef]
- Lukman, S.; Grant, G. A network of dynamically conserved residues deciphers the motions of maltose transporter. Proteins 2009, 76, 588–597. [Google Scholar] [CrossRef]
- Wei, Y.; Mei, H.; Zhao, Y.; Zhou, S.; Lin, B.; Jiang, H.; Chen, W. Evaluating Perceptual Bias During Geometric Scaling of Scatterplots. IEEE Trans. Vis. Comput. Graph. 2020, 26, 100–111. [Google Scholar] [CrossRef] [Green Version]
- Zhao, Y.; Luo, F.; Chen, M.; Wang, Y.; Xia, J.; Zhou, F.; Wang, Y.; Chen, Y.; Chen, W. Evaluating Multi-Dimensional Visualizations for Understanding Fuzzy Clusters. IEEE Trans. Vis. Comput. Graph. 2019, 25, 12–21. [Google Scholar] [CrossRef]
- Watson, J.D.; Crick, H.C. The classic: Molecular structure of nucleic acids: A structure for deoxyribose nucleic acid. Clin. Orthop. Relat. Res. 2007, 462, 3–5. [Google Scholar] [CrossRef]
- Burley, S.K.; Berman, H.M.; Kleywegt, G.J.; Markley, J.L.; Nakamura, H.; Velankar, S. Protein data bank (PDB): The single global macromolecular structure archive. In Protein Crystallography; Humana Press: New York, NY, USA, 2017; pp. 627–641. [Google Scholar]
- Adam, J.; David, B.; Jan, B.; Marques, S.M.; Katarina, F.; Lukas, D.; Piia, K.; Jan, B.; Ondrej, S.; Jan, S. Caver analyst 2.0: Analysis and visualization of channels and tunnels in protein structures and molecular dynamics trajectories. Bioinformatics 2018, 20, 3586–3588. [Google Scholar]


Publisher’s Note: MDPI stays neutral with regard to jurisdictional claims in published maps and institutional affiliations. |
© 2022 by the authors. Licensee MDPI, Basel, Switzerland. This article is an open access article distributed under the terms and conditions of the Creative Commons Attribution (CC BY) license (https://creativecommons.org/licenses/by/4.0/).