Featured Application
This study developed a low-cost, compact, and interactive augmented reality (AR) experimental platform for the thermal management of power devices. It can be integrated into future education, supporting an efficient exploration of physical processes when off-campus learning is demanded, such as in the COVID-19 pandemic.
Abstract
Augmented reality (AR) applied in education provides learners a possible way for better understanding and thorough learning. Although the traditional projector is used to integrate the augmented information with real objects without wearing AR glasses, the projector-based AR system is unlikely to be adopted widely in education due to the cost, heavy weight, and space issues. In this paper, an alternative projector-camera AR platform, utilizing a digital light processing (DLP) module matched with a Beaglebone Black (BB) controller, is proposed for AR physical experiments. After describing the DLP-based AR learning design method, the algorithm of pre-deforming projection content with simulation-based poly fitting is presented to keep the virtual asset consistent with the user action; and then a prototype with the content regarding the thermal management of power devices is illustrated to validate the performance of the AR experimental platform. The result shows that the DLP-based AR platform is an accurate and interactive AR system with a response time of 1 s, and a registration deviation of 3 mm. It is also an affordable AR learning design tool with a bill of materials of about $200, and thus casts light on creating AR-based physical experiments to explore more physical phenomena.
1. Introduction
Augmented reality (AR), a modern information technology integrating virtual assets with real objects, is beneficial for education, such as helping students acquire knowledge and explore physical processes [1,2,3,4,5]. A review of AR in education over the last 25 years is given in [6], which indicates the future trend of the development of authoring tools. Currently, the adoption of AR technology in teaching has been greatly concerned with tackling the challenges of traditional physical education associated with lack of equipment, difficulty in comprehending concepts, and a tendency of diminishing interest in students [7,8]. Furthermore, as an emerging and potential education technology, there is a huge demand for AR-based learning resources [9] for wide applications in the sustainable development of education.
Numerous research works have been carried out to investigate the flow chart and the architecture of AR development, such as in microprocessor courses [10]. During the creation of AR-based physical experiments [11], the projector-camera system is one of the favorite configurations for creating interactive AR applications without wearing AR glasses [12,13,14,15,16]. Although the compact and lightweight challenges of AR headsets are tackled by innovative ways such as holographic optical elements and lithography-enabled devices [17], the effectiveness of projector-based AR learning activities has been validated by the satisfaction of users [18]. In fact, the projector-based AR system warps the virtual information onto real objects and brings about a keystone deformation rooted in the 3-dof (pan, tilt, screw) misalignment among projectors, cameras, and screens. Therefore, the homography-based calibration of the keystone effect [13] and the generation of projection content [14] have been frequently addressed when using the projector-based AR to achieve an effective teaching outcome. Furthermore, the projector-based AR learning resource depends upon a large space for high-cost, heavy components such as traditional projectors and desktop PCs to take charge of virtual content and user interactions [19], thus making it less popular for low-cost teaching support multimedia.
To provide an affordable AR physical experiment, simple geometric shapes have been frequently designed as AR projection content, since the approximation cuts down the calculation cost of real-time assets [20,21]. For example, indicative circles are utilized as projection content in the interactive AR exploration of thermal leak phenomena [14]. Obviously, the content-approximated AR system hardly supports the accurate understanding of intrinsic physical quantities such as thermal distribution in targeted phenomena, and the calculated image instead of the specific shape is required to render real physical experiments [22]. Recently, there has been another trend to simplify the hardware configuration of AR systems, such as using POLAR systems as portable PC peripherals [23], and, furthermore, numerical simulations are adopted as the augmented information, such as the AR-based magnetic field application with a tablet screen instead of the conventional projector [24]. Unfortunately, the screen-based AR learning design has some limitations in visualizing the top surface of real objects and keeping the thermal and magnetic reliability of the screen. Therefore, a low-cost AR learning design is still pending for education exploring physical phenomena.
In this paper, an accurate and interactive AR learning design for creating affordable projector-based AR physical experiments is proposed. In Section 2, an AR-learning design method is presented based on the low-cost hardware setup with a digital light processing (DLP) module. In Section 3, an off/online algorithm for generating assets is proposed by combing the finite element simulation and the poly fitting method to support the simplified hardware configuration. In Section 4, a prototype application for the thermal management of power devices is demonstrated, and, in Section 5, the teaching practice and its results are given, which highlight that the proposed provides a low-cost approach to apply AR in a teaching environment.
2. DLP-Based AR Experimental Platform
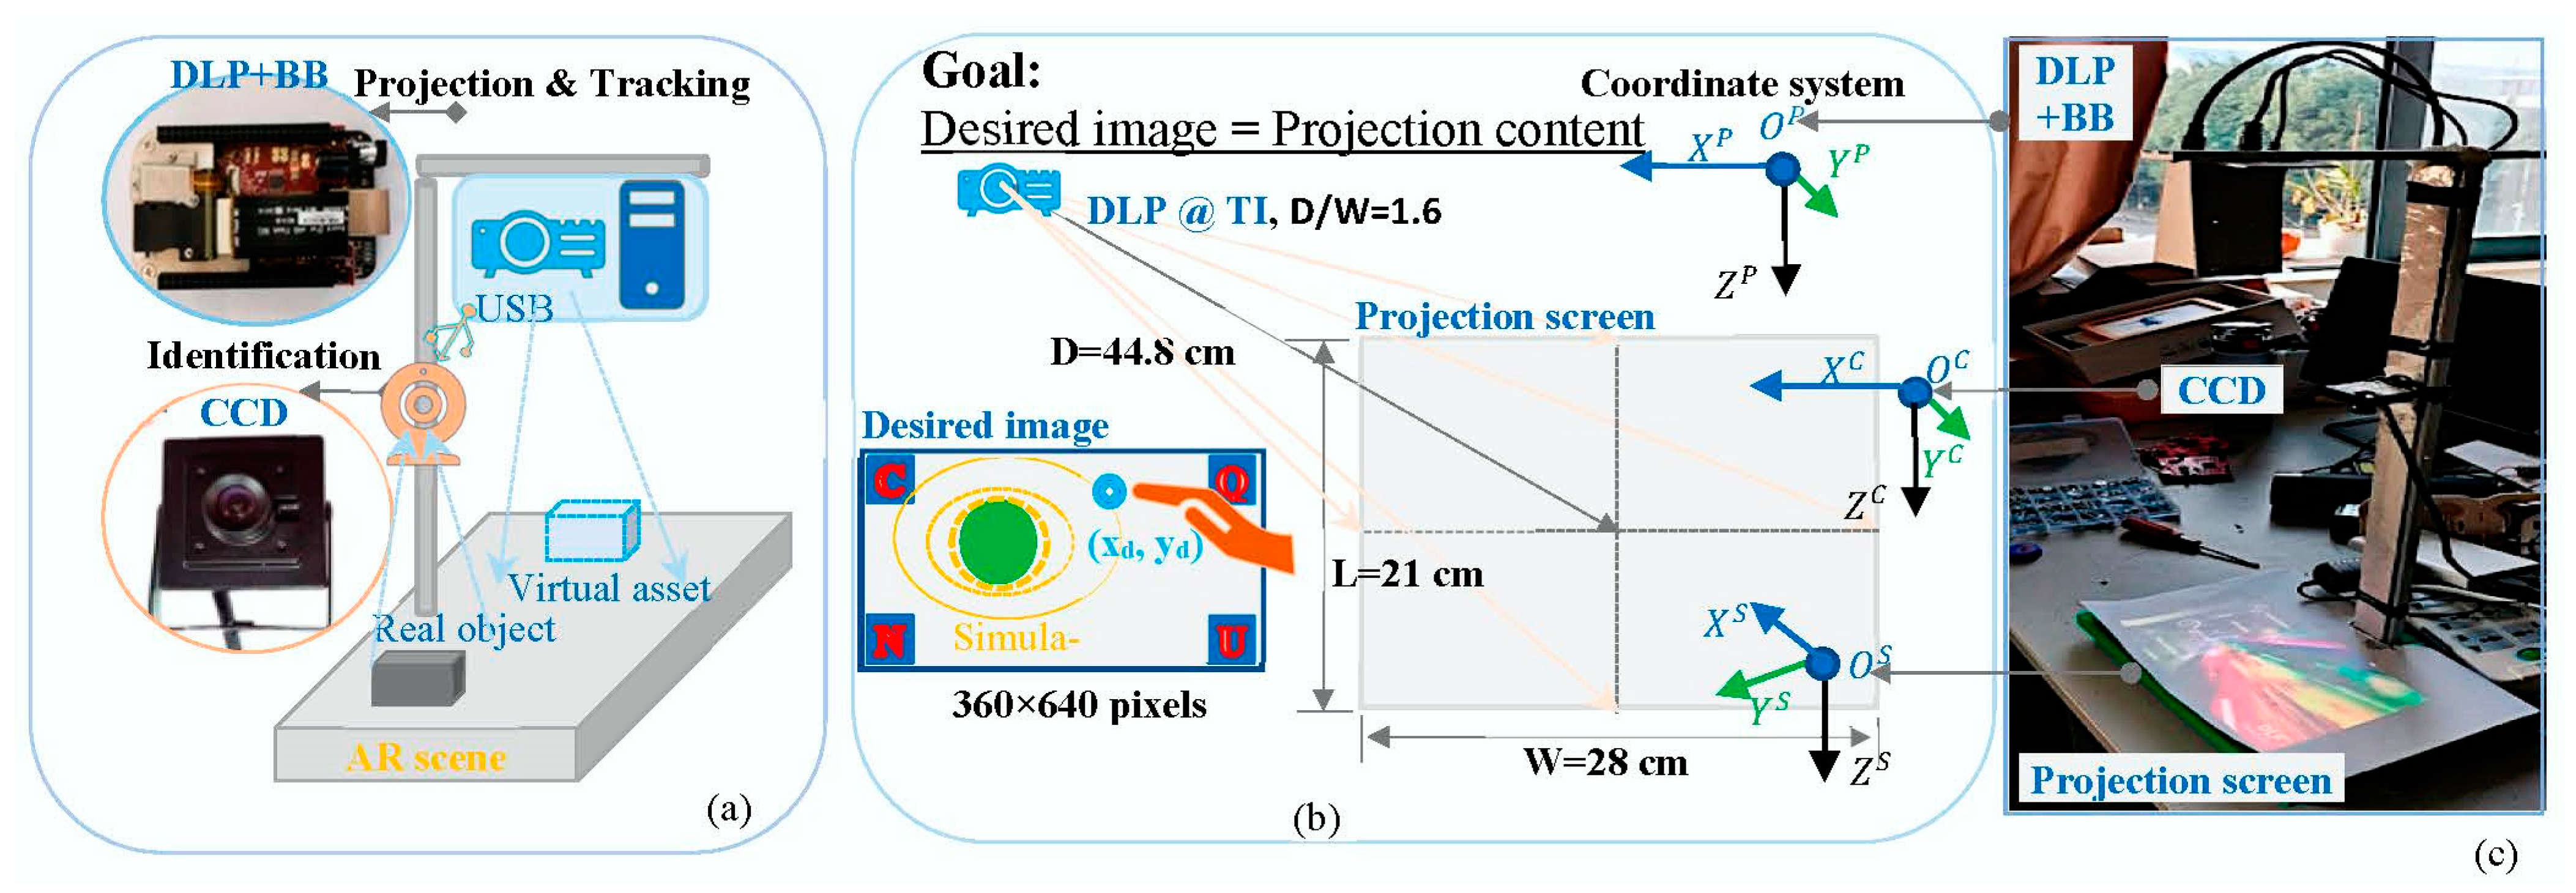
Instead of adopting traditional parts with huge volume, large mass, and high cost, the projector-based AR experimental platform is realized with low-cost modules, including a CCD camera for identifying real objects, a DLP module TI DLPDLCR 2000EVM for projecting virtual assets, and a BB controller with an AM3358 processor for tracking the AR scene, as shown in Figure 1a. The DLP communicates with the BB through a parallel port, and the CCD image data is input into the DLP + BB through a USB port. The DLP + BB module has an image resolution of 360 × 640 pixels and a distance-to-width ratio (D/W) of 1.6. The DLP is installed at the top center to superimpose the projected content over the bottom projection screen and has a vertical distance (D) of 44.8 cm (D = 1.6 × W, where W is the width of 28 cm A4 paper considering factors such as the projectable area, viewable direction, and movement of the object), as shown in Figure 1b. Similarly, the CCD with a field of view of 40° is placed at a perpendicular distance of 25 cm to the projectable area. This simplified hardware configuration has the predominant functions of identification, projection, and tracking.
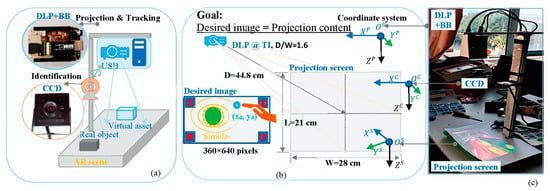
Figure 1.
The configuration of the proposed AR experimental platform consisting of a digital light processing (DLP), Beaglebone Black (BB), and CCD modules: (a) schematic diagram for illustrating identification, projection, and tracking; (b) geometric parameter of the setup, where the DLP with a distance/width (D/W) ratio of 1.6 is configured at the projection distance (D) of 44.8 cm; (c) an image of the prototype with three coordinate systems of projector, camera, and real world, {OP, OC, OS}.
Figure 1c illustrates a prototype of the proposed AR experimental platform, assembled by students utilizing available aluminum brackets. The DLP + BB, CCD, and projection screen are fixed tightly and the default content of DLP is displayed within the A4-size field of view, with an illumination of up to 510 lux to meet students’ perceptions. The prototype has a bill of materials of less than $200 and a power consumption of about 5 W.
3. Pre-Deformed Projection Content with Simulation-Based Fitting Method
Algorithms of identification, tracking, and projection are developed after modeling the DLP-based AR system. In addition to the typical extraction of coordinates and shapes, the pre-deformed projection content of DLP is given to compensate for the keystone distortion. Moreover, online assets from offline simulations are generated to respond to the user’s operation.
3.1. Homography-Based Model of DLP-Based AR System
As a projector-camera system with the elements of DLP, CCD, screen, and user, as shown in Figure 1, the image data is captured, projected, displayed, and perceived. To obtain the goal of letting the projection content equal the desired image in the warping AR system, the 3-dof (pan, tilt, screw) misalignment of modules has been addressed by pre-deforming the desired images. The perspective transform of images from the coordinate system to is modeled by [25],
where is a homogeneous coordinate of image point lying on the plane = 0 in ; and is the coordinate system of CCD, DLP, and screen, respectively; is the 3-order homography matrix from to .
When the real objects lie on the screen of size , , the captured CCD image of size , and is rewritten by Equation (1) using the homography matrix as,
Similarly, and denote the homography matrix of keystone correction and DLP projection in the AR system, respectively. Therefore, the goal of projecting the desired image onto the real image at right positions and scales is defined as the optimization of ,
where is the function for extracting the coordinate of the feature points. Additionally, is the finite element method (FEM)-based plots of physical parameters, such as temperature with the indicative texts and markers based on the geometry parameter from ,
Here, denotes the FEM model with output of plots under the boundary condition , such as coordinates and shapes of the experimental parts, and is estimated from by Equation (2).
According to Equations (1)–(4), the model of the proposed AR system is determined by homography matrix sets with the input of real image and output of the desired image related with the user-demanded model in the AR experiment. Furthermore, the pre-deformed image is projected onto the screen in real-time to obtain the superimposition of real objects with virtual assets when users operate the AR experimental platform.
3.2. Coordinate and Shape Detection for the CCD Image
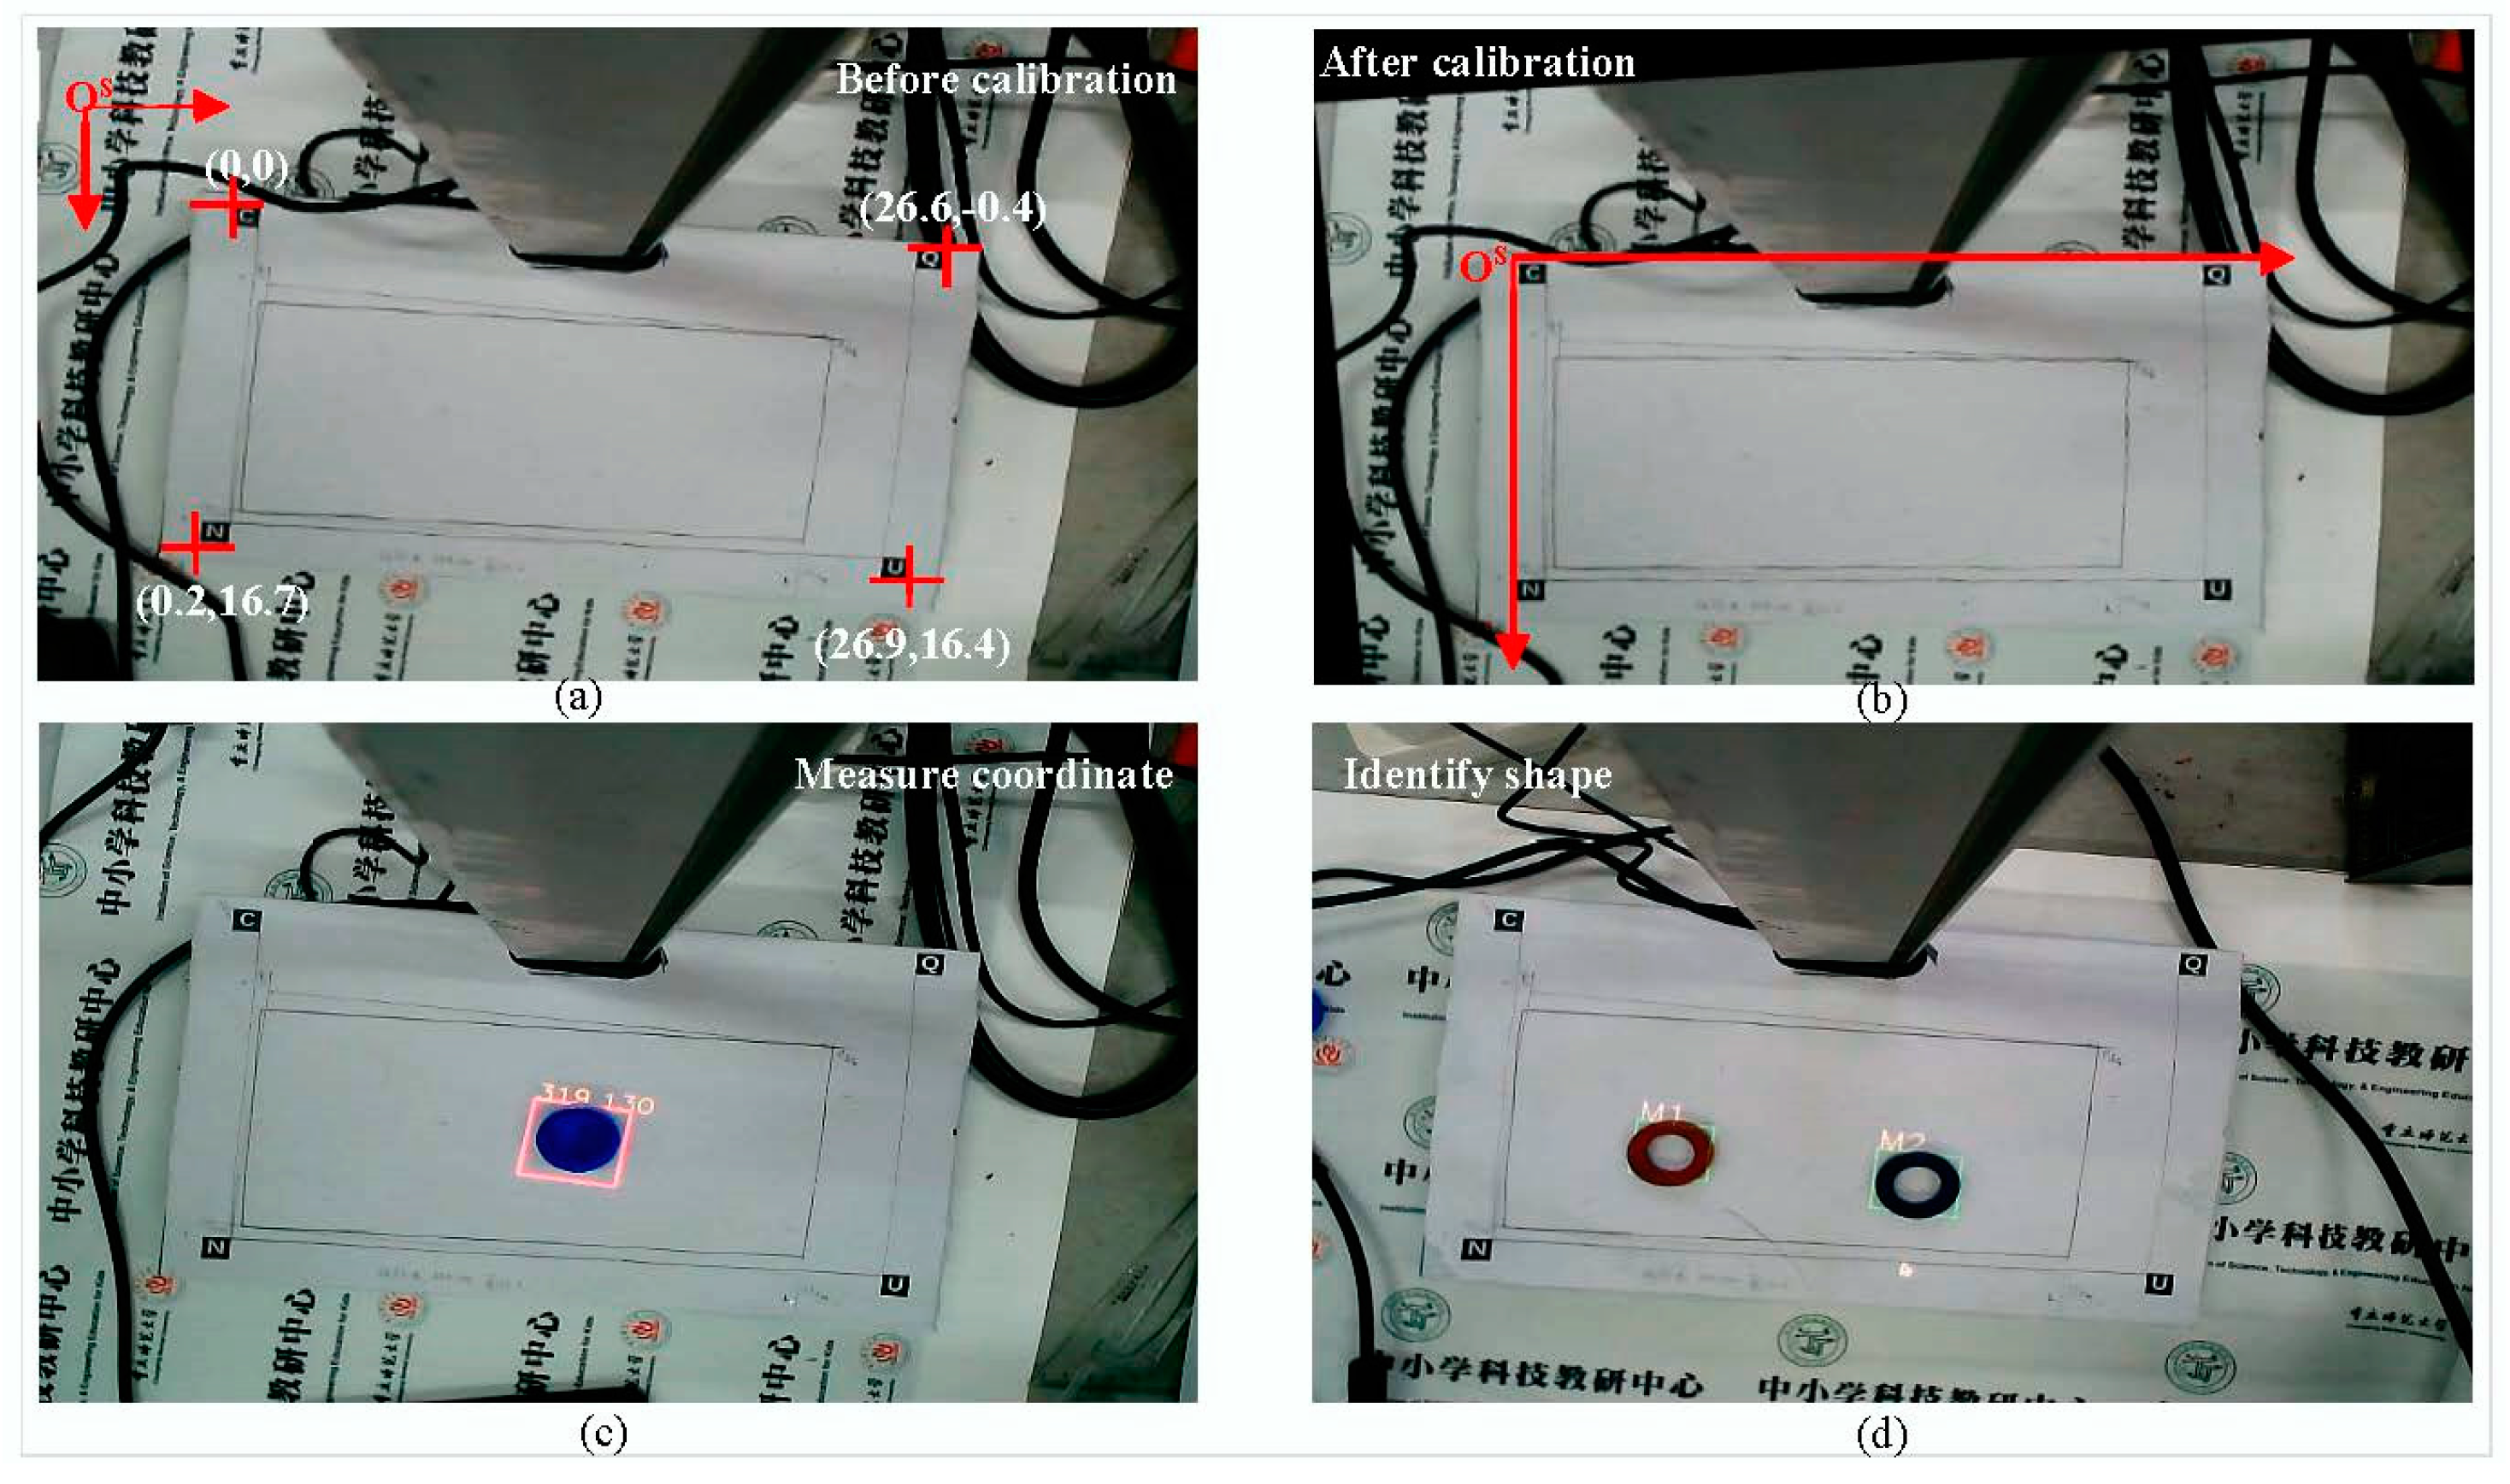
To obtain the coordinate and shape of real objects with the CCD, the first task is to determine in Equation (2). According to the 8-point algorithm [19], the corners of four letters, such as CQNU printed on A4 paper in Figure 2a, are defined as the four feature points, and have homogeneous coordinates in (unit: ) of
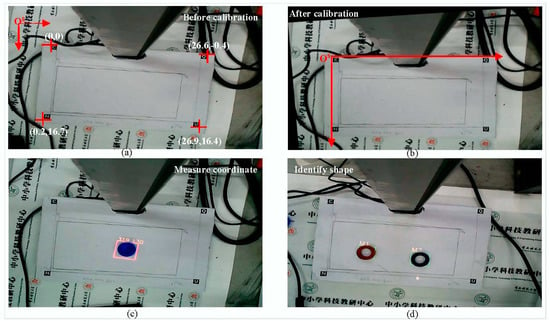
Figure 2.
Illustrations of CCD-based detection of coordinates and shapes of real objects on projection plane. (a) The captured CCD image before calibration, where four points are given for estimating the homography matrix; (b) the image after calibration; (c) the DLP display of the coordinate of a cover; and (d) identifying two magnets.
After getting their corresponding coordinates in , the inverse of or is
Obviously, the sheer element of in the AR system is 0.072 or rather than 0 due to the misalignment angle of the CCD. Furthermore, is used to calibrate the optical structure deformation, as shown in Figure 2a,b, where the deviation for horizontal axis in before and after calibration is illustrated. Therefore, the estimated homography based deformation correction allows students to configure the CCD easily without the requirement of high precision operation.
When the CCD and screen are assumed to be fixed tightly, is a time-invariant transformation and its estimated value keeps constant; thus, the real-world coordinates of objects on the projection screen can be measured in real-time by using Equation (2) without repeating the estimation of . In addition, the type of real object is identified from the CCD image by the classical neural network method, such as the function of CascadeClassifier in the OpenCV library. Figure 2c,d demonstrate the projection display of the measured coordinate and identified objects including a cover and two magnets (M1, M2), respectively, and the results suggest that the estimated coordinates have a relative error of less than 4% and the maxima difference of about 3 mm; moreover, the response time of coordinate and object detection running on the BB controller is less than 0.7 s when the image resolution is pixels. Therefore, the detection of shape and position for real objects provides an accurate and fast input to the DLP-based AR system.
3.3. Pre-Deformed Projection Content of DLP
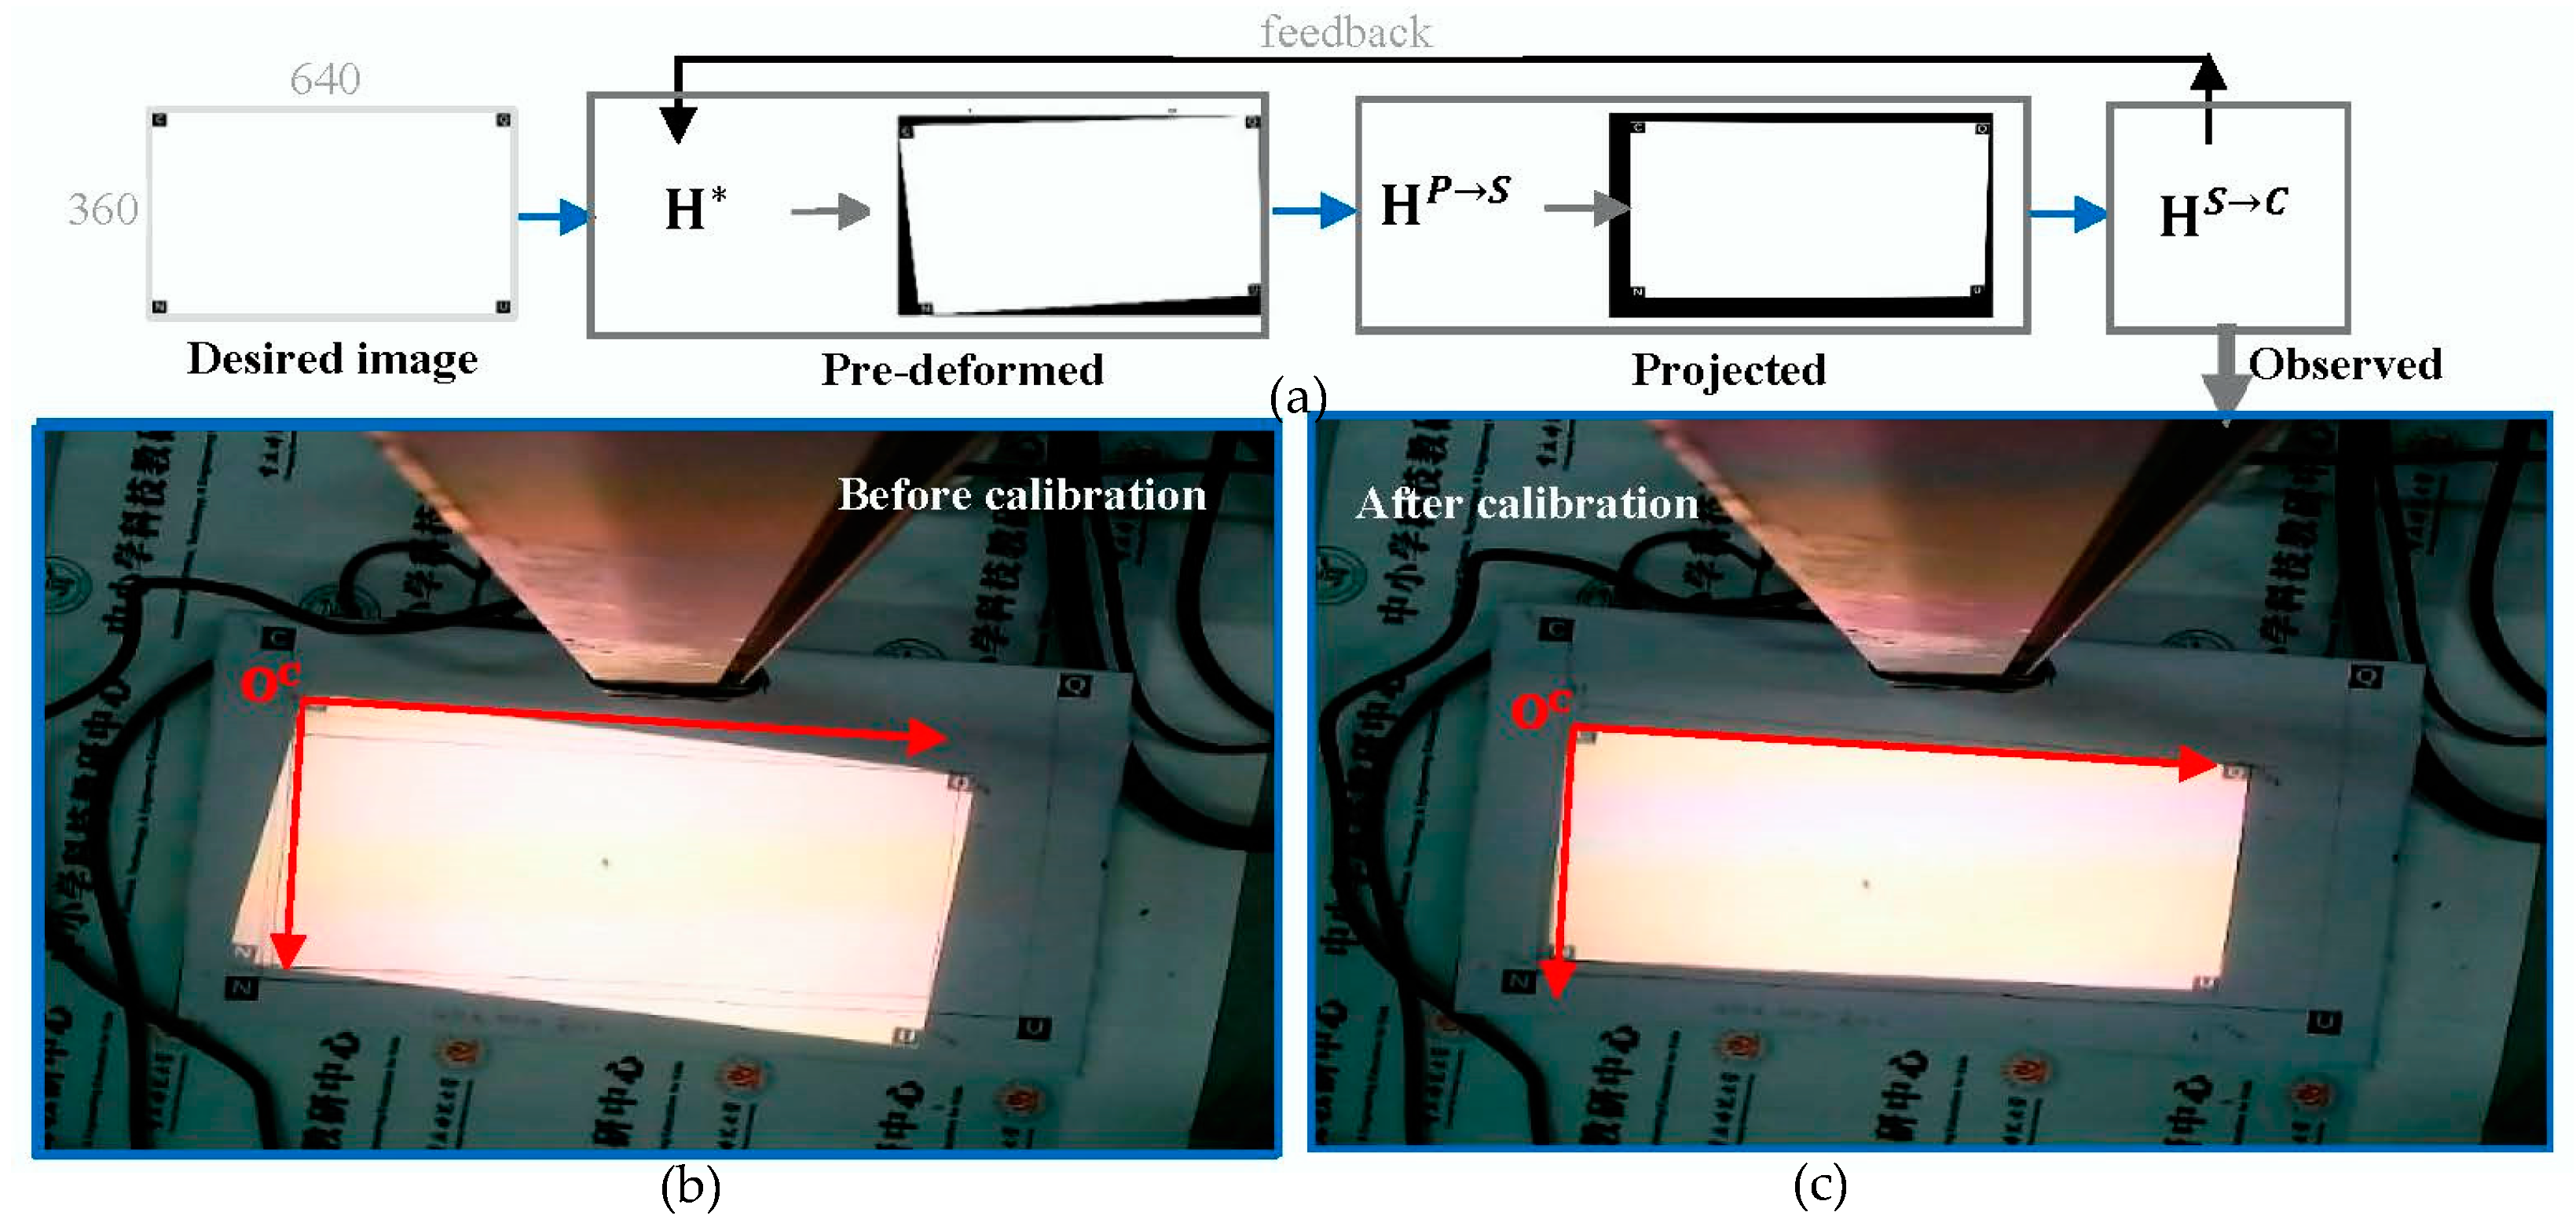
Although there is a less obviously geometric and optical distortion of directly projected simple information such as texts or rectangles in Figure 2c,d, the keystone distortion introduced by DLP is typically perceived when general content such as the image in Figure 3b is presented. If feature points of the CCD image and the real-world objects are matched (or ), the calibration of DLP projection content modeled as in Equation (3) is rewritten as:
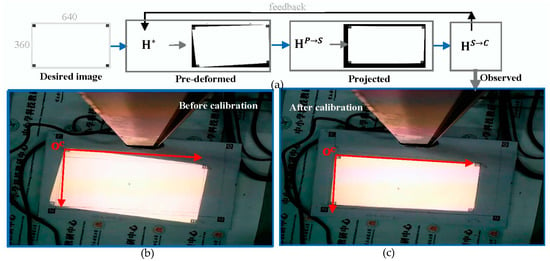
Figure 3.
Demonstration of calibrating DLP optical distortion by pre-deforming the desired image, which has a size of pixels and four letters of “C-Q-N-U” at corners. (a) Transform of the desired image through the pre-deformed, projected, and observed blocks; (b) the CCD-observed images of DLP projection in the coordinate system before calibration, and after calibration (c).
When is measured at a given , is the inverse of in Equation (7) or . Figure 3a shows the block diagram of perspective transform to obtain the goal of AR projection function by pre-deforming the desired image.
Like the estimation procedure of in the Section 3.2, mapping the point of DLP projection image in to the corresponding point of screen image in is,
Based on the pre-deformed image algorithm, the CCD-captured image of projecting content in after calibration is compared with that before calibration in Figure 3. The result shows that the DLP projection of the pre-deformed image has a smaller relative error of less than 4%, and thus the simple method for calibrating the keystone distortion by applying the pre-deformed image is verified.
3.4. Online Fitting Asset from Offline FEM-Based Simulation
Benefiting from the multi-physics field simulation by COMSOL code, in Equation (4) is built by importing a library application with the required physics field modules and modifying the geometric and material parameters of components, as well as the boundary conditions. For the boundary condition feedback by features of CCD-based image , the visualized output of physical parameter is calculated by,
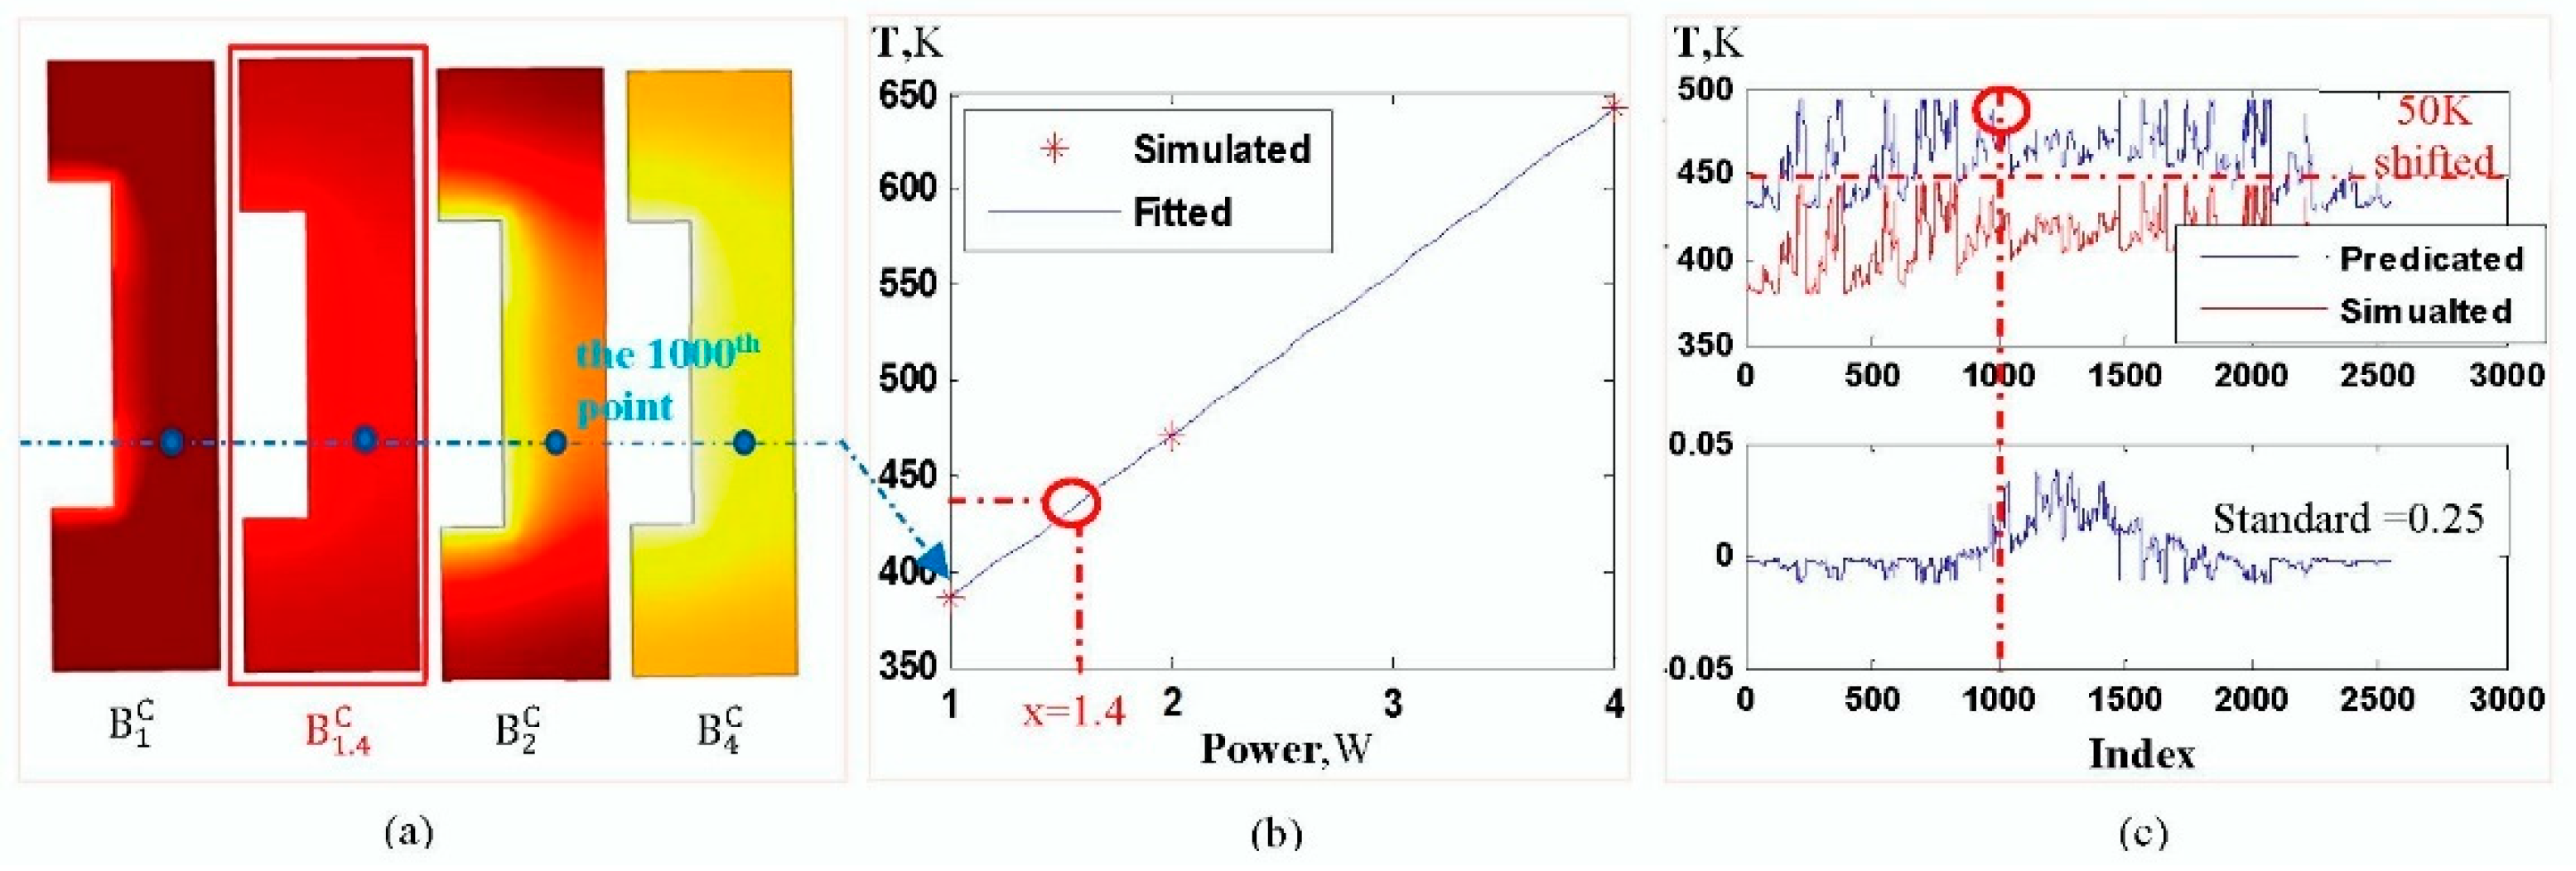
Taking the thermal stress of resistance as an example, plots of temperature distribution, as shown in Figure 4, are generated by running the COMSOL application, thermoelectric_cooler.mph [26], under the boundary condition of electrical power of 1 W, 1.4 W, 2 W, and 4 W, denoted as , and , respectively. Although the desired image is accurately calculated, the calculation time operating on a powerful computer for each condition is longer than 10 s, and the calculation time will last longer when run on the BB controller.
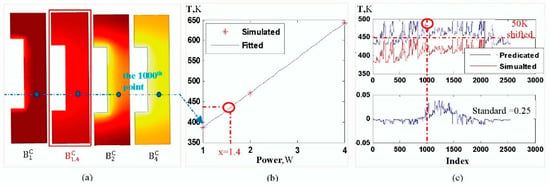
Figure 4.
Illustration of the online fitting asset from offline simulations using the thermal stress experiment in COMSOL library applications. (a) The simulated image of temperature distribution under four boundary conditions denoted as , and , with indicative points (the 1000th point); (b) the 2nd-order poly-function fitting the “simulated” data for the 1000th point to predicate its corresponding temperature under the boundary condition, ; (c) the comparison of the deviation and standard between the predicated and the simulated, where the deviation of temperature is less than 0.05 K and the standard is 0.25.
To update the desired image as fast as possible while maintaining accuracy, the time-consuming simulations are pre-calculated under assumed boundary conditions, and then these simulation plots are stored so that the real-time projection content looks up the offline simulation-based images. For an arbitrary boundary condition set by students for the interaction in the experiment, however, the look-up table method might fail to match the specific boundary condition even if an abundance of images is provided in the table without considering the limited storage. Therefore, a fitting method is used to generate the desired image under an arbitrary boundary condition without storing it in the look-up table ,
where is a poly-function of such as 2nd order . For the 2nd-order poly-function, the model parameters at each point in the images are estimated by its corresponding points in the table . For instance, if the desired image at is assumed to be unknown, the simulated images at , and , as shown in Figure 4a, are first computed and stored in the look-up table . Then each point, such as the 1000th point in , are denoted as “Simulated” points, fitting as , and indicated as “Fitted” in Figure 4b. Next, let in the fitting poly model to predicate the unknown point. Finally, all points are generated by repeating the above-mentioned steps and scattered interpolation for the desired image.
Following the procedure of online fitting based on pre-simulated images, the predicated image is compared with the offline simulated at , as shown in Figure 4c, which has a temperature deviation of less than 0.05 K and the standard of 0.25. Furthermore, the calculation time to obtain the desired image operating on the BB controller is about 0.1 s while that of FEM simulation running on a computer is up to 10 s. Therefore, the proposed algorithm combining the offline simulation and the online fitting enables educators to create the augmented information fast and accurately.
4. AR Learning Design Method
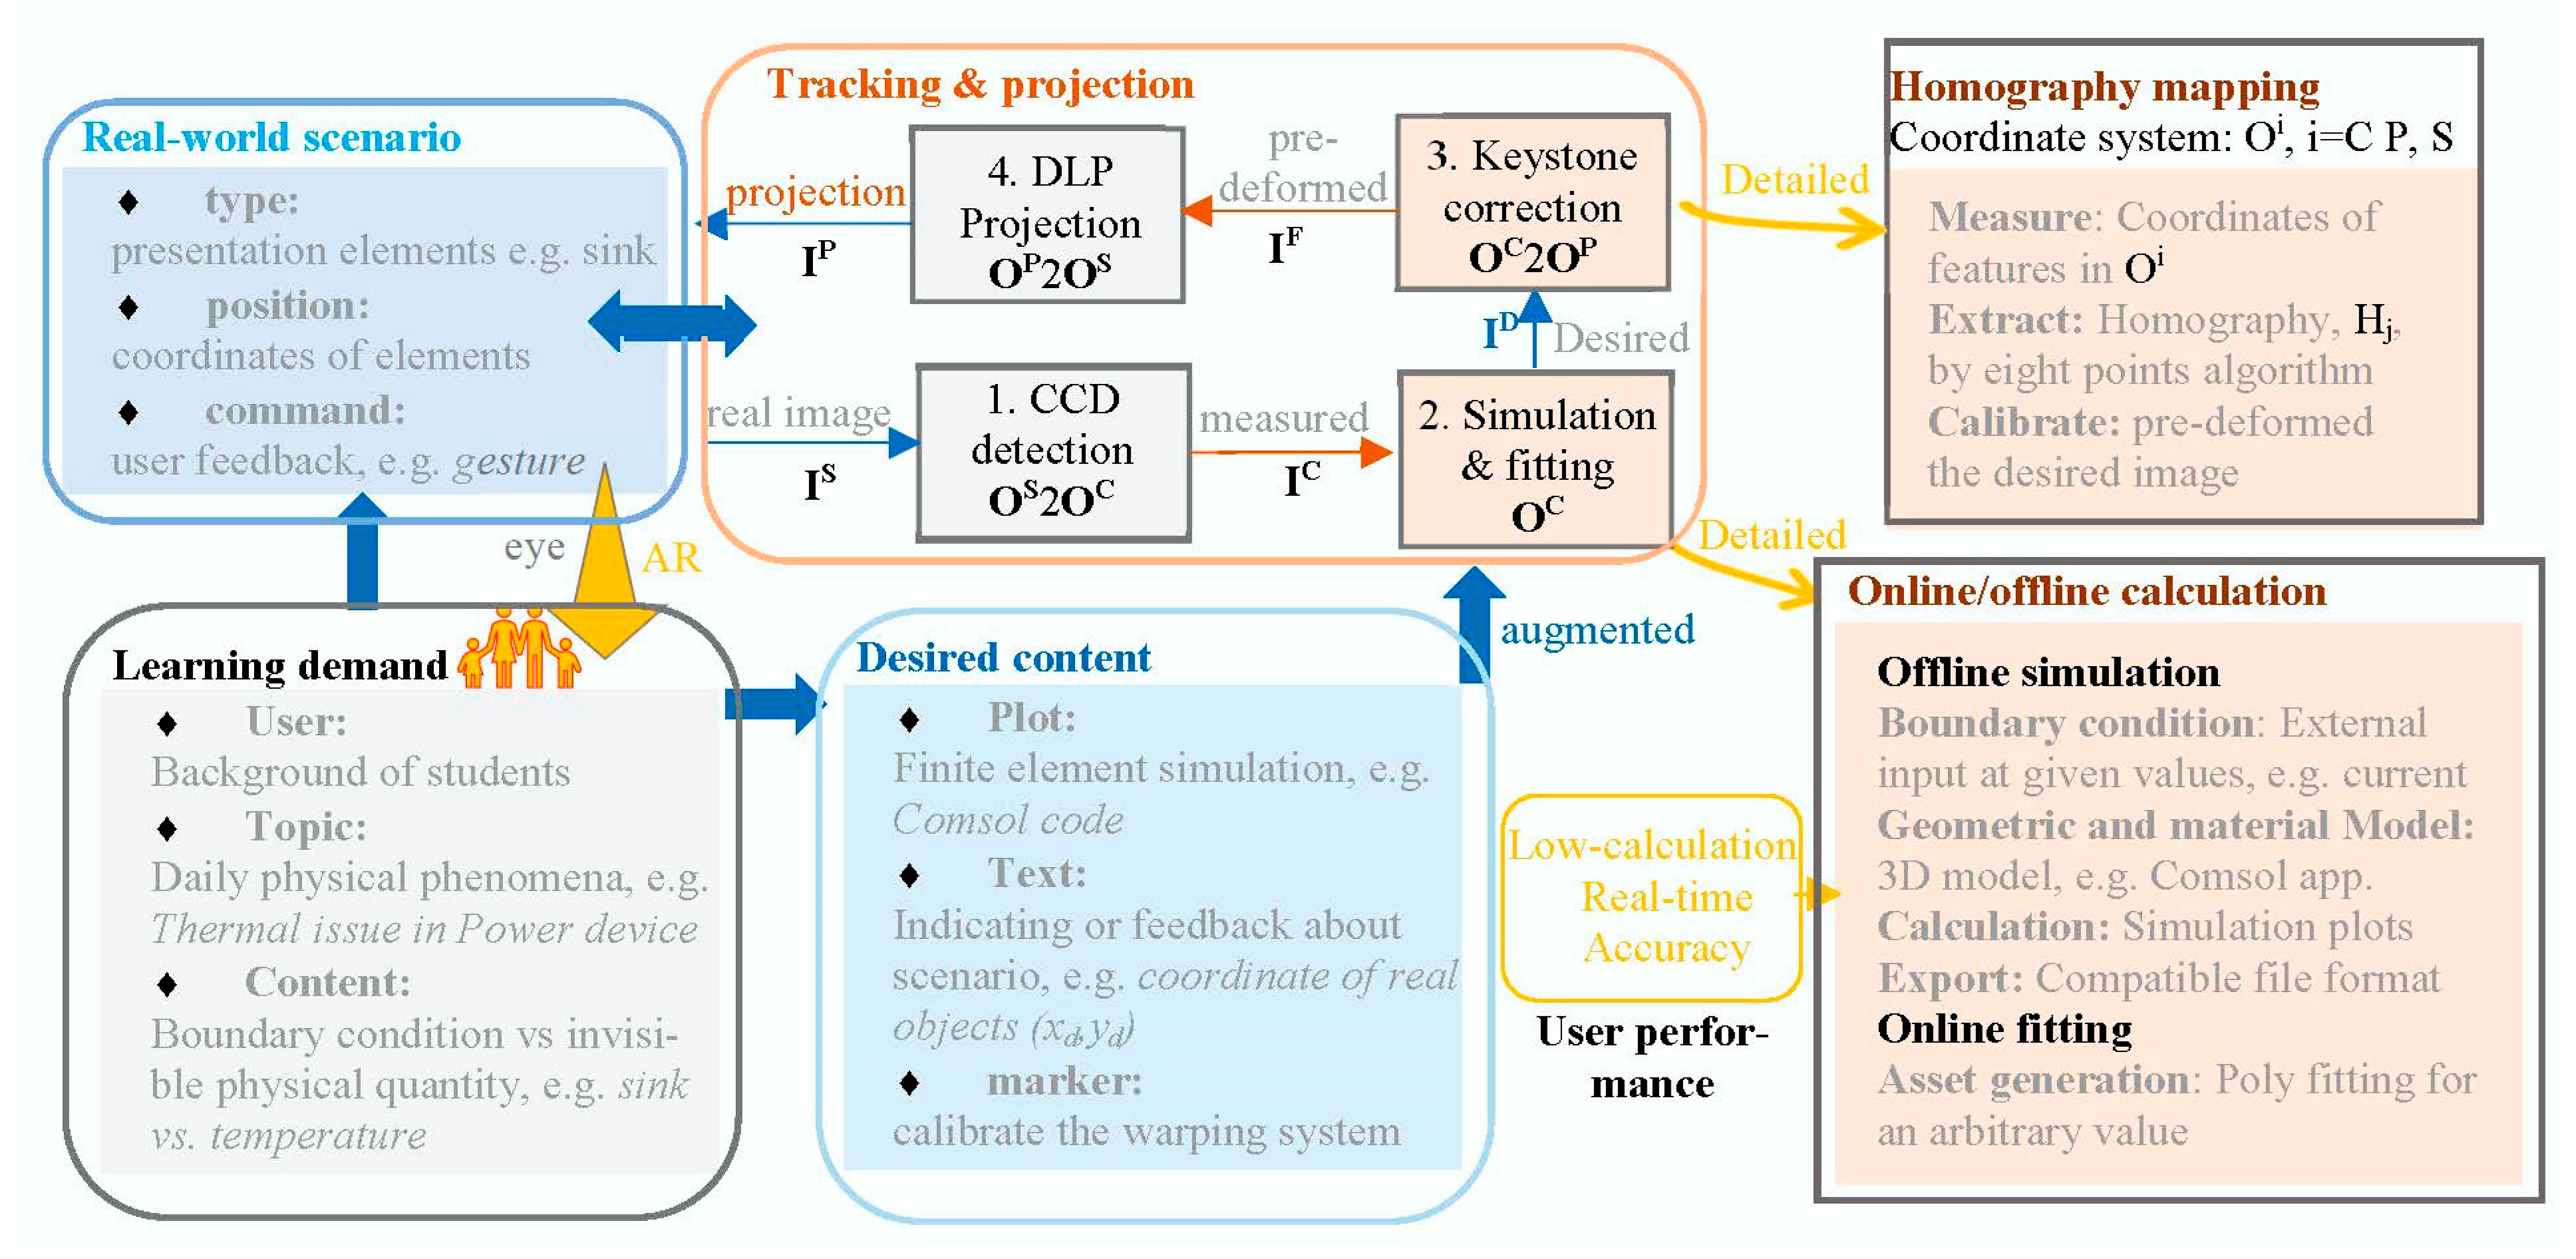
Based on the DLP-based setup, the design of AR learning resources depends upon the development of virtual assets and real objects to meet users’ demands. The AR learning design method are as follows and shown in Figure 5.
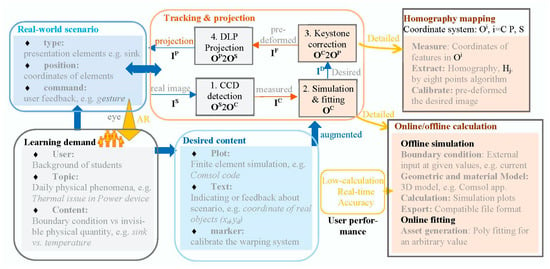
Figure 5.
Data pipeline of the DLP-based AR learning design from the learning demand to the real-world scenario, and the desired image under the conditions defined by user operation through the suggested tracking and projection block, where the pre-deformed image IF is generated by homography mapping method, and the desired simulation ID is calculated by the simulation and fitting.
- Learning demand by users. Firstly, the students’ background information such as preferences is collected through the questionnaire. Secondly, attention is focused upon the physical concepts and laws attracting them most, such as thermal management in electric vehicles for example. Thirdly, the relationship between physical quantities and boundary conditions is analyzed.
- Desired content for assets. The real-time generation of simulation plots in contact with boundary conditions, combined with the indicative texts and calibration markers, is realized by the offline/online asset algorithm. On the one hand, the offline simulation using the finite element code COMSOL is implemented to obtain the pre-stored images under the given conditions. On the other hand, the online fitting method is utilized to achieve the desired content in order to respond to the operation of users.
- Real-world scenario with objects. The real experimental parts are built to realize the AR experiment. Types and positions of the real objects placed on the projection screen are identified by CCD, and then the user’s configuration is imposed on the procedure of producing the desired assets. Finally, DLP projects the augmented information over the real objects in the presented scenario.
The data pipeline of the AR learning design method is controlled by the Python application, which runs on the BB controller with the Linux operating system in the DLP-based experimental platform. During programming, the keystone correction is performed at the startup of the system by pre-deforming the desired image using the homography matrix; meanwhile, the simulation & fitting procedure is looped to keep consistency with the user’s action.
5. AR Experiment on Thermal Management of Power Devices
A guideline for applying the proposed AR learning design method to develop a DLP-based AR experiment on the thermal management of power devices is illustrated as follows.
5.1. Leaning Demand for Defining Real Objects and Virtual Assets
Although educators provide diverse learning resources for students to understand physical concepts, most of them focus on a specific field, such as the electric field, with less emphasis placed on its coupling to others, and thus contribute to the poor ability of students to explore physical phenomena. With the rapid penetration of electric vehicles in daily life, the EIC system (battery, electric control, and motor) is the critical part involved in multi-physical field couplings, particularly in the electrical and the thermal. Therefore, the topic of the electrical–thermal coupling in an EIC system has been chosen for the AR experiment.
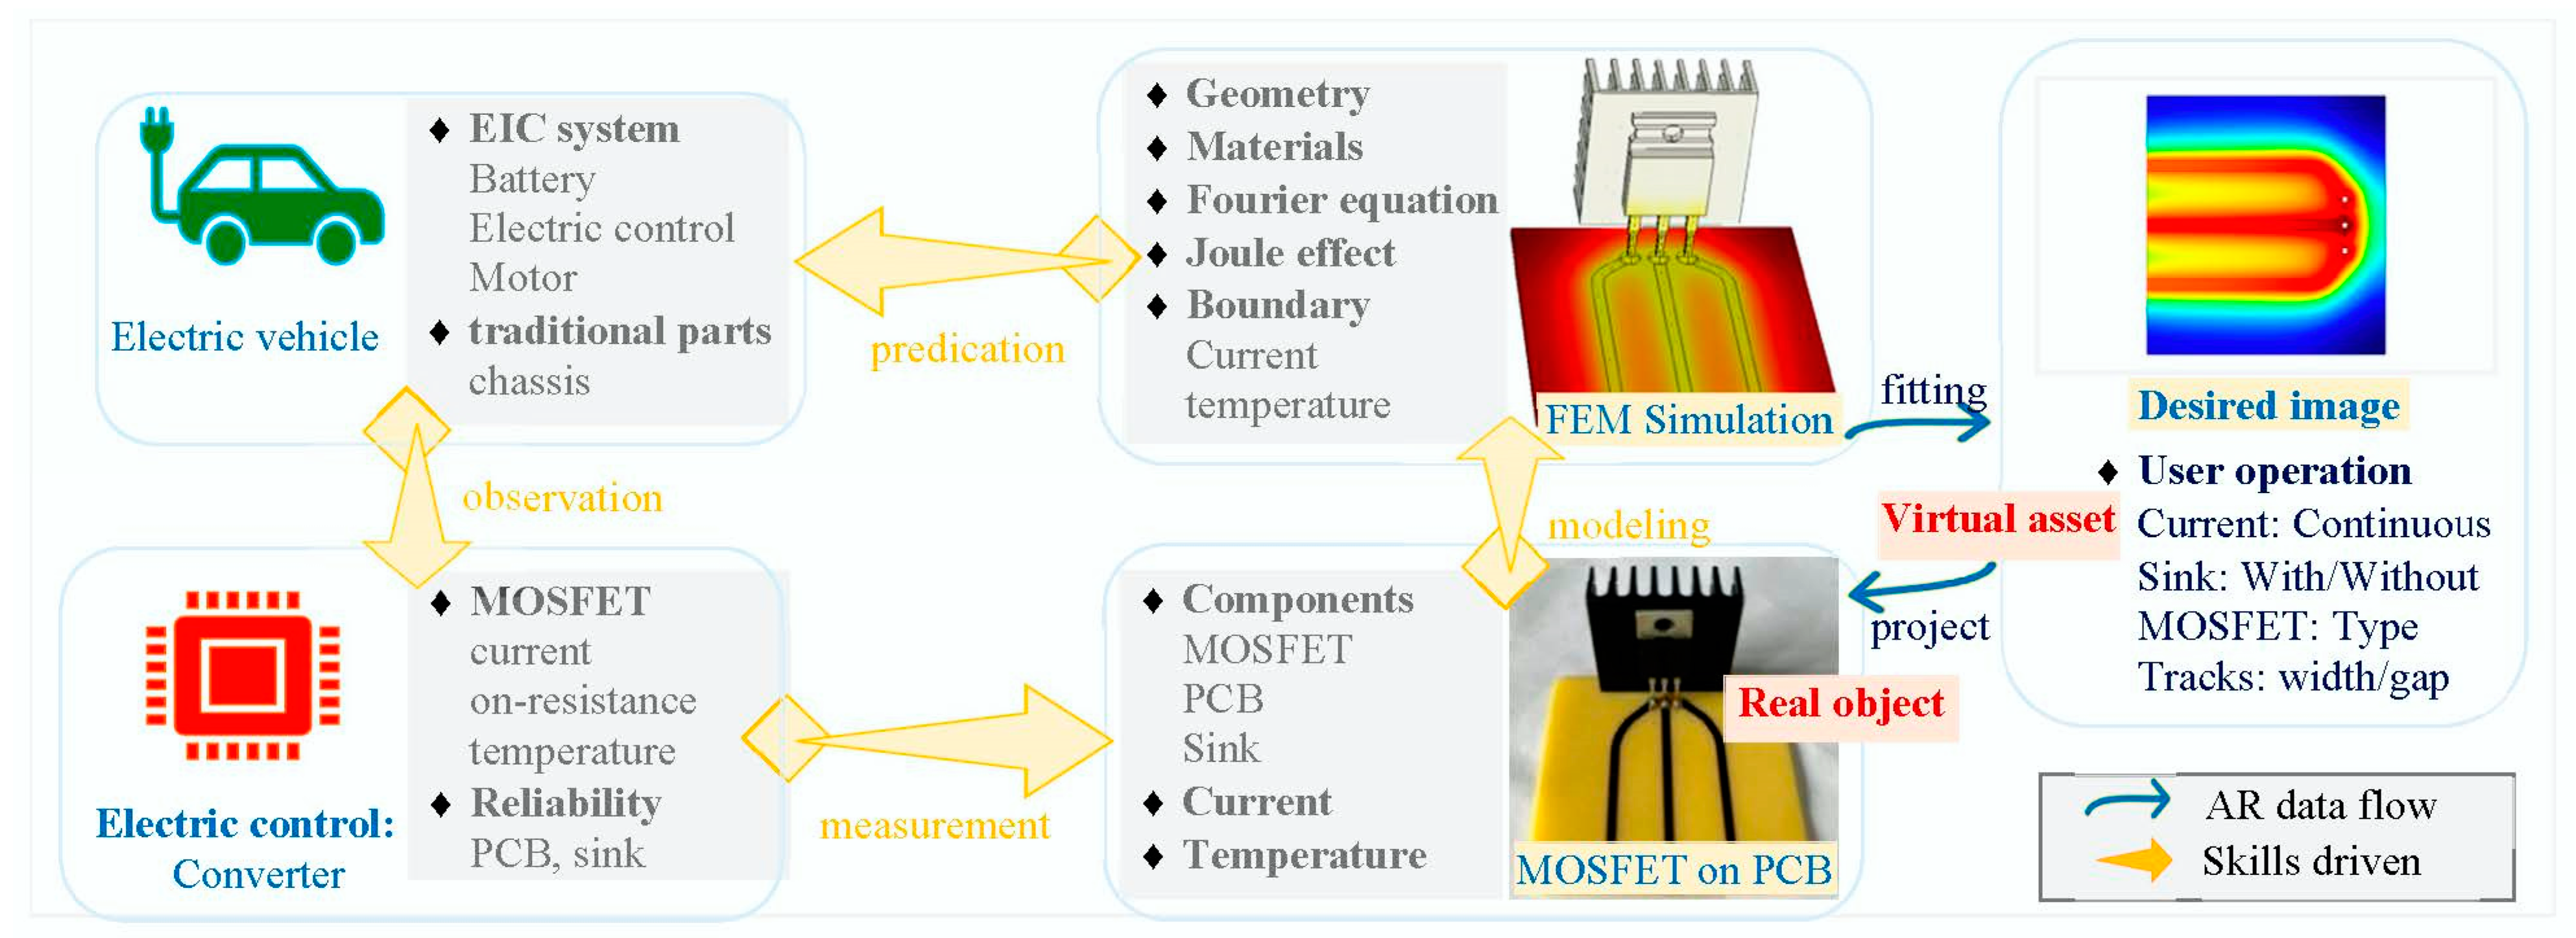
After determining the topic, the fundamental unit of the converter in an EIC system built around a power device MOSFET is investigated to explore the relationship between the thermal and the electrical. With the increase of the operating current, the power device will generate heat increasingly due to the Joule loss on the switch on resistance. Furthermore, the other boundary conditions embracing sinks, types of MOSFET, and tracks of a printed circuit board (PCB) have a great impact on the temperature. To address these issues, the four principal skills of observation, measurement, modeling, and prediction are integrated into the design of the AR experiment, seeing Figure 6.
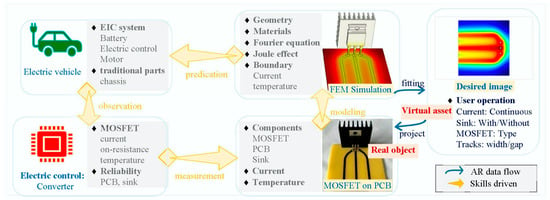
Figure 6.
Four skills-driven design of AR experiment content on MOSFET thermal management, where observation, measurement, modeling, and predication are incorporated into the implementation of virtual assets and real objects.
Firstly, the students’ observations of electric vehicles are presented in the brainstorming. The difference between the electric vehicle and the traditional one is illustrated by the EIC system, and thus leads to the reliability issues of power devices such as MOSFET. Secondly, the temperature of MOSFET operating under the boundary conditions such as the measured current, and the available engineering operations covering the usage of sinks, design of tracks, and choice of MOSFET, are conducted to build a real experiment. According to the geometry and materials of the real experiment, thirdly, a FEM model is built, and the simulated temperature is validated with that of the real experiment so that an accurate understanding can be gained from the predicated images. Finally, the desired image is generated by the online/offline fitting procedure as stated in Section 3.4 when users change the boundary condition to examine the electrical-thermal effect in the MOSFET on PCB.
5.2. Tracking and Projection in DLP-Based AR Platform
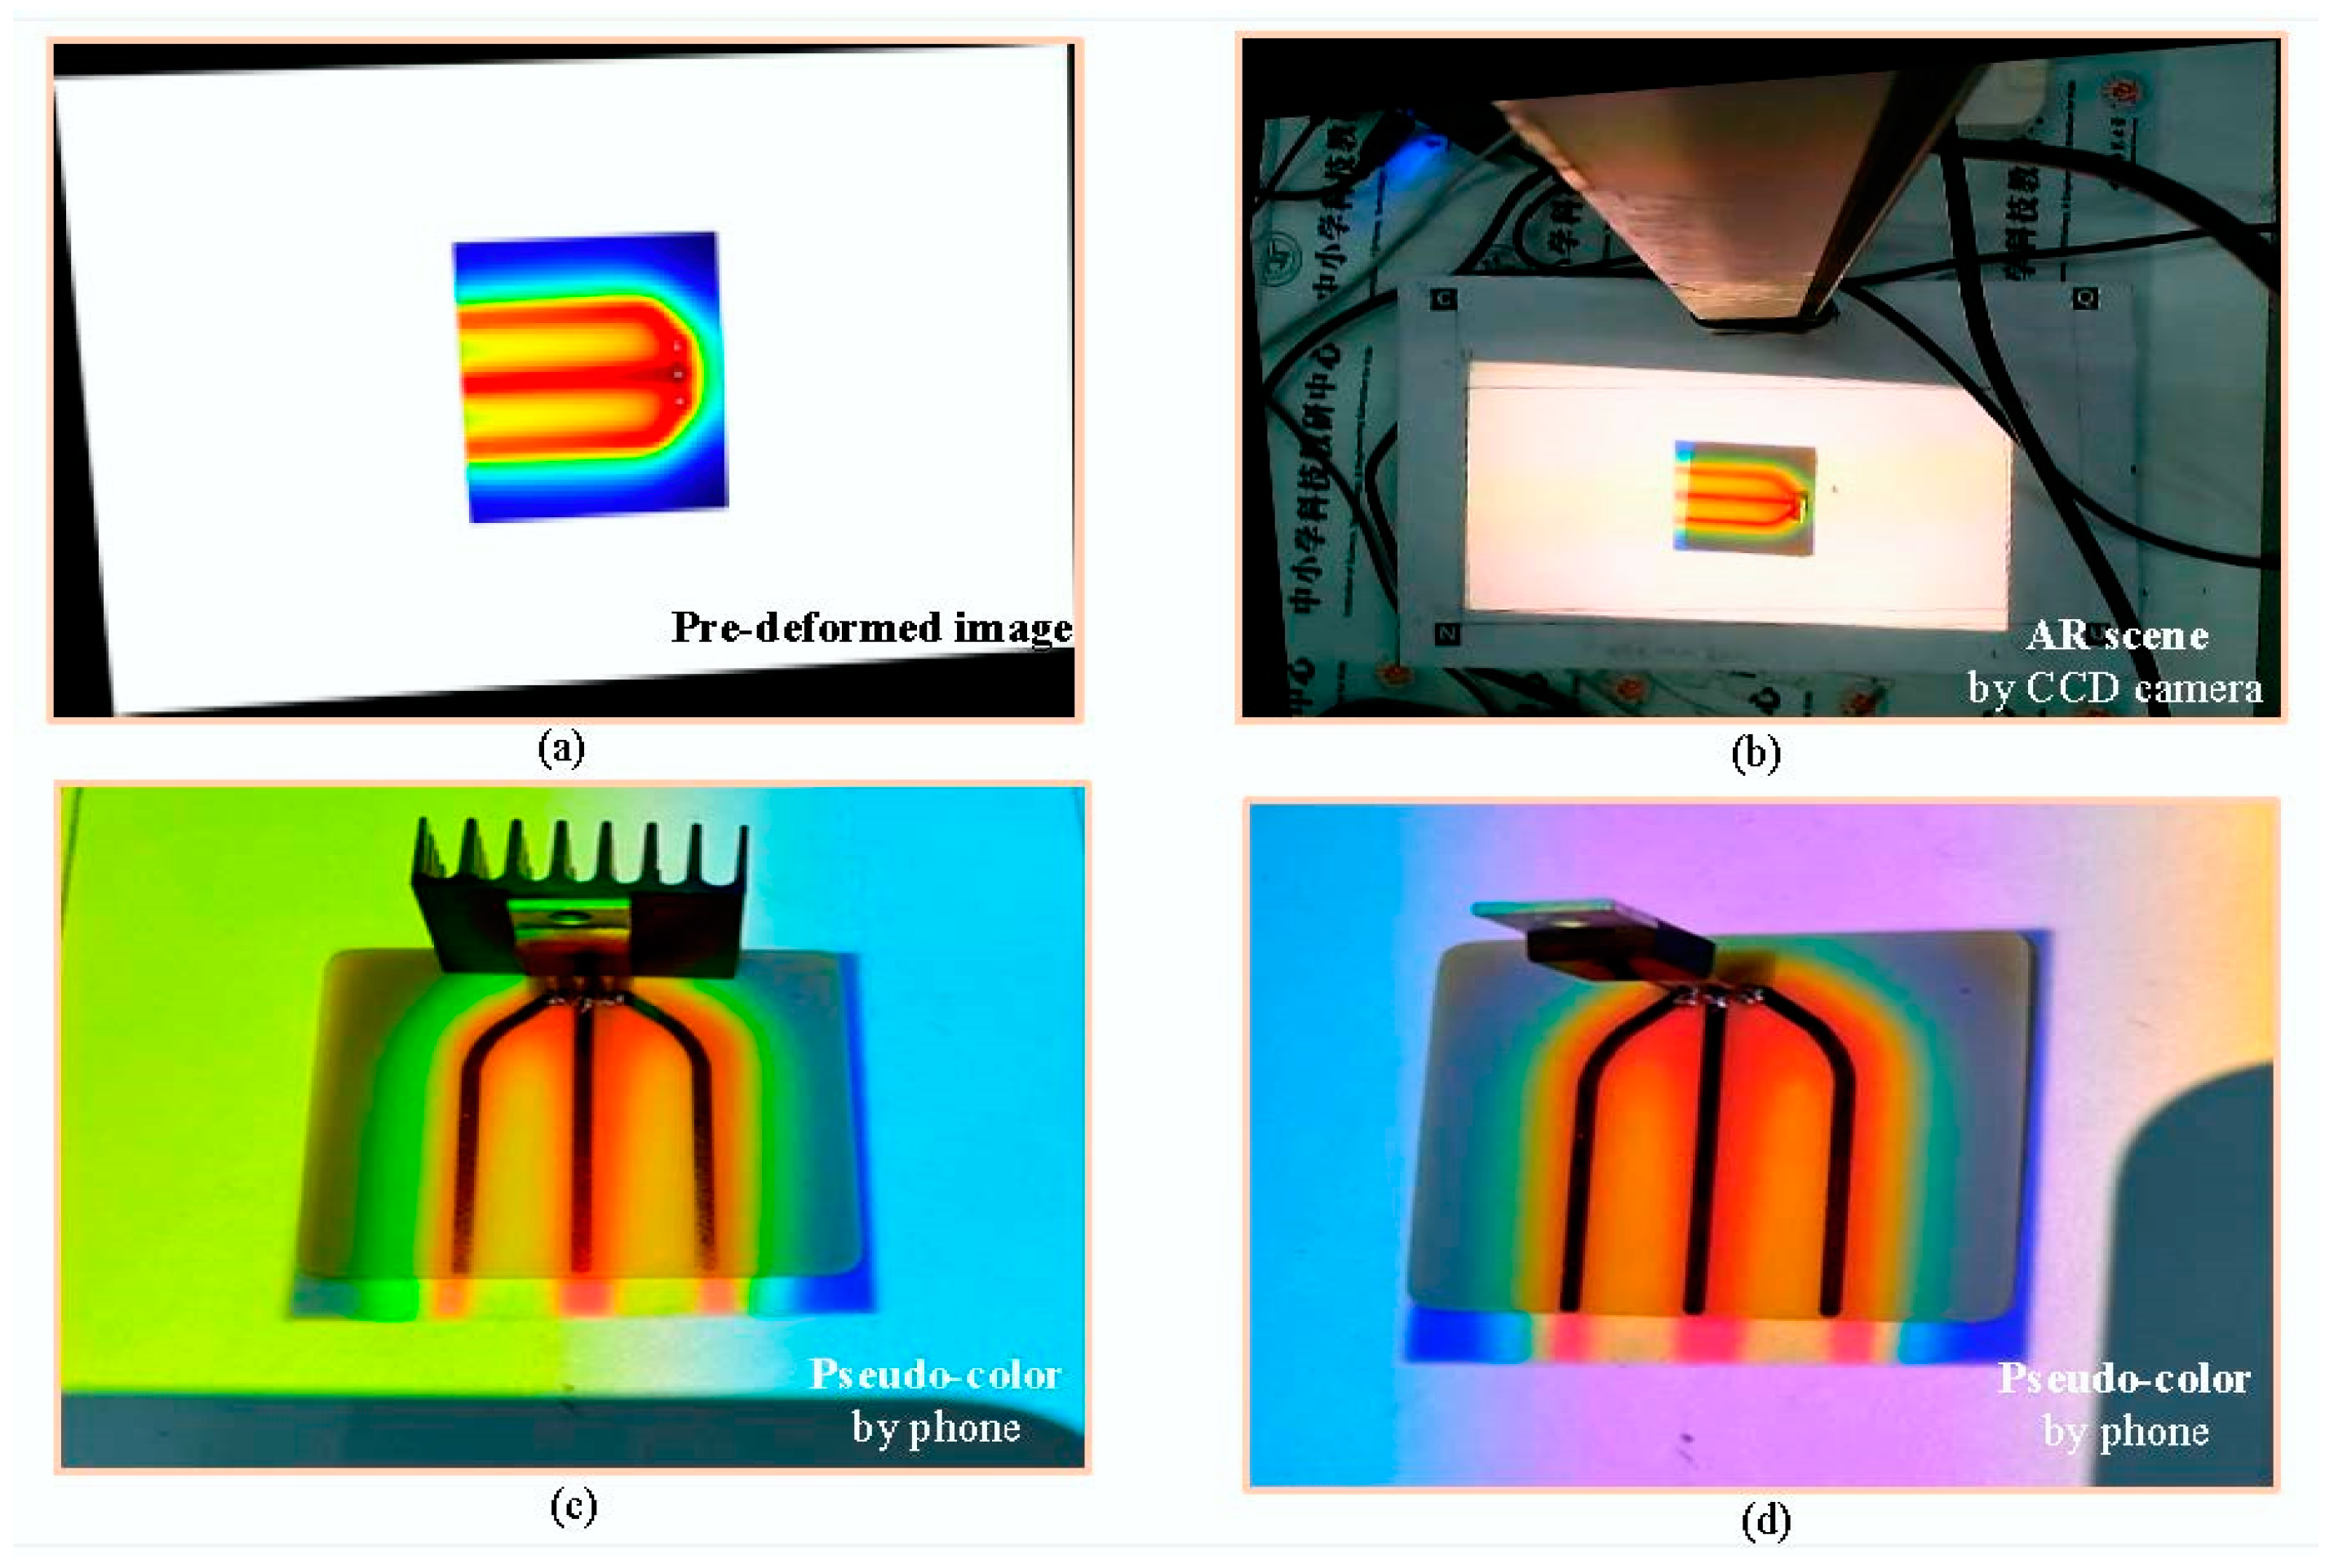
Following the pre-deformed method stated in Section 3.3, the desired image is perceived without distortions on the projection screen, where Figure 7a shows a pre-deformed image of temperature distribution on the PCB. In addition, the position and orientation of the three vias on the PCB are identified as reference points to register the superimposed information and lead to the successful registration of the virtual assets with the real objects in the AR scene, as shown in Figure 7b, captured by the CCD camera. When the position of the real object changes, the CCD-based image detection guides a dynamical superimposition of the desired image over the real object located at the new place, and results show that the time of tracking is less than 0.3 s and the match deviation is about 3 mm. Hence, the real object can be placed freely within the projectable area while keeping augmented information real-time and accurate in the AR experiment.
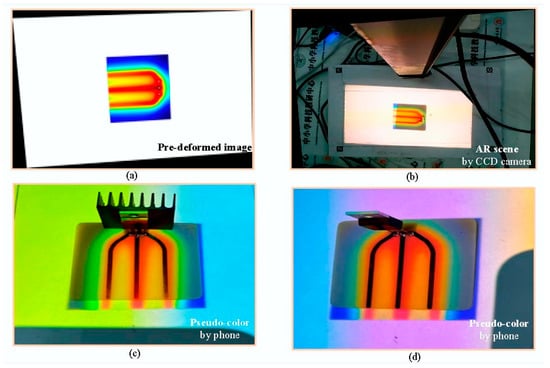
Figure 7.
AR scene of the thermal management experiment of MOSFET on PCB. (a) Pre-deformed image of temperature distribution on PCB; (b) platform image captured by the CCD camera; (c) shot on a camera phone for the experiment configured with a sink; and without a sink (d).
In addition to tracking locations and elements, e.g., a sink configured in the experiment is detected by utilizing the learning algorithm in Section 3.2, and the desired image is updated with the help of the asset generation method in Section 3.4 so that the AR adapts itself to the changing experimental conditions. Although the re-computation of virtual assets in real-time brings about another delay time of 0.6 s, users can enjoy the dynamic configuration to investigate more engineering activities on the interactive AR platform. Whether the sink is mounted on the MOSFET or not by users, the influence of temperature distribution on operating the sink is observed in the AR scene, as shown in Figure 7c,d, where the white background of images is off-color due to being shot with a camera phone.
5.3. Teaching Results
According to the DLP-based AR framework with low-cost components and accurate assets, the dynamically interactive AR experiment of the MOSFET on PCB is present for 28 sophomores majoring in physics at the Chongqing Normal University, China. Following our earlier report about the design method, process of the questionnaire, and interviews about VR in teaching evaluations [27], the main content includes interests, skills, learning, and thinking, as well as years of teaching. The feedback from the questionnaire, interview, and experimental reports are collected to validate the effectiveness and usefulness of the proposed AR experiment.
Firstly, the AR experiment is easy to set on the normal desk by students themselves; they are interested in the magic experimental desktop that senses real objects and projects virtual information. What impressed them most is that the AR experiment provides them with a place to freely configure the experimental objects while keeping a dynamic superimposition of the virtual asset over the real object.
Secondly, evolutions of the visualized temperature distribution due to diverse factors such as the sink, operating current, and distance between tracks are explored in the AR-based experiment of the MOSFET. Most of the students actively participate in the AR experiment with different configurations as much as possible and recognize the fact that there are other engineering methods for the thermal management of power devices besides the usage of a sink. Furthermore, the reliability standard considering both the maxima and the uniformity of temperature is studied to assist the design of the PCB with power devices.
Thirdly, nearly half of the students applied the platform to other topics for creating their own teaching resources, due to their career plans for teaching information technology. Figure 8 illustrates an application in the smart lighting of plants, which has the functions of plant recognition, location tracking, and controlling the light color and shape. It takes only 8 h for a 3-member group to create the AR system using the available projection-camera modules.

Figure 8.
Demonstration of AR teaching resource created by students for plant lighting based on the proposed AR method, where the learning-based CCD detection and warp-based DLP mapping provides users interact with the plant and the light, such as adapting the location (a) and the shape (b) of light to the plant at a place dynamically.
Based on the above-stated teaching procedures, the proposed AR experiment with affordable hardware and accurate assets is easily prepared for teaching electrical–thermal effects, and the interactive operations provide students’ with a concrete understanding of the invisible temperature distribution related to the reliability in electric vehicles. Furthermore, the interactive projection-based AR platform provides an effective AR learning design tool for creating teaching resources for teachers.
6. Conclusions
An affordable AR learning design for physics education is proposed based on the low-cost DLP-based platform and the real-time simulation-based asset generation method, and its performance is validated by the interactive experiment of the thermal management of MOSFET on PCB. This paper is summarized as follows.
- Hardware. A compact projector-camera AR system equipped with the digital lighting process (DLP) module is illustrated to empower the experimental desk with interactive information to students without wearing glass-like devices and has cut the cost with a bill of materials of less than $200 to the favorite range for education.
- Software. A fast and accurate asset generation algorithm is proposed to support the hardware configuration of the compact AR system, where the offline finite element simulation and online poly fitting of the pre-stored plots are combined to balance the calculation accuracy and the response time. Additionally, the homography-based calibration algorithm for misalignments among the DLP, camera, and screen plane is explained to match the real and the virtual.
- Prototype. A visually interactive AR experiment of the thermal management for the MOSFET on PCB is created by the proposed hardware and software, where the projected temperature distribution looks undeformed from the viewpoint of users and is dynamically updated with a response time of less than 1 s and a matching deviation of about 3 mm.
- Evaluation. A full teaching procedure is incorporated into the AR-based thermal management experiment, and findings show that the AR experiment can help students understand abstract concepts and provide an effective tool for them to create their own AR-based teaching resources.
In summary, the proposed interactive AR platform has the advantages of low-cost hardware, easy-calibration projection, and high-accurate assets. It provides the experimental desktop with sensing and projection to meet the requirement of exploring dynamic procedures in physics education. The affordable AR learning design method could be used for wide applications to support home or online explorations of the daily physical phenomena.
Author Contributions
Conceptualization, X.L.; methodology, X.L. and J.Z.; software, X.L.; validation, X.L., Y.C. and J.Z.; formal analysis, J.Z.; investigation, X.L. and Y.C.; resources, X.L.; data curation, J.Z.; writing—original draft preparation, X.L.; writing—review and editing, J.Z. and Y.C.; visualization, X.L. All authors have read and agreed to the published version of the manuscript.
Funding
This research was funded by the Natural Science Foundation of Chongqing under Grant cstc2019jcyj-msxmX0490, the Science and Technology Research Program of Chongqing Municipal Education Commission under Grant KJZD–K202000504, and the Chongqing Education Planning Project under Grant 202-GX–277.
Informed Consent Statement
Not applicable.
Conflicts of Interest
The authors declare no conflict of interest.
References
- Hedenqvist, C.; Romero, M.; Vinuesa, R. Improving the Learning of Mechanics Through Augmented Reality. Technol. Knowl. Learn. 2021, 1–12. [Google Scholar] [CrossRef]
- Sahin, D.; Yilmaz, R.M. The effect of Augmented Reality Technology on middle school students’ achievements and attitudes towards science education. Comput. Educ. 2020, 144, 103710. [Google Scholar] [CrossRef]
- Bogusevschi, D.; Muntean, C.H.; Muntean, G.M. Teaching and learning physics using 3D virtual learning environment: A case study of combined virtual reality and virtual laboratory in secondary school. J. Comput. Math. Sci. Teach. 2020, 39, 5–18. [Google Scholar]
- Mourtzis, D.; Angelopoulos, J.; Panopoulos, N. A Teaching Factory Paradigm for Personalized Perception of Education based on Extended Reality (XR) (31 March 2022). In Proceedings of the 12th Conference on Learning Factories (CLF 2022), Singapore, 11–13 April 2022; Available online: https://ssrn.com/abstract=4071876 (accessed on 7 July 2022). [CrossRef]
- Mourtzis, D.; Siatras, V.; Angelopoulos, J. Real-Time Remote Maintenance Support Based on Augmented Reality (AR). Appl. Sci. 2020, 10, 1855. [Google Scholar] [CrossRef] [Green Version]
- Cecilia, A.G.; Jorge, B.A.; Kinshuk; Joan, D.; Juan, B. Augmented Reality in Education: An Overview of Twenty-Five Years of Research. Contemp. Educ. Technol. 2021, 13, ep302. [Google Scholar] [CrossRef]
- Cai, S.; Liu, C.; Wang, T.; Liu, E.; Liang, J.Y. Effects of learning physics using Augmented Reality on students’ self-efficacy and conceptions of learning. Br. J. Educ. Technol. 2021, 52, 235–251. [Google Scholar] [CrossRef]
- Long, X.; Chen, Y.; Zhou, J. Augmented Reality Experiment on Mechanical Stress of Block on Arch with Simulation-based Asset. In Proceedings of the 2021 4th International Conference on Information Systems and Computer Aided Education, Dalian, China, 24–26 September 2021; ACM: New York, NY, USA; p. 5. [Google Scholar]
- Czerkawski, B.; Berti, M. Learning Experience Design for Augmented Reality. Res. Learn. Technol. 2021, 29. [Google Scholar] [CrossRef]
- Nur, I.; Norhayati, A.; Mohd, A.; Siti, S.R.; Syazilawati, M. Development of Augmented Reality (AR) for Innovative Teaching and Learning in Engineering Education. Asian J. Univ. Educ. 2021, 16, 99–108. [Google Scholar] [CrossRef]
- Pittman, C.; Joseph, J.L., Jr. Determining Design Requirements for AR physics Education Applications. In Proceedings of the 2019 IEEE Conference on Virtual Reality and 3D User Interfaces (VR), Osaka, Japan, 23–27 March 2019. [Google Scholar]
- Xie, C.; Kameda, Y.; Kitahara, I. Large Scale Interactive AR Display Based on a Projector-Camera System. In Proceedings of the 4th ACM Symposium on Spatial User Interaction (SUI), Tokyo, Japan, 15–16 October 2016. [Google Scholar]
- Aydoğdu, F.; Kelpšiene, M. Uses of Augmented Reality in Preschool Education. Int. Technol. Educ. J. 2021, 5, 11–20. [Google Scholar]
- Oki, M.; Bourreau, B.; Suzuki, K. CANVAS: A Drawing Tool for AR-aided Special Needs Education using Interactive Floor Projection. In Proceedings of the IEEE International Conference on Systems, Man and Cybernetics (SMC), Bari, Italy, 6–9 October 2019. [Google Scholar]
- Oh, S.; So, H.J.; Gaydos, M. Hybrid Augmented Reality for Participatory Learning: The Hidden Efficacy of Multi-User Game-Based Simulation. IEEE Trans. Learn. Technol. 2018, 11, 115–127. [Google Scholar] [CrossRef]
- Weiss, C. Augmented Reality for the 2020 Classroom. In Proceedings of the 14th International Technology, Education and Development Conference (INTED), Valencia, Spain, 2–4 March 2020. [Google Scholar]
- Xiong, J.; Hsiang, E.L.; He, Z.; Zhan, T.; Wu, S.-T. Augmented reality and virtual reality displays: Emerging technologies and future perspectives. Light Sci. Appl. 2021, 10, 216. [Google Scholar] [CrossRef] [PubMed]
- Yoon, J.C.; Kang, H. Interactive Learning in the Classroom: A Mobile Augmented Reality Assistance Application for Learning. Comput. Animat. Virtual Worlds 2021, 32, e1989. [Google Scholar] [CrossRef]
- Lim, C.; Choi, J.; Park, J.; Park, H.I. Interactive augmented reality system using projector-camera system and smart phone. In Proceedings of the 2015 International Symposium on Consumer Electronics (ISCE), Madrid, Spain, 24–26 June 2015. [Google Scholar] [CrossRef]
- Tong, Y.; Jia, B.; Bao, S. An Augmented Warning System for Pedestrians: User Interface Design and Algorithm Development. Appl. Sci. 2021, 11, 7197. [Google Scholar] [CrossRef]
- Plunkett, K.N. A Simple and Practical Method for Incorporating Augmented Reality into the Classroom and Laboratory. J. Chem. Educ. 2019, 96, 2628–2631. [Google Scholar] [CrossRef]
- Huang, J.M.; Ong, S.K.; Nee, A.Y.C. Visualization and Interaction of Finite Element Analysis in Augmented Reality. Comput. Aided Des. 2017, 84, 1–14. [Google Scholar] [CrossRef]
- Thiago, D.; Saul, E.; Ricardo, A.; Antonio, A. Development of a Low-Cost Augmented Reality Head-Mounted Display Prototype. In Virtual and Augmented Reality: Concepts, Methodologies, Tools, and Applications; IGI Global: Hershey, PA, USA, 2018; pp. 1–28. [Google Scholar] [CrossRef] [Green Version]
- Dave, A.; Kang, M.R.E.; Oh, P. Towards Smart Classroom: Affordable and Simple Approach to Dynamic Projection Mapping for Education. In Proceedings of the 10th Annual Computing and Communication Workshop and Conference (CCWC), Las Vegas, CA, USA, 6–8 January 2020. [Google Scholar]
- Hartley, R.; Zisserman, A. Multiple View Geometry in Computer Vision, 2nd ed.; Cambridge University Press: Cambridge, UK, 2003; pp. 25–37, ISBN-10 0521540518. [Google Scholar]
- COMSOL Multiphysics 5.6. Available online: https://www.comsol.com/model/thermoelectric-cooler-30611 (accessed on 8 April 2021).
- Tan, L.M. Research on Application of VR Technology in Junior Middle School Physics Experiment Teaching. Master’s Thesis, Chongqing Normal University, Chongqing, China, 2021. [Google Scholar] [CrossRef]
Publisher’s Note: MDPI stays neutral with regard to jurisdictional claims in published maps and institutional affiliations. |
© 2022 by the authors. Licensee MDPI, Basel, Switzerland. This article is an open access article distributed under the terms and conditions of the Creative Commons Attribution (CC BY) license (https://creativecommons.org/licenses/by/4.0/).

