Article

Influence of Contact Surfaces’ Impact on the Gear Profile during Hobbing Process

Faculty of Mechanics, University of Craiova, 200585 Craiova, Romania
*
Author to whom correspondence should be addressed.
Appl. Sci. 2022, 12(16), 8027; https://doi.org/10.3390/app12168027
Submission received: 17 February 2022 / Revised: 7 August 2022 / Accepted: 8 August 2022 / Published: 10 August 2022
(This article belongs to the Topic Industrial Engineering and Management)

Abstract

:
This work is the result of research on the dynamic process that occurs during milling machining, namely, the influence of the contact surfaces’ impact on the gear and the hob and the influence of their displacements on the resulting profile of the tooth. An acquisition system was placed on the final elements of the milling machine chain to determine the torque moments and displacements during gear milling. The experimental analysis proves that the displacements are within admissible limits and have no major influence on the quality of the processing surfaces. A dynamic simulation of the hobbing process with the finite element method (ANSYS) was performed for a limited period of time, and the values of deformation, equivalent strain, and stress have been determined; the time at which the chips come off and the corresponding value of the equivalent stress that occurs at their break were determined based on the maximum distortion energy von Misses theory. It is required to simulate the entire hobbing process, even if it can be time-consuming to differentiate the influence of the dynamic behavior of the machine’s kinematic supplementary chains on the hob wear and the tooth profile. A modal analysis will be able to support the comparative study related to the obtained experimental data.

1. Introduction

In order to solve the problems of productivity and economic efficiency, as well as to achieve the precision of the gear, efficient machining methods have been developed. According to [1], machining is still the unsurpassed method of producing gears of all types and sizes with high accuracy. Numerous studies have been carried out regarding the machining of gears by the milling process and the effect on the geometry of the processed wheel [2,3]. The rolling generating process is used to produce the most high-quality gears, taking into account the advantages in terms of productivity and profitability [4,5]. Hobs are used for obtaining spur gears, spiral gears, and worm wheels. The FD320A milling machine is one of the most commonly used tool–machine used for gear machining.
Some studies refer to the influence of cutting-edge preparation on the wear resistance of gear hobs on a five-axes milling machine (e.g., [6]). Other studies cover the design, modal analysis, and experimental tests of gearboxes already machined (e.g., [7]).
Numerical and experimental investigations on the dynamics and stability of the system workpiece–tool associated with milling operations have been presented, too (e.g., [8,9]). An analytical method for the computation of the cutting-edge geometry of a gear hob based on vector calculus and matrices in the tool-in-use reference system, useful in the optimization process, was reported in [10].
Review papers of various models of the milling process were written to illustrate the wide range of applicability (e.g., [11]).
Dynamic models of the milling process have been developed that consider the deformation of the cutting tool during machining and the dynamic compliances of the workpiece (e.g., [12]). Scientists have published numerous studies regarding the calculation of tool wear during the gear milling process, these being oriented in two directions, namely, the calculation of wear in individual positions based on the simulated chip geometry (e.g., [6,13]) and the introduction of methods based on FEM (e.g., [14,15]).
The FEM can directly give the tool wear and its morphology, but it has not been commonly used to predict tool life due to the great simulation time (e.g., [2,16]).
There are different algorithms and software to simulate gear machining such as PATRAN/NASTRAN [11]; Hob3D—which can be used for the analysis of the chip formation and for the cutting force in the milling process [17,18], and it can also be extended to other cutting processes based on the same principle, all the movements being transferred on the cutting edge [19,20]; ANSYS [21]; AdvantEdge [15]; DEFORM [22]; FRS/MAT/FRSWEAR [23]; and SPARTApro [24,25].
The present work is an extension of the papers [26,27] and aims to realize a comparative study of the experimental data with those simulated by ANSYS software. Experimental determinations of the displacements and tool shaft torque moments, due to the vibrations during the machining, have been conducted; a computer-assisted method for determining the contact surfaces’ displacements between a hob cutter and the workpiece was performed; for a particular situation with known technological parameters, the errors that occurred during the technological process and, implicitly, the machining accuracy, were determined [26,27]. A dynamic simulation of the milling process with the finite element method was performed, and the values of deformation, strain, and stress over a period of time have been determined.

2. Research Methodology

Theoretical research shows that the rolling kinematic chain is a complex dynamic system in which the interaction between the design and assembly deviations of the component elements and the characteristics of the cutting process takes place. The rolling kinematic chain is an oscillating system, excited by various disturbing sources (inside and outside), which manifests itself in the form of torsional vibrations that overlap over the movements of the final elements and have the effect of generating surfaces with deviations. The external source of torsional vibration excitation is the variation in the main cutting force due to the characteristics of the milling cutting process.
In dynamic analysis, it is necessary to determine the proper vibrations of the main chain, which are the amplitudes of the forced vibrations that could appear in this chain caused by the variation in the cutting forces. In support of this analysis, there are numerous books [28,29] that deal with the general theory of vibrations and other works that study the vibratory process during hobbing [30,31]. The approach to the resonance domain has negative effects on the cutting process, which is a direct influence on the processing precision.
The dynamical calculus is a calculus of free and maintenance vibrations of the main chain of the milling machine, in which every shaft is assimilated to a torsional spring with constant stiffness and each gear as a disk of inertia. In dynamical calculus and for the contact area, without making considerable errors, only the disturbance effect of the variable moments of cutting forces was taken into account [27,32].
The sizes of the cutting forces is a very important issue in gear machining [26,33]. The resulting cutting force, F, is variable in terms of application point, direction, and size during the machining. The vector, F, is determined by its components in the three directions of the attached system (Figure 1). The main cutting force (FC) subdues the gear shaft at compression stress and bending; the component FT subdues the workpiece shaft at torsion; and the radial force (FR) subdues the gear shaft at bending. The most important components, from the point of view of machine tool design, are FT and FC.
The variation in cutting forces during machining determines the dynamic stability of the machine tools and has an influence on the accuracy of the performance of the gears. Precise analytical determination of the dynamic behavior of the machine tool is not possible, due to both its complex constructive configuration and the relative knowledge regarding the stiffness and damping properties in kinematic chains and couplings; therefore, the use of experimental methods is also required.
In this context, the experimental research carried out in [27] aimed to determine the variation in forces and the displacements at the level of the contact surface between the hob and the gear.
Experimental research is related to the FD320A milling machine, using a hobbing cutter with a module of m = 3.5 mm. The geometrical characteristics for the hob in Table 1 are mentioned. For workpiece material, steel C 45 without thermal treatment was chosen. The gear has a value of Z2 = 30 teeth without profile shifting.
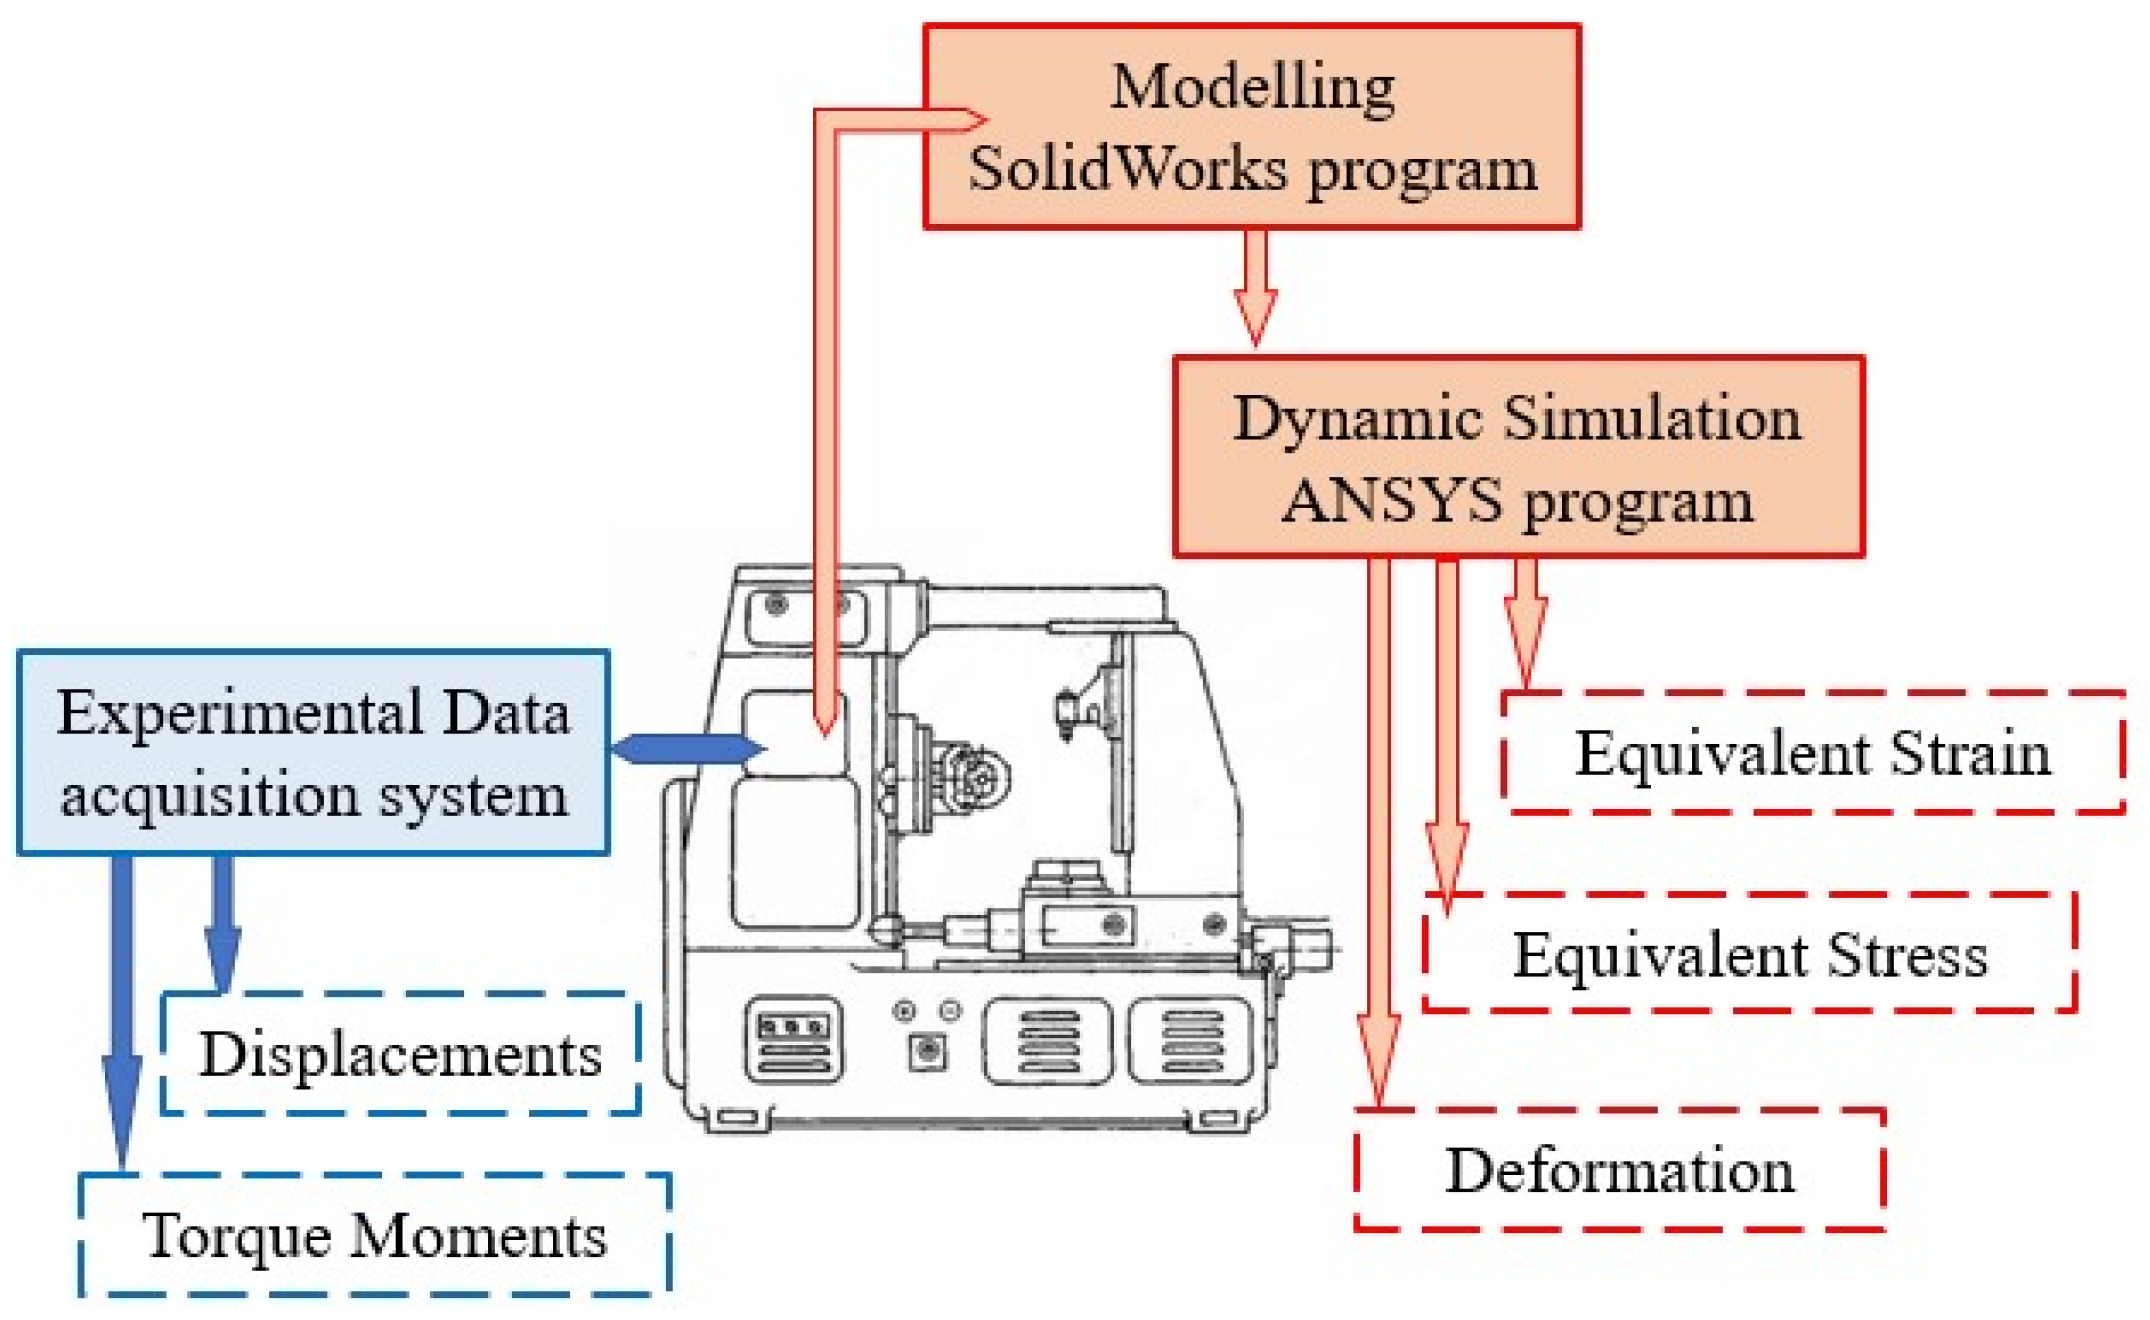
The methodology will combine the experimental data acquisition (displacements and moments) with the simulation of the cutting process using the ANSYS program [34]. The parameters of the cutting process constituted the input data in the ANSYS program, which then provided the output data as the strain, stress, and deformation in the contact surface. The diagram of this methodology is presented in Figure 2.
A 2515-Bruel–Kjaer vibration analyzer [35] was used to measure the displacements. Its characteristics of it are given by a frequency range of 0.3–20 kHz and a non-volatile memory that can store up to 100 measurements. It also allows for comparing, analyzing, and plotting graphs in linear and logarithmic coordinates.
For the experimental determination of the torque moments on the shafts, Vishay strain gauge sensors are bonded. The assembly consists of two rosettes composed of two strain gauges at 90 degrees connected in a complete bridge. For transmitting the signal from the shafts in rotational motion to the fixed part, systems with collecting brushes are used. The acquisition system has a measuring pitch of 10−5 s.
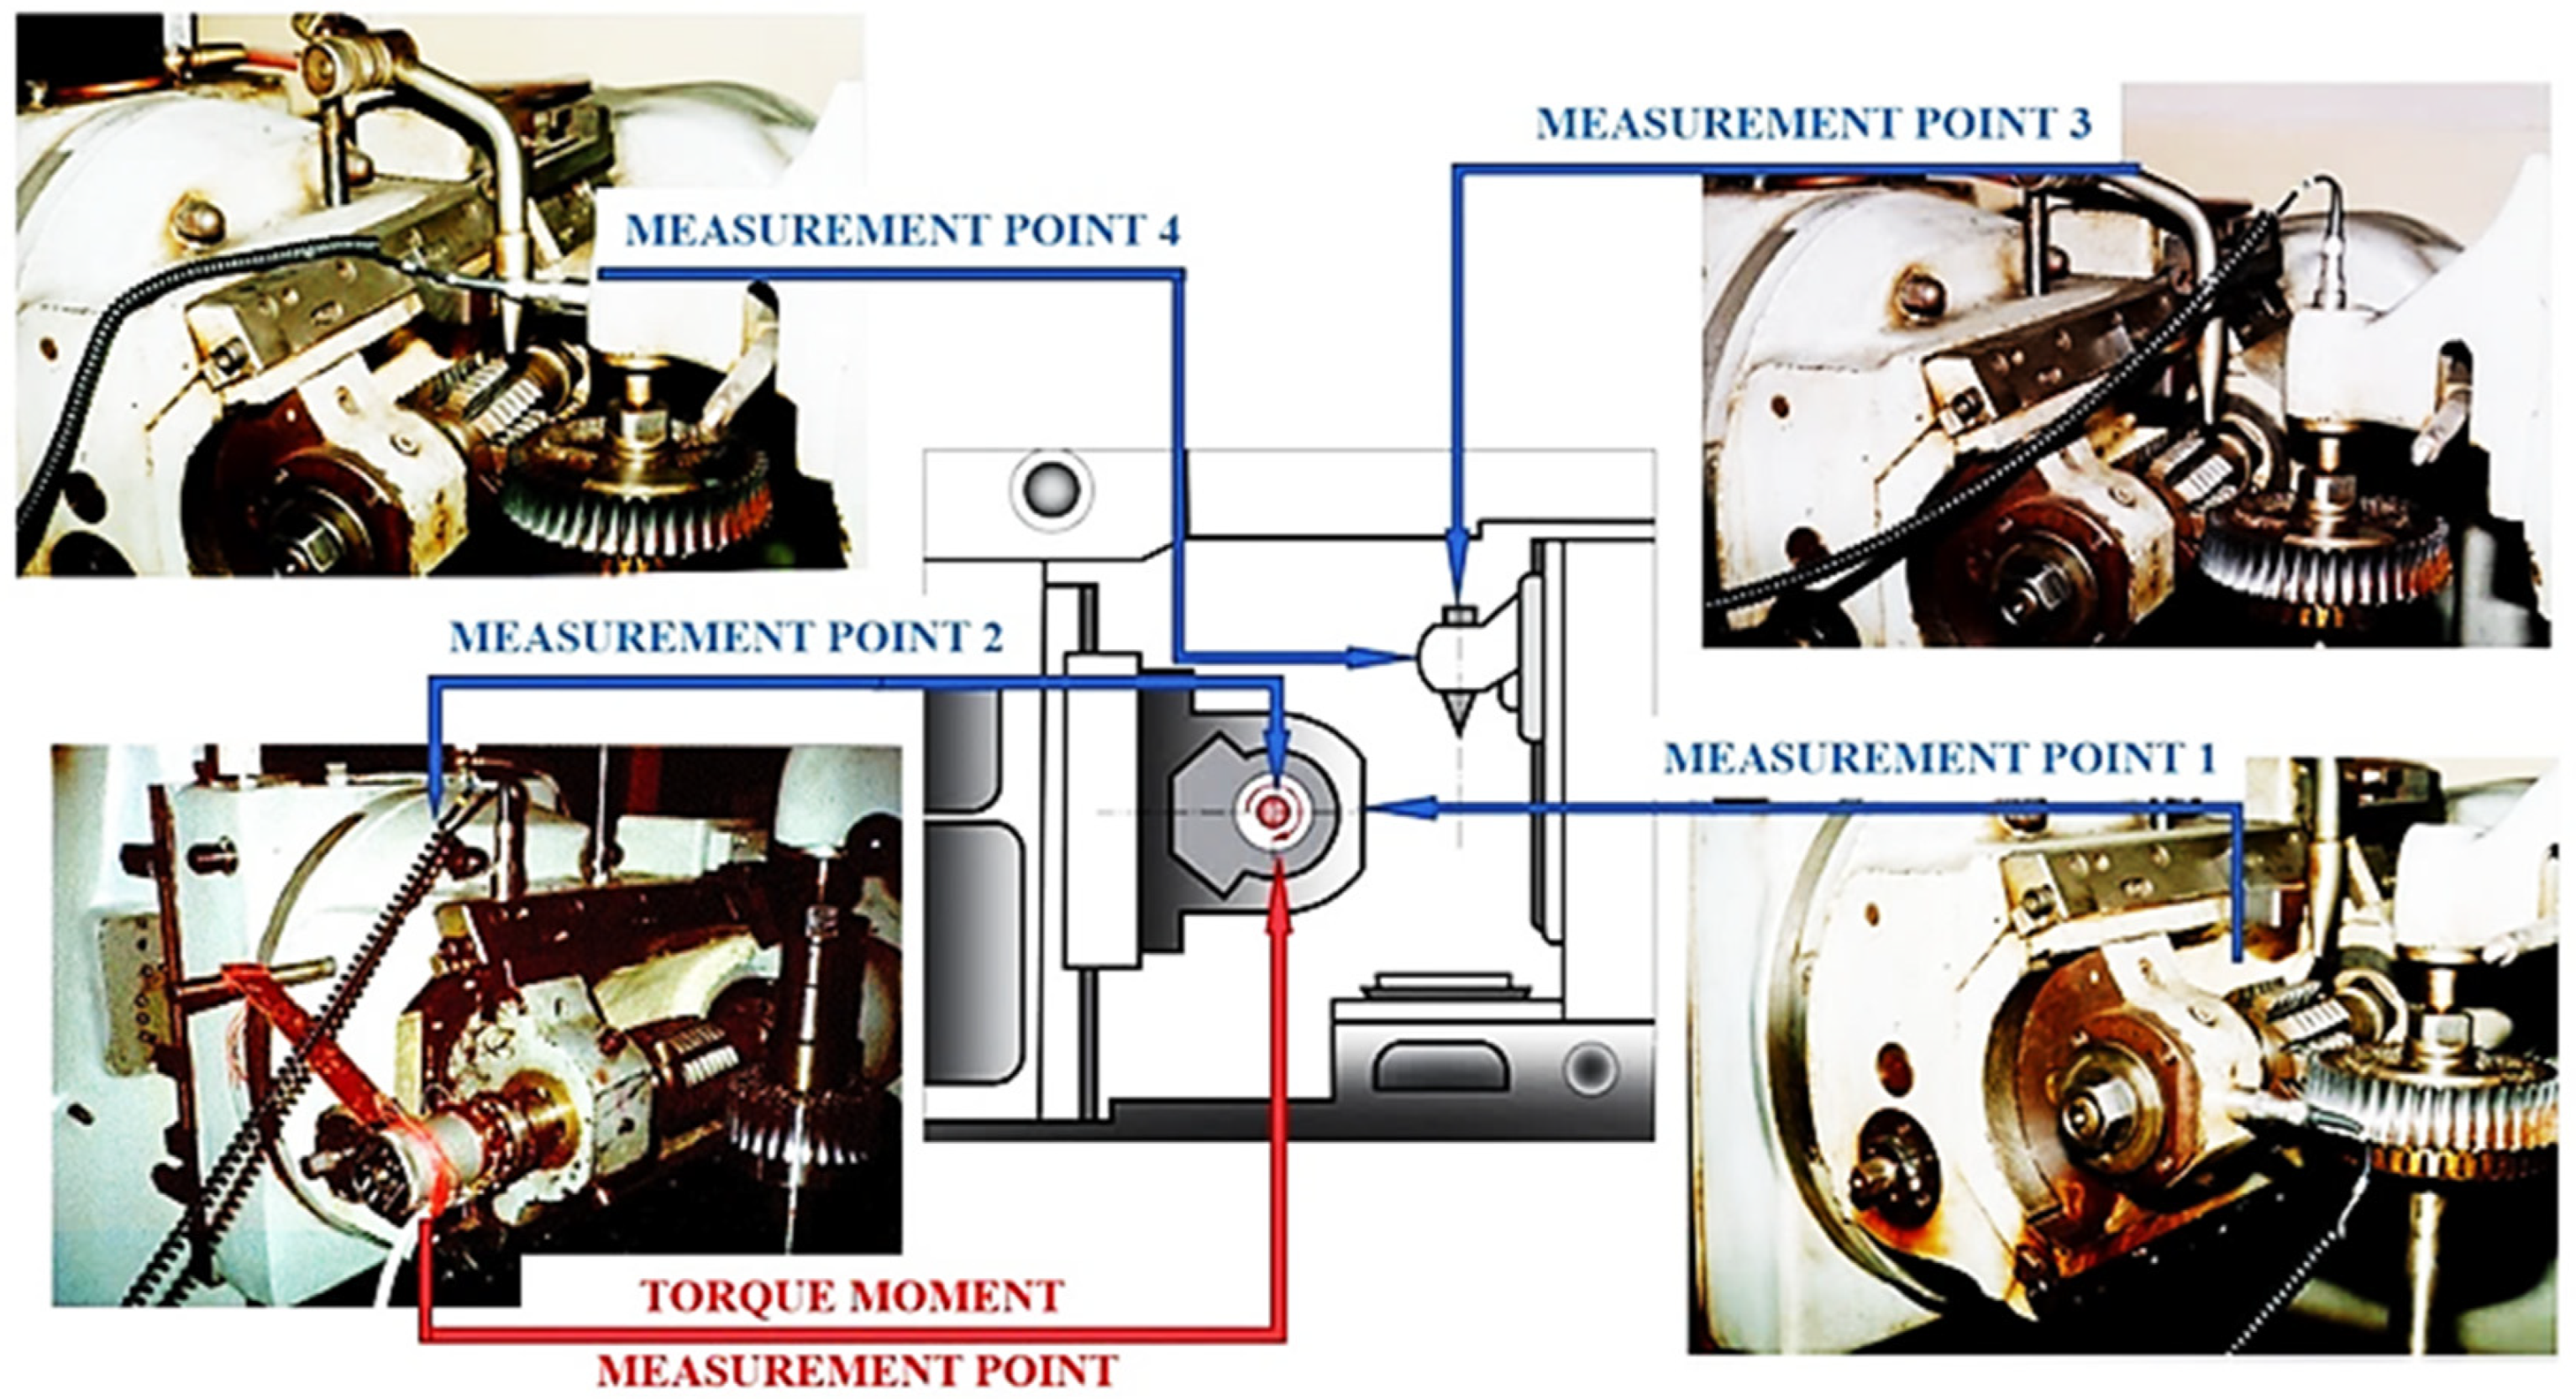
The experimental data acquisition system provided displacements for four chosen points on the hob, gear, and the torque moment on the tool shaft over a period of time. Due to the fact that both the gear shaft and the tool shaft were rotating, the analyzer sensor could not be positioned directly on them; the analyzer sensor was positioned in the immediate vicinity of the area of interest, resulting in relatively small errors. The points chosen for determining the displacements are two on the axes of the gear holder (measurement points 3 and 4) and two on the axes of the tool holder (measurement points 1 and 2) (Figure 3).
Experimental torque moments on the tool shaft were made in their harmonic form.

3. Results and Discussion

3.1. Experimental Results

In [26,27], the experimental results for the gear machining were presented, with different cutting modes with the given acquisition systems located in the points specified in the previous sub-chapter.
In Table 2, somet results referring to the chosen points’ displacements, recorded using Brüel and Kjær the analyzer, were given [26].
Table 3 shows the results recorded for the torque moments of the tool shaft corresponding to the same situation as in Table 2. In Figure 4, the corresponding diagrams are presented.
From the moment diagrams (Figure 4), the pulsating nature of the cutting moments can be observed. The torque moments can be decomposed into an average constant component and a variable one (Figure 4a). The average component is balanced by the motor torque moment of the driving motor. The variable component leads to the maintenance of vibrations in the kinematic rolling chain. The variation law of the variable component can be written in harmonic form with the Fourier series, the errors introduced being insignificant (Figure 4b). In the moment diagrams, the transformation benchmark is 3000mV = 48.75 Nm.
When performing the frequency analysis of the torque moments, the first five pulsations can be observed, but the first two are much more obvious, which is why they were taken into account [27]; the same procedure was utilized in [36].
Regarding the deviation from the geometrical shape of the teeth’s involute profile, the experimental analysis demonstrated that the displacements were within admissible limits (20%) and did not have major influences on the quality of the processed surfaces [27].

3.2. Numerical Simulation Results

Another modern approach is related to simulating the cutting process using different analysis software (e.g., ANSYS 19, Hob3D v.2022, AdvantEdge v.7.8), with results quite close to the experimental methods [17,18,19,20,23,30].
In this paper, the SolidWorks 2019 software for geometric modeling and the ANSYS program for process simulation are used for the gear hobbing process.
A hob was used with the module m = 3.5 mm; the number of origins was z1 = 1; cutting direction—R; material HHS; and other geometric parameters according to Table 1, namely: II—DIN 3972; I—STAS 11482.
The input gear data: the module m = 3.5 mm; the outside diameter dg = 112 mm; the number of teeth z2 = 30; and the pressure angle α = 20°. In order to obtain this gear teeth number after processing, a correlation is required between the rotation speeds of the two elements: gear and hob (Equation (1)):
n g n h = z 1 z 2
where: ng—rotational speed of the gear (rpm); nh—rotational speed of the hob (rpm); z1—number of origins of the hob; and z2—number of the gear teeth.
To analyze the milling process, the cutting speed vc is determined with the Equation (2) [37]:
v C = 312 t 0.33 · s 0.5   ( m / min ) ,
where s = axial feed (mm), and t = hob edge endurance (min)
There are many studies for the calculation of the wear and edge endurance of the hob, depending on the process parameters [2,6,13,14,15].
For this study, the s and t values were adopted (s = 4 mm and t = 240 min [37]), and the speed vc = 25.56 m/min is obtained.
The cutting speed will determine the rotation speed of the hob nh = 95 [rpm] (Equation (3)):
n h = 1000 · v C π · d h   ( rpm ) ,  
where dh (m), vc (m/min).
From Equation (1), results in the rotation speed of the gear ng = 3.16 (rpm).
In the gear hobbing process, the depth of cut ap = 0.15 mm and the feed rate vf = 4 mm/min were used.
Referring to the stiffness behavior, the hob was considered rigid, and the gear was flexible. The kinematic rotation joints, gear-base, and hob-base were considered rigid.
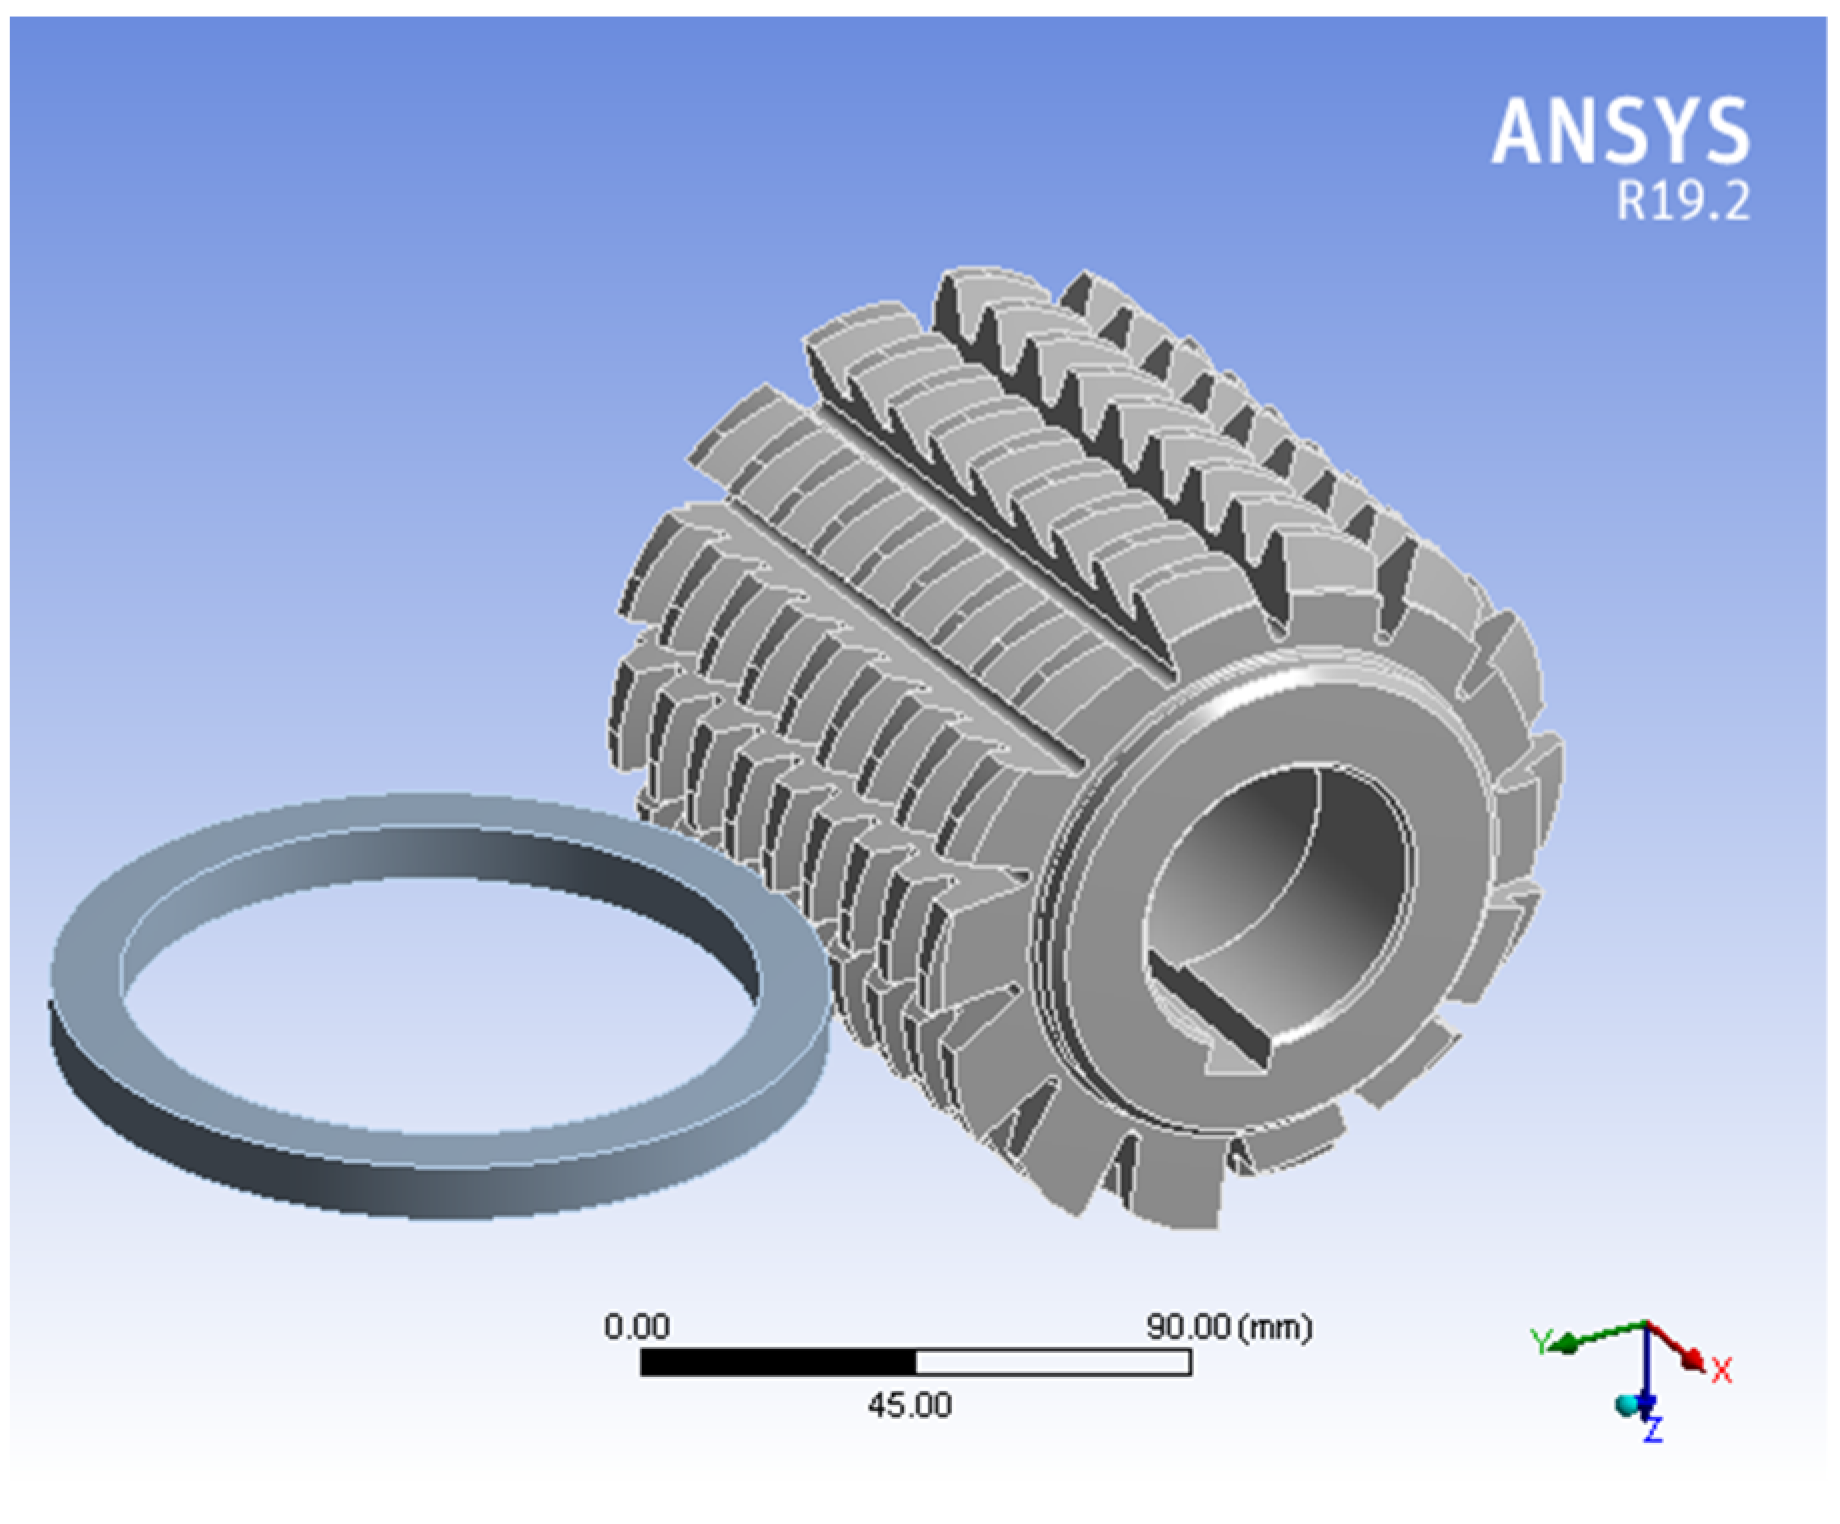
The geometric model of the hob, made with SolidWorks, was imported into ANSYS software. The global reference coordinate system has been attached to the center of mass of the workpiece (Figure 5).
The ANSYS model of the assembly (2 active bodies) was discretized in 733,630 finite elements of the hexahedral type and 492,710 nodes (Figure 6).
In order to simulate the cutting process, the parameters for the interaction between the two bodies were defined.
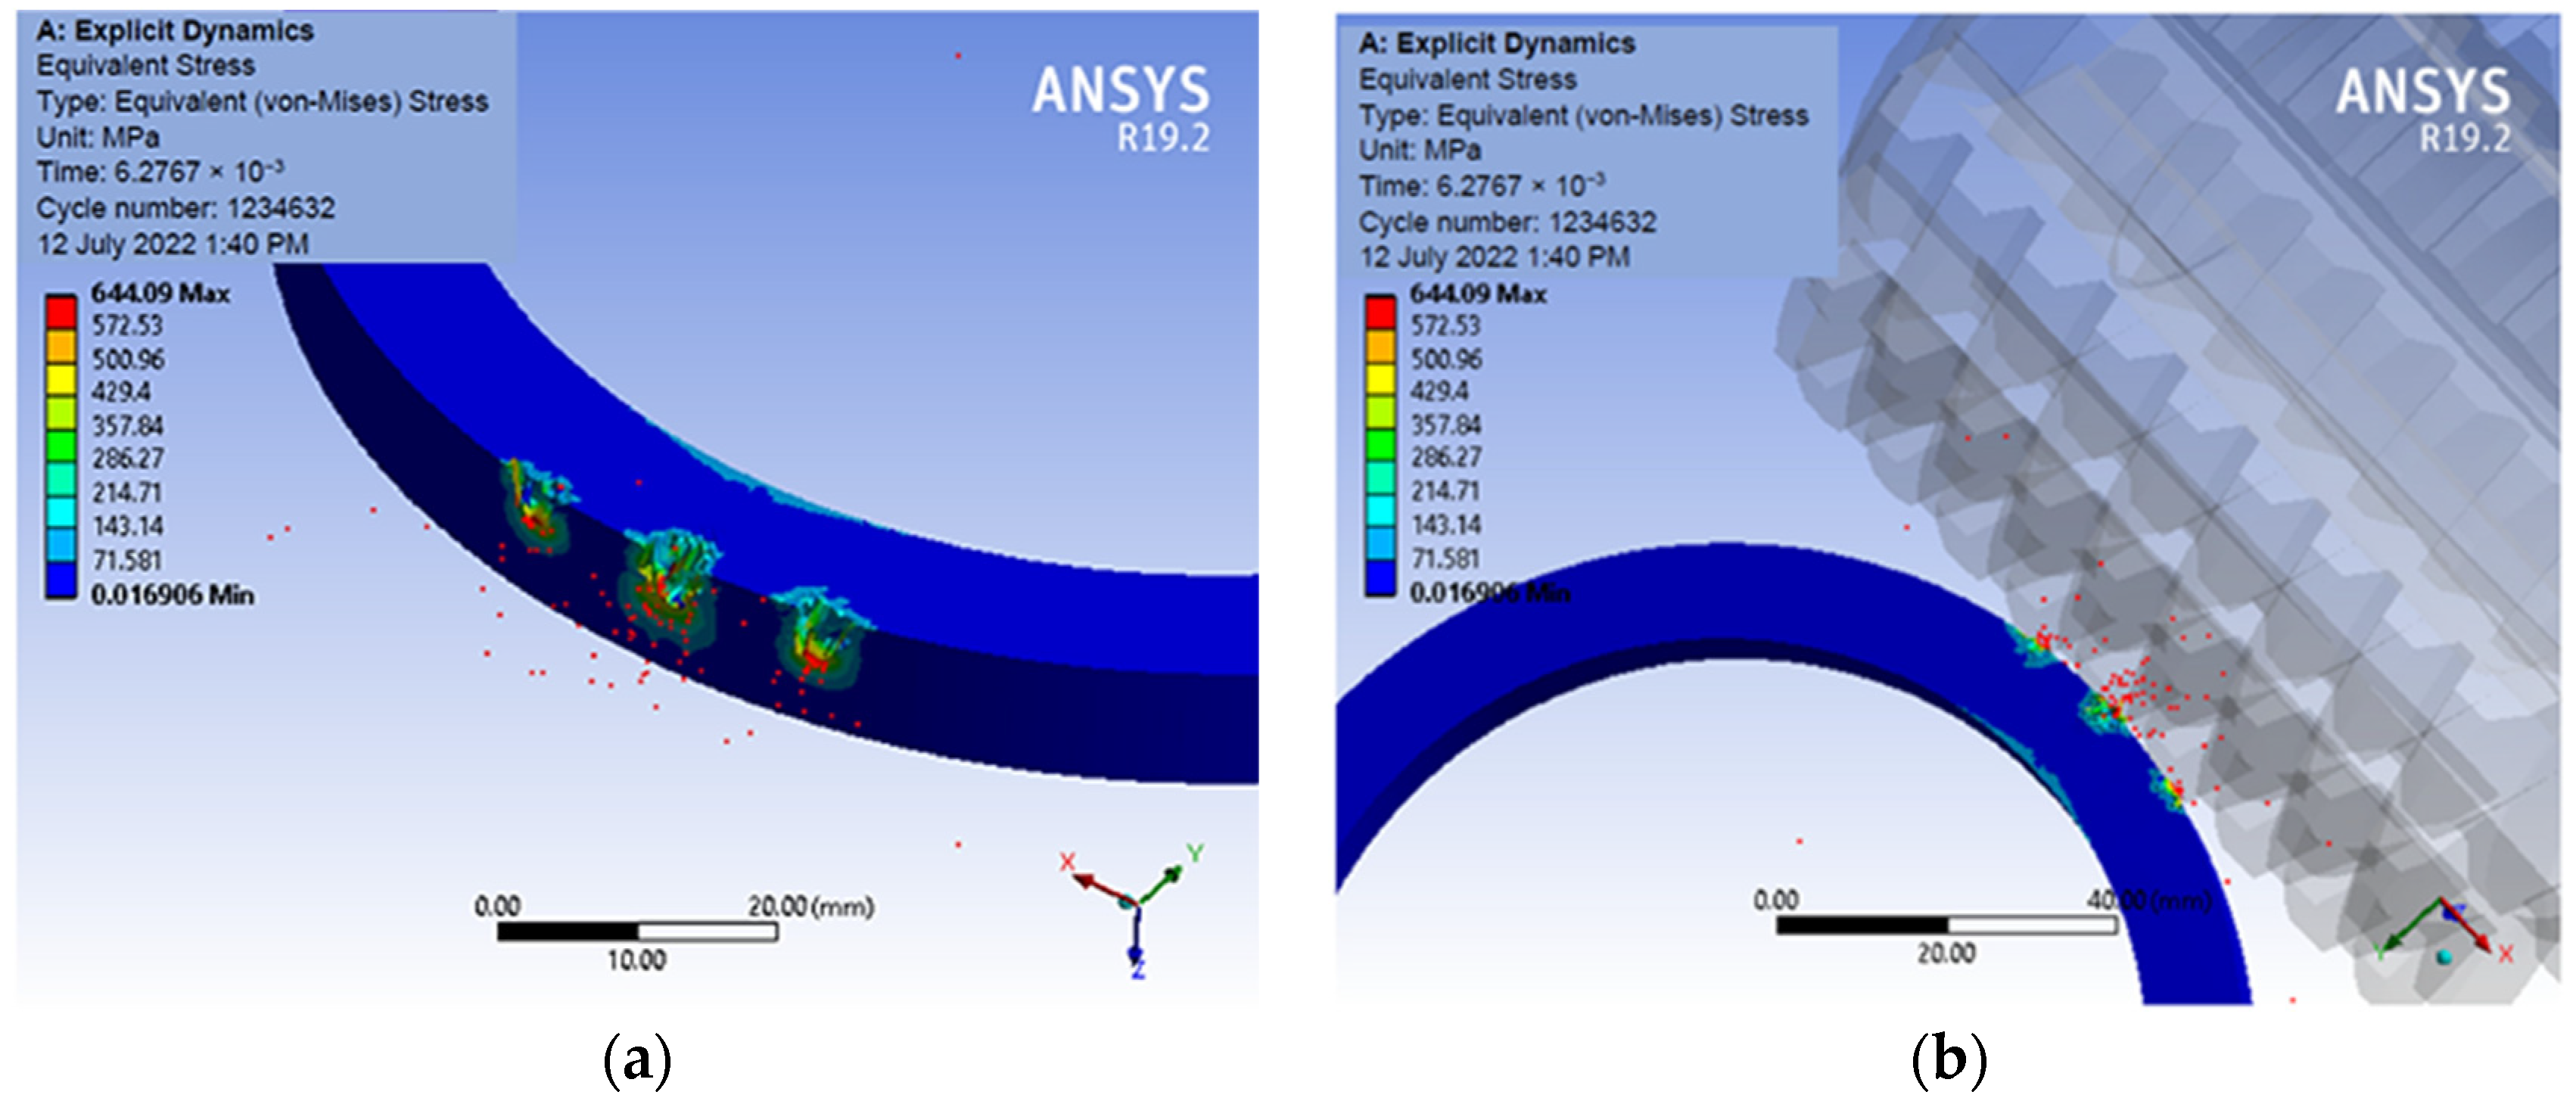
The simulation with the ANSYS Explicit Dynamics module was performed and the obtained results in Figure 7, Figure 8, Figure 9 and Figure 10 are presented.
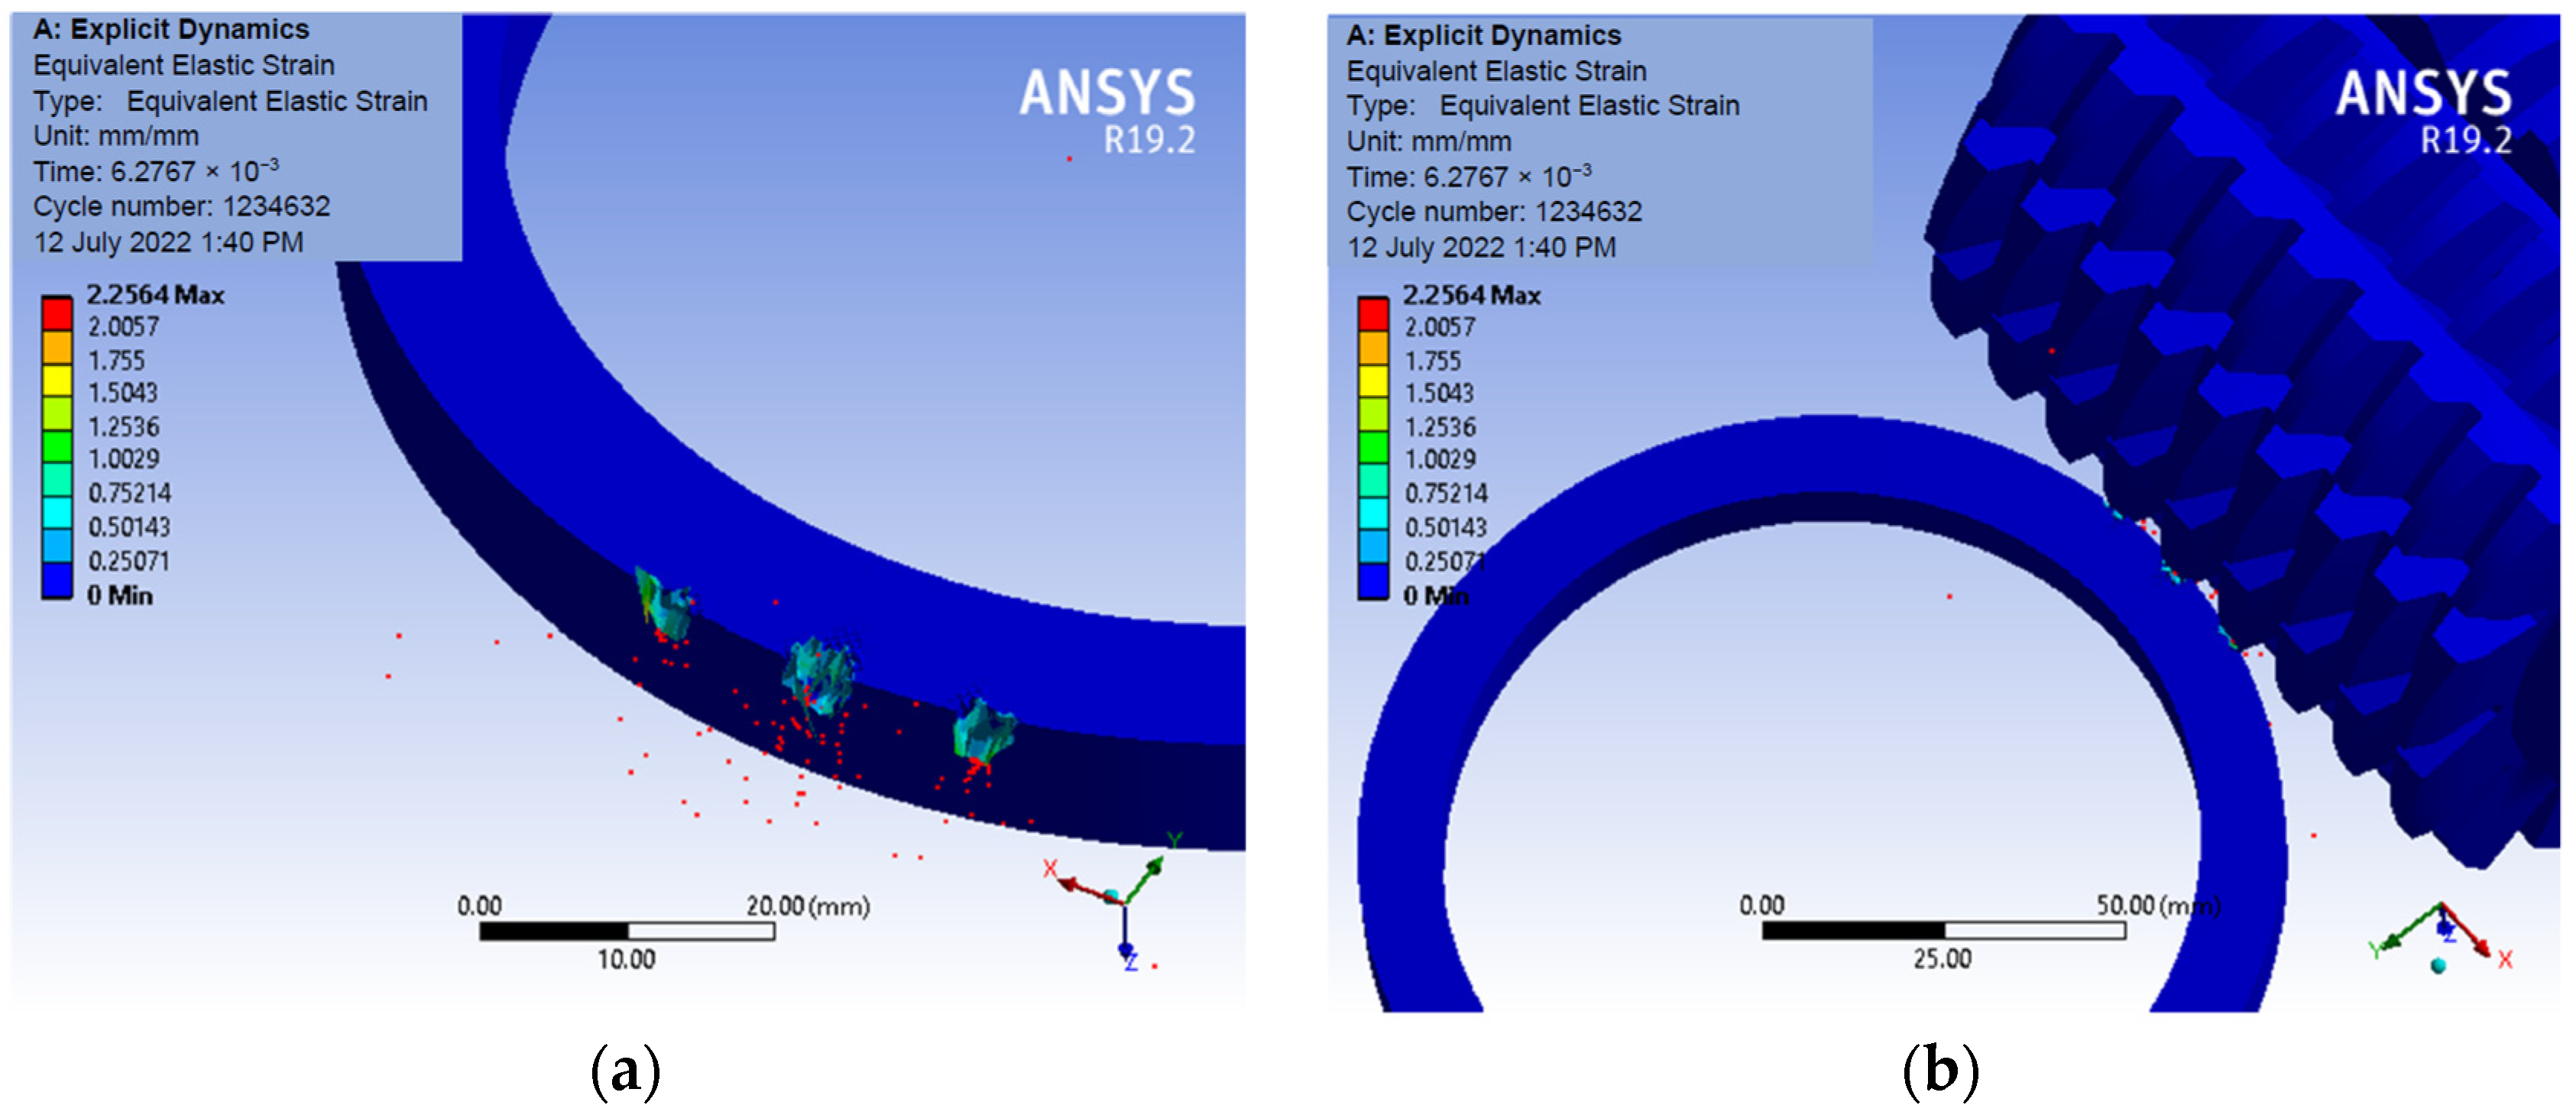
Figure 10 shows the distribution maps for the equivalent mechanical stresses that appear in the cutting area.
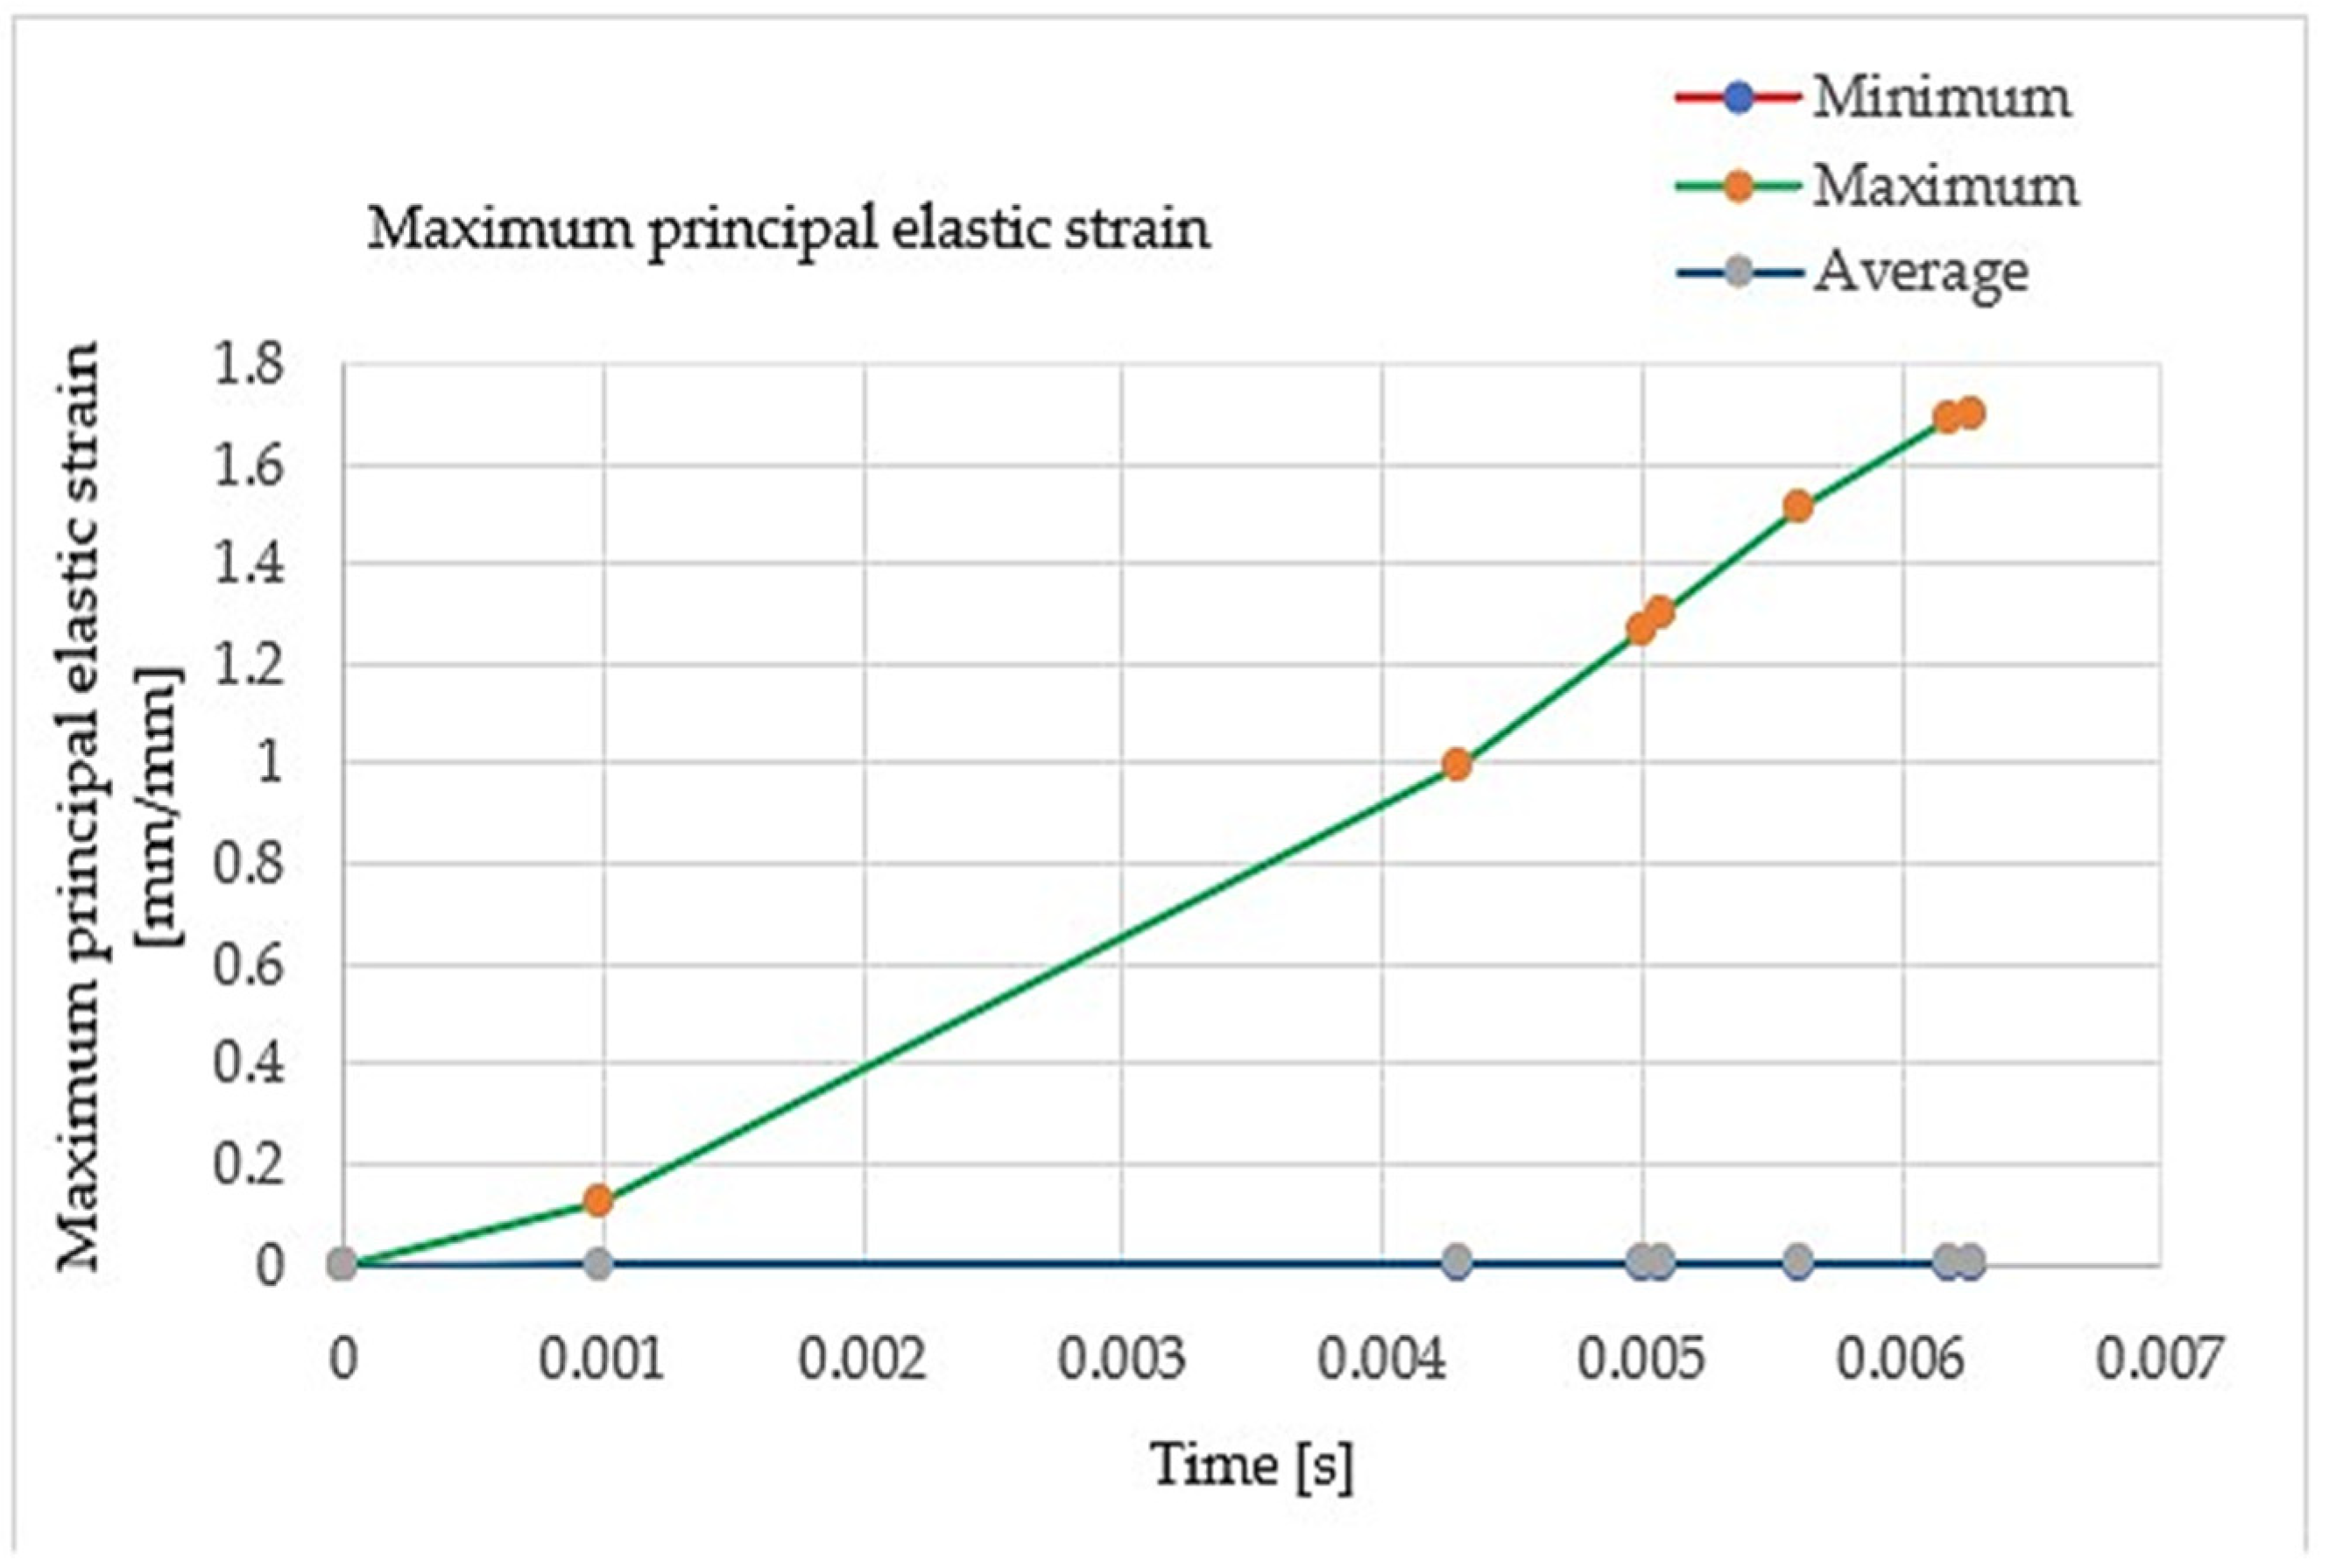
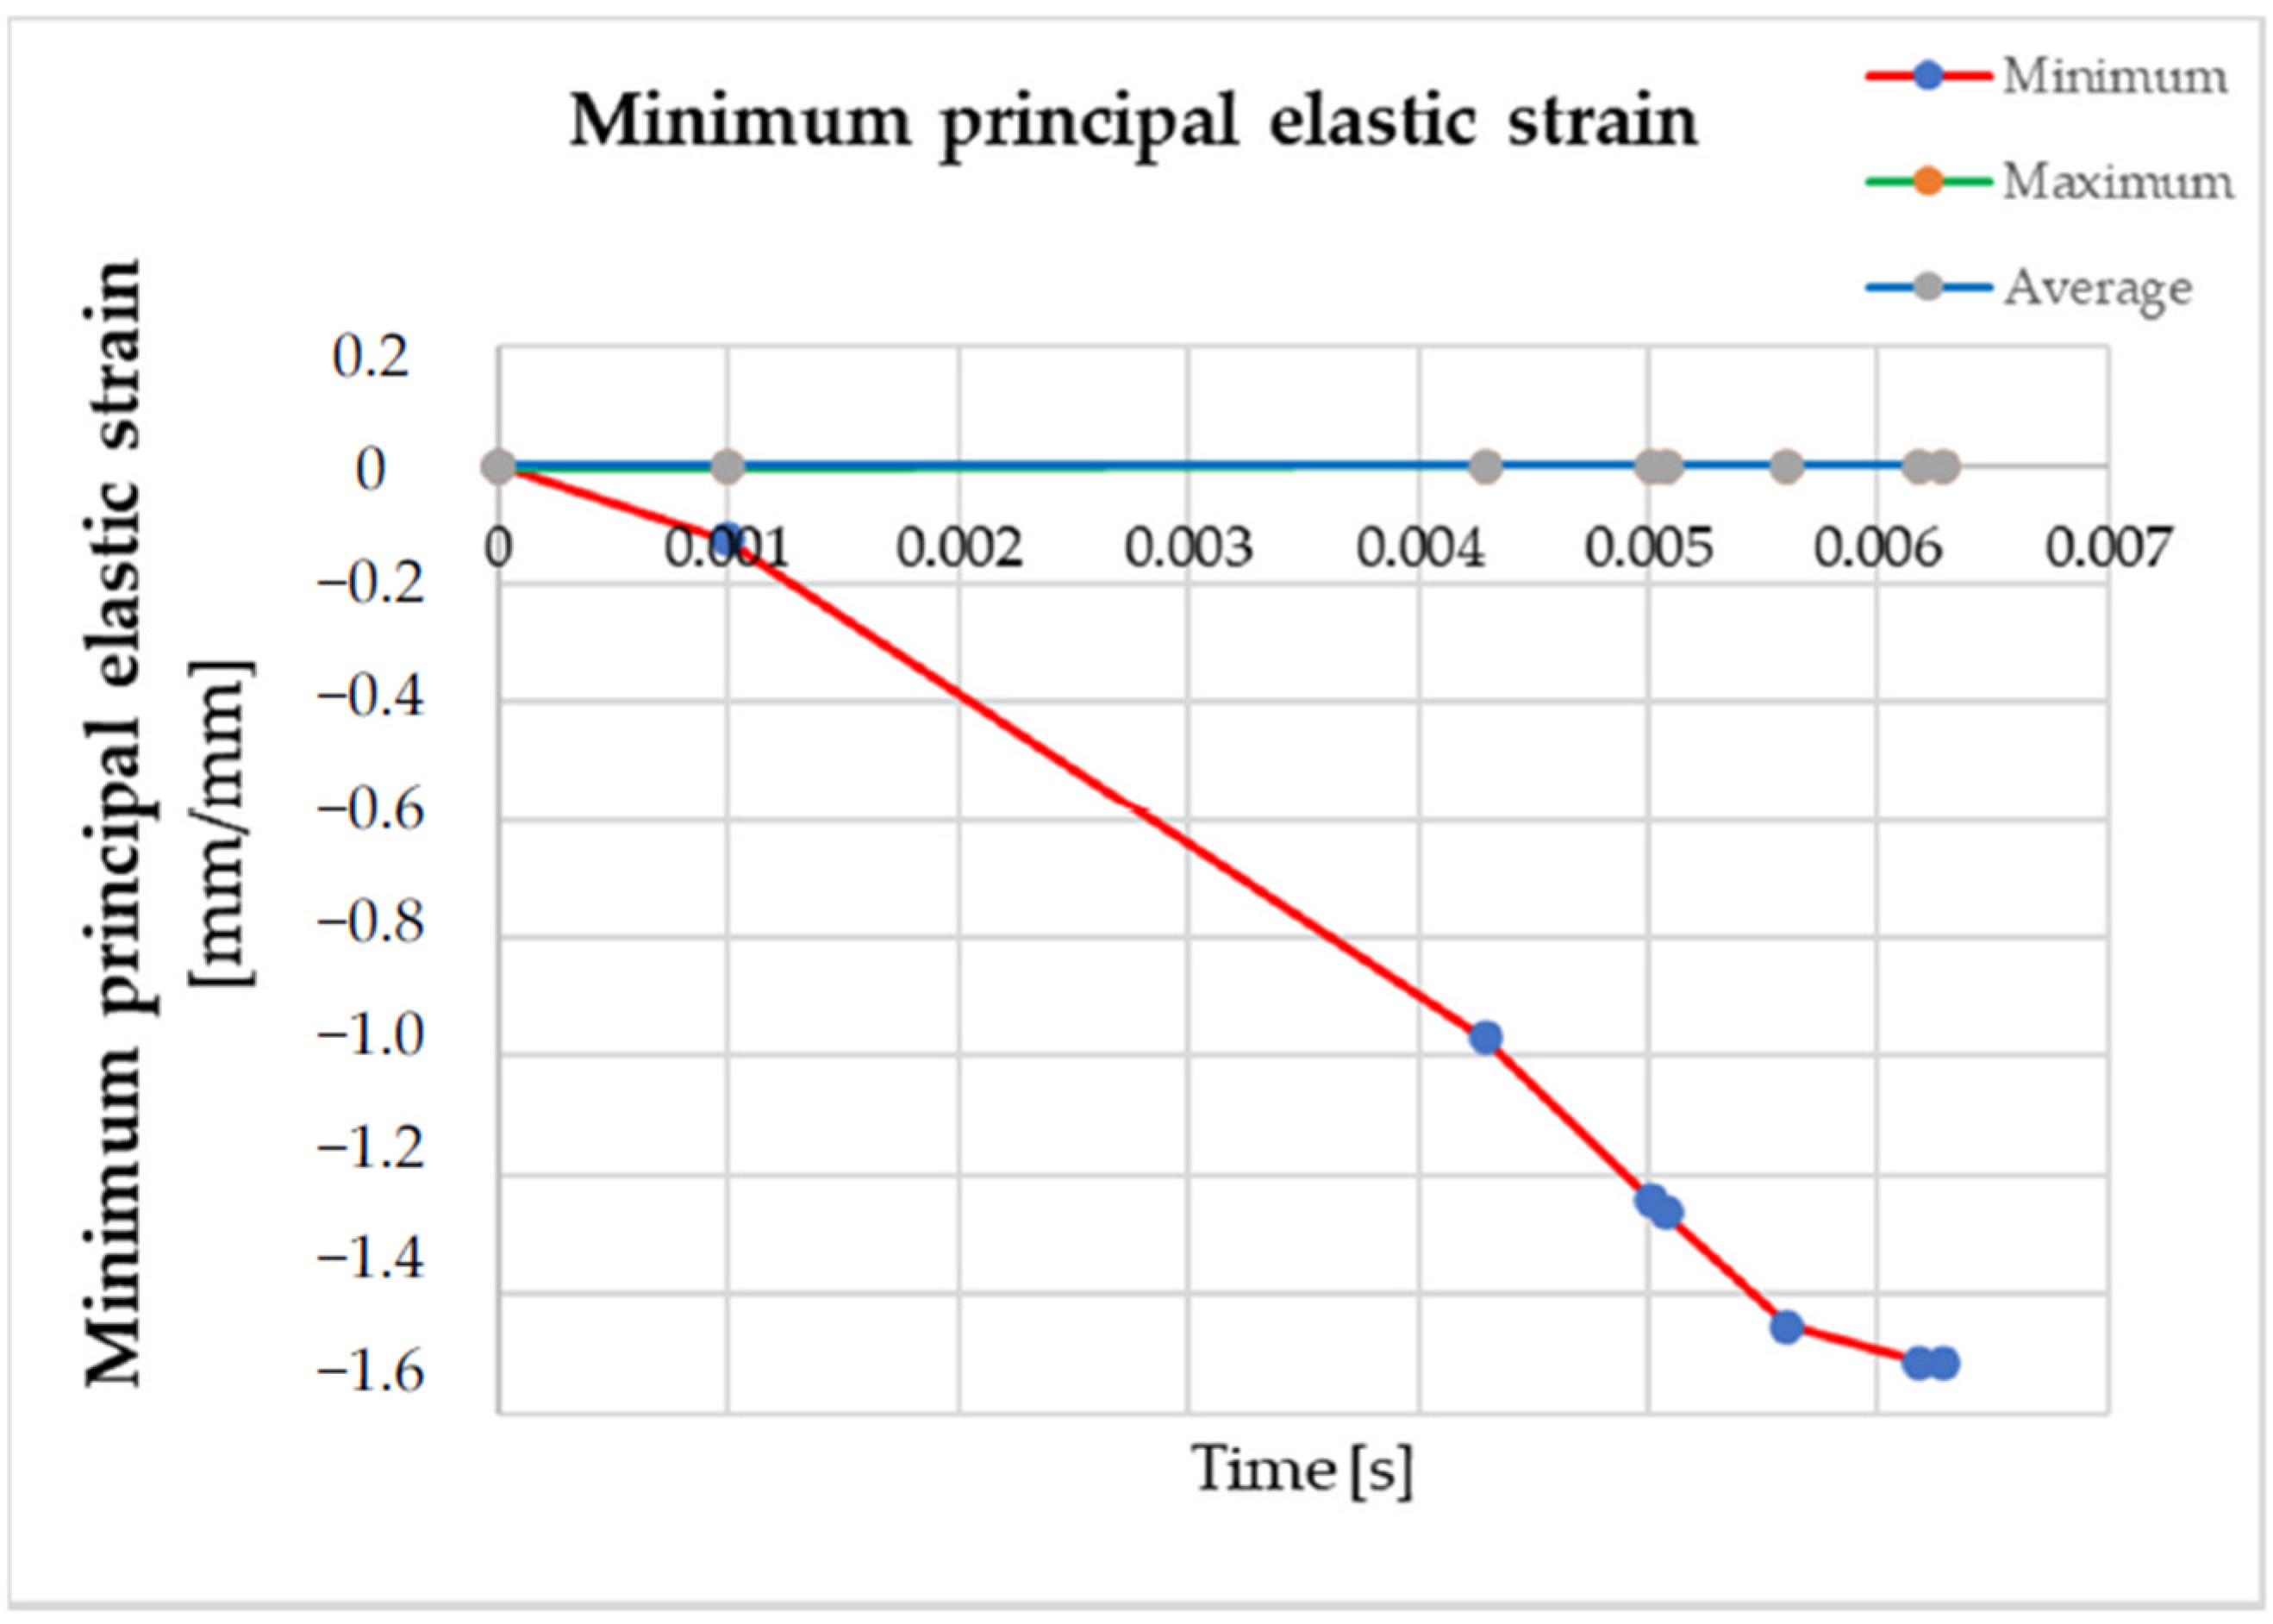
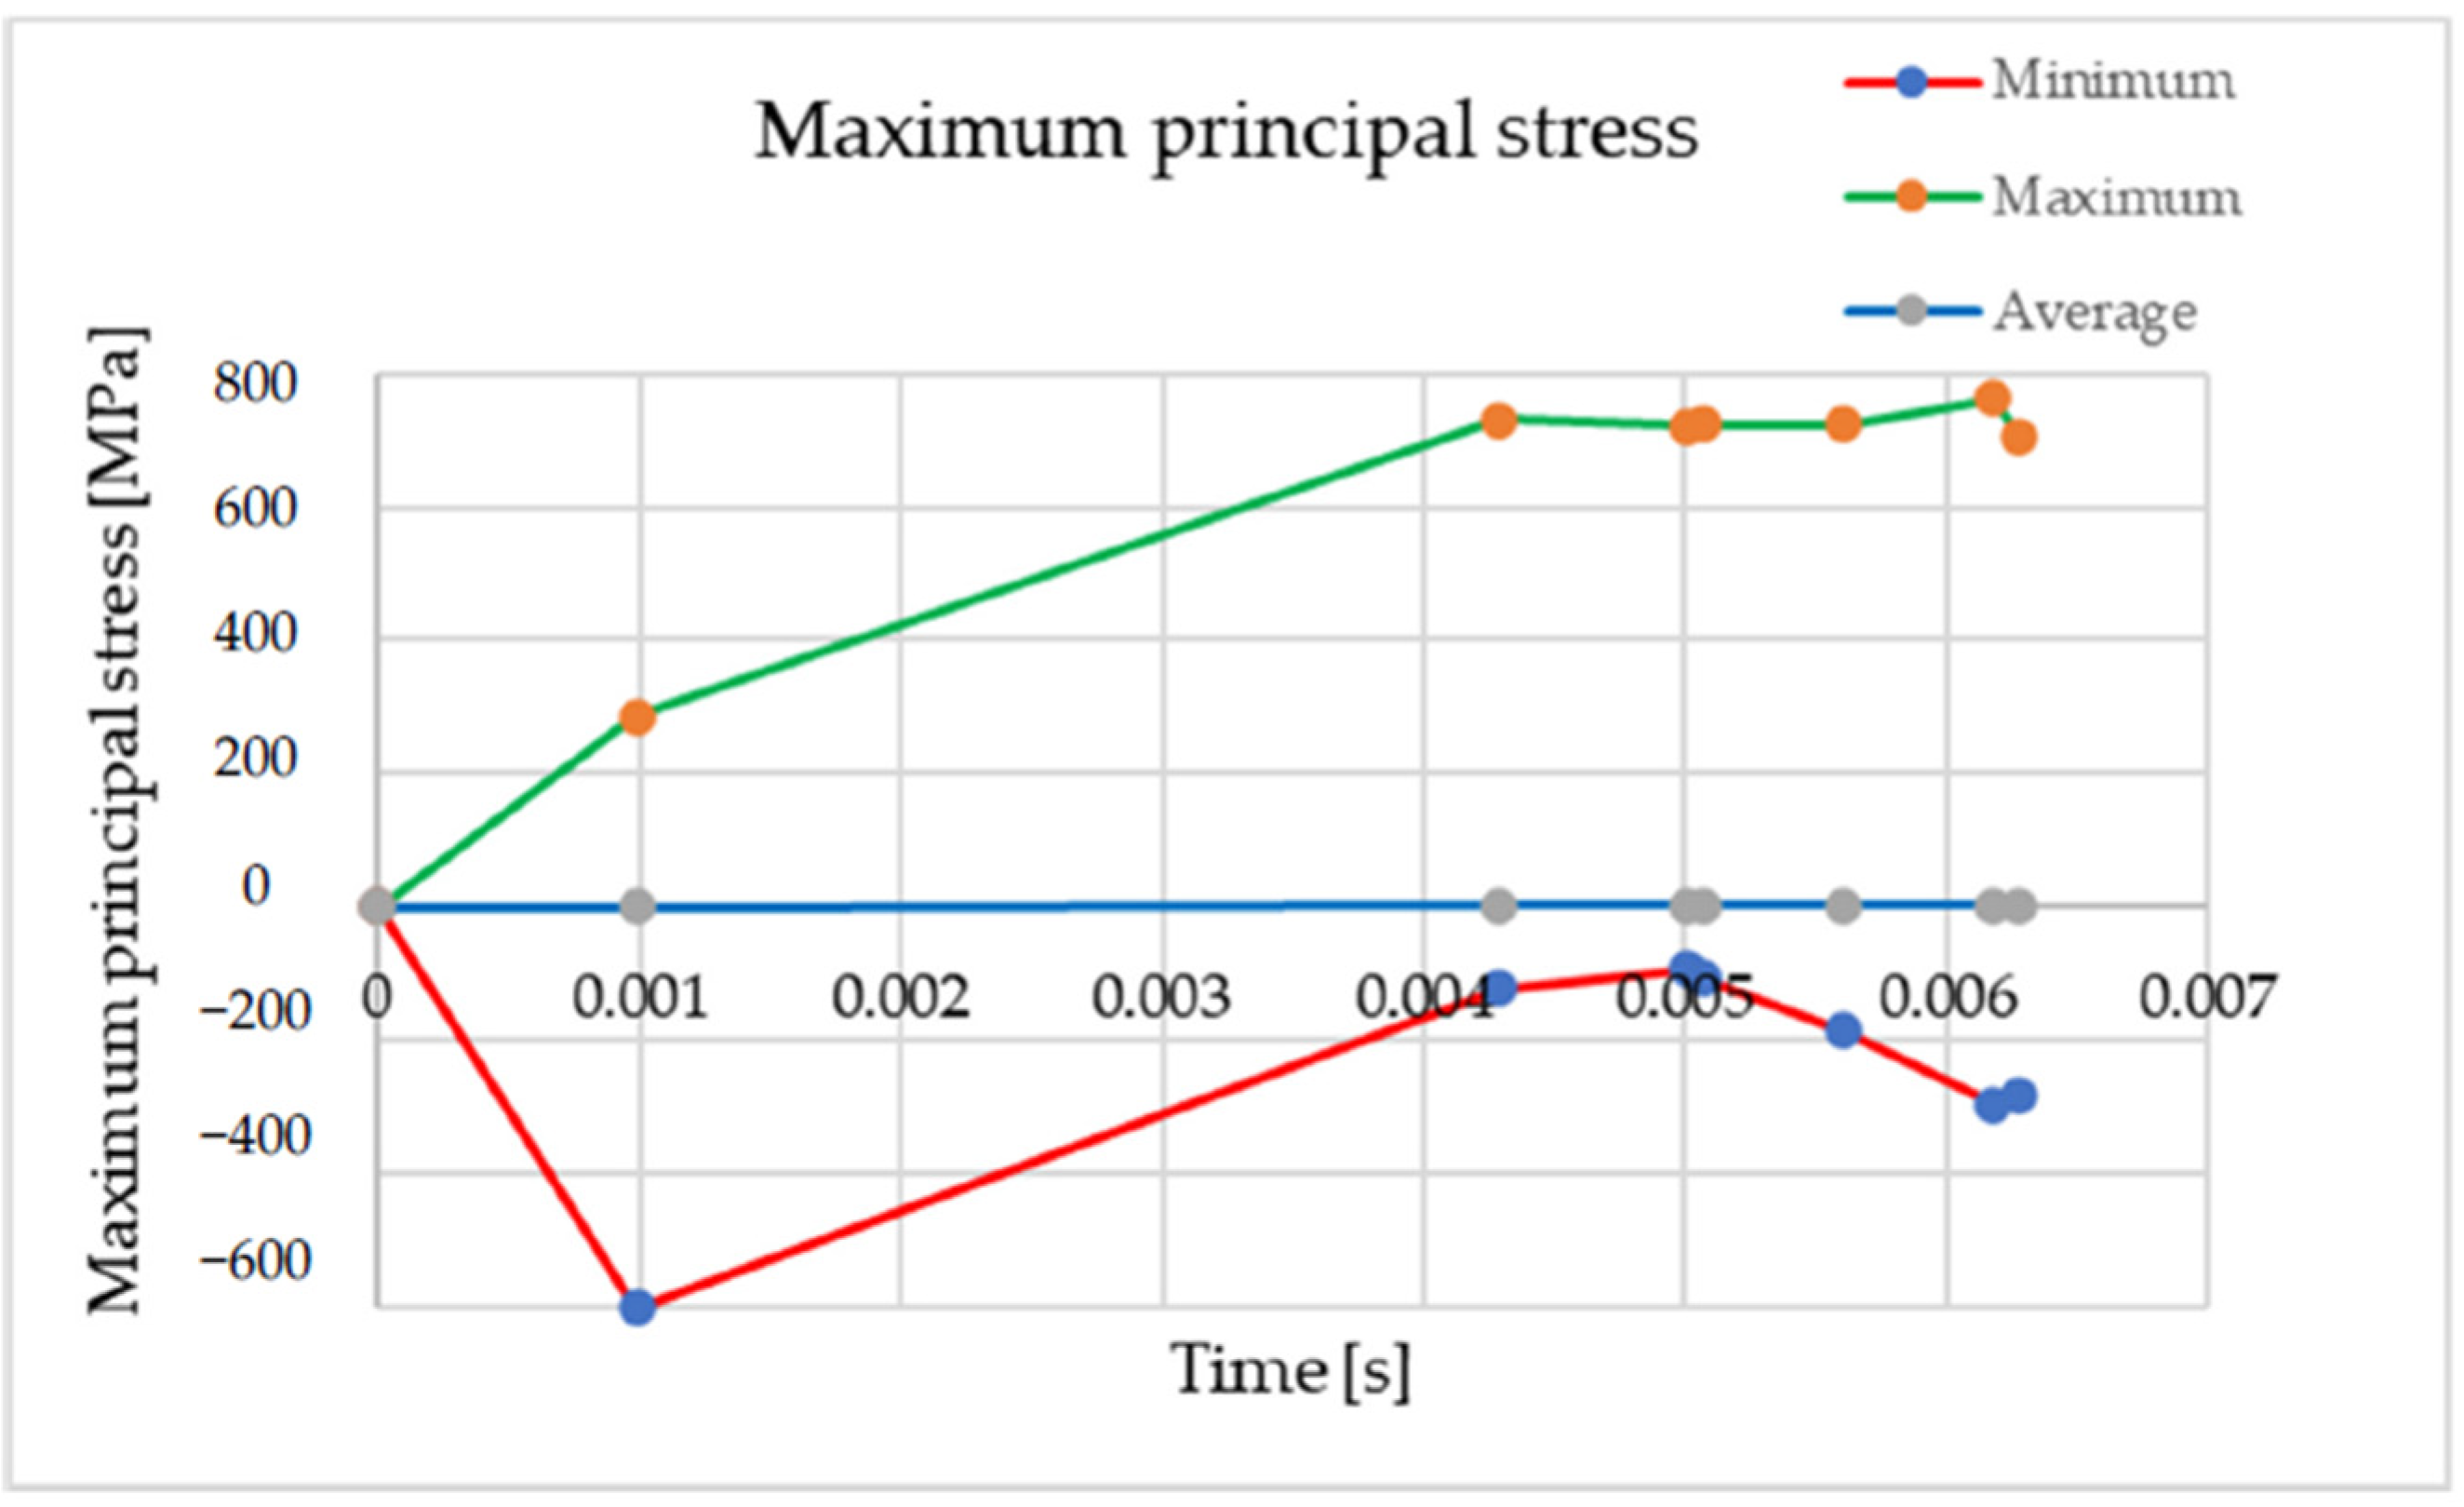
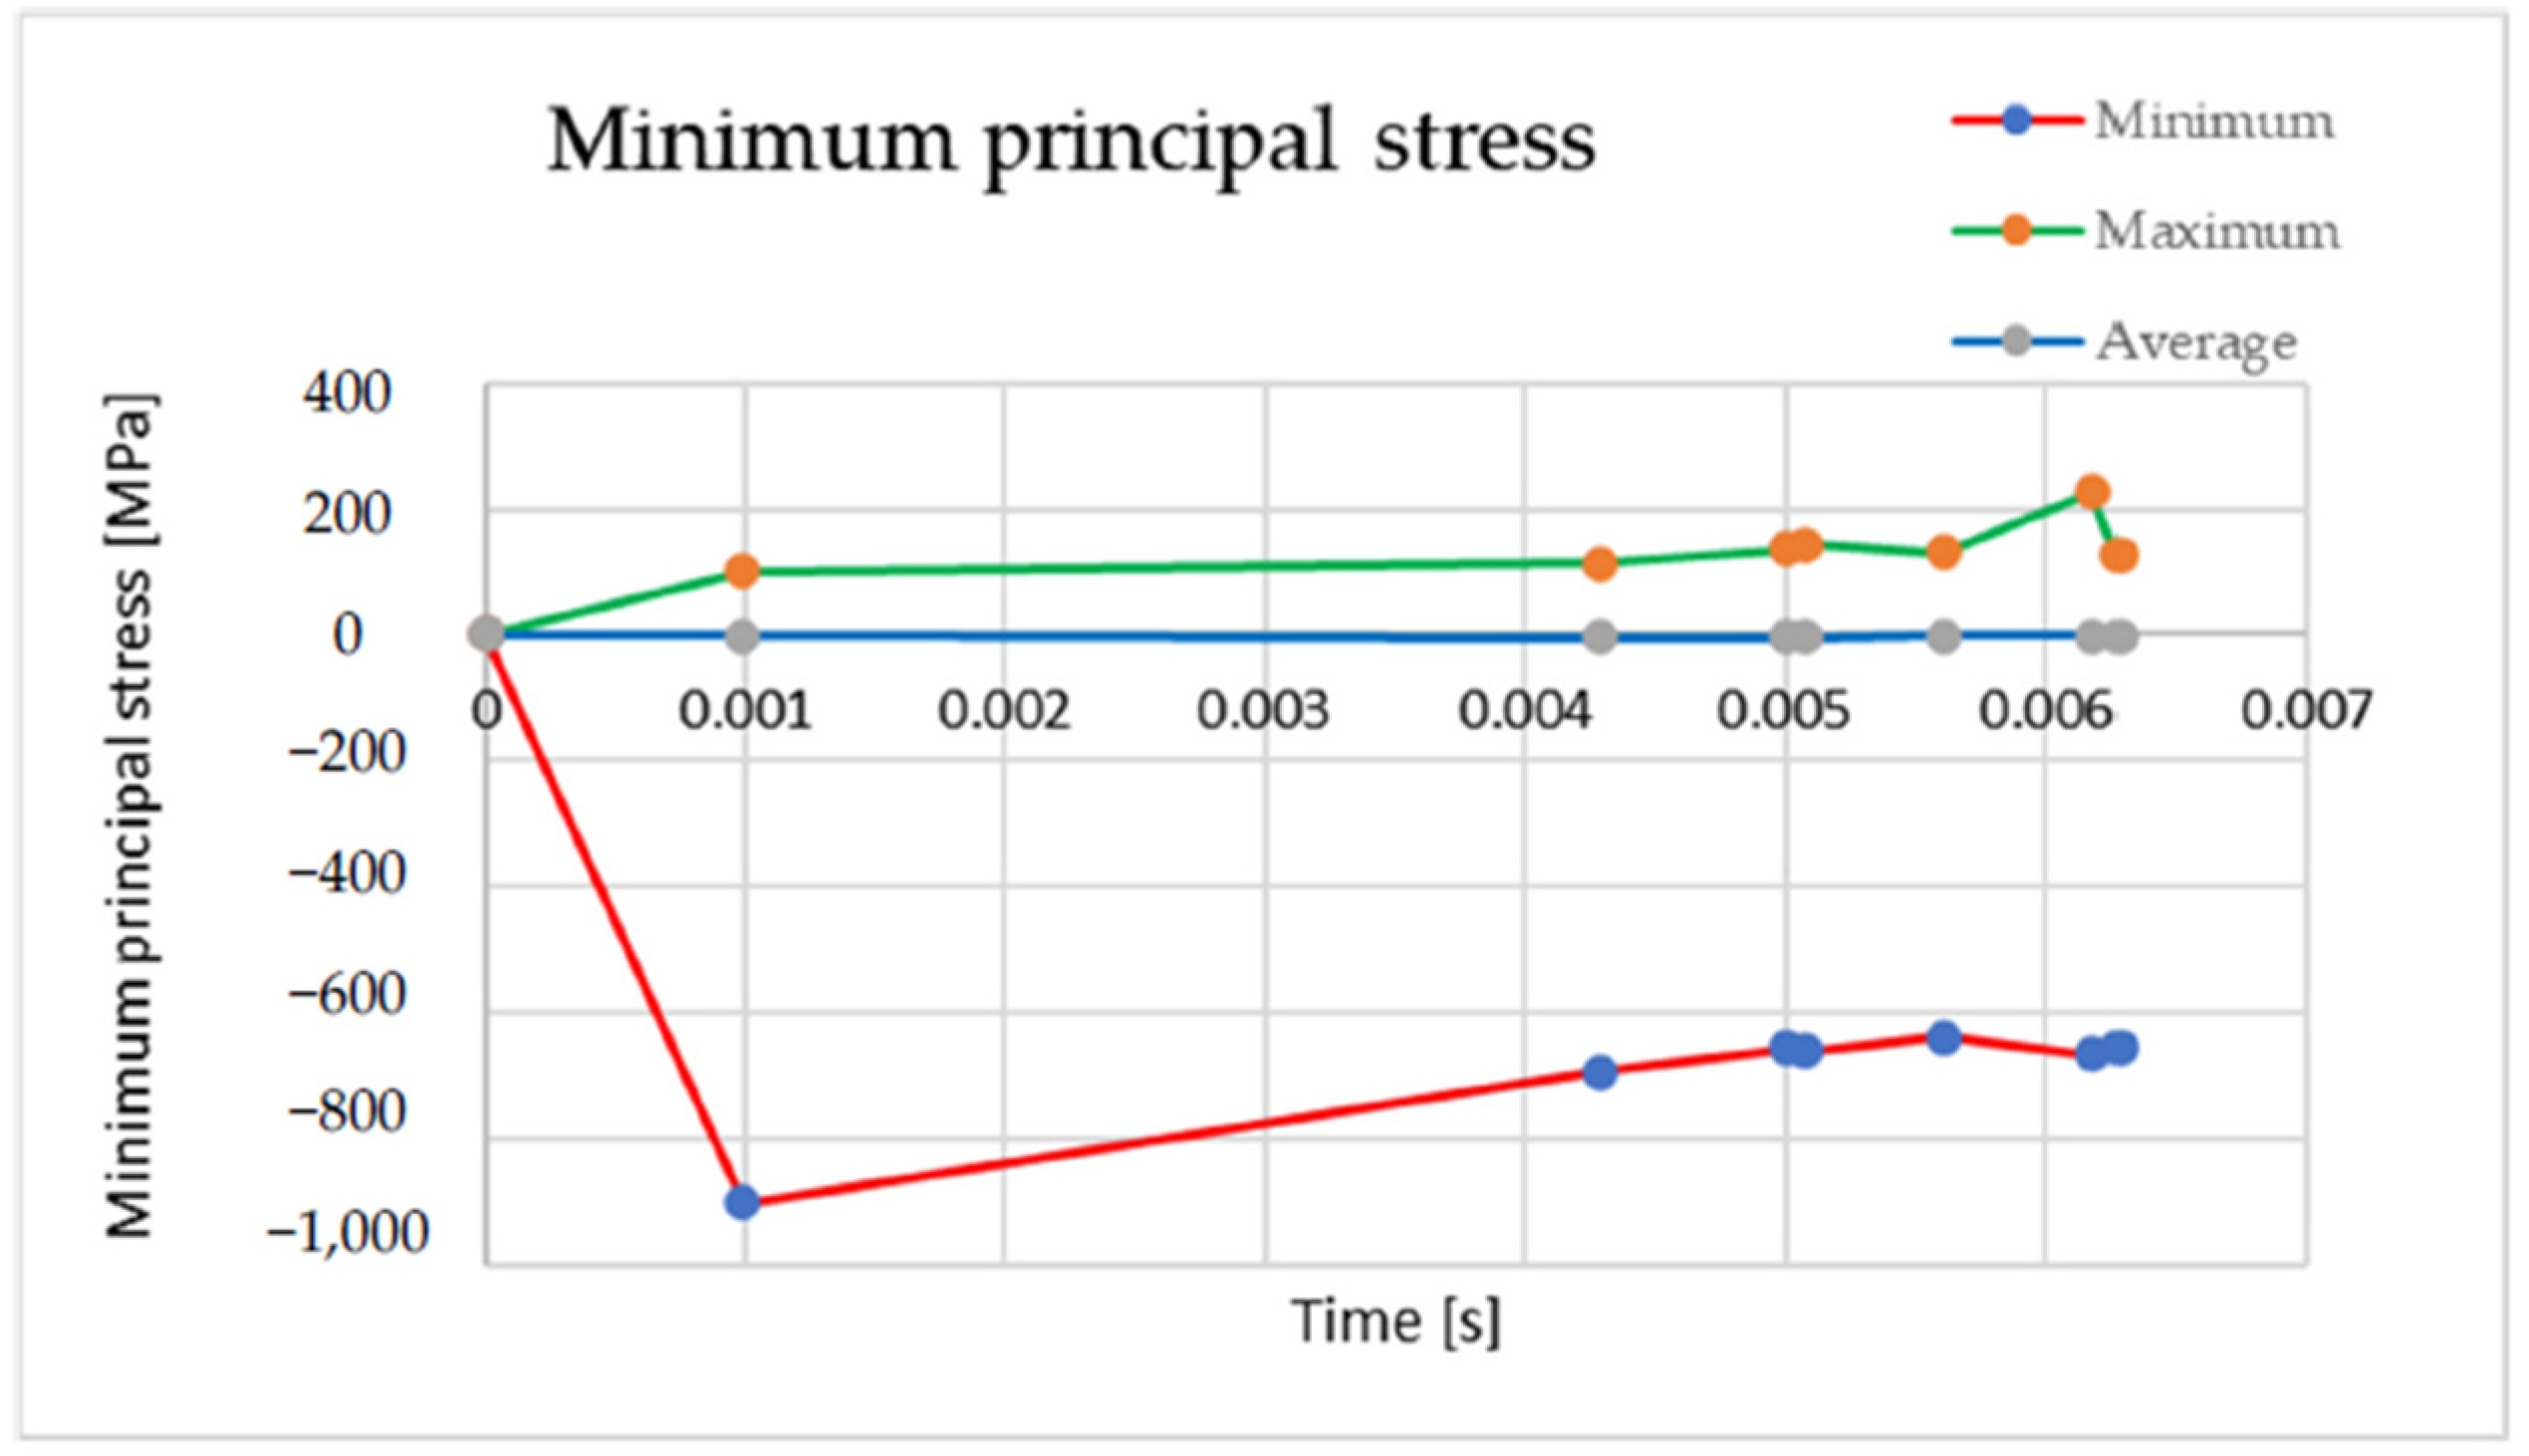
The numerical results over time, during dynamic simulation, are presented in Table 4, Table 5, Table 6, Table 7, Table 8 and Table 9, and the corresponding diagrams are shown in Figure 11, Figure 12, Figure 13, Figure 14, Figure 15 and Figure 16.
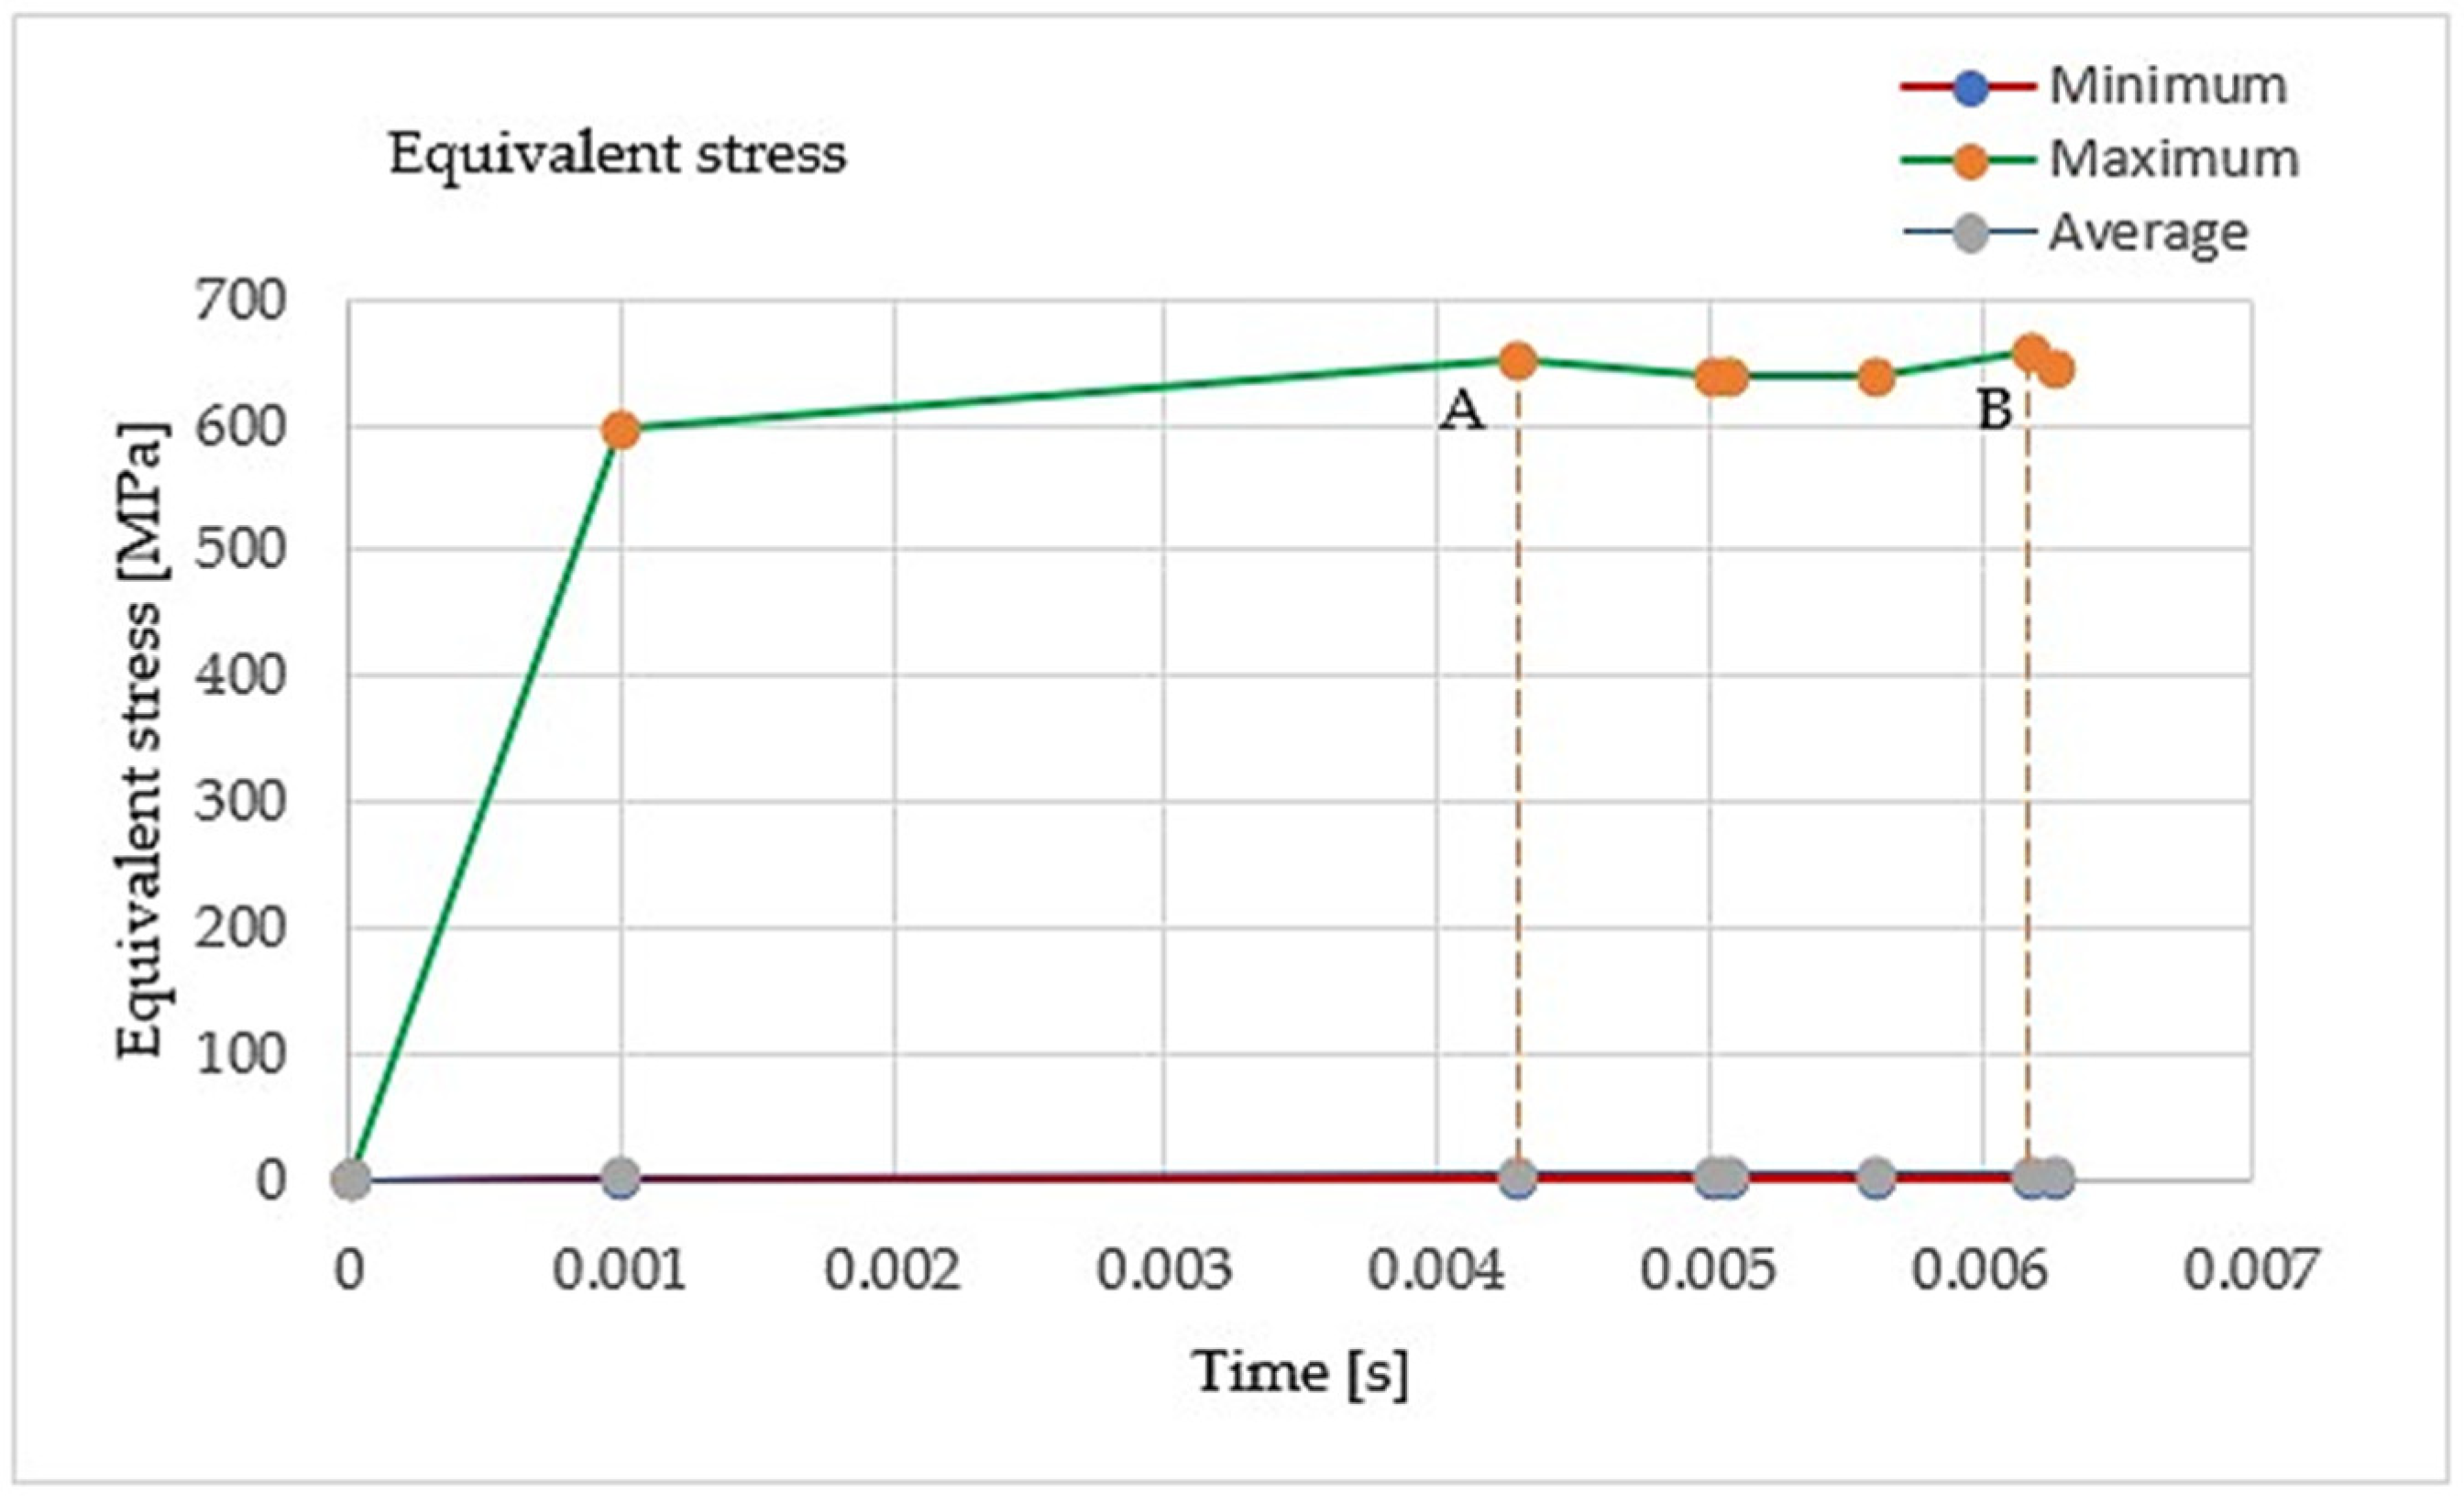
From the diagram of the equivalent stress, as well as from Table 5, its evolution can be observed until the moment the chips break. For the material of the workpiece studied, C 45, the standard indicates the mechanical characteristics with the minimum breaking strength of Rm = 610 MPa. After running the ANSYS program for the processing time interval of 6.2767 × 10⁻³ s, points A and B were marked in the von Mises equivalent stress diagram (Figure 12); these correspond to the moments when the chips were detached from the workpiece, A (4.2896 × 10⁻³ s, 651.79 MPa) and B (6.1808 × 10⁻³ s, 656.97 MPa).
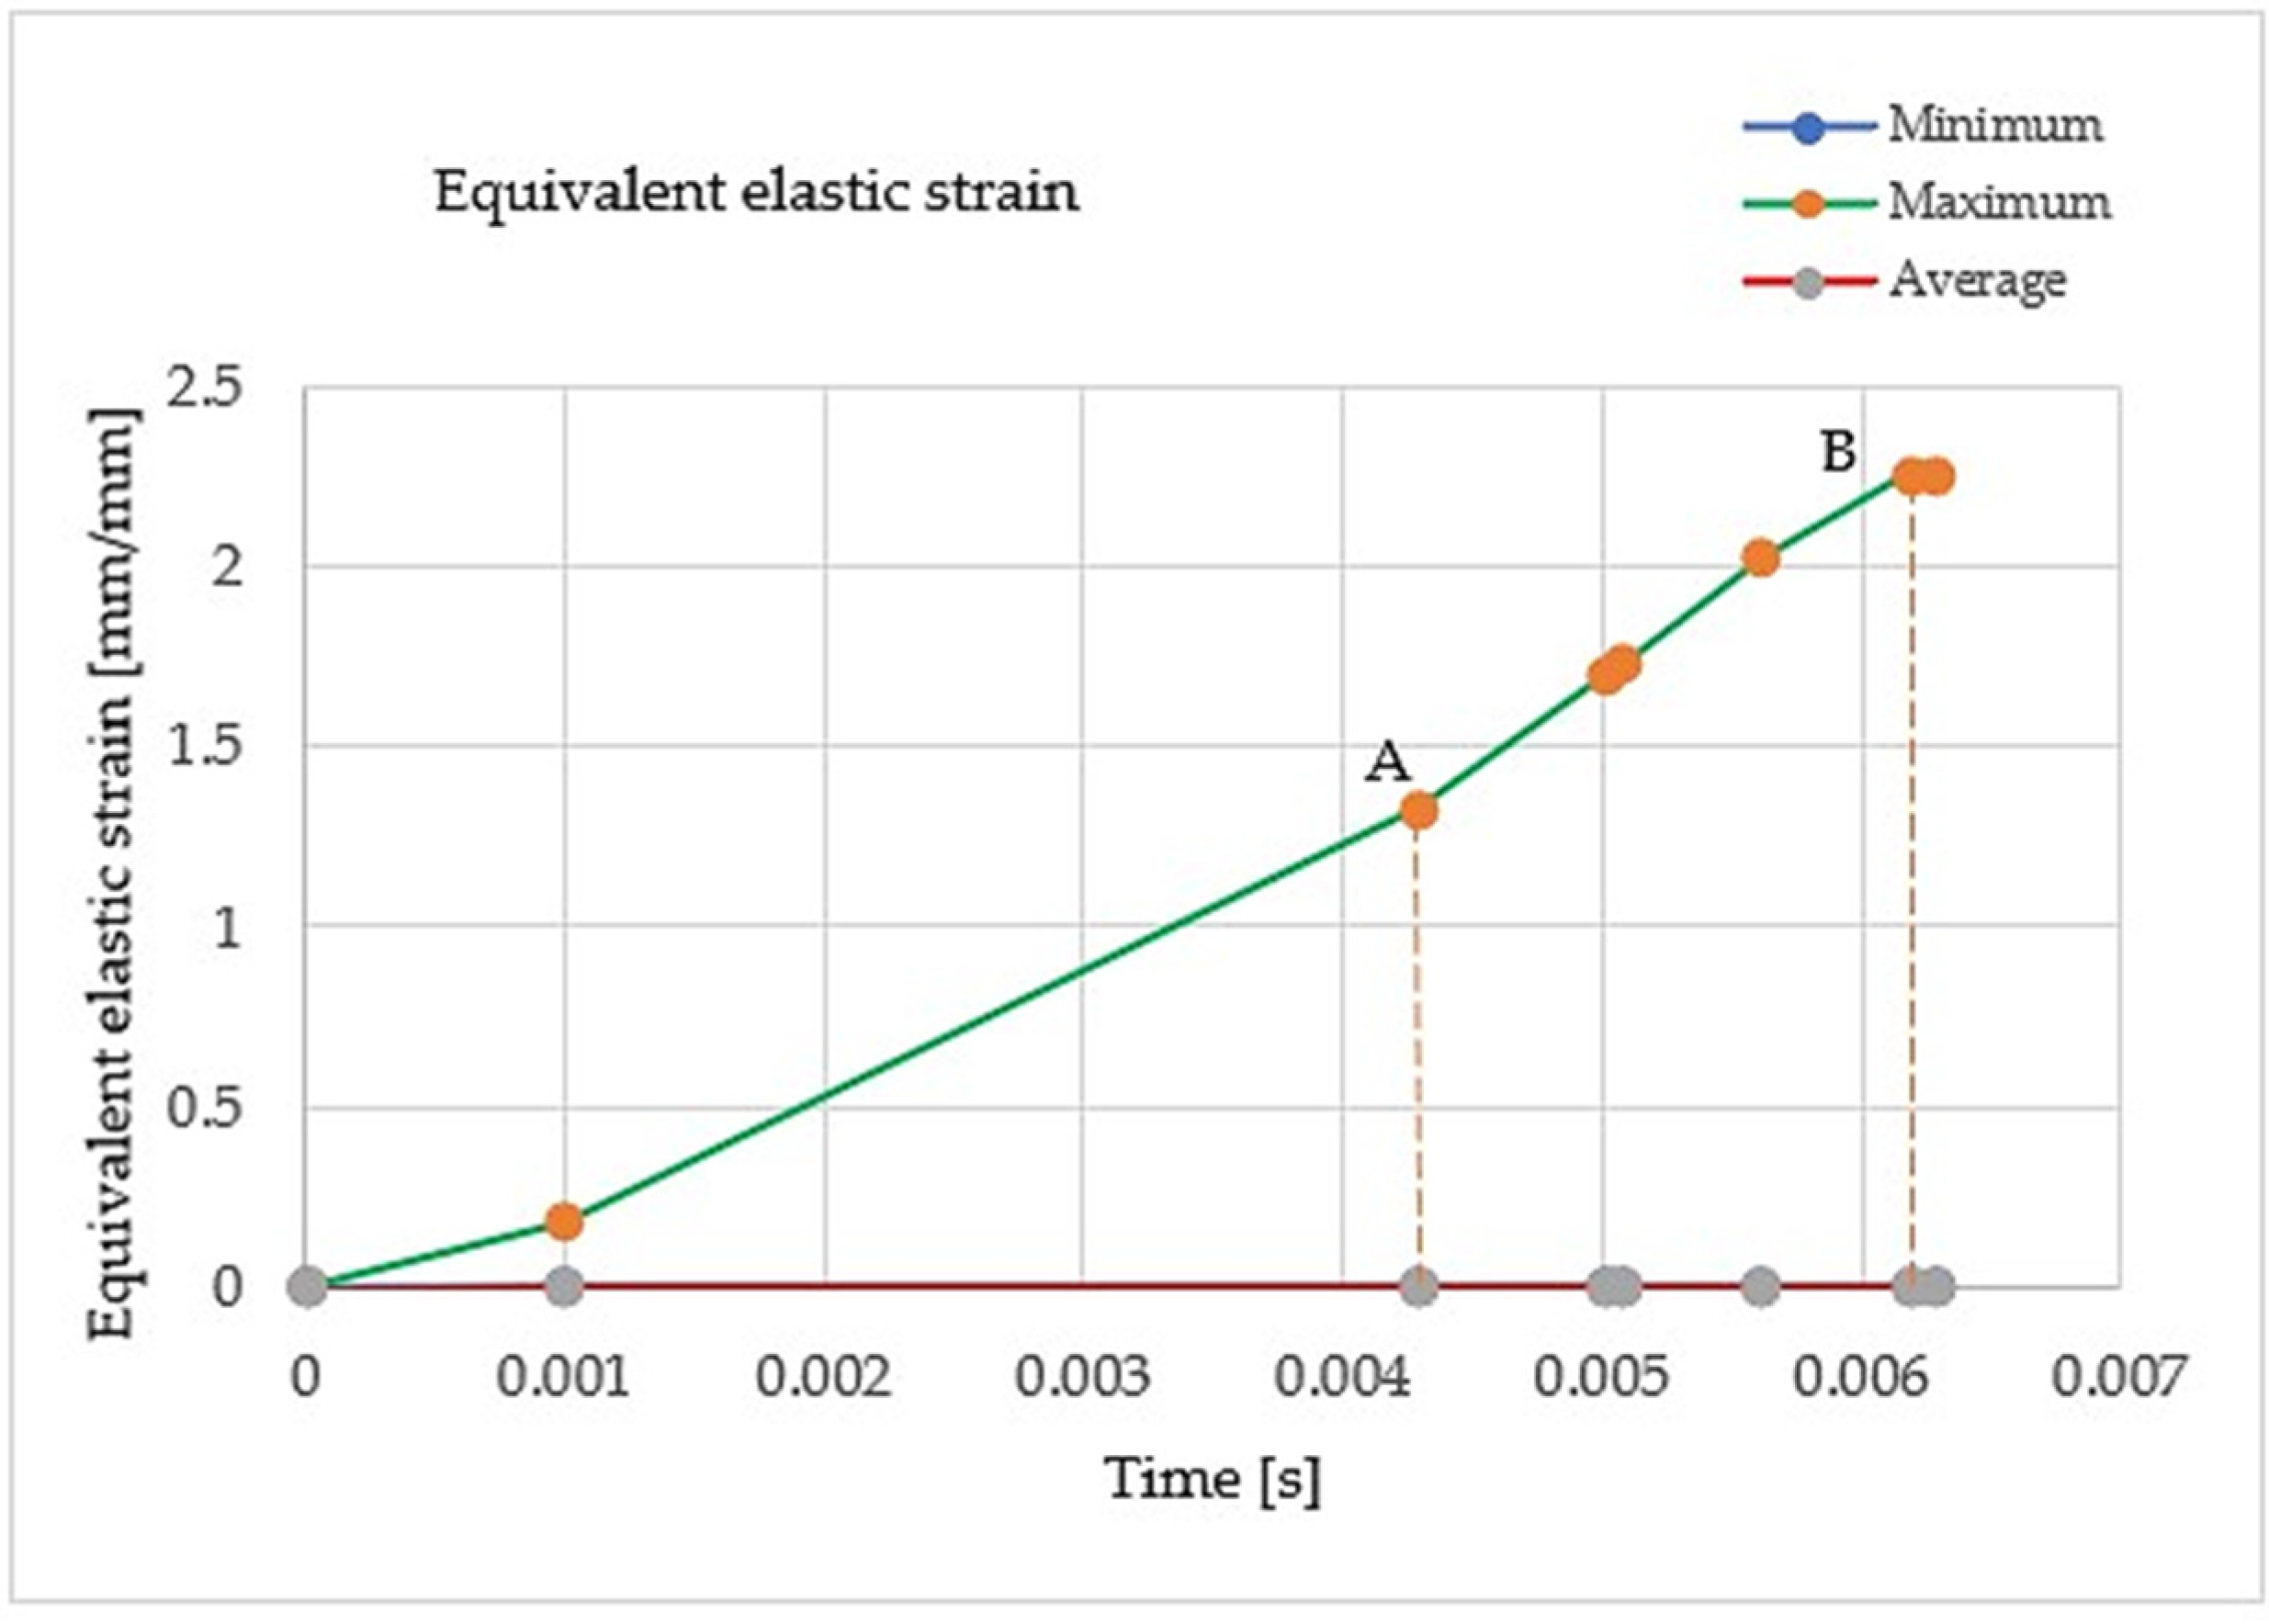
For the moments corresponding to chip detachment, A and B (4.2896 × 10⁻³ s and 6.1808 × 10⁻³ s, respectively), the equivalent elastic strains (1.3295 mm/mm and 2.2548 mm/mm, respectively) in the diagram given in Figure 11 are identified. It can be observed that at the moment of the detachment of the second chip, the equivalent elastic strain increased by 69.59% compared to the previous chip detachment.
Following the evolution of the equivalent elastic strain over time, the increase in elongation can be observed, with an upward slope until the first chip break and a smaller slope before the second chip break (Figure 11).
Since the running time for the whole process is very large, the simulation was stopped after separating the two chips.
During the milling process, from the moment t = 0 until the moment t = 6.2767 × 10⁻³ of stopping the ANSYS simulation, there was an increase in the maximum principal elastic strain, ε1, simultaneously with the increase in the absolute value of the minimum principal elastic strain, ε3, on the perpendicular axis (Figure 13 and Table 6, respectively, and Figure 14 and Table 7, respectively). The mechanical stress is a complex one, and a relative equality in the absolute value of the average slope of the two diagrams is observed.
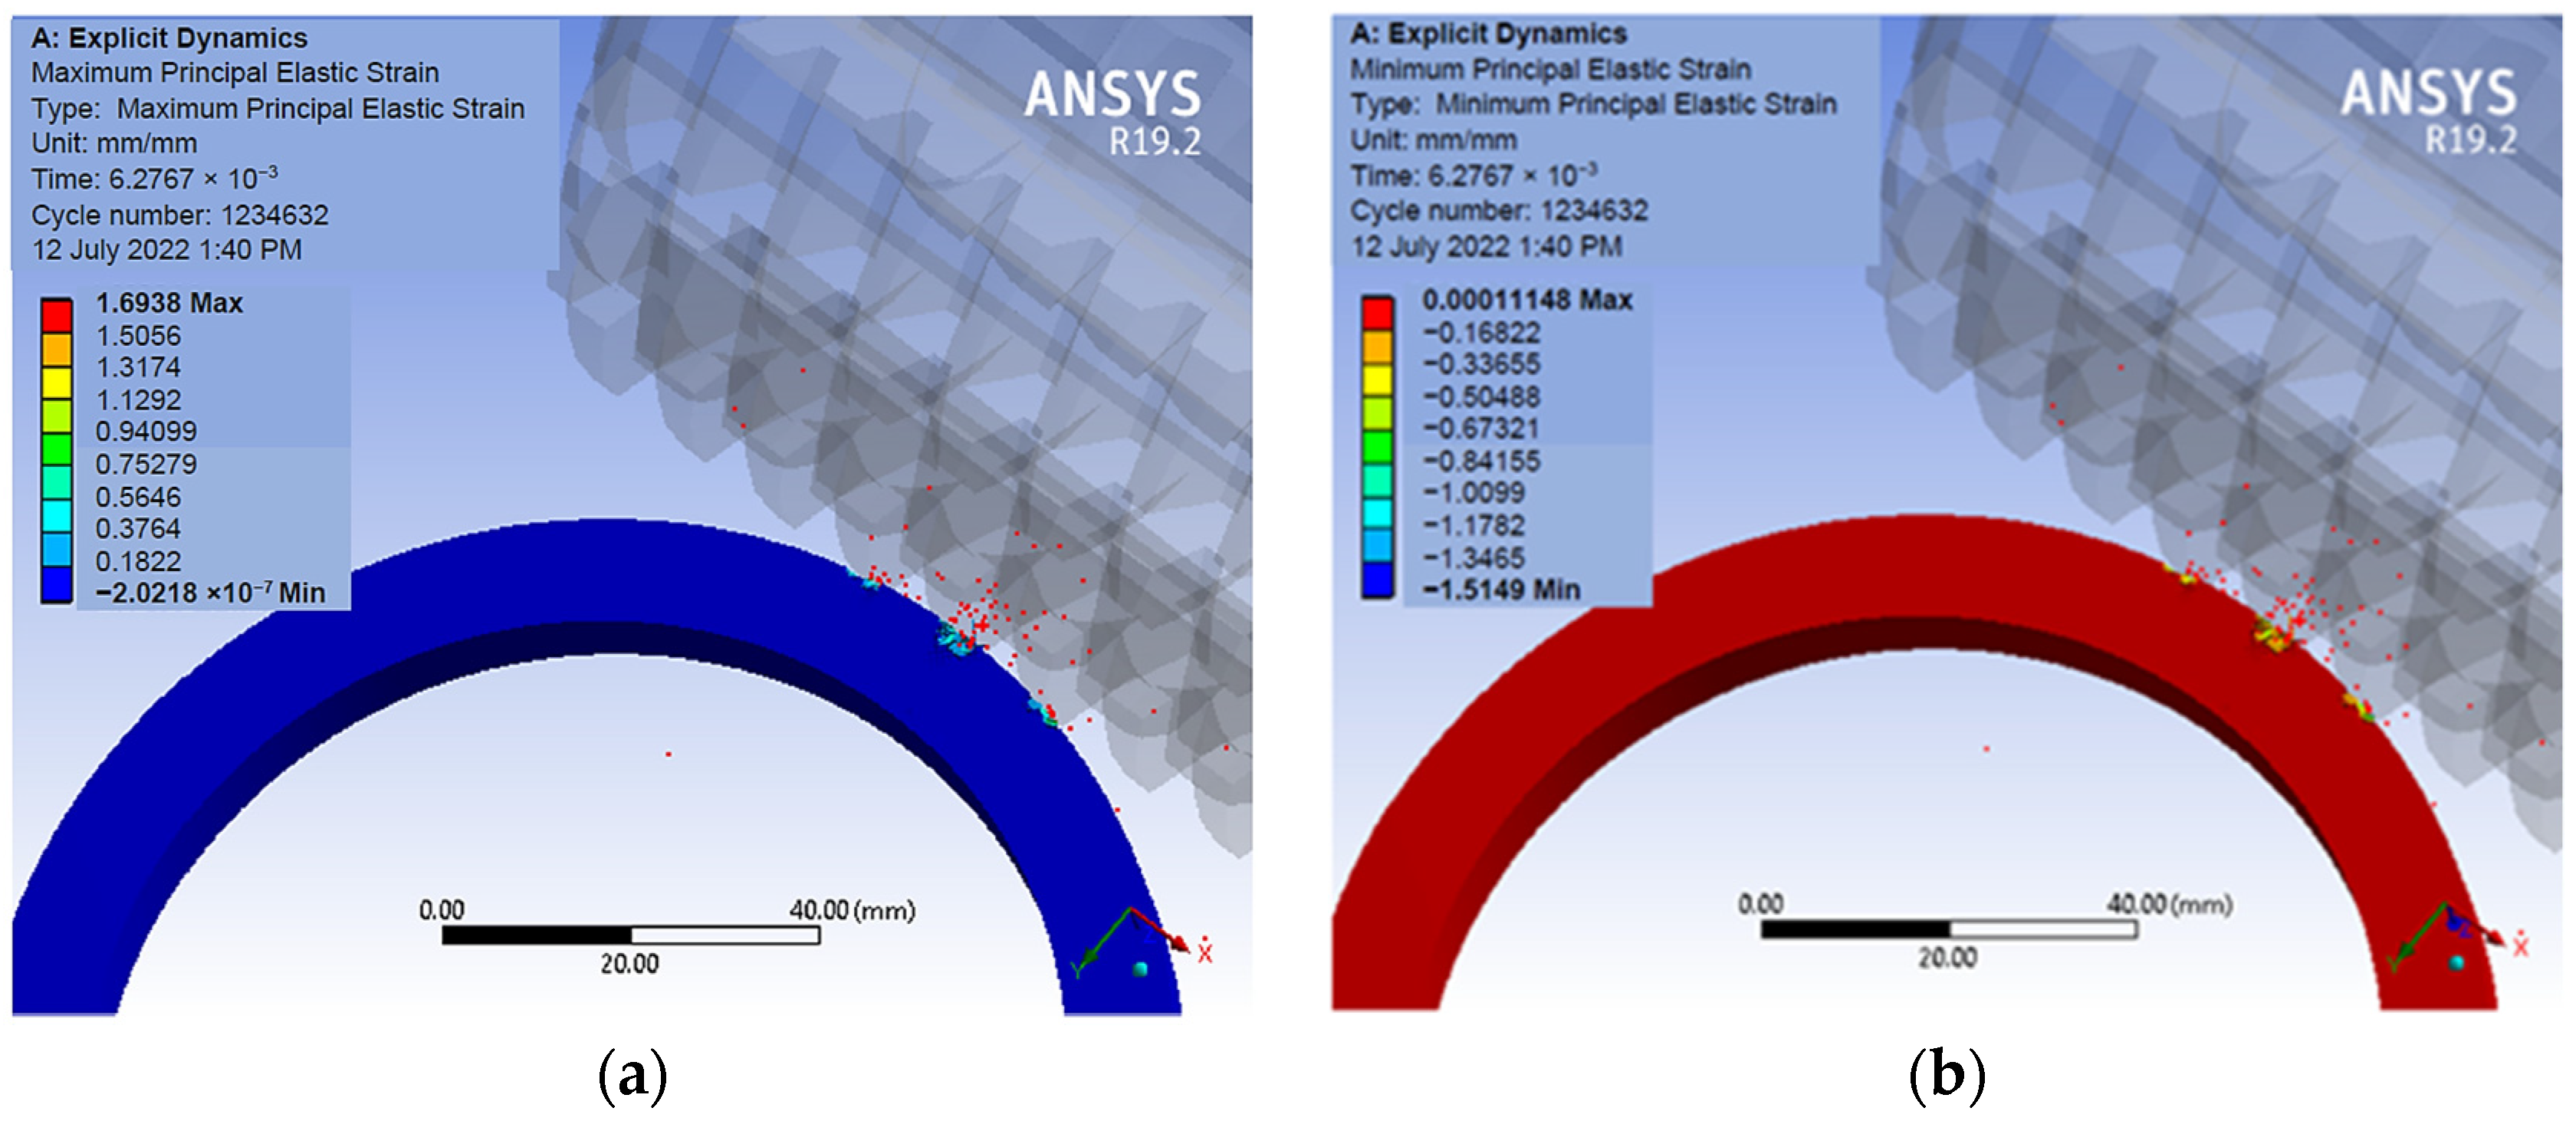
The points corresponding to ε1max during the milling process are identified on the corresponding distribution maps (e.g., Figure 8a) and are found on the chip surface at the contact area with the cutting edge of the hob.
The maximum and minimum values from the dynamic analysis, as well as the running time and the number of cycles performed, can be found in Table 10.

4. Conclusions

In this paper, experimental results regarding the dynamic behavior of the milling machine are presented; the cutting torque that occurs when machining the gear has been determined as having the parameters of milling speed and feed rate. The experimental analysis demonstrated that the displacements were within acceptable limits and did not significantly influence the shape of the tooth profile.
In addition, the simulation of the gear hobbing process with the finite element method was realized. The deformation, strain, and stress were rendered for a time interval of 0.6 s, which does not represent the full stage of the cutting process. In the von Mises equivalent stress diagram, two moments were identified with the successive detachment of the chips from the workpiece, and the breaking stresses were recorded. After running the program, the points with the maximum deformation on the contact surface between the cutting tool and the workpiece were identified.
The main goal of the article was to develop models that could predict the influence of cutting regime parameters on the gear profile and hob wear. The FEM used in the simulation takes into account occurring stresses in the tool–chip contact area. In order to compare the experimental results with those of the simulation, it is necessary to continue and complete the study for the entire cutting process. Thus, highlighting the influence of the dynamic behavior of the machine’s kinematic chains on the tooth profile, which has only been taken into account experimentally. To improve the comparative study, the modal analysis is expected to be performed, with all the component elements of the kinematic chains taken into account.

Author Contributions

Conceptualization, A.D. and I.-D.G.; data curation, L.S.; formal analysis, A.D. and D.-L.P.; funding acquisition, L.S.; investigation, A.D.; methodology, A.D. and L.S.; project administration, A.D.; software, D.-L.P. and I.-D.G.; writing—original draft, D.-L.P.; writing—review and editing, A.D. and I.-D.G. All authors have read and agreed to the published version of the manuscript.

Funding

This research is funded by University of Craiova, 13 A.I. Cuza Street, RO-200585, Craiova, Romania.

Institutional Review Board Statement

Not applicable.

Informed Consent Statement

Not applicable.

Data Availability Statement

The data presented in this study are openly available in the reference number.

Conflicts of Interest

The authors declare no conflict of interest.

References

  1. Ciofu, C.D.; Mindru, T. Researches Concerning Shafts and Gears Milling Process. Int. J. Mod. Manuf. Technol. 2009, 1, 25–30. [Google Scholar]
  2. Liu, Z.; Yue, C.; Li, X.; Liu, X.; Liang, S.Y.; Wang, L. Research on Tool Wear Based on 3D FEM Simulation for Milling Process. J. Manuf. Mater. Process. 2020, 4, 121. [Google Scholar] [CrossRef]
  3. Litvin, F.L.; Gonzalez-Perez, I.; Yukishima, K.; Fuentes, A.; Hayasaka, K. Generation of planar and helical elliptical gears by application of rack-cutter, hob, and shaper. Comput. Methods Appl. Mech. Eng. 2007, 196, 4321–4336. [Google Scholar] [CrossRef]
  4. Mazuru, S.; Scaticailov, S. Tehnologii si Procedee de Danturare a Rotilor Dintate; Editura “Tehnica–UTM”: Chisinau, Republic of Moldavia, 2018. [Google Scholar]
  5. Radzevich, S. Practical Gear Design and Manufacture. In Dudley’s Handbook, 2nd ed.; CRC Press: Boca Raton, FL, USA, 2012. [Google Scholar]
  6. Claudin, C.; Rech, J. Development of a new rapid characterization method of hob’s wear resistance in gear manufacturing—Application to the evaluation of various cutting-edge preparations in high-speed dry gear hobbing. J. Mater. Process. Technol. 2009, 209, 5152–5160. [Google Scholar] [CrossRef]
  7. Pathan, N.; Singh, W.; Shrestha, P.P. Design and Modal Analysis of Spur Gear with Experimental Verification. Int. J. Eng. Sci. Res. Technol. IJESRT 2014, 3, 225–230. Available online: http://www.ijesrt.com (accessed on 25 April 2022).
  8. Zhao, M.X.; Balachandran, B. Dynamics and stability of milling process. Int. J. Solids Struct. 2001, 38, 2233–2248. [Google Scholar] [CrossRef]
  9. Dong, X.; Zhang, W. Stability analysis in milling of the thin-walled part considering multiple variables of manufacturing systems. Int. J. Adv. Manuf. Technol. 2017, 89, 515–527. Available online: https://link.springer.com/article/10.1007/s00170-016-9072-8 (accessed on 25 April 2022). [CrossRef]
  10. Radzevich, S. Investigation of the Tooth Geometry of a Hob for Machining of Involute Gears (in the Tool-in-Use Reference System). Trans. ASME J. Manuf. Sci. Eng. 2007, 129, 750–759. [Google Scholar] [CrossRef]
  11. Smith, S.; Tlusty, J. An Overview of Modeling and Simulation of the Milling Process. J. Manuf. Sci. Eng. 1991, 113, 169–175. [Google Scholar] [CrossRef]
  12. Voronov, S.A.; Ivanov, I.I.; Kiselev, I.A. Investigation of the Milling Process Based on a Reduced Dynamic Model of Cutting Tool. J. Mach. Manuf. Reliab. 2015, 44, 70–78. [Google Scholar] [CrossRef]
  13. Belis, T.; Antoniadis, A. Hobbing Wear Prediction Model Based on 3D Chips Determination. In Proceedings of the International Conference on Design, Technology and Management in Manufacturing, Beijing, China, 23–25 November 2010. [Google Scholar]
  14. Karpuschewski, B.; Beutner, M.; Köchig, M.; Härtling, C. Influence of the tool profile on the wear behaviour in gear hobbing. CIRP J. Manuf. Sci. Technol. 2017, 18, 128–134. [Google Scholar] [CrossRef]
  15. Dong, X.; Liao, C.; Shin, Y.C.; Zhang, H.H. Machinability Improvement of Gear Hobbing via Process Simulation and Tool Wear Predictions. 2016. Available online: https://link.springer.com/content/pdf/10.1007/s00170-016-8400-3.pdf (accessed on 25 April 2022).
  16. Liu, W.; Rena, D.; Usuia, S.; Wadella, J.; Marusicha, T.D. A Gear Cutting Predictive Model Using the Finite Element Method. In Proceedings of the 14th CIRP Conference on Modeling of Machining Operations, Turin, Italy, 13–14 June 2013. [Google Scholar] [CrossRef] [Green Version]
  17. Tapoglou, N.; Antoniadis, A. Hob3D: A Novel Gear Hobbing Simulation Software. In Proceedings of the World Congress on Engineering, London, UK, 6–8 July 2011; Volume 1. [Google Scholar]
  18. Antoniadis, A. Gear skiving—CAD simulation approach. Comput.-Aided Des. 2012, 44, 611–616. [Google Scholar] [CrossRef]
  19. Vasilis, D.; Nectarios, V.; Aristomenis, A. Advanced Computer Aided Design Simulation of Gear Hobbing by Means of Three-Dimensional Kinematics Modeling. J. Manuf. Sci. Eng.-Trans. ASME 2006, 129, 911–918. [Google Scholar] [CrossRef] [Green Version]
  20. Tapoglou, N.; Belis, T.; Vakondios, D.; Antoniadis, A. CAD-Based Simulation of Gear hobbing. In Proceedings of the Symposium on Mechanics and Materials, Agia Marina, Greece, 9–14 May 2010. [Google Scholar]
  21. Jani, S.; Jinesh, B.; Shah Vala, K. Design and Analysis of Helical Gear Pair using ANSYS, FEM and AGMA Standards for Calculating a Bending and Contact Stress on Gear Profiles: A Review. IJARIIE 2017, 3, 3813–3821, ISSN(O)-2395-4396. [Google Scholar]
  22. Bouzakis, K.; Friderikos, O.; Tsiafis, I. FEM-supported simulation of chip formation and flow in gear hobbing of spur and helical gears. CIRP J. Manuf. Sci. Technol. 2008, 1, 18–26. [Google Scholar] [CrossRef]
  23. Bouzakis, K.; Lili, E.; Michailidis, N.; Friderikos, O. Manufacturing of cylindrical gears by generating cutting processes: A critical synthesis of analysis methods. CIRP Ann.-Manuf. Technol. 2008, 57, 676–696. [Google Scholar] [CrossRef]
  24. Klocke, F.; Gorgels, C.; Schalaster, R.; Stuckenberg, A. An Innovative Way of Designing Gear Hobbing Processes. 2012. Available online: Geartechnology.com (accessed on 15 February 2022).
  25. Bergs, T.; Brimmers, J.; Georgoussis, A.; Kromer, M. Investigation of the chip formation during hobbing by means of an analytical approach. CIRP ICME’20 2021, 99, 226–231. [Google Scholar] [CrossRef]
  26. Duta, A.; Ozyilmaz, E.; Raicu, L.; Sass, L.; Stanescu, G. Aspects of Dynamic Analysis for FD320A Milling Machine. In Proceedings of the Annals of DAAAM for 2010 & Proceedings of the 21st International DAAAM Symposium, Zadar, Croatia, 20–23 October 2010; ISBN 978-3-901509-73-5. ISSN 1726-9679. [Google Scholar]
  27. Duta, A.; Minciu, C. A Model of Dynamic Calculus of the Main Kinematic Chain and of the Roller Chain. Ph.D. Thesis, Politechnica University of Bucharest, Bucharest, Rome, 1998. [Google Scholar]
  28. Geradin, M.; Rixen, D.J. Mechanical Vibrations: Theory and Application to Structural Dynamics, 3rd ed.; Wiley: Chichester, UK, 2015; ISBN1 9781118900208. ISBN2 978-1-118-90020-8. [Google Scholar]
  29. Ispas, C.; Simion, F.P. Vibratiile Masinilor-Unelte, Teorie si Aplicatii (Vibrations for Tools-Machines. Theory and Application); Editura Academiei, R.S.R., Ed.; Romanian Academy Publishing House: Bucharest, Romania, 1986. [Google Scholar]
  30. Azvar, M.; Katz, A.; Erkorkmaz, K. Chip geometry and cutting force prediction in gear. Mater. Sci. CIRP Ann. 2021, 70, 95–98. [Google Scholar] [CrossRef]
  31. Yagishita, H. Method for measuring the dynamic transmission error in large gear hobbing machines. Precis. Eng. 1990, 12, 144–150. [Google Scholar] [CrossRef]
  32. Abood, A.M. Dynamic Analysis of The Cutting Forces in Gear Hobbing. Ph.D. Thesis, School of Mechanical and Systems Engineering, University of Newcastle upon Tyne, Newcastle upon Tyne, UK, 2002. [Google Scholar]
  33. Tapoglou, N.; Mammas, A.; Antoniadis, A. Influence of machining data on developed cutting forces in gear hobbing. Int. J. Mach. Mach. Mater. 2013, 14, 66. [Google Scholar] [CrossRef]
  34. ANSYS Engineering Simulation Software; ANSYS: Canonsburg, PA, USA, 2022.
  35. Available online: https://www.bksv.com/en/analysis-software/data-acquisition-software (accessed on 18 February 2022).
  36. Xia, C.; Wang, S.; Long, T.; Ma, C.; Wang, S. Transmission chain error elimination for gear hobbing machines based on classified compensation theory and frequency response identification. Measurement 2020, 156, 107596. [Google Scholar] [CrossRef]
  37. Picos, C.; Pruteanu, O.; Bohosievici, C.; Coman, G.; Braha, V.; Paraschiv, D.; Slatineanu, L.; Gramescu, T.; Marin, A.; Ionesii, V.; et al. Proiectarea Tehnologiilor de Prelucrare Mecanica prin Aschiere. In Manual de Proiectare (The Design of Mechanical Processing Technologies, Design Manual); Universitas: Chisinau, Moldova, 1992; Volume 2. [Google Scholar]
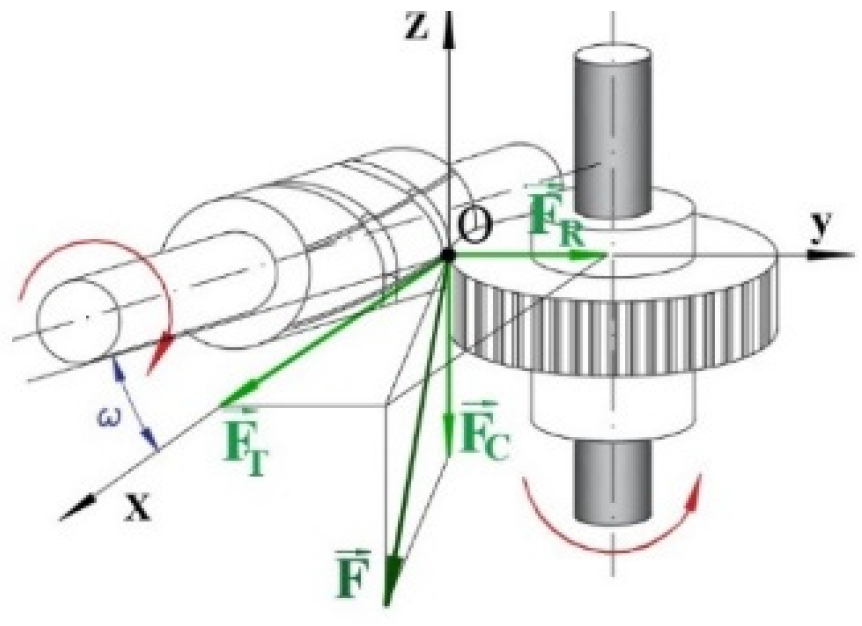
Figure 1. The schematic representation of the workpiece cutting force.
Applsci 12 08027 g001
Figure 2. Diagram of experimental protocol.
Applsci 12 08027 g002
Figure 3. Scheme of measurement points.
Applsci 12 08027 g003
Figure 4. Graphs for the torque moment variation: (a) torque moment vs. time; (b) torque moment vs. frequency.
Applsci 12 08027 g004
Figure 5. Geometric model for the assembly.
Applsci 12 08027 g005
Figure 6. The meshing detail for the assembly: (a) overall view; (b) detail view of the contact surface.
Applsci 12 08027 g006
Figure 7. Computed ANSYS equivalent (von Mises) stress map: (a) for the gear; (b) global view of the assembly.
Applsci 12 08027 g007
Figure 8. Computed ANSYS principal elastic strain map: (a) maximum; (b) minimum.
Applsci 12 08027 g008
Figure 9. Computed ANSYS principal stress map: (a) maximum; (b) minimum.
Applsci 12 08027 g009
Figure 10. Computed ANSYS equivalent elastic strain map: (a) for the gear; (b) global view of the assembly.
Applsci 12 08027 g010
Figure 11. Diagram of equivalent elastic strain.
Applsci 12 08027 g011
Figure 12. Diagram of equivalent stress (von Mises).
Applsci 12 08027 g012
Figure 13. Diagram of maximum principal elastic strain.
Applsci 12 08027 g013
Figure 14. Diagram of minimum principal elastic strain.
Applsci 12 08027 g014
Figure 15. Diagram of Maximum Principal Stress.
Applsci 12 08027 g015
Figure 16. Diagram of Minimum Principal Stress.
Applsci 12 08027 g016
Table 1. The hob characteristics.
NameSymbolValueUnits
Modulem3.5mm
Pressure angleα20deg
Teeth no.z14μL
Number of originsz11μL
Tooth heighth7.875mm
Outside diameterdh90mm
Pitch diameterd83mm
Chanel angleω2°31′24″deg
Chanel pitchCp6575.43mm
Relieving angleδ25deg
Table 2. Experimental results.
Hob Module
m
(mm)
Rotational Speed
nh
(rpm)
Feed Rate
vf
(mm/min)
Point 1
Displacements shy
(μm)
Point 2
Displacements
shz
(μm)
Point 3
Displacements
sgz
(μm)
Point 4
Displacements
sgy
(μm)
3.5954−1.29 … 2.44−1.31 … 1.01−1.71 … 1.29−1.17 … 1.02
Table 3. The measured numerical results for the torque moment.
Module
m (mm)
Rotational Speed
nh (rpm)
Feed Rate
vf (mm/min)
Maximum Torque Moment
Mtmax (Nm)
Torque Moment Expression
Mt (Nm)
3.595452.9618.207 + 9.224 sin 0.233t + 4.955 sin 2.623t
Table 4. Equivalent Elastic Strain.
Time
t (s)
Minimum
Equivalent Elastic Strain
εmin (mm/mm)
Maximum
Equivalent Elastic Strain
εmax (mm/mm)
Average
Equivalent Elastic Strain
ε ¯   ( mm / mm )
1.1755 × 10−38
0-
9.9221× 10−400.179692.4293 × 10−5
4.2896 × 10⁻³ (point A, Figure 11)01.3295 (point A, Figure 11)3.0552 × 10⁻⁴
5.0076 × 10⁻³ 01.69743.6991 × 10−4
5.0749 × 10−301.73313.7898 × 10−4
5.6075 × 10−302.02554.2279 × 10−4
6.1808 × 10⁻³ (point B, Figure 11)02.2548 (point B, Figure 11)4.6702 × 10⁻⁴
6.2767 × 10−302.25644.7281 × 10−4
Table 5. Equivalent stress (von Mises).
Time
t (s)
Minimum
Equivalent Stress
σv min (MPa)
Maximum
Equivalent Stress
σv max (MPa)
Average
Equivalent Stress
σ - v   ( MPa )
1.1755 × 10−38---
9.9221 × 10−41.5649 × 10−2596.633.0684
4.2896 × 10⁻³ (point A, Figure 12)3.0400 × 10−2651.79 (point A, Figure 12)6.0913
5.0076 × 10−31.5193 × 10−2639.945.8218
5.0749 × 10−31.7860 × 10−2640.145.9126
5.6075 × 10−33.8187 × 10−2640.104.8760
6.1808 × 10⁻³ (point B, Figure 12)1.9844 × 10−2656.97 (point B, Figure 12)4.8431
6.2767 × 10−31.6906 × 10−2644.094.6169
Table 6. Maximum principal elastic strain.
Time
t (s)
Minimum
ε1 min (mm/mm)
Maximum
ε1 max (mm/mm)
Average
ε ¯ 1   ( mm / mm )
1.1755 × 10−38---
9.9221 × 10⁻⁴−6.6972 × 10−40.127171.6845 × 10−5
4.2896 × 10⁻³−7.8338 × 10−80.99562.3802 × 10−4
5.0076 × 10⁻³−4.8383 × 10−81.26952.8779 × 10−4
5.0749 × 10⁻³−9.6818 × 10−81.29632.9485 × 10−4
5.6075 × 10⁻³−2.7392 × 10−71.51323.2678 × 10−4
6.1808 × 10−34.1564 × 10−91.69213.5890 × 10−4
6.2767 × 10⁻³−2.0218 × 10−71.69383.6272 × 10−4
Table 7. Minimum principal elastic strain.
Time
t (s)
Minimum
ε3 min (mm/mm)
Maximum
ε3 max (mm/mm)
Average
ε ¯ 3   ( mm / mm )
1.1755 × 10−38---
9.9221 × 10⁻⁴−0.125214.2826 × 10−8−1.7264 × 10⁻⁵
4.2896 × 10⁻³−0.969721.1543 × 10−4−2.2078 × 10⁻⁴
5.0076 × 10⁻³−1.23953.3848 × 10−5−2.6823 × 10⁻⁴
5.0749 × 10⁻³−1.26432.5838 × 10−5−2.7514 × 10⁻⁴
5.6075 × 10⁻³−1.45331.5112 × 10−4−3.0484 × 10⁻⁴
6.1808 × 10⁻³−1.51396.9237 × 10−5−3.3336 × 10⁻⁴
6.2767 × 10⁻³−1.51491.1148 × 10−4−3.3702 × 10⁻⁴
Table 8. Maximum principal stress.
Time
t (s)
Minimum
σ1 min (MPa)
Maximum
σ 1 max (MPa)
Average
σ - 1   ( MPa )
1.1755 × 10−38---
9.9221 × 10⁻⁴−599.08286.31.5373
4.2896 × 10⁻³−120.35729.743.2888
5.0076 × 10⁻³−91.411720.883.1674
5.0749 × 10⁻³−105.46724.083.2223
5.6075 × 10⁻³−183.68722.132.6878
6.1808 × 10⁻³−293.7762.692.7075
6.2767 × 10⁻³−278.74704.822.5722
Table 9. Minimum principal stress.
Time
t (s)
Minimum
σ 3 min (MPa)
Maximum
σ 3 max (MPa)
Average
σ - 3   ( MPa )
1.1755 × 10−38---
9.9221 × 10⁻⁴−902.82100.31−1.8632
4.2896 × 10⁻³−696.26114.68−3.4724
5.0076 × 10⁻³−656.76135.43−3.2939
5.0749 × 10⁻³−662.87145.14−3.3447
5.6075 × 10⁻³−639.07131.42−2.7467
6.1808 × 10⁻³−668.44226.54−2.6771
6.2767 × 10⁻³−657.54125.58−2.5576
Table 10. ANSYS dynamic simulation results.
TypeEquivalent Elastic Strain
ε (mm/mm)
Equivalent (von Mises) Stress
σv (MPa)
Total Deformation
δ (mm)
Maximum Principal Elastic Strain
ε1 (mm/mm)
Minimum Principal Elastic Strain
ε3 (mm/mm)
Middle Principal Elastic Strain
ε2 (mm/mm)
Maximum Shear Elastic Strain
τmax (mm/mm)
Maximum Principal Stress
σ1 (MPa)
Minimum0,1.6906 × 10−2 5.123 × 10⁻²−2.0218 × 10⁻⁷ −1.5149−0.247221.1954 × 10−7 −278.74
Maximum2.2564644.09714.661.6938 1.1148 × 10⁻⁴ 0.12853 3.2087704.82
Average4.7281 × 10−4 4.61690.407453.6272 × 10−4−3.3702 × 10⁻⁴−1.6867 × 10⁻⁵ 6.9974 × 10−42.5722
Time6.2767 × 10−3 s
Set14
Cycle Number1,234,632
Publisher’s Note: MDPI stays neutral with regard to jurisdictional claims in published maps and institutional affiliations.