Article

Rapid Temperature Control in Melt Extrusion Additive Manufacturing Using Induction Heated Lightweight Nozzle

by
Alexander A. Oskolkov
1,*,
Igor I. Bezukladnikov
2 and
Dmitriy N. Trushnikov
1
1
Department of Welding Production, Metrology and Technology of Material, Perm National Research Polytechnic University, 29 Komsomolsky Prospect, 614990 Perm, Russia
2
Department of Automation and Telemechanics, Perm National Research Polytechnic University, 29 Komsomolsky Prospect, 614990 Perm, Russia
*
Author to whom correspondence should be addressed.
Appl. Sci. 2022, 12(16), 8064; https://doi.org/10.3390/app12168064
Submission received: 15 July 2022 / Revised: 9 August 2022 / Accepted: 9 August 2022 / Published: 11 August 2022

Abstract

:
An approach for improving and maintaining consistent fusion quality of the deposited material during FDM 3d-printing is proposed. This approach is based on the nozzle temperature control during the printing process to adjust the polymer extrusion temperature with a speed and accuracy adequate to the FDM process. High frequency induction heating of the lightweight nozzle (<1 g) was used. To control the temperature of a lightweight nozzle, the resonant temperature measurement method based on the analysis of the high frequency eddy currents is proposed. To determine the parameters of the nozzle and the inductor as a plant, a FEM model of the inductive heating of the nozzle and a simulated model of a serial-parallel resonant circuit containing inductor were developed. Linearization of the automatic control system was performed to ensure the equal quality of regulation when operating in a wide temperature range. The quality of regulation, stability of the system, and coefficients of the PID controller were evaluated using a simulated model of the control system. A number of test samples were printed from various materials, and tensile stress testing was carried out. The developed control method reduces the nozzle temperature control error from 20 to 0.2 °C and decreases control delay by more than six times.

1. Introduction

Presently, additive manufacturing technologies are used in various high-tech industries. Additive methods for the production of prostheses and implants from biocompatible polymeric materials are being actively researched and implemented. A large amount of research in this area is devoted to the use of polyetheretherketone (PEEK), polycarbonate (PC), polyamides, and other materials. The additive manufacturing of products from such materials is largely associated with the extrusion type technology of fused deposition modeling (FDM) or fused filament fabrication (FFF) [1,2,3]. The additive manufacturing technology of products from thermoplastic material by using melt extrusion (FDM/FFF) is among the most common [4]. The productivity of such (FDM) extruders is usually 10–100 g per hour.
One of the most important technological parameters of FDM process is the temperature of the polymer and, hence, the temperature of the heated nozzle. Conventional extruders (CE) do not provide the accuracy and speed required to precisely measure and control the temperature of the nozzle, which leads to significant overheating and underheating of the polymer material during the deposition process, and as a result the fusion quality of the deposited material is not constant, resulting in the loss of geometric shape and thermal deformation of the product, destruction of the product along the boundaries of the layers, and the general deterioration of the mechanical properties of the product [3,5,6]. It is known from [5,7,8,9,10,11] that the extrusion temperature deviations from the optimum by 10 °C can lead to a drop in the final physical and mechanical properties of the product by 5–10% and more as the temperature deviation increases. The problem is becoming more serious because such characteristics as the temperature, geometric, and mass characteristics of the previously deposited volume of the product during the additive process are being changed. At the state-of-the-art level, the change in heatsink conditions during the travel along the path is partially compensated by changing the deposition speed (extruder movement speed) of the entire layer or its parts. However, this method does not take into account the relationship between the deposition speed and the polymer extrusion speed and, as a result, the effect of the extrusion speed on the temperature of the extruded polymer. The quality of fusion of the material beads thus depends on the relation between the temperature of the extrudable material and the temperature of the underlying layers, as well as on the heat dissipation conditions on the extruder path.
In the hot (heated, hot-end) part of the extruder (E3D V6, E3D Volcano, UK, DyzEnd Pro, Canada), the polymer is melted and subsequent extrusion through the forming nozzle hole. In this case, the heating of the nozzle to a temperature sufficient for melting the polymer is carried out by means of direct heat transfer from a metal heater block, in which the nozzle, the heating element, and the temperature sensor are installed.
The problems of FDM/FFF described earlier are caused by a number of disadvantages of CE:
  • Asymmetric location of the electrical resistance heater at a distance relative to the nozzle leads to inequality of the thermal field of both the nozzle and the extrudable material (up to 20 °C) [12,13];
  • Location of the temperature sensor at a distance from the mentioned heater and the nozzle leads to an error in measuring the temperature of the nozzle and polymer in 10–20 °C [12,13,14,15] (without extrusion). With an increase in the extrusion speed to the level of 30–40 mm/s, the accuracy of measuring the nozzle temperature decreases by another ~10 °C [16], and the accuracy of measuring the polymer temperature decreases to ±30 °C [14,15,16,17,18] or more with a further increase in the extrusion speed [17];
  • The large mass (from 20 g onwards) of the heater block and the low speed of the thermistors and thermocouples used (response time of 100–140 ms, not ideal thermal contact with the heater block) do not allow heating or cooling of the nozzle to adjust the polymer temperature during the deposition process with a speed adequate to the deposition speed when filling the layer.
There are a number of approaches for improving the consistency of quality of interlayer fusion in the FDM 3d-printing, including the following ones: the use of ultrasonic treatment [19,20,21,22,23,24] during and after deposition, temperature control of the deposited layers of the product during deposition [8,25,26,27,28,29], annealing of polymer products, the use of mathematical modeling to adjust the printing parameters [30,31,32,33,34,35], and the use of statistical methods to determine the optimal deposition mode [36,37,38,39,40,41,42,43,44].
To solve the described problems, the research team proposes an approach based on the use of an induction heating method of a thin-walled lightweight nozzle to achieve such dynamic characteristics of the heating and cooling processes of the nozzle, which will provide the possibility of adjusting the temperature of the extrudable polymer at a speed adequate to the deposition speed and a higher accuracy of temperature control due to the use of a modified eddy currents resonance method for measuring temperature. The known extruders [45,46,47] with induction heating have a large mass of the heated part (hot-end) therefore do not have any distinct advantages in comparison to conventional ones mainly due to the high delay of the temperature sensors used. Pyrometry is not used due to rapid contamination and changes in the properties of the controlled surface of the nozzle or heater during deposition [45,48]. Known methods of temperature measurement based on the usage of the eddy currents resonance [49,50] provide a measurement speed higher than that of the thermistors and thermocouples used, but do not allow to measure the temperature simultaneously with heating by high frequency (HF) currents, and their accuracy decreases as the mass of the controlled product is getting lower. Excess temperature of the nozzle may lead to both its permanent deformation and burnout of the polymer material. On the other hand, a high cooling rate of the nozzle during material extrusion may lead to disruption or termination of the extrusion process.

2. Materials and Methods

Known temperature automatic control systems (TACS) of the FDM process [51,52] and related processes are, as a rule, closed-loop with temperature feedback and use of known proportional-integral-derivative (PID) control laws. The team proposed an original design of the nozzle and inductor (Figure 1). The non-contact nature of the induction heating method made it possible to reduce the mass of the heated part (hot-end) to the mass of a specially shaped nozzle itself with the overall value equal or less than 1 g. The lack of fast temperature measurement methods for the lightweight nozzle was one of the major technological drawbacks hindering the efficient using of induction heating in FDM 3D manufacturing. To control the temperature of a lightweight nozzle, the research team proposes the amplitude-phase resonant temperature measurement method instead of the known frequency methods, as well as the amplitude method previously proposed by the research team [53]. The induction heating method provides the possibility of supplying a significant peak power (more than 500 W against 50 W in a CE); the possibility of heating the active zone with an arbitrary shape; the possibility of changing the heating parameters by modifying the inductor. A special nozzle was made, as shown in Figure 1. The nozzle material was ferromagnetic alloy AISI420 with a Curie temperature of about 1000 °C. Axial symmetry of the proposed inductor and nozzle provides greater uniformity of heating of polymer inside the nozzle.
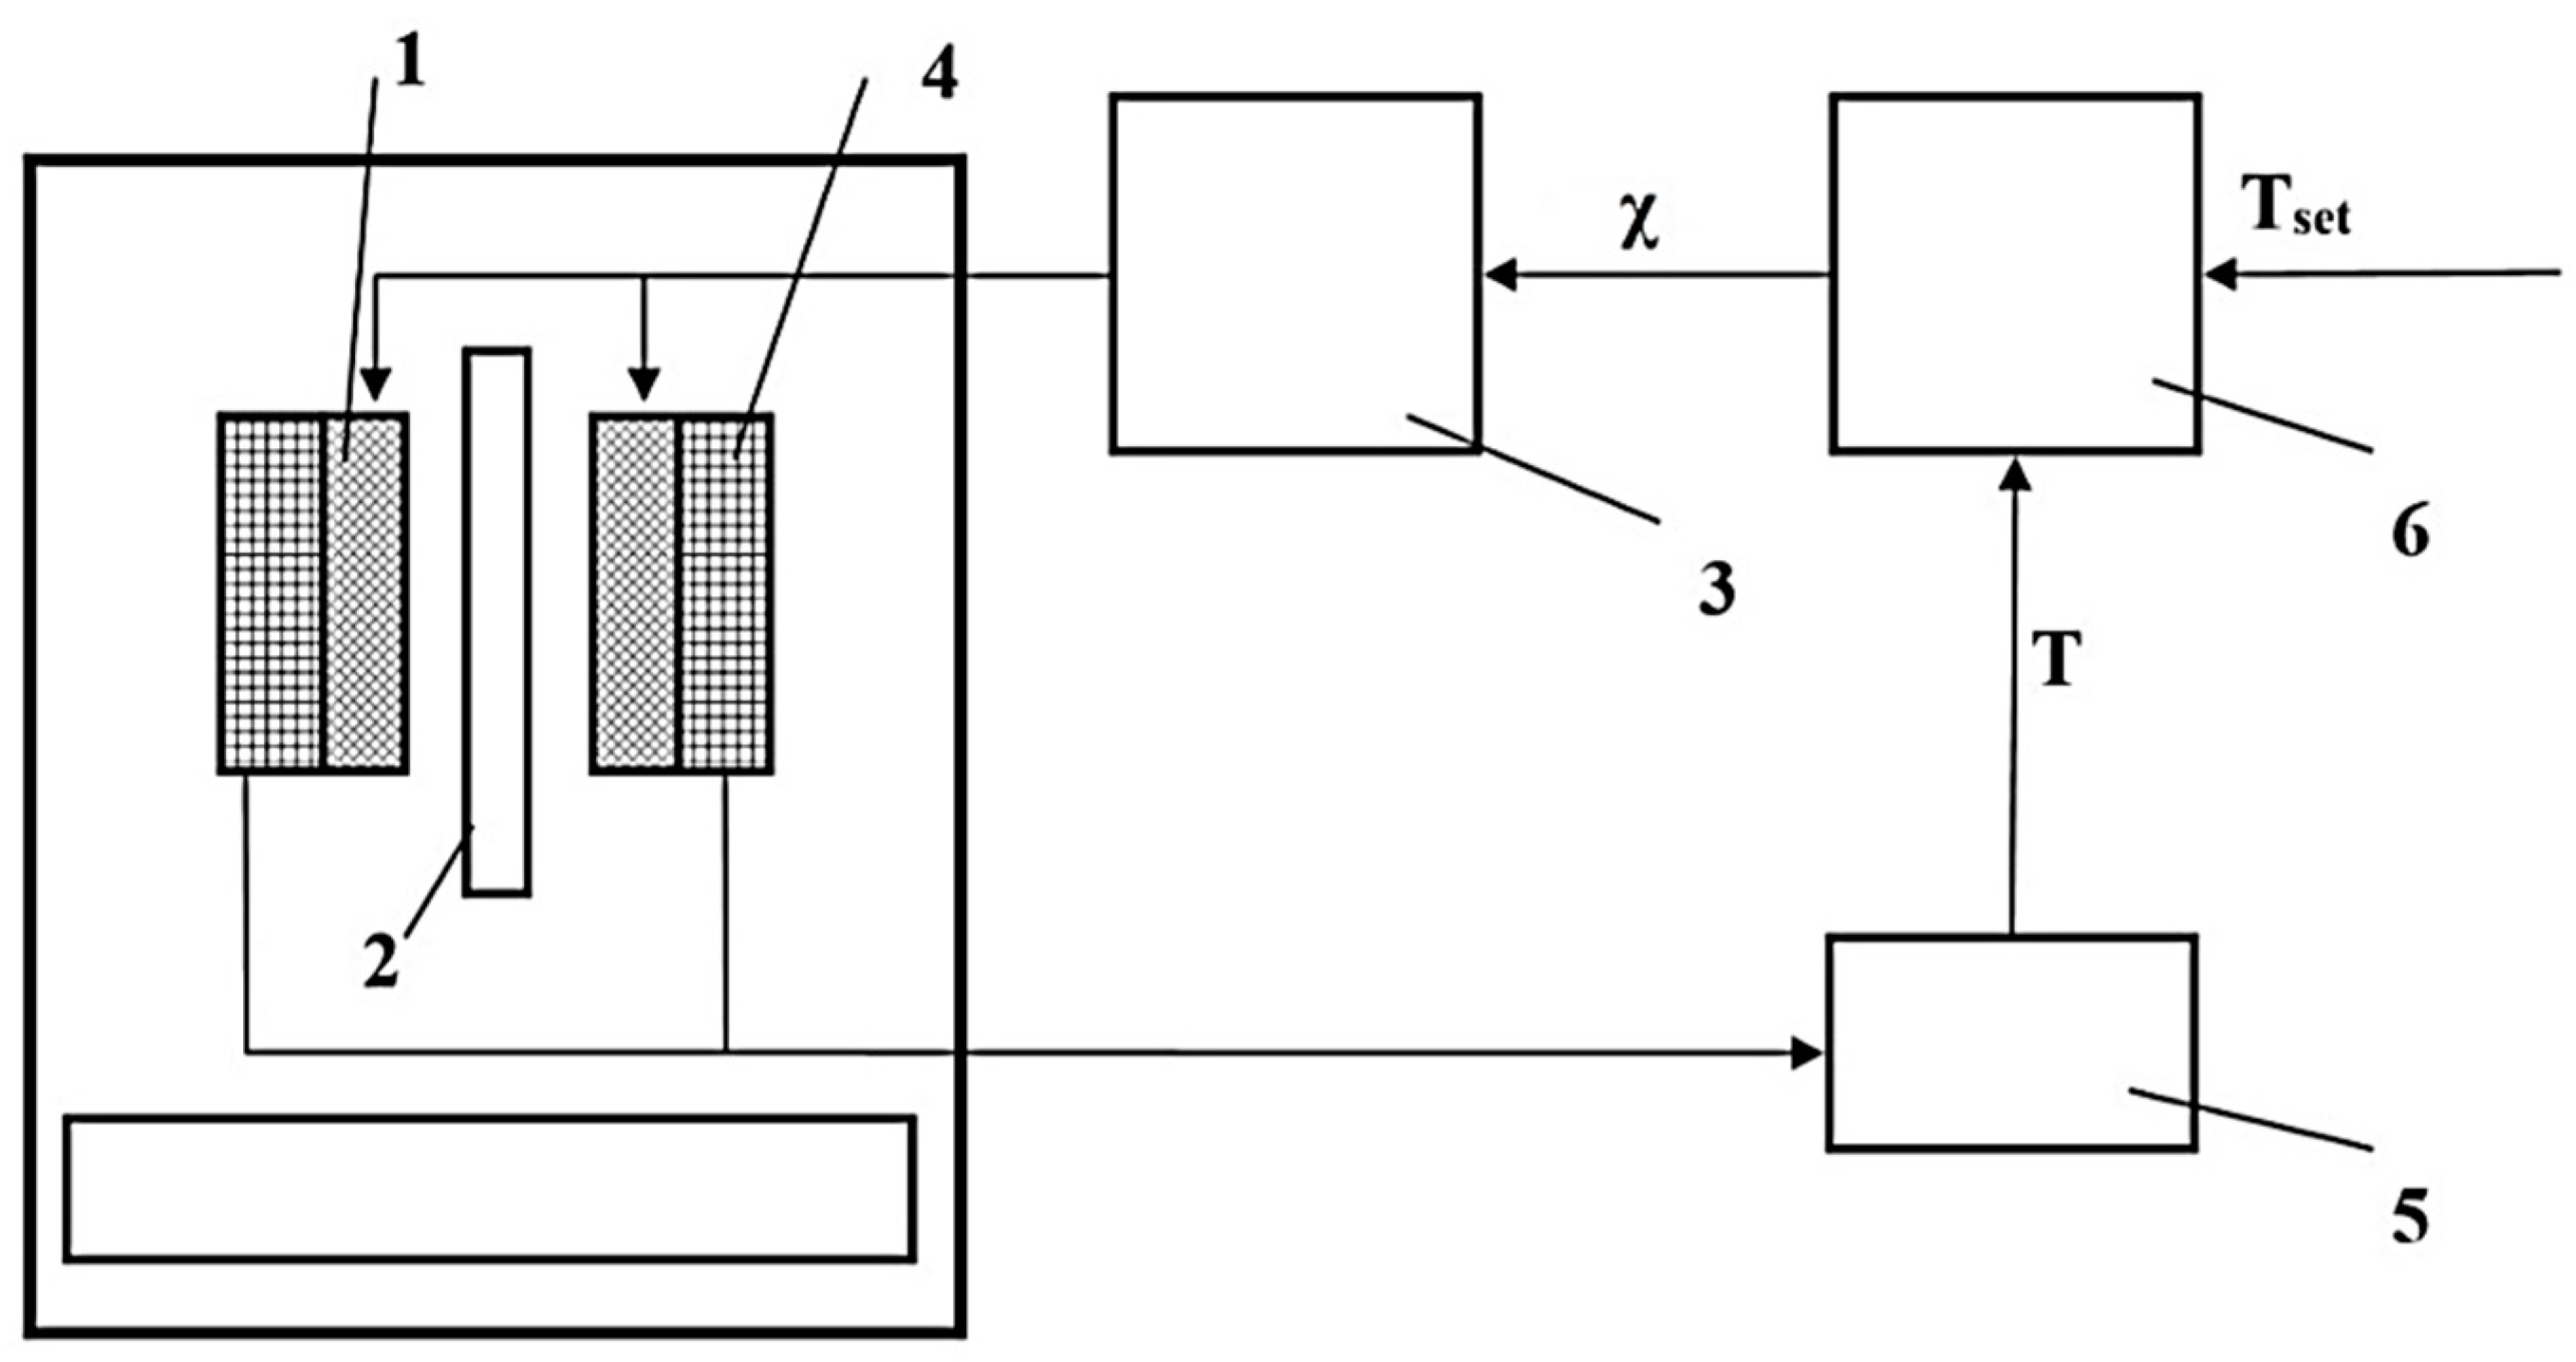
Figure 2 contains the block diagram of the nozzle TACS. In the installation for FDM containing the inductor L1 (1) and the nozzle (2), using the HF generator (3), the temperature of the nozzle (2) is controlled, which affects the properties of the material of the nozzle (2) and leads to a change in the phase and amplitude characteristics of the current I of the inductor L1 (1) circuit. The inductor L1 (1) is supplemented by a measuring coil L3 (4), where, as a result of transformation, a useful signal is generated and then fed through the measuring circuit to the signal registration and processing unit (5), where the actual temperature of the nozzle T is determined. Temperature readings are transmitted to the PID controller (6), where the error signal is determined relative to the setpoint value of Tset and a new input stimulus (phase shift χ) is formed for the HF generator (3).
A testbed system was designed, which comprises laboratory power supplies with V0 = 24 V, Imax = 30 A, a DRV8302-based power controller, a HF voltage source inverter using power MOSFETs, and a Control Board based on an ARM-microcontroller STM32F334R8 by STMicroelectronics. The inductive load was extended to the inductor-capacitor-inductor (LCL) series-parallel resonant circuit by adding a capacitive device C1 in parallel with the inductor L1 and inductive device L2 in series with the parallel resonant circuit L1C1. Component values in the LCL resonant circuit were converted to fit the predetermined operating frequency of f = 115 kHz. The inductor winding of a specified diameter and height was formed with 17 turns of copper HF litz wire (d = 0.75 mm, 2 layers). The LCL resonant circuit was supplied by a HF full-bridge inverter (Figure 3), which is controlled using phase-shift modulation (PSM) method [54,55]. Using PSM transistors, located on the one bridge leg, operate with a 50% duty cycle and a phase shift of 180° relative to each other. The voltage between transistors of the same diagonal takes the value of either zero or the voltage of the power source V0. The duration of the intervals during which the voltage at the output of the HF generator is equal to zero depends on the phase shift χ between the pairs of transistors located on the left and right bridge legs. The transistors are controlled by the microcontroller which generates two direct control signals Q1 and Q2 for the upper transistors, and two inverse signals Q3 and Q4 for the lower transistors. A measuring circuit was developed (Figure 3), containing a measuring coil L3, which is inductively coupled to the inductor L1 and electrically isolated from it, a current-limiting resistor R1, a level limiter assembled on diodes D5 and D6, an integrated operational amplifier INA240 [56], R2–R7 resistors, Req—ohmic resistivity of the load (inductor L1 with a nozzle) and D1, D2, D3, D4—intrinsic antiparallel diodes. Measuring coil L3, was wound with 17 turns of copper wire with d3 = 0.35 mm in two layers. The output of the measuring circuit is connected to the analog input of the microcontroller, where the results of measurements of the nozzle temperature are processed. Nozzle resistance of 0.98 Ω was measured by placing a lightweight nozzle in an inductor and then measuring the resistance of the inductor circuit in an unloaded (no nozzle) and then loaded state at a frequency of 100 kHz using an RLC meter.
The calibration of temperature readings was carried out using control equipment, consisting of a two-channel temperature meter UT-325 with K and J type thermocouples, as well as a reference device on platinum resistors. Modeling of electrical circuits was carried out with the Multisim software package.
To determine the TACS parameters in the process of FDM, it is necessary to identify an inductor and a lightweight nozzle as a plant with their subsequent integration into the simulated model of a TACS in the Simulink application of the MATLAB package.

3. Results and Discussion

3.1. FEM Modelling of HF Induction Heating of the Nozzle during Extrusion of a Thermoplastic

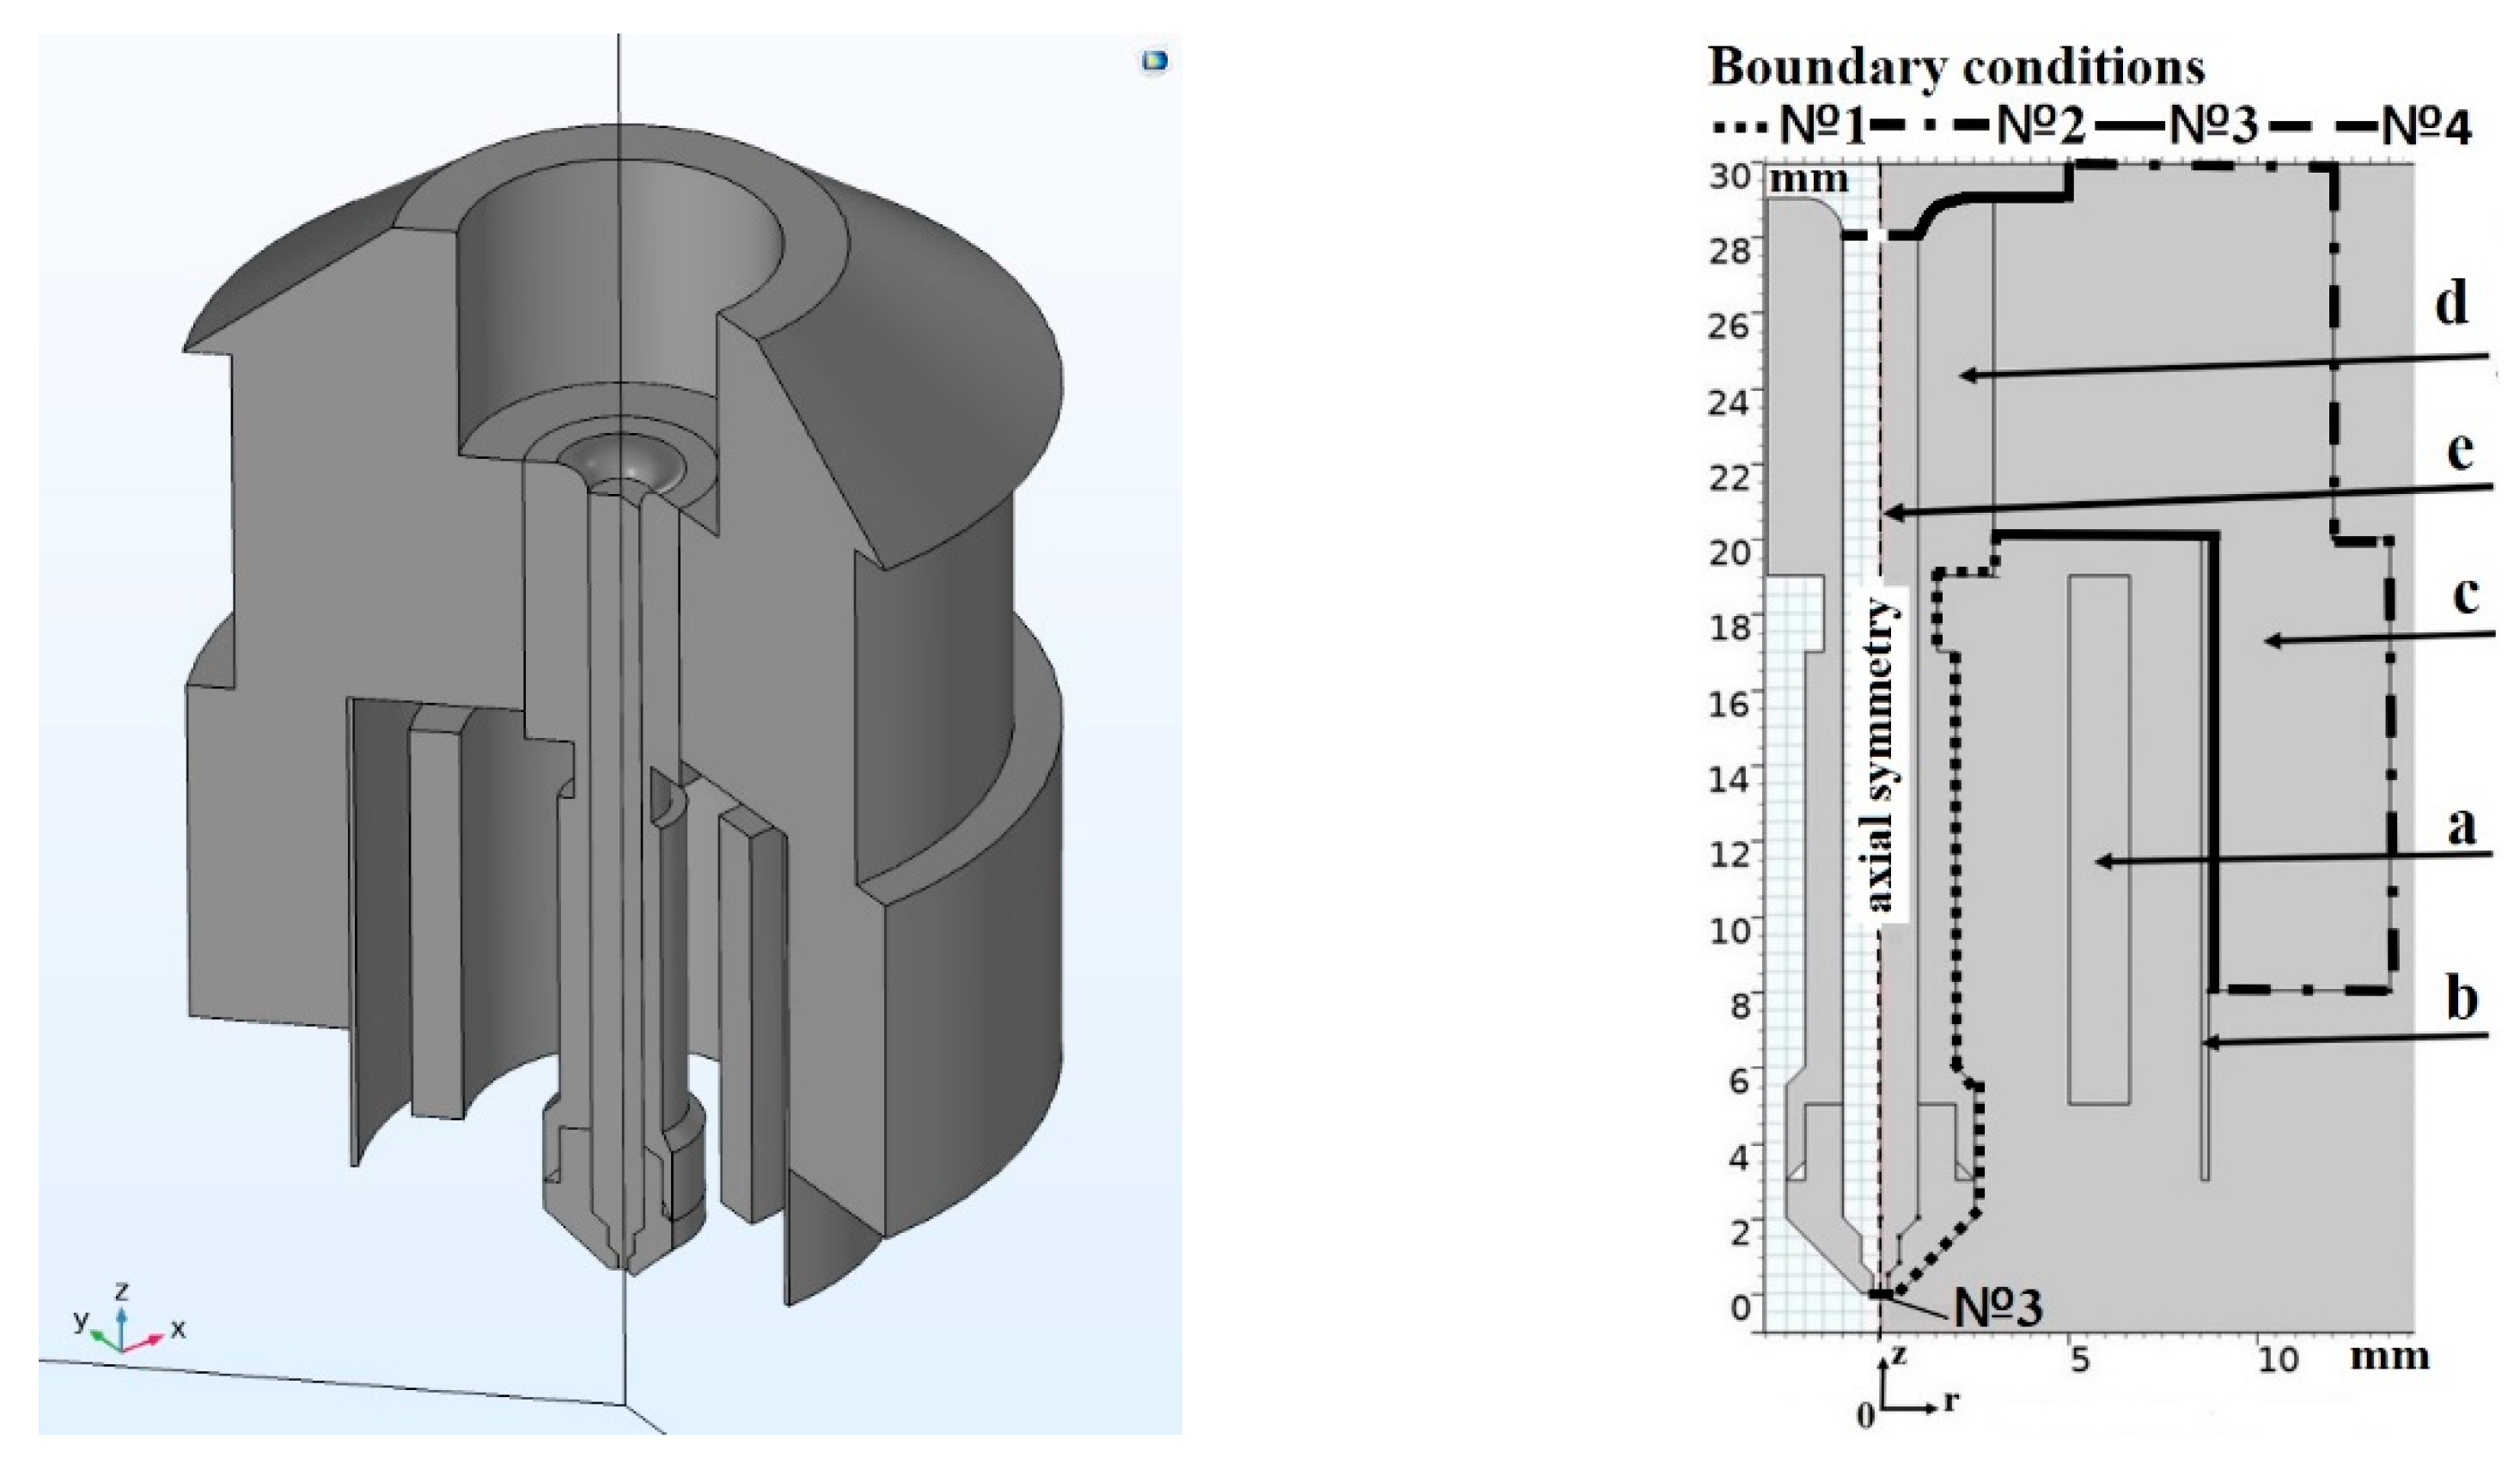
In order to determine the plant (heating nozzle, multilayer inductor coil, heatsink) parameters, a FEM mathematical model connecting the thermal and electromagnetic processes of inductive heating of the nozzle during extrusion of the thermoplastic material was developed. The numerical implementation of the formed mathematical model was carried out using the applied software package ComsolMultiphysics. The modelled geometry is shown in Figure 4 and contains the following elements: inductor (Figure 4a), magnetic flux concentrator made of supermalloy 79NM tape (Figure 4b), an aluminum cylindrical heatsink (Figure 4c), a nozzle (Figure 4d), thermoplastic material (polyamide PA 6) (Figure 4e). The design of the plant made it possible to consider the model in a two-dimensional axisymmetric formulation and use the cylindrical coordinate system r0z.
At any specific time, a sinusoidal current I of a given value flows in the winding of the inductor. To describe electromagnetic processes, a system of differential equations with respect to the magnetic vector potential [57], which has a single component A ϕ : A = ( 0 , A ϕ , 0 ) , was used, where the magnetic flux density B = × A .
In order for A to be completely determined when solving problems in an alternating electromagnetic field, the Lorentz gauge is applied (1):
A + μ 0 μ ε 0 ε φ e t = 0 .
For the domains (d) and (c), occupied with nozzle and heatsink (2):
j ω σ A + × ( μ 0 1 μ 1 × A ) = 0 ;
including i-th turn of inductor winding (a) (3):
j ω σ A + × ( μ 0 1 μ 1 × A ) = σ U i 2 π r , U i = I + S i j ω σ A ϕ d S i σ S i 1 2 π r d S i , I = S i J ϕ d S , J ϕ = j ω σ A ϕ + σ U i 2 π r ;
occupied by the magnetic flux concentrator (b) in a similar manner to (3) when I = 0. For the outer air and thermoplastic material (e) (4):
× ( μ 0 1 μ 1 × A ) = 0 ,
where σ is the electrical conductivity of the material; ω is the angular frequency; j is the imaginary unit; ε0 and µ0 are electric and magnetic constants; ε and µ are relative dielectric and magnetic permeability of the medium; φe is the electric scalar potential; J ϕ is the current density in the inductor; J is the current density induced in the nozzle volume; r is the radial coordinate; Si is the cross-sectional area of the i-th turn of the inductor winding; U i is the potential difference applied to the i-th turn of the inductor winding; I is the electric current (setpoint) flowing in the turns of the inductor winding. At the boundaries of the computational domain (Ø100 × 100 mm) the condition of magnetic isolation is accepted: A = 0 . On the axis 0z of symmetry, the following condition is accepted: A n = 0 , where n is the normal vector on the boundary; t is the time. At boundary (№4), the polymer is fed into the nozzle.
The non-stationary thermal process in the nozzle area (d), thermoplastic (e), and heatsink (c) is described by the heat transfer Equation (5):
p C p T t + p C p v T ( λ T ) = q ,
where ρ, Cp, and λ denote the density, specific heat capacity, and thermal conductivity of the relevant materials; v is the speed equal to zero for all domains except thermoplastic (e). The ratio of extrusion speed Vext to thermoplastic velocity in the nozzle channel Vf is close to V e x t = V f ( D n / d n ) 2 , where Dn is the diameter of the inner channel of the nozzle equal to 2 mm, dn is the nozzle forming hole diameter is 0.4 mm. In this context Vf usually takes the values from 0.5–5 mm per sec and it is determined by the feeder. Heat dissipation during the flow of a viscous liquid is ignored, since it is several orders less than the heat supplied from the heated nozzle [58,59,60]. Moreover, it is known from [61] that until the thermoplastic reaches the nozzle output, its melting occurs mainly at the boundary with the channel walls. Then, when assessing the influence of the polymer velocity through the nozzle channel on the temperature of the nozzle, the polymer was considered as a solid body, regardless of its temperature. The conditions of constant consumption (6) were set:
v = 0 .
where q is the specific capacity of the volume heat source. Heat is generated due to the flow of HF currents qr and magnetic hysteresis losses qm (7):
q = q r + q m , q r = J J * 2 σ = 1 2 ω 2 σ ( A ϕ A ϕ * ) , q m = 1 2 R e ( j ω B H * ) .
On the boundary (№1) corresponding to the surface of the nozzle, the conditions of radiation and convection (8) were set:
λ T n = ε T σ s b   ( T 4 T 0 4 ) + k ( T T 0 ) ,
where σsb is the Stefan–Boltzmann constant. The surface emissivity of stainless steel (AISI420) was taken equal to ε T = 0.2 . The heat transfer coefficient of steel and aluminum to air was taken equal to k = 20 W/(m2·K). The ambient temperature was taken equal to T0 = 20 °C on the boundary (№2) in a similar way to (№1) without radiation. On the boundary (№3) conditions of the thermal insulation are the following: λ T n = 0 . On the boundary (№4) for the polymeric material, the following Equation (9) was set:
p C p v ( T T 0 ) = λ T n .  
On the axis of symmetry: T r   = 0 . The initial data: A ϕ | t = 0 = 0 ,   T | t = 0 = T 0 . The data for modeling are given in the Table 1.

3.2. Numerical Implementation of the Coupled Model of Induction Heating of the Nozzle during Extrusion of a Thermoplastic

Here and below in Section 2, for measuring the temperature of a lightweight nozzle during the experiments, we used the previously mentioned UT-325 temperature meter with a K-type thermocouple soldered to the nozzle surface at a height of z = 8.5 mm (half the height of the active zone of the nozzle, i.e., half the distance from the tip to the heat break). During the numerical simulation, an ideal contact probe was used in the same position.
In the work of [53], the comparison speed results of the temperature change of a lightweight nozzle and CE were presented. The results of experiments and numerical simulation of the cooling process at different polymer extrusion speeds showed that the temperature change rate of the lightweight nozzle is about six times higher than that of the heated part (hot-end) of the CE and increases with the extrusion speed rising. Due to the high thermal inertia of the heated part of the CE, the sensor is not sensitive to changes in the extrusion speed.
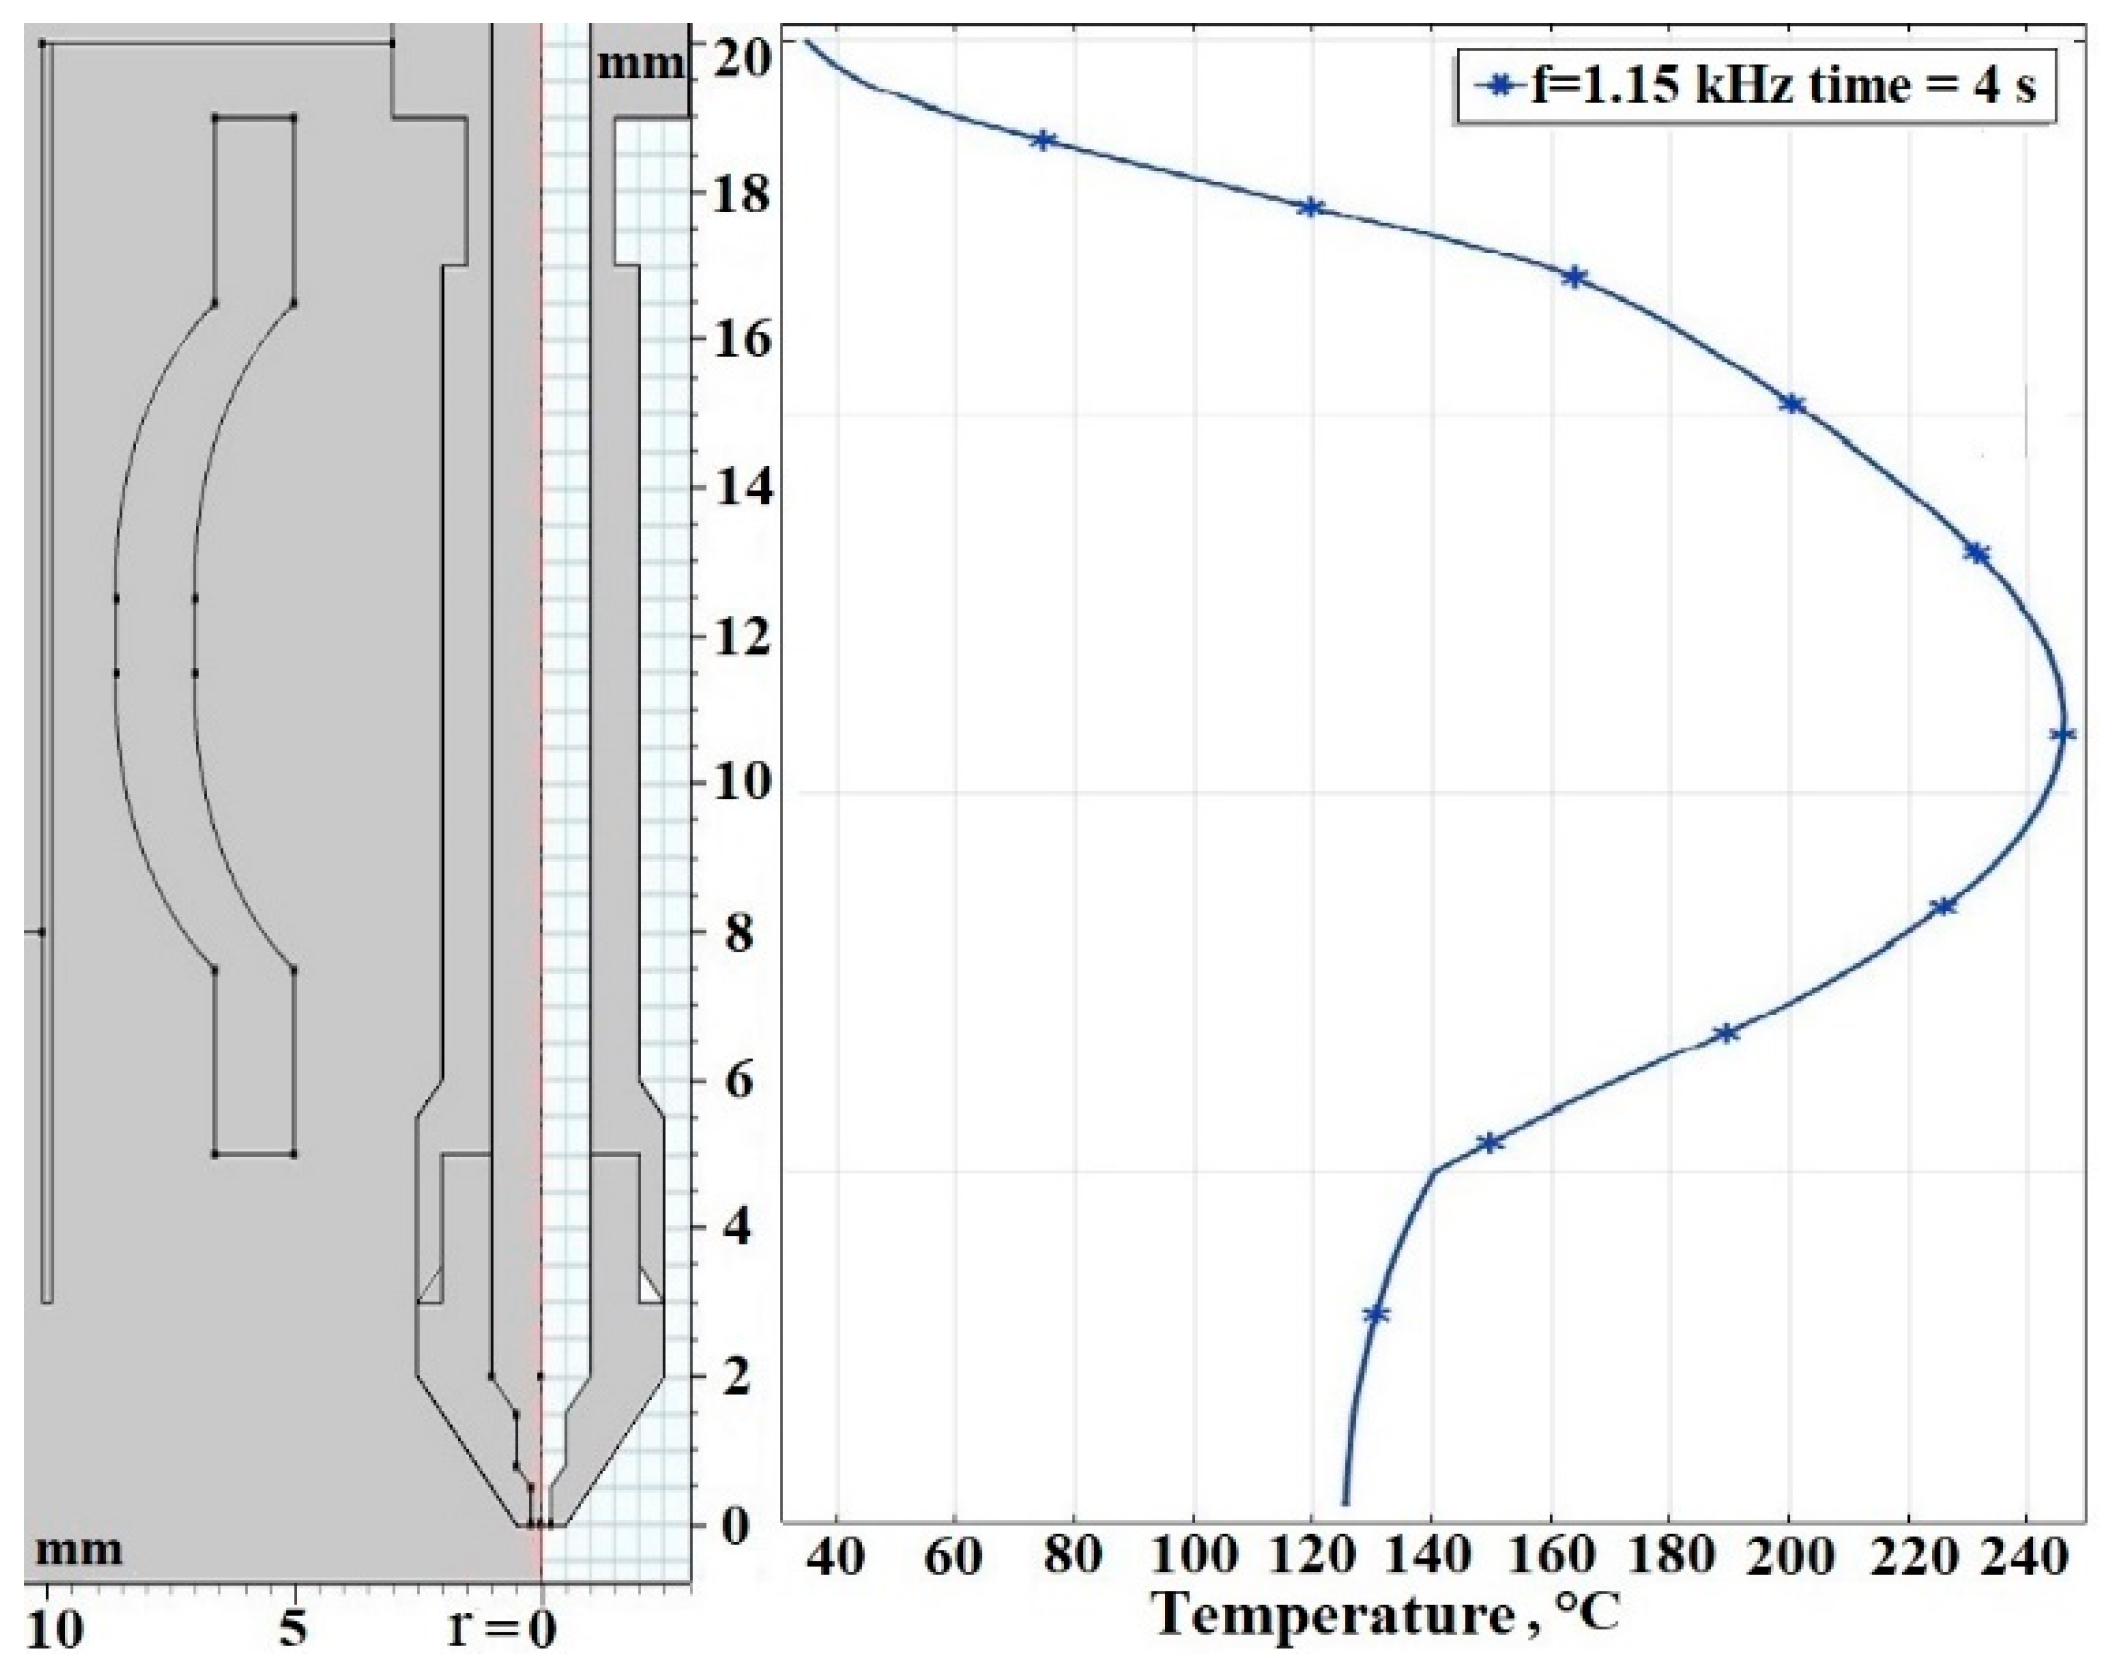
As a result of solving the thermal part of the parametric task, a frequency range that satisfies the requirements of high-speed heating was determined. The corresponding task with a variable parameter, the frequency f of the current I, was numerically solved for t = 4 s, the frequency range from 10 to 160 kHz with a step of 10 kHz. The simulation results showed that the heating rate rises with increasing frequency, but at the same time, an increase of inequality in heating over the nozzle surface along the Z axis is observed. Using of the modified inductor shape results in the increase of the heating uniformity in the active zone of the nozzle along the Z axis from ±35 °C to ±13 °C. By the fourth second of operation of the modified inductor (Figure 5) at the selected frequency f = 115 kHz and a current of 15 A, the nozzle heats up to 250 °C.
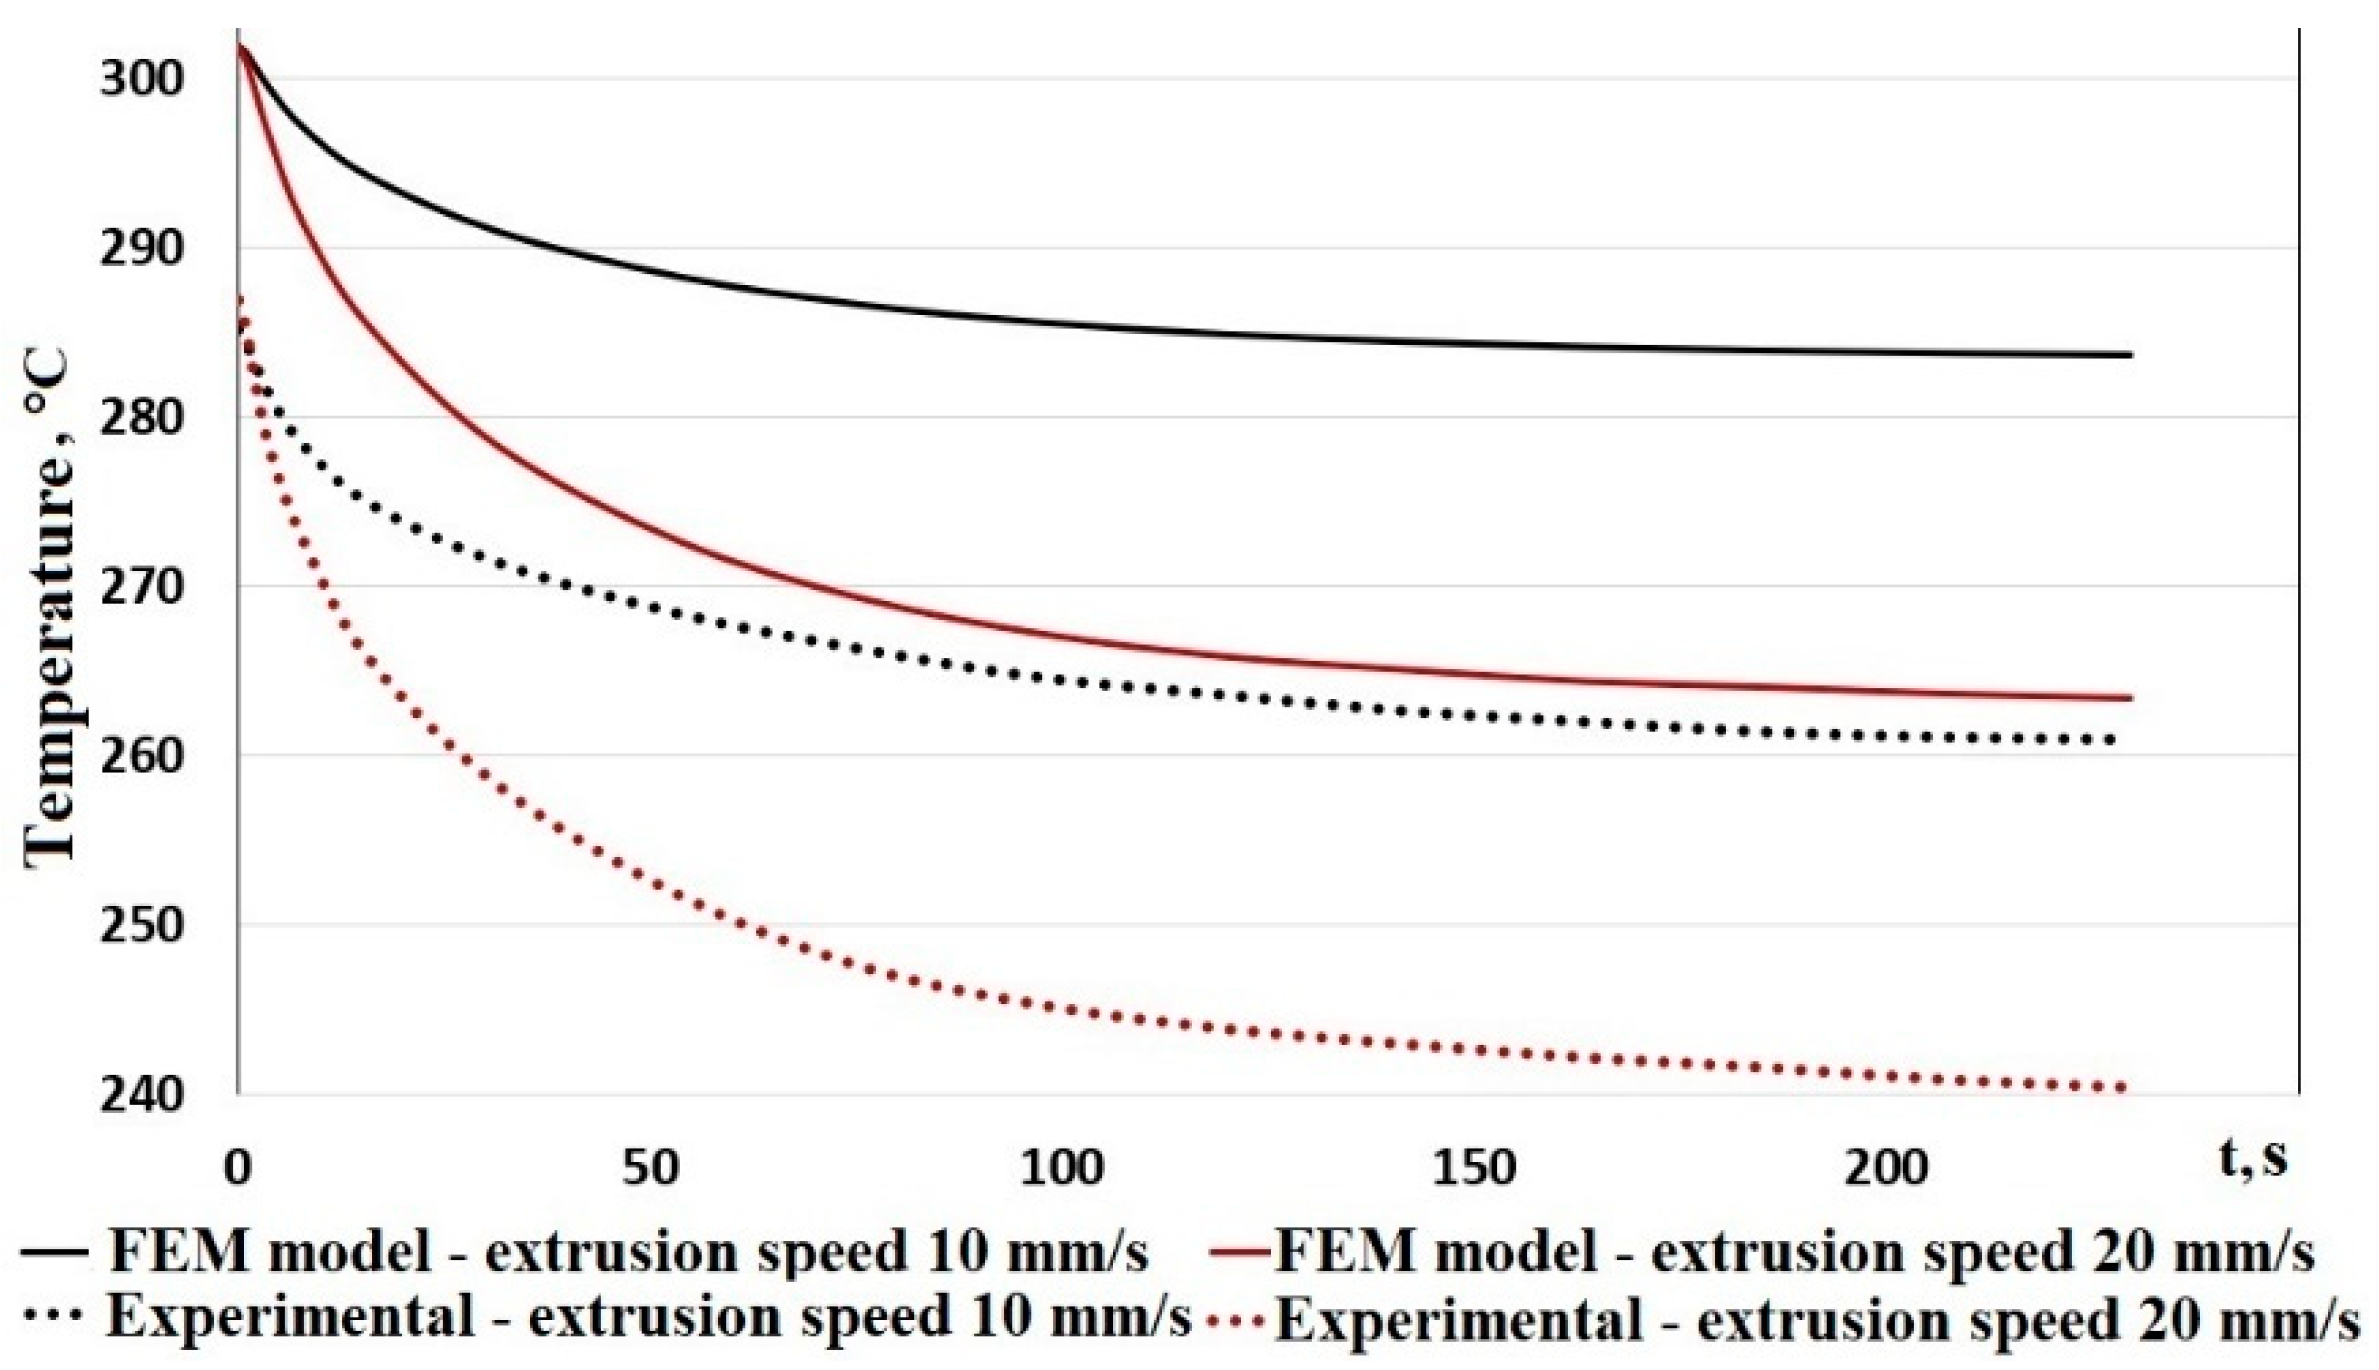
Figure 6 shows the experimental and numerically simulated curves of the nozzle cooling when system is operating in its open-loop mode at a set power level of 5% (in % of the maximum power consumed by the inductor) after the nozzle heating at Vext = 0 mm/s to the stabilization temperature (calculated 306 °C, observed 287 °C) and the beginning of polymer extrusion at Vext = 10 and 20 mm/s. The deviation of the simulation results from the observed temperature readings ranged from 5% to 8%.
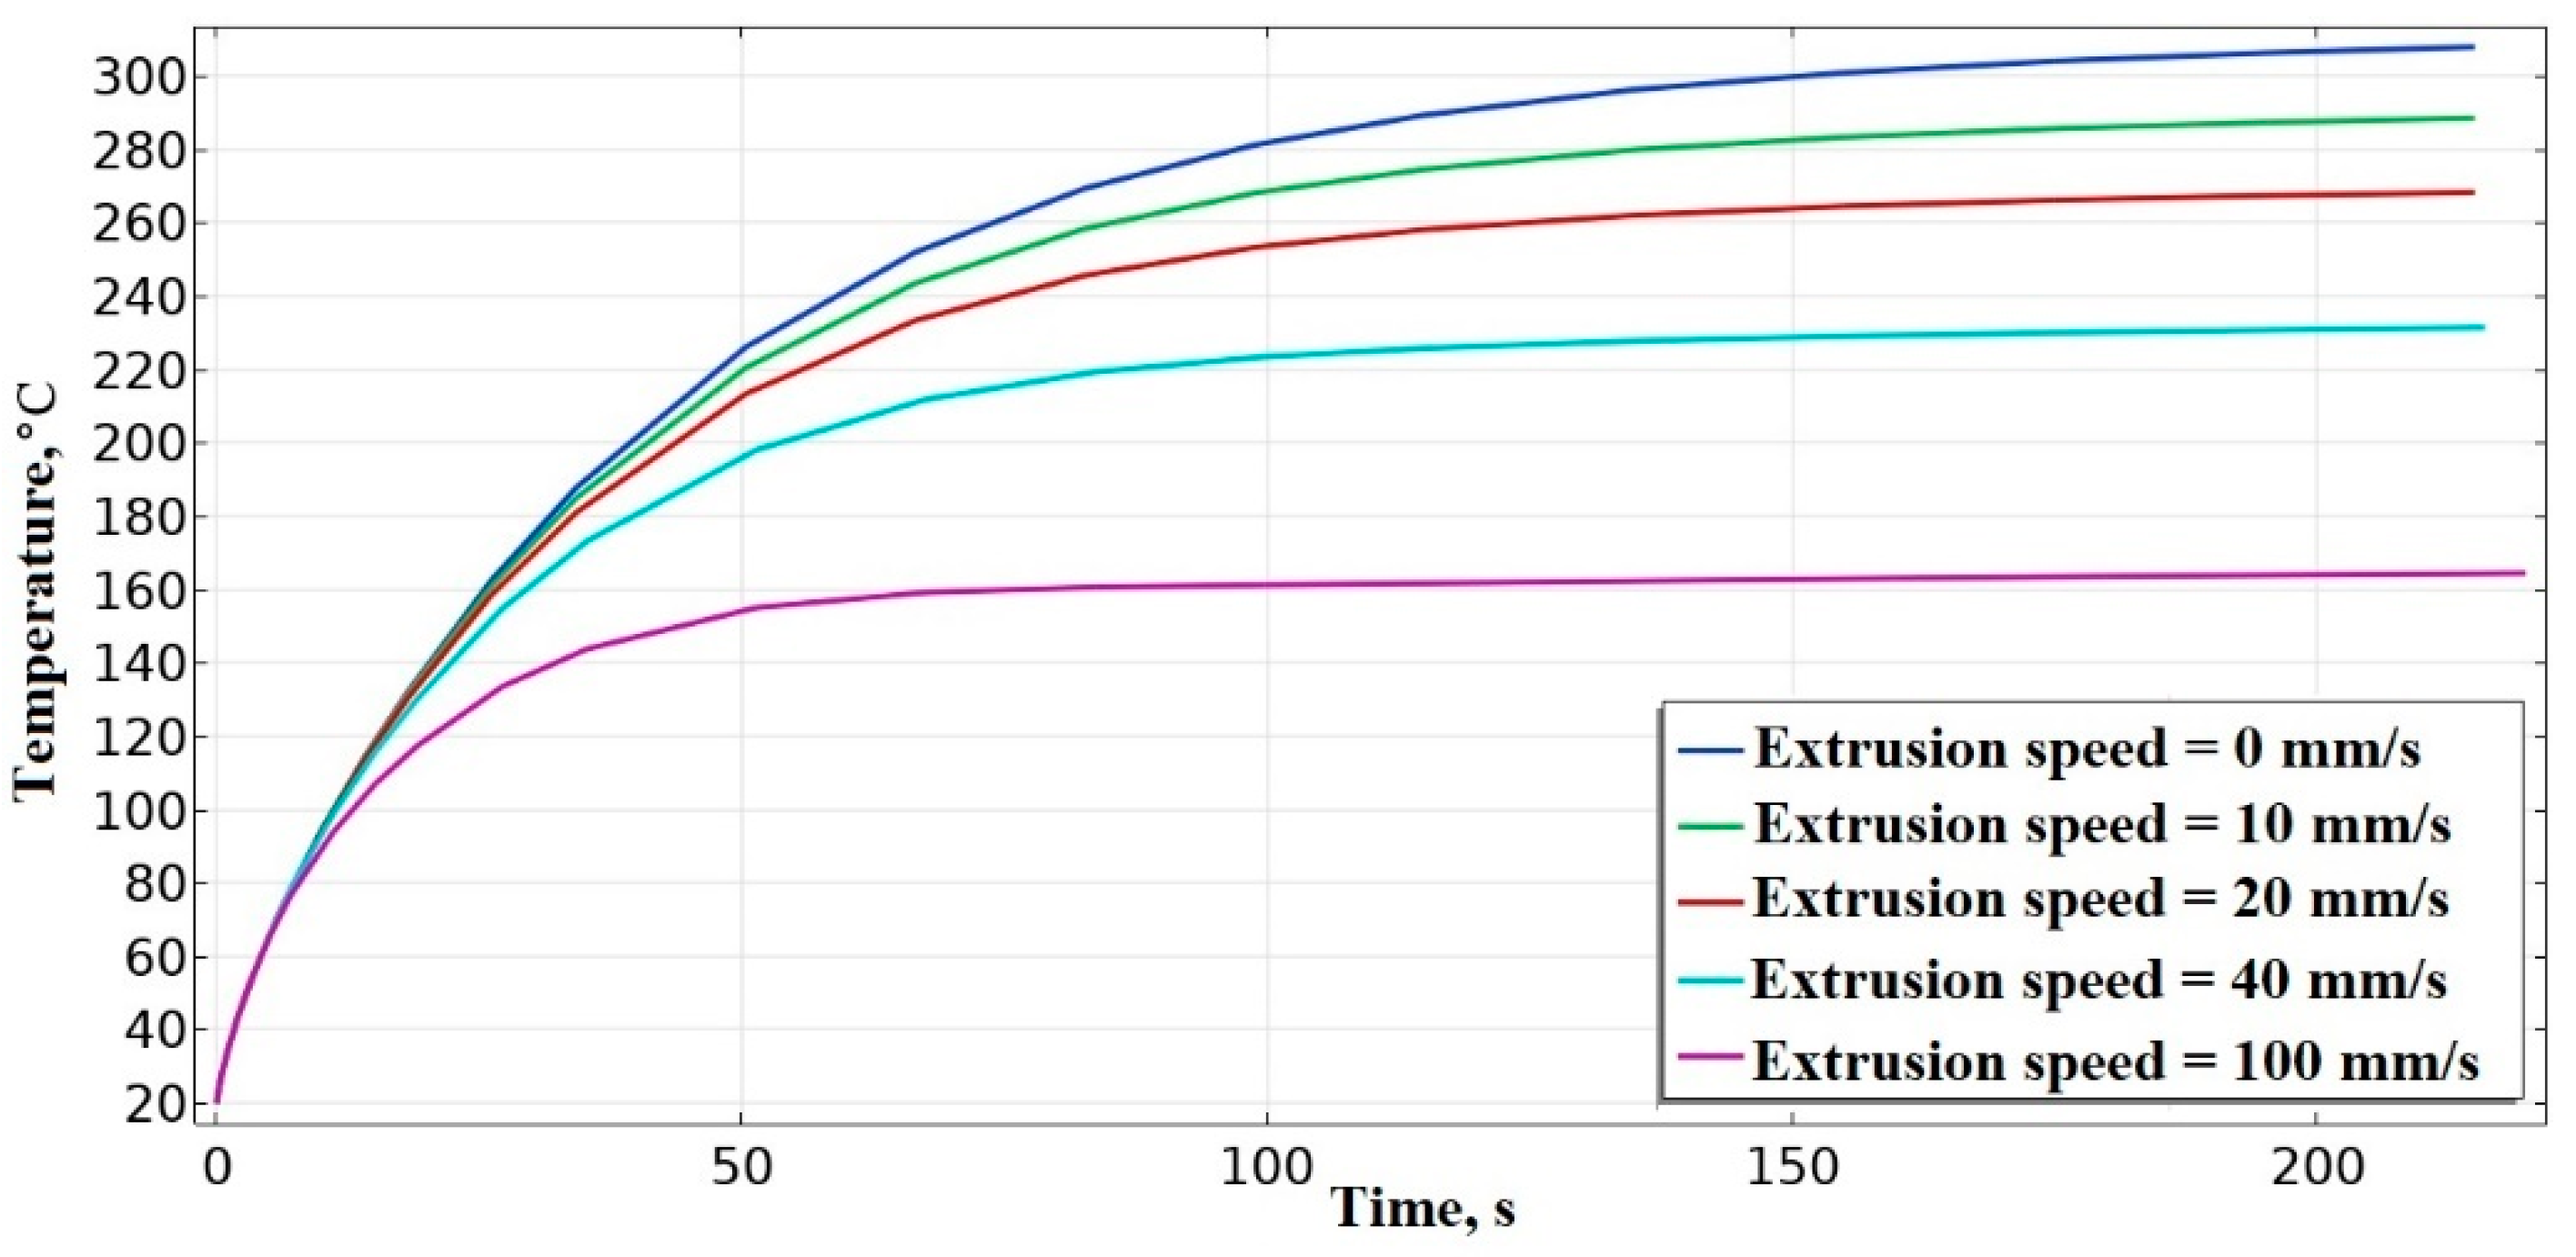
Under heating conditions similar to Figure 5, the influence of the extrusion speed on the control gain and the time constant of the plant was numerically studied. The simulation results showed that an increase in Vext leads to a decrease in the nozzle stabilization temperature. Modeling based on the data presented in Figure 7 shows that in order to maintain the steady-state nozzle temperature of 306 °C while extrusion speed Vext increases from 0 to 100 mm/s, inductor circuit current should be increased 1.45 times, which results in the rise of the power consumed by the inductor by the factor of 2.1. When increasing Vext from 0 to 40 mm/s, inductor current should be increased by 1.19 times with the corresponding increase of the power consumed by the inductor by the factor of 1.42. A decrease of the plant gain with an increase of the extrusion speed is also accompanied by a decrease of the plant time constant (by a factor of 3 with an increase in Vext from 0 to 100 mm/s and by a factor of 2 with an increase in Vext from 0 to 40 mm/s). With an increase of the extrusion speed, the ratio of the speed of change of the plant gain to the speed of change of the plant time constant remains and is approximately equal to 0.7, which is important when evaluating the effect of the disturbance signal (removal of heat from the nozzle during extrusion of the polymer) on the quality of control in the closed-loop TACS of the nozzle.
The temperature sensors used in CE do not provide the measurement speed necessary for adequate temperature control of the lightweight nozzle. The used standard software RepRapFirmware and others have internal limitations, one of which is the minimum discrete time of the PID controller of 1 s.

3.3. Phase-Amplitude Resonant Measurement Method

Indirect temperature measurement by the proposed method is carried out due to the joint analysis of the phase and amplitude characteristics of the inductor current during the HF induction heating of the nozzle. This ensures the measurement of temperature in the layers of the nozzle material involved in the flow of HF current, i.e., the measurement is made close to the polymer.
In order to implement the method, an LCL topology circuit was developed (Figure 8), the component values of which were selected using simulation modeling in the Multisim package so that the selected operating frequency (f = 115 kHz) was close to the L2C1 voltage resonance frequency fv = 116.2 kHz, at which the active nature of the load (inductor L1 with the nozzle) is provided. The topology ensures that the voltage at the output of the HF generator and on the inductor L1 is independent of the load characteristics due to its inclusion in a parallel resonant circuit L1C1. The topology almost completely eliminates the influence of the circuit stray parameters on the characteristics of the current I of the inductor L1 by connecting the L1C1 circuit to the HF generator through the series elements L2 and C2.
During the process of the nozzle temperature changing, a change in the electrical resistivity and relative magnetic permeability of the nozzle material occurs, which leads to a change in the ohmic resistivity and inductance of the inductor L1 circuit, which causes a change in the resonant frequency fv and its deviation from the frequency f, which leads to a change in the amplitude and phase characteristics of the inductor L1 current I.
Figure 8 demonstrates V1 and V2 that are switching power supplies operating with a phase shift of 180° relative to each other, the voltage of which varies from zero to 24 V (voltage V0 of the HF generator).
Resistors R2, R3, R4, R5 are parasitic resistances. R1 is the nozzle resistance. The results of the topology study in the frequency domain demonstrate the current resonance frequency fT = 113.5 kHz as well as the voltage resonance frequency fv = 116.2 kHz. The following values of the resonant circuit, which provide the voltage resonance at a frequency of 116.2 kHz: L1 = 7.8 μH, L2 = 9.62 μH, C1 = 450 nF were obtained. In this case, C2>>C1.
A study in the phase-frequency domain showed that when operating at a frequency fv in the L2C1 circuit, the voltage at the output of the HF generator is in-phase with the current I of the inductor L1, which is also confirmed in [62].
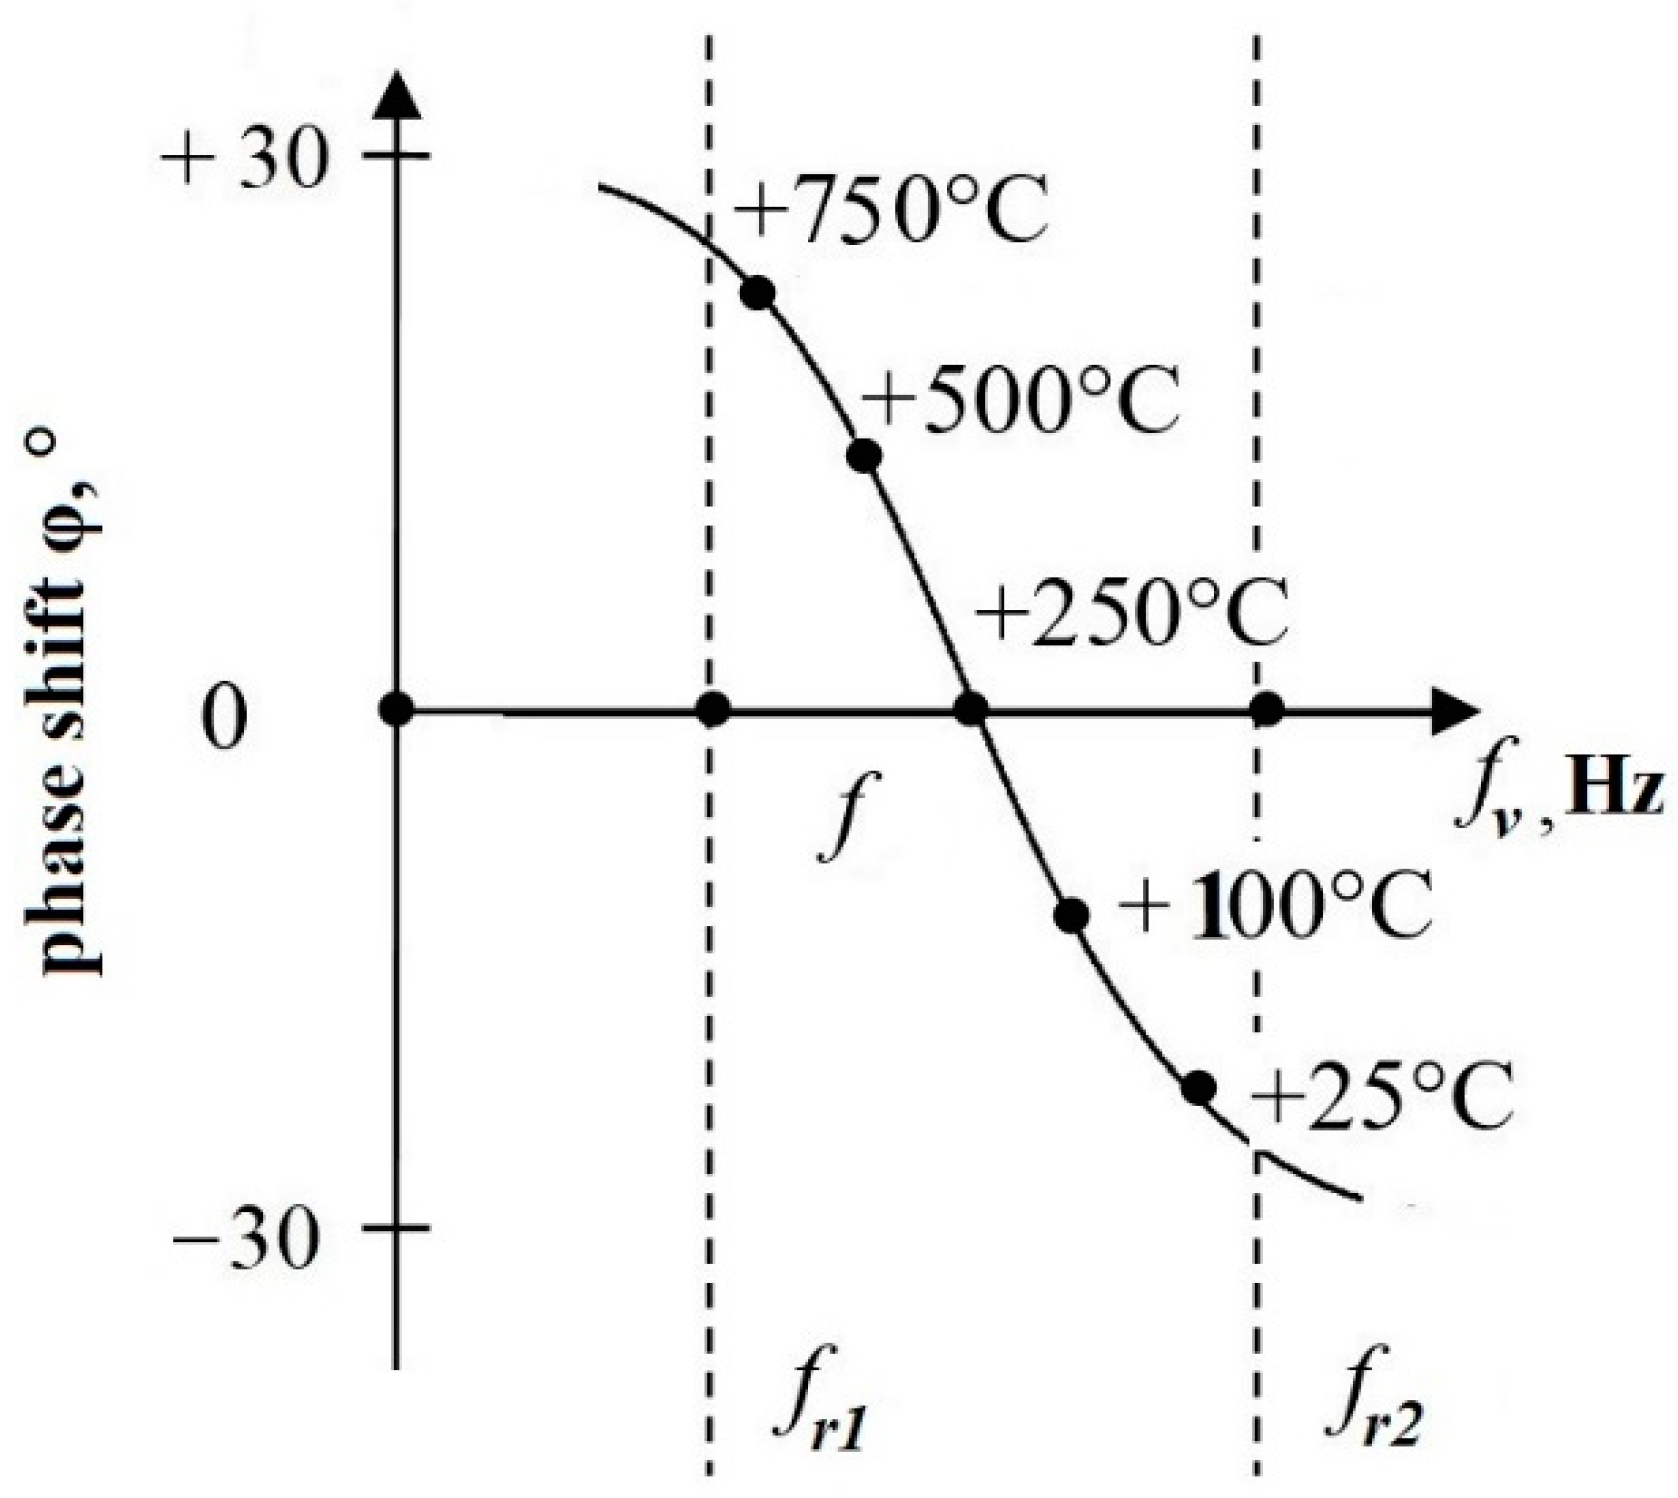
Phase frequency response (PFR) has a form close to linear in the range of about −30 to +30° (in the frequency range fr1...fr2 about ~7 kHz). In this range, it is possible to measure temperature based on phase shift changes without significant loss of accuracy. Figure 9 shows the phase response of the inductor L1 current I, demonstrating an approximate change in the phase shift φ when the frequency fv deviates from the operating frequency f as a result of heating or cooling the nozzle relative to the reference temperature Tr = 250 °C. Under the condition T = Tr, voltage resonance fv = f occurs. The load acquires the desired inductive character (f > fv) when the temperature is above 250 °C.
It is known from [62], that resonance frequency fT, and resonance frequency fv defined as follows (10):
f T = 1 C 1 L 1 , f v = 1 ( C 1 L 1 L 2 ) / ( L 1 + L 2 ) .
Using the PSM method when controlling a full-bridge invertor topology loaded with an LCL circuit and operating on the fv frequency provides the moment when the current I of the inductor L1 passes through zero with an active load (f = fv) at the moment O, corresponding to half the phase shift χ between the switching moments of the left and the right pair of transistors, that is, in the middle (O ≡ χ/2) between the front edges of the control signals Q1 and Q2 (or Q3 and Q4). A change in the temperature of the nozzle leads to the fact that the moment when the current I passes through zero is shifted relative to the moment O.
Due to the active nature of the L3D5D6R1 series circuit, the induced EMF in the L3 coil and the voltage (useful signal UT) on the limiter diode D5D6 are in phase with the current I. The useful signal UT is amplified and shifted to the positive area by introducing a constant offset into the signal, and then subjected to analog-to-digital conversion. Changes in UT at the input of the operational amplifier from −8.25 to 8.25 mV are registered.
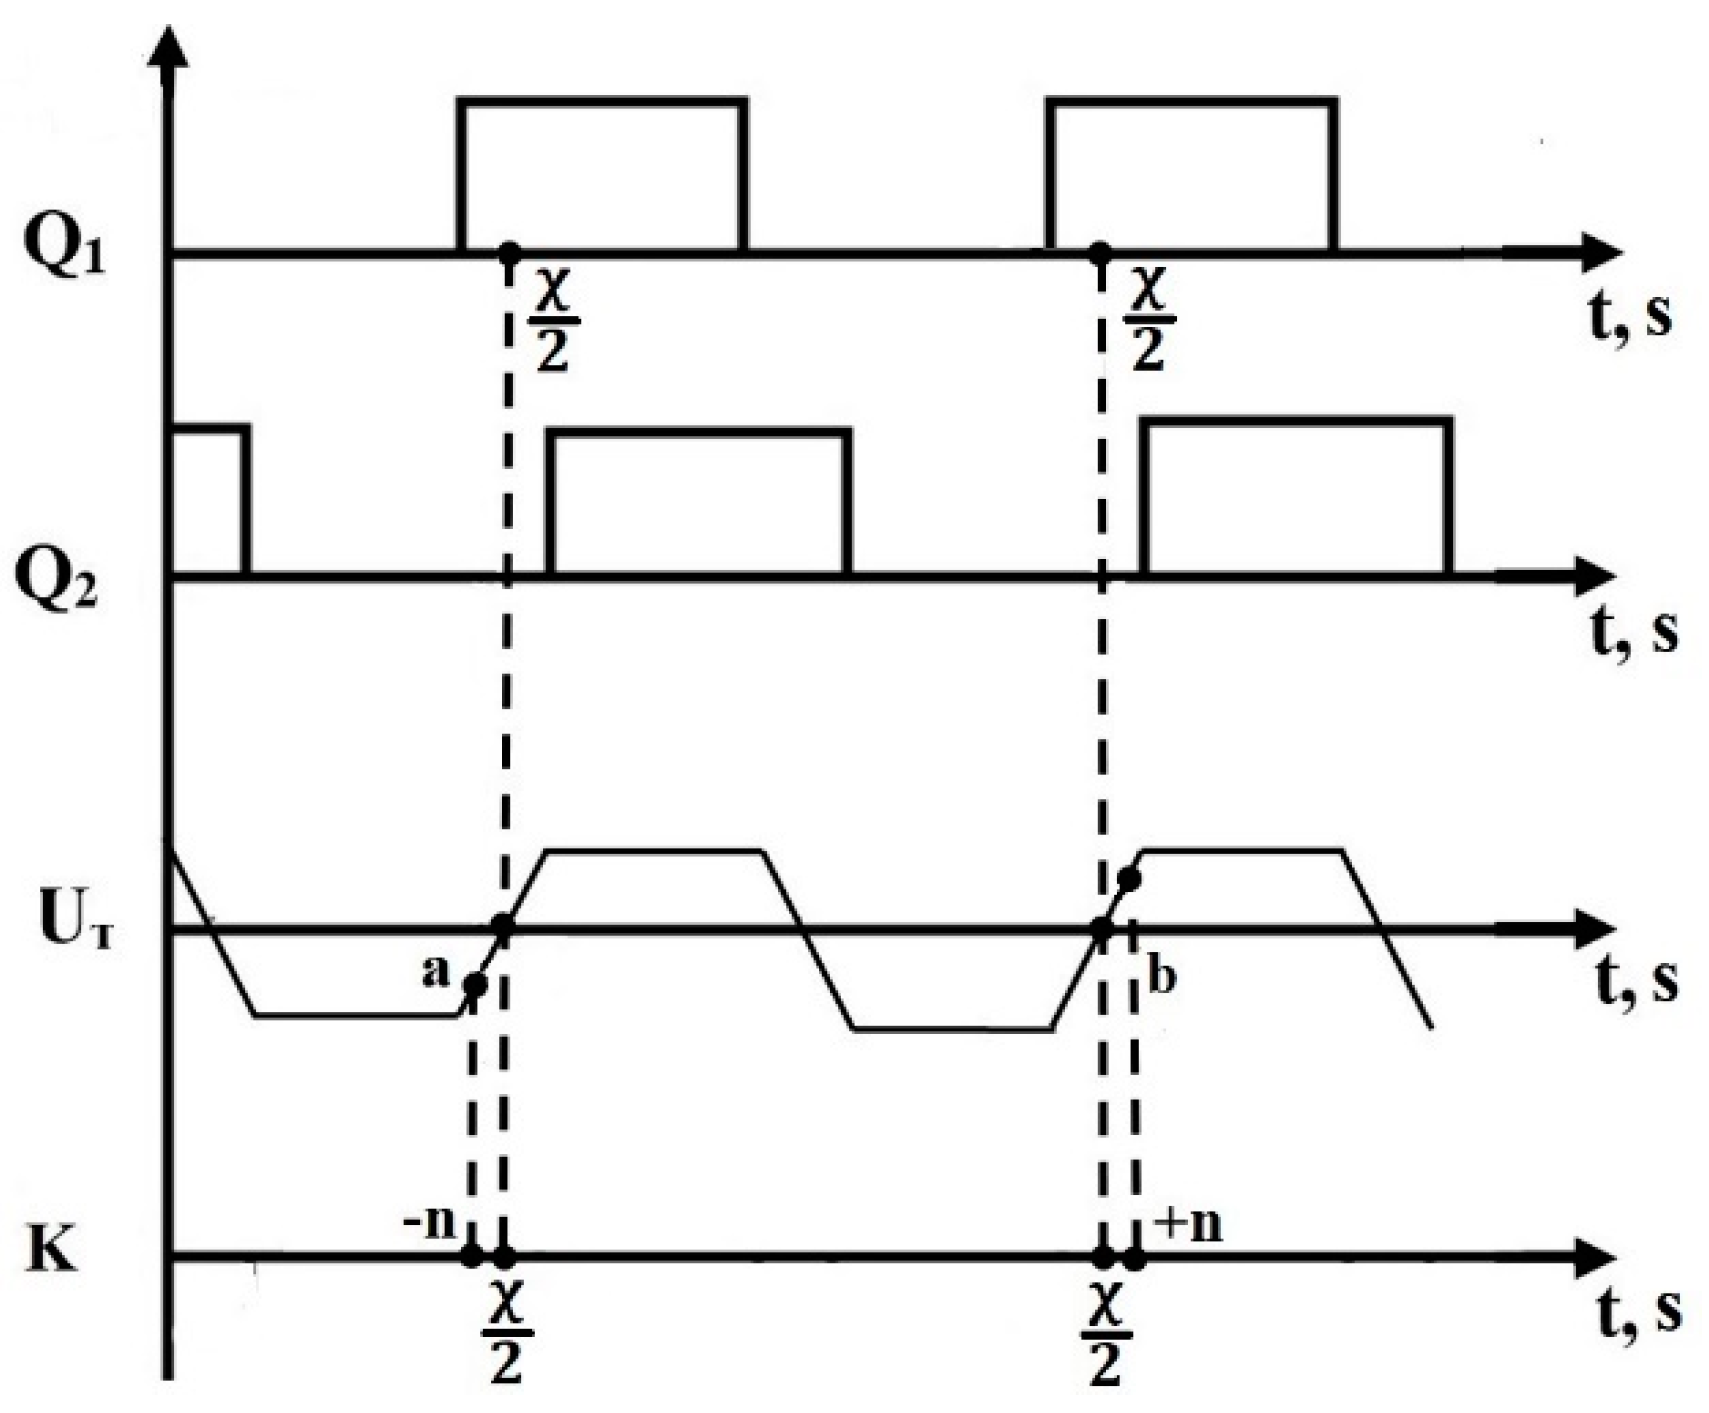
The moments of activation of the analog-to-digital converter (ADC) are synchronized (Figure 10) with the control signals Q1 and Q2 (with the moments of switching transistors) using a common clock source K. Then, each period of the current I of the inductor the moment O ≡ χ/2 is determined, after which using the ADC, a pair of successive measurements is made with a time shift n before and after the moment O (measurement a at the moment O-n, measurement b at the moment O+n), then the constant offset of the useful signal is eliminated, after which the successive measurements a and b are summed. The sum of measurements a and b characterizes the phase shift φ between the current signal of the inductor circuit and the voltage signal at the output of the HF generator, as well as the signal UT amplitude. The sum is interpreted in terms of the generalized parameter Ω, that is measured in millivolts.
As in our previous paper [53], the oversampling and averaging method [63,64] as well as the exponential moving average filter were used to improve the measurement accuracy. The soft switching of transistors, which is ensured when the developed device operates at a frequency f > fv, which is known from [54,62,65], also contributes to the transistor switching noise abatement.
To convert the measured values Ω into the nozzle temperature T, there were used the regression model created in [53] for the amplitude method. This turned out to be possible due to the fact that information about the magnitude of the phase change can be obtained with two specific measurements of the signal amplitude and linear interpolation of the results.
Calibration process of the temperature readings was performed in a closed-loop nozzle temperature control system at Vext = 0 mm/s during several sequential experiment. The measurements were made when the system reached a setpoint value of Tset within the range from 50 to 500 °C in 2 stages, i.e., with a K-type open-package thermocouple located inside the nozzle at a height of 90%, 50% (z = 8.5 mm), 10% of the lower nozzle section, as well as outside the nozzle by soldering a thermocouple to its surface. The calibration results for Tset = 250 °C are presented in Table 2.
The results of the experiment indicate a higher inertia of measurements carried out by the thermocouple method for all cases. During measurements, the output of the system responding to a setpoint value of Tset was estimated based on the previously obtained results for measuring the temperature with the internal location of the thermocouple at a height of 50% (reference temperature), since the thermocouple is a single point sensor and its location at a distance from the most heated point affects the measurement result and overshoot.
The developed method excludes time delays associated with the thermal conductivity of the nozzle or sensor material, non-optimal location of the sensor. Measurement time consists of the ADC conversion delay (0.2 μs [66]), need to wait for the zero-crossing moment of time (delay inversely proportional to the heating frequency f), and the oversampling delay (which depends on the target output resolution). In general, this delay ranges from 10 µs (for ADC resolution of 12 bits, which corresponds to a temperature resolution of 8 °C) to 100 ms with an increase in ADC resolution to 20 bits (corresponding to a temperature resolution of 0.05 °C). The results of the experiments demonstrate the accuracy of measuring the nozzle temperature by the developed method of ±3 °C at a measurement time of 100 μs and ±0.2 °C at a measurement time of 20 ms (output resolution of the ADC is 17 bits) in the temperature range from 50 to 500 °C.

3.4. Development of a Method for Controlling the Temperature of the Lightweight Nozzle

The shape of the heating curve of the nozzle in an open-loop system with a step input on the plant could be treated to a first order plant [67]. When developing the ACS, the nozzle temperature was assumed to be Vext = 0 mm/s, except for the subsection devoted to assessing the effect of a disturbance signal on the quality of control. The experimental value of the time constant T1 according to the plant response to a step input was 12 s.
The gain k0 of the plant was determined as the ratio of the process value (output, nozzle actual temperature T) to the stimulus (phase shift χ) in the open-loop TACS during heating at a frequency f = 115 kHz. In a closed-loop ACS, during the control process, any value of the nozzle temperature can correspond to any value of the power consumed by the inductor, i.e., phase shift χ.
Thus, the plant gains were calculated for the entire range of phase shift values χ. For this purpose, there was used the developed model of eddy currents heating of the lightweight nozzle, where the input value is the current I, and the output is the temperature T of the nozzle. The values of the current I of the inductor L1 for the entire range of phase shift χ values were determined using the simulated model of the LCL circuit in the Multisim package, the input value for which is the voltage of the sources V1 and V2, the values of which are proportional values of the phase shift χ.
The closed-loop TACS of the nozzle in a first approximation was considered as linear. A classic PID controller was used. As a setpoint, the specified value of the temperature Tset of the nozzle is taken, and the actual temperature of the nozzle T is taken as the process value (output). The stimulus, i.e., the output of the PID controller, is the normalized phase shift χ. The transfer function of the plant WP(s) is expressed through the Formula (11):
W p ( s ) = k 0 ( T 1 s + 1 ) .
e(t) is the magnitude error between setpoint value of Tset and feedback signal (measured nozzle temperature T).
Time-discrete PID controller transfer function (12):
W R ( z ) = q 0 z 2 + q 1 z + q 2 z ( z 1 ) ,
where q 0 = k p + k d T d ; q 1 = k p + k i T d 2 k d T d ;   q 2 = k d T d .
Where Td is the discrete time of the control device. Then one can obtain (13):
W R ( z ) = k p + k i T d z 1 + k d ( z 1 ) T d z ,
WD(s) is the transfer function of the measuring device, which introduces pure time delay (14):
W D ( s ) = e s τ ,
where τ is the time delay equal to the time spent on registration and processing of the feedback signal (τ = 20 ms for 17-bit target resolution of the oversampled output). The discrete time for the PID controller is assumed as follows Td = 20 ms.
Modeling the operation of a discrete control system in the Simulink application of the Matlab package made it possible to determine the coefficients of the PID controller, to evaluate the quality of regulation when operating over the entire operating temperature range of the nozzle (Tset = 260, 440 and 750 °C).
Table 3 shows the results of an experiment on temperature control by linear ACS with PID controllers optimized for the selected values of Tset.
The experiment showed that with such approximation, the use of a classical PID controller leads to significant deviation of the transient response parameters from the estimated ones: the maximum settling time is 9.6 s, the maximum overshoot is 8% vs. the estimated parameters of 3 s and 1%, respectively, for all selected Tset.
Before proceeding to the reasons for these deviations, it is also worth paying attention to assessing the influence of the polymer material extrusion speed on the quality of control. For this, there were used the results presented in Section 2 in Figure 7. The results show the decrease in k0 and T1 of the plant as Vext increases. For a linear ACS with a PID controller optimized for Tset = 260 °C, the coefficients kp, ki, kd are equal to 0.034, 0.0115 1/s, and 0.0017 s, respectively, and k0 = 1181. Extreme cases at Vext = 40 and 100 mm/s, for which there is a decrease in the gain of the plant by 1.4 and 2 times, and the time constant by 2 and 3 times, respectively were considered. Simulation results with the same kp, ki, kd and substitution of values for 40 mm/s (k0 = 843, T1 = 6 s) and for 100 mm/s (k0 = 590, T1 = 4 s) into the linear ACS model demonstrate reduction of overshoot and settling time with an increase in extrusion speed. At Vext = 40 mm/s, the settling time is 2.4 s, and the overshoot is 2.7%; 1.6 s and 1.1% at Vext = 100 mm/s, respectively. Thus, increasing the extrusion speed has a positive effect on the quality of nozzle temperature control.
The non-linear nature of the dependence of the power consumed by the inductor on the phase shift χ was established, and then its linearization was carried out. The concept of the power level of the HF generator from 0% to 100% is introduced, on which the power consumed by the inductor depends linearly, and the phase shift χ has a quadratic dependence (with this approximation R2 = 0.999).
The results of linearization and estimated steady-state temperatures in an open-loop system for some values of the phase shift χ are shown in Table 4.
In order to ensure constant control quality over the entire operating temperature range of the nozzle, the control system was linearized. It was found that the dependence of the nozzle temperature on the power consumed (and hence on the power level) by the inductor is close to linear. Then, a change in the power level by 1% corresponds to a change in the nozzle temperature by about 55 °C. Using the obtained relation, the temperature error e(t) is converted into a normalized power level at the input of the classical PID controller, which forms a new stimulus. On the basis of the microcontroller, the new stimulus is further converted into a phase shift χ by the method of piecewise linear interpolation.
The plant gain was defined as the ratio of the steady-state nozzle temperature to the normalized power level at the output of the PID controller: k0 = 5500. The block diagram of the linearized TACS is shown in Figure 11. The block that reflects the conversion of the temperature error into the normalized power level is an instantaneous element W L ( s ) = k L , where k L   = 1/5500.
To simulate a real control system, limits on the PID controller output were introduced. To solve the problem of an integral windup caused by introducing such limits, a clamping algorithm was used [68].
Simulation of a discrete control system operation in the Simulink application of the Matlab package made it possible to evaluate the quality of regulation. The coefficients kp, ki and kd of the PID controller after calculation were 41.25, 13.76 1/s, 2.13 s, respectively.
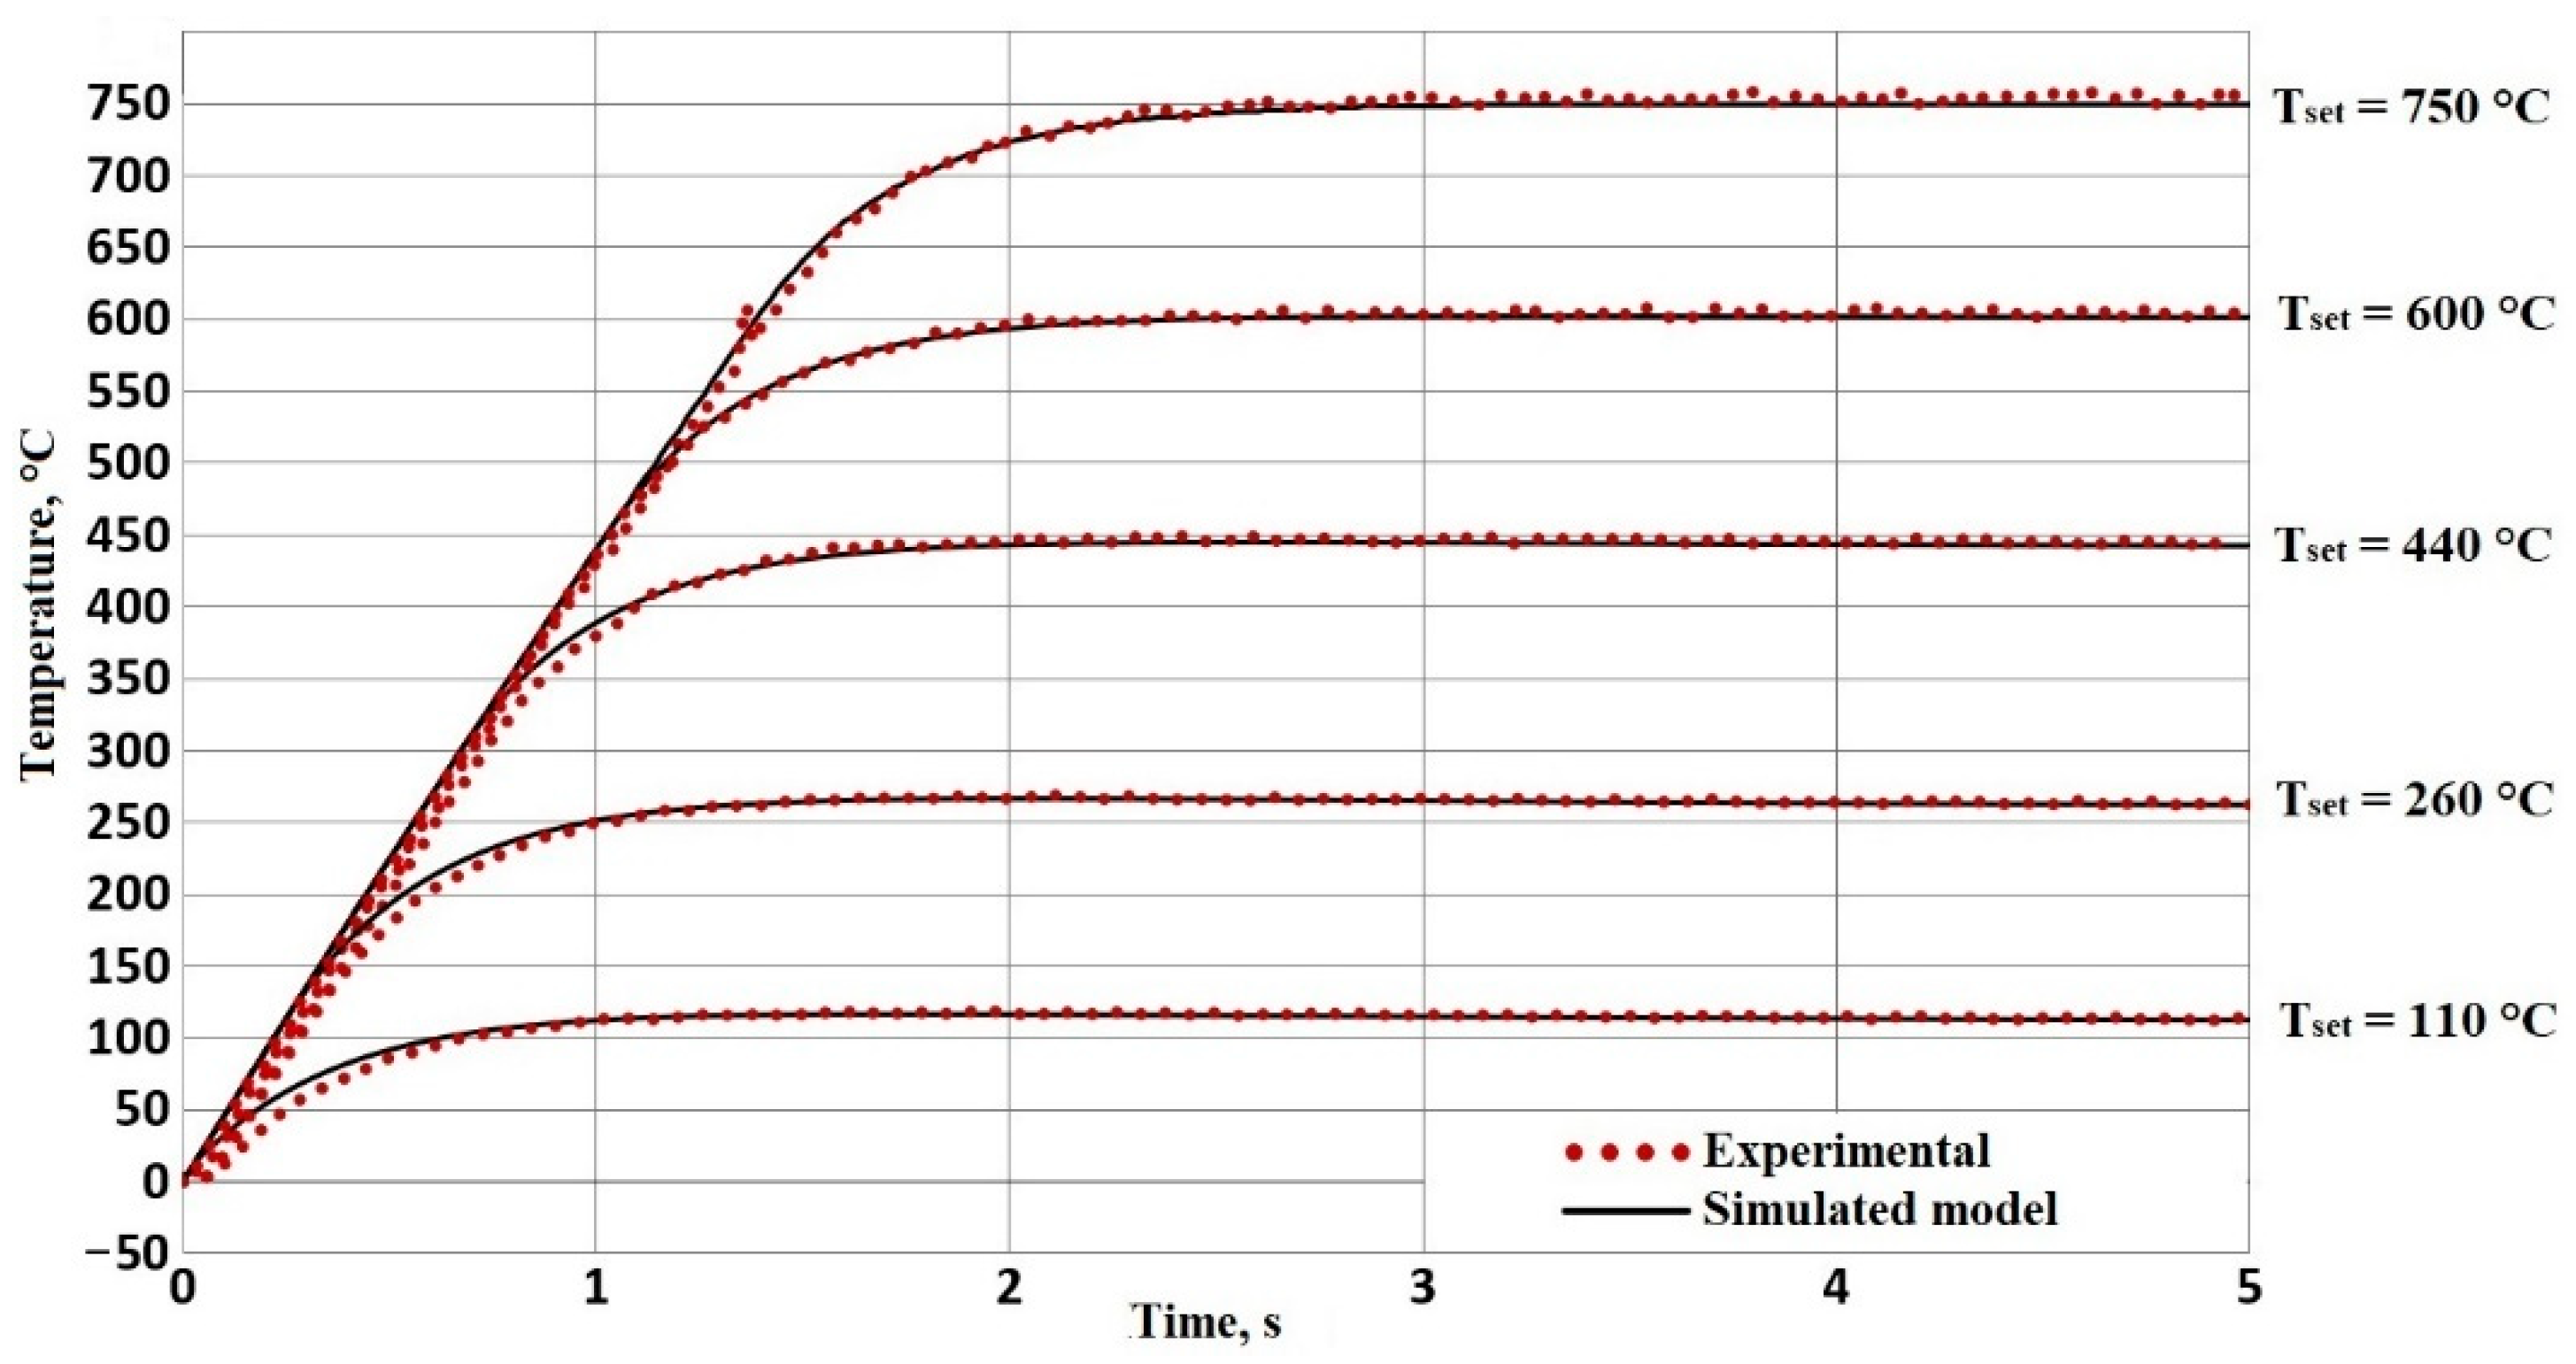
Figure 12 shows the experimental and estimated transient responses in a closed-loop ACS at setpoints of 110, 260, 440, 600, and 750 °C. The simulation results show the settling time from 1.5 to 2.5 s, and the maximum overshoot is from 0.5 to 2%, the steady-state error is 0. The stability of a closed-loop ACS is shown. The phase margin is 93.9°, the gain margin is 13.6 dB. The results of experiments with similar setpoints demonstrate a deviation from the simulation data within 1% in terms of overshoot and ±0.2 s in terms of settling time.

3.5. Experimental Verification of the Proposed Control Method

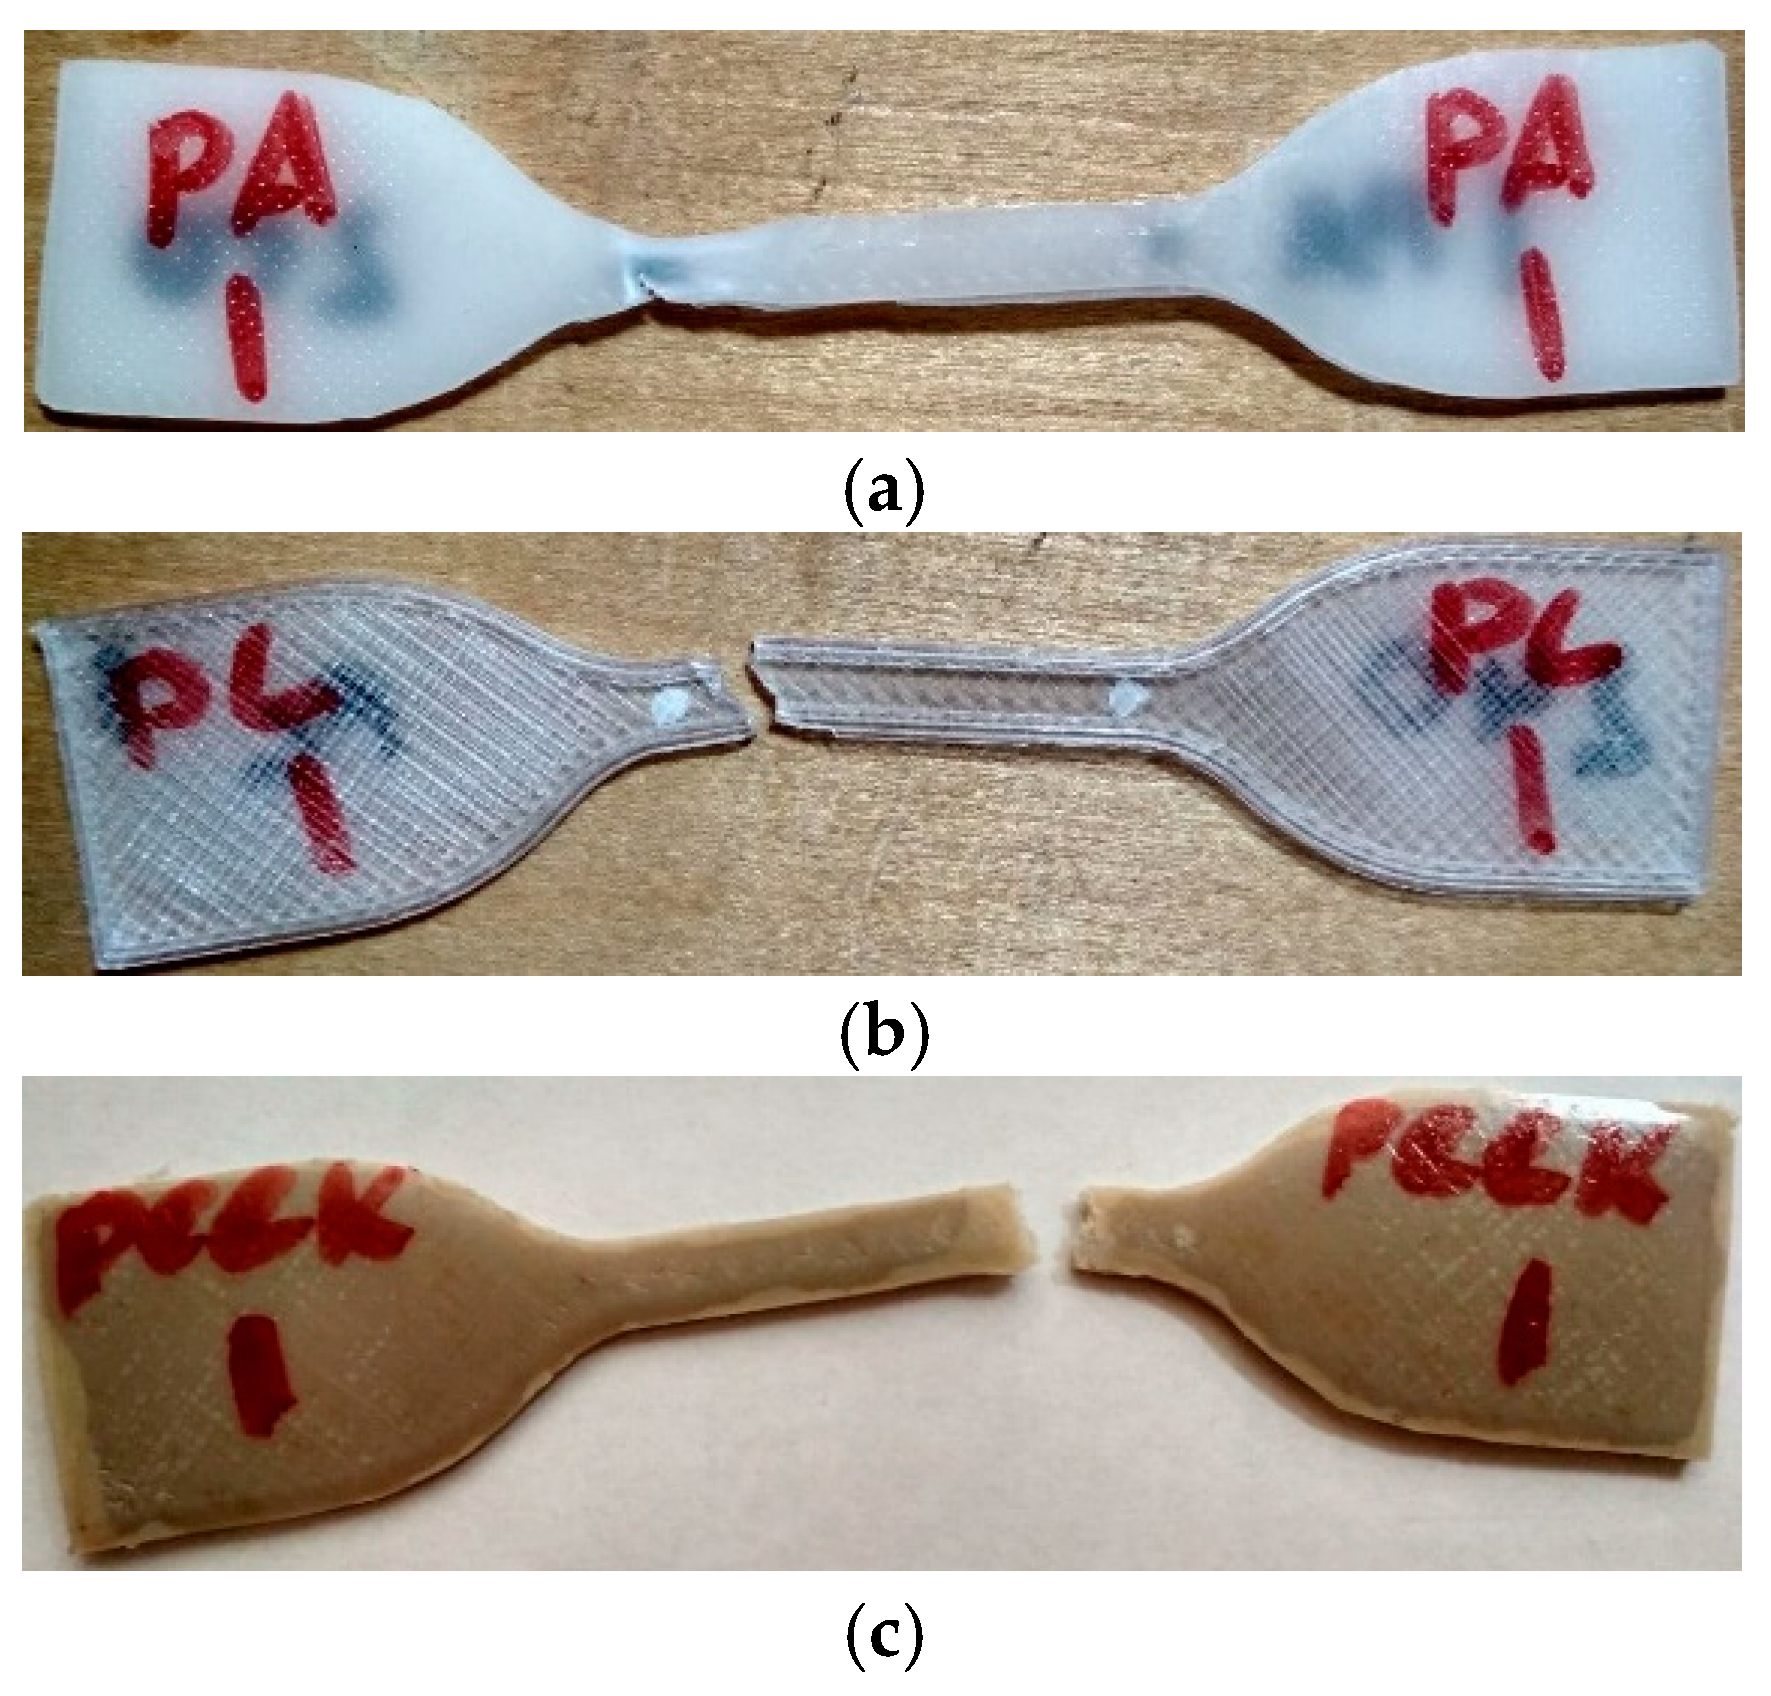
The device that implements the developed method of temperature control was integrated into an FDM-printer. To test the performance of the developed method, a number of test samples were made from materials, such as polyamide PA 6, PC, and PEEK. Tensile stress test was carried out in accordance with the requirements of State All-Union standard 11262-2017 [69], according to which test samples (type 1) were made with overall dimensions: 115 × 25 × 2 mm. The test samples were printed with a software-specified 100% filling of the internal volume, with the printing parameters presented in Table 5. The external appearance of some test samples after testing is shown in Figure 13.
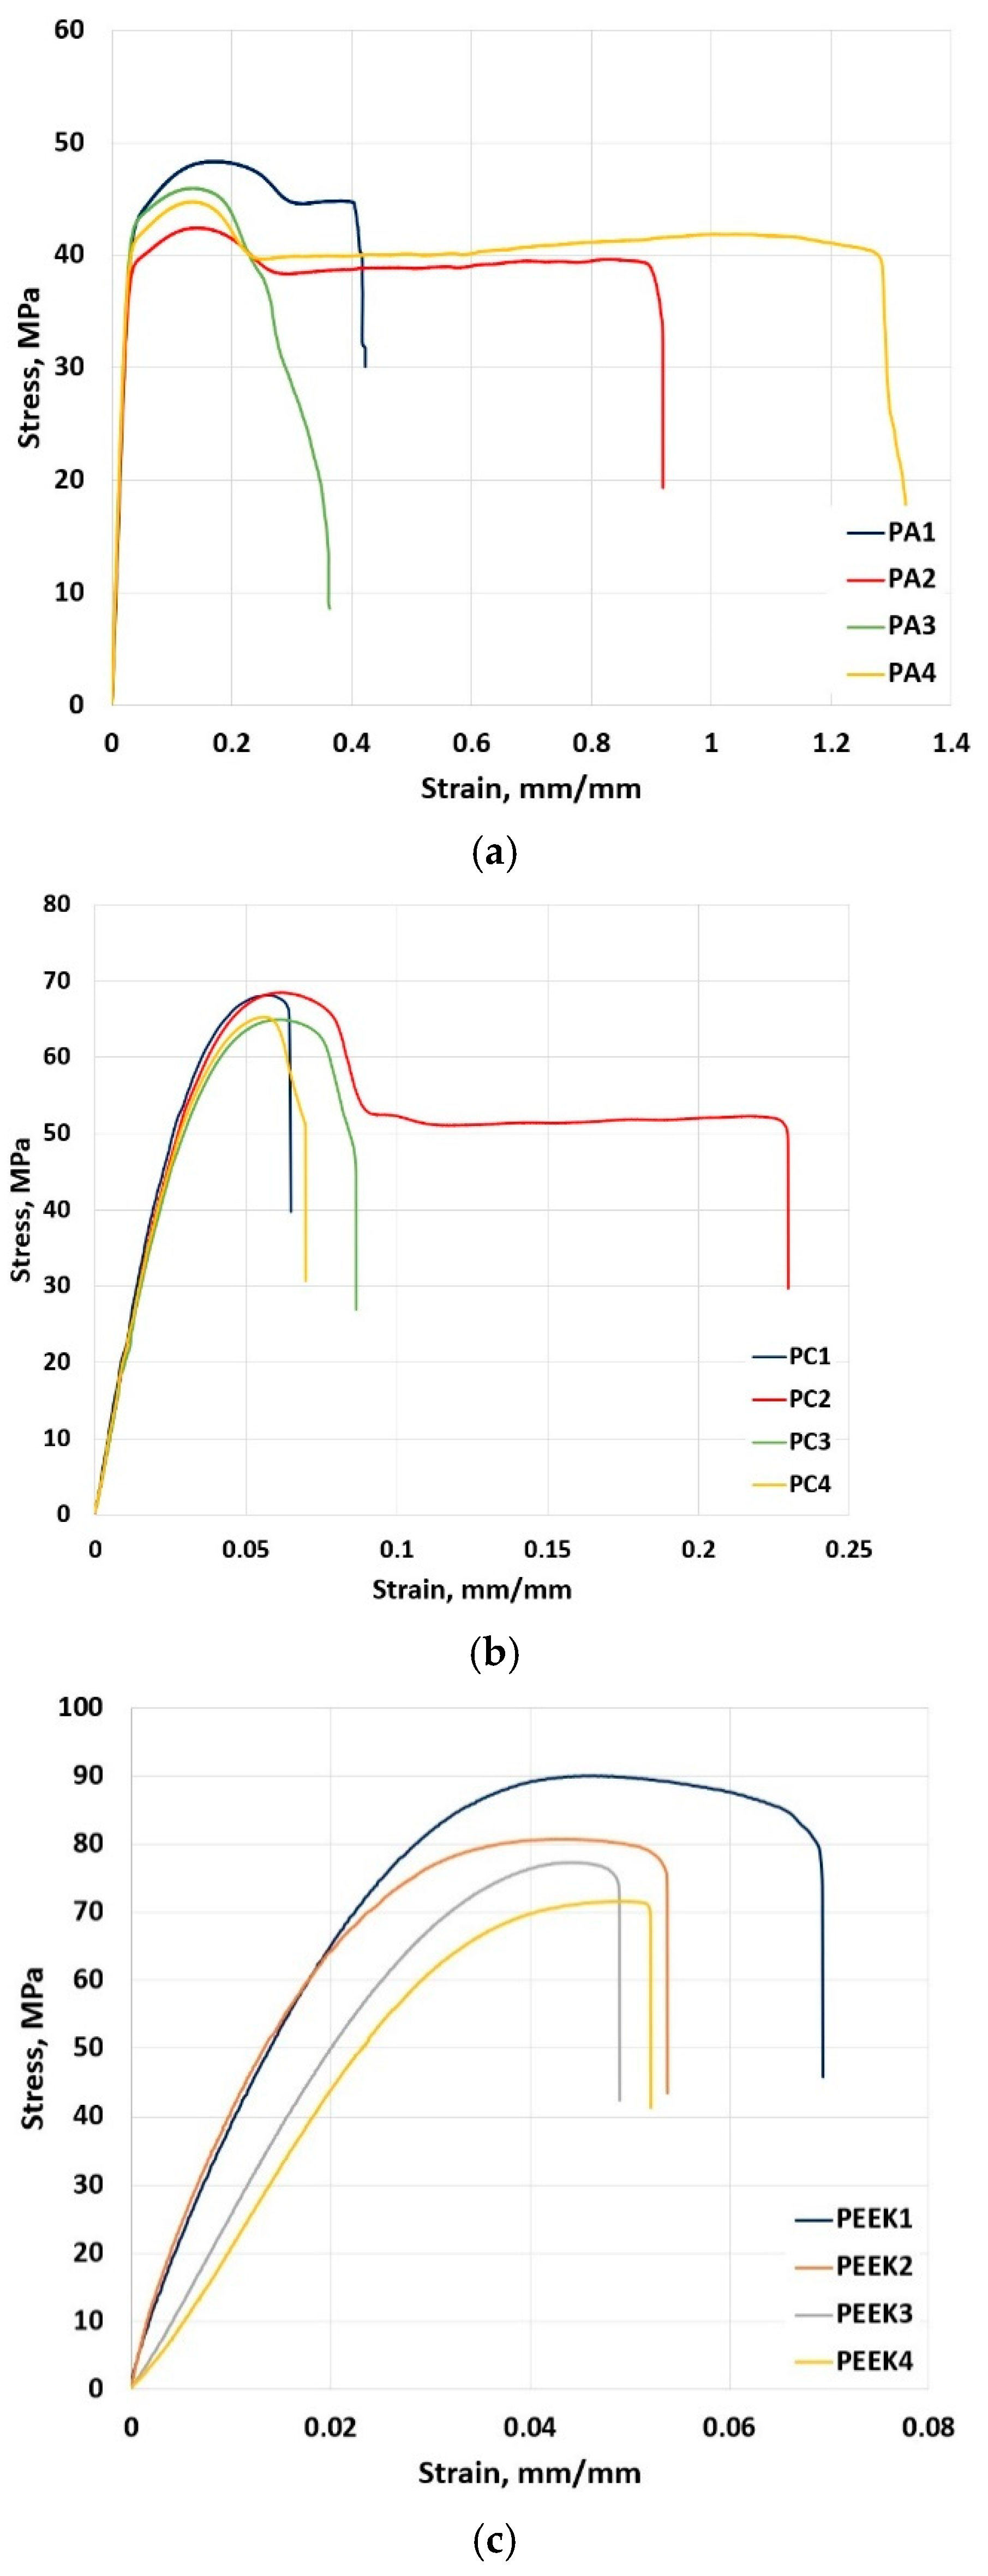
The tests were carried out using an Instron 5882 testing machine with a non-contacting video extensometer Instron Ave at the ambient temperature of 24 °C, 50% humidity at the speed of 2 mm/min. From each material, 4 samples were made, differing in the attitude of the layers (the angle of filling the internal volume), as well as the extrusion temperature. Tensile stress test results are presented in Table 6. Figure 14 shows the stress-strain behavior for the deposited samples under tensile stress.
The test results show that tensile strength values are not lower than those known from the literature. At the same time, for samples made of PLA, ABS, PC, and PA 6, an increase in tensile strength up to 20% is observed at strain values comparable with those known from the literature. The test results for PLA and ABS samples, as well as the results of optical microscopy of the fracture surface of these specimens, are presented in our previous article [53].
A comparison was made with the results of studies in which the printing parameters were used similar to those given in Table 5 and some approaches to improving printing quality described in the introduction were used. For example, in [8,40,41,70,71,72], the results are presented for samples made from ABS, in [8,42,43,44,73] for PLA, for PA 6 in [10,74], and for PC in [72,75,76]. To raise efficiency when operating with PEEK, additional research and optimization of printing parameters are required, considering the results, recommendations, and conclusions contained in the literature [5,11,77].

4. Conclusions

The method developed for controlling the temperature of a nozzle heated by HF currents, using the proposed phase-amplitude resonant measurement method, made it possible to ensure a constant quality of regulation in the accessible range of operating temperature of the nozzle, to reduce the nozzle temperature control error from 20 to 0.2 °C, as well as to decrease the control delay by more than six times. Thus, high accuracy and speed of nozzle temperature control were provided to achieve the low-delay response needed to precisely control the extruded material temperature invariant to toolhead speed. This allows to successfully print objects with the complex geometries (with the need to manipulate extrusion speed while maintaining the constant extrusion temperature when printing smaller elements, overhangs, outer shell, and bridges) and/or getting successful prints when using high-grade temperature-dependent materials such as PEEK.
Due to the application of the developed method for controlling the temperature of the nozzle and the results of numerical studies of the temperature fields of the deposited layers of the product, for the first time, it will be possible for FDM technology to control the thermal cycle of the FDM process, which will improve the quality of interlayer fusion. Moreover, it will be possible to achieve a more equal distribution of retained stress and reduce mechanical deformations introduced by non-uniform heat shrinkage.

Author Contributions

Conceptualization, D.N.T., I.I.B. and A.A.O.; methodology, A.A.O., I.I.B. and D.N.T.; software, A.A.O. and I.I.B.; validation, A.A.O., D.N.T. and I.I.B.; formal analysis, A.A.O. and D.N.T.; investigation, A.A.O. and I.I.B.; resources, A.A.O., I.I.B. and D.N.T.; data curation, A.A.O., D.N.T. and I.I.B.; writing—original draft preparation, A.A.O.; writing—review and editing, A.A.O. and I.I.B.; visualization, A.A.O.; supervision, D.N.T. and I.I.B.; project administration, D.N.T.; funding acquisition, D.N.T. All authors have read and agreed to the published version of the manuscript.

Funding

The authors gratefully acknowledge financial support under the Mega-grants program, contract no. 075-15-2021-578 of 31 May 2021, hosted by Perm National Research Polytechnic University.

Institutional Review Board Statement

Not applicable.

Informed Consent Statement

Not applicable.

Data Availability Statement

The data presented in this study are available on request from corresponding author. The data are not publicly available due to further study will be carried out using the same data.

Conflicts of Interest

The authors declare no conflict of interest.

References

  1. Zhao, Y.; Zhao, K.; Li, Y.; Chen, F. Mechanical characterization of biocompatible PEEK by FDM. J. Manuf. Process. 2020, 56, 28–42. [Google Scholar] [CrossRef]
  2. Honigmann, P.; Sharma, N.; Okolo, B.; Popp, U.; Msallem, B.; Thieringer, F.M. Patient-specific surgical implants made of 3D printed PEEK: Material, technology, and scope of surgical application. BioMed Res. Int. 2018, 2018, 4520636. [Google Scholar] [CrossRef] [PubMed]
  3. Wang, Y.; Müller, W.D.; Rumjahn, A.; Schwitalla, A. Parameters influencing the outcome of additive manufacturing of tiny medical devices based on PEEK. Materials 2020, 13, 466. [Google Scholar] [CrossRef] [PubMed]
  4. Pikkarainen, A.; Piili, H.; Salminen, A. The design process of an occupationally safe and functional 3d printing learning environment for engineering education. Eur. J. Educ. Stud. 2020, 7, 80–105. [Google Scholar]
  5. Yang, C.; Tian, X.; Li, D.; Cao, Y.; Zhao, F.; Shi, C. Influence of thermal processing conditions in 3D printing on the crystallinity and mechanical properties of PEEK material. J. Mater. Process. Technol. 2017, 248, 1–7. [Google Scholar] [CrossRef]
  6. Gardner, J.M.; Stelter, C.J.; Yashin, E.A.; Siochi, E.J. High Temperature Thermoplastic Additive Manufacturing Using Low-Cost, Open-Source Hardware; National Aeronautics and Space Administration; Langley Research Center: Hampton, VA, USA, 2016. [Google Scholar]
  7. Wang, P.; Zou, B.; Xiao, H.; Ding, S.; Huang, C. Effects of printing parameters of fused deposition modeling on mechanical properties, surface quality, and microstructure of PEEK. J. Mater. Process. Technol. 2019, 271, 62–74. [Google Scholar] [CrossRef]
  8. Syrlybayev, D.; Zharylkassyn, B.; Seisekulova, A.; Akhmetov, M.; Perveen, A.; Talamona, D. Optimisation of strength properties of FDM printed parts—A critical review. Polymers 2021, 13, 1587. [Google Scholar] [CrossRef]
  9. Ding, S.; Zou, B.; Wang, P.; Ding, H. Effects of nozzle temperature and building orientation on mechanical properties and microstructure of PEEK and PEI printed by 3D-FDM. Polym. Test. 2019, 78, 105948. [Google Scholar] [CrossRef]
  10. Costanzo, A.; Croce, U.; Spotorno, R.; Fenni, S.E.; Cavallo, D. Fused deposition modeling of polyamides: Crystallization and weld formation. Polymers 2020, 12, 2980. [Google Scholar] [CrossRef]
  11. Jiang, S.; Liao, G.; Xu, D.; Liu, F.; Li, W.; Cheng, Y.; Li, Z.; Xu, G. Mechanical properties analysis of polyetherimide parts fabricated by fused deposition modeling. High Perform. Polym. 2019, 31, 97–106. [Google Scholar] [CrossRef]
  12. Sukindar, N.A.; Mohd Ariffin, M.K.A.; Baharuddin, B.T.; Jaafar, C.N.A.; Ismail, M.I.S. Analysis on temperature setting for extruding polylactic acid using open-source 3D printer. ARPN J. Eng. Appl. Sci. 2017, 12, 1348–1353. [Google Scholar]
  13. Shukla, V.V.; Kulkarni, A.K.; Pingle, A.K.; Oza, S. Thermal analysis of 3-D printer liquefier indicates a probable cause of nozzle clogging. Int. J. Mech. Prod. Eng. Res. Dev. 2019, 9, 176–182. [Google Scholar]
  14. Sun, Q.; Rizvi, G.M.; Bellehumeur, C.T.; Gu, P. Effect of processing conditions on the bonding quality of FDM polymer filaments. Rapid Prototyp. J. 2008, 14, 72–80. [Google Scholar] [CrossRef]
  15. Serdeczny, M.P.; Comminal, R.; Pedersen, D.B.; Spangenberg, J. Experimental and analytical study of the polymer melt flow through the hot-end in material extrusion additive manufacturing. Addit. Manuf. 2020, 32, 100997. [Google Scholar] [CrossRef]
  16. Pollard, D.; Ward, C.; Herrmann, G.; Etches, J. Filament temperature dynamics in fused deposition modelling and outlook for control. Procedia Manuf. 2017, 11, 536–544. [Google Scholar] [CrossRef]
  17. Serdeczny, M.P.; Comminal, R.; Mollah, M.T.; Pedersen, D.B.; Spangenberg, J. Numerical modeling of the polymer flow through the hot-end in filament-based material extrusion additive manufacturing. Addit. Manuf. 2020, 36, 101454. [Google Scholar] [CrossRef]
  18. Anderegg, D.A.; Bryant, H.A.; Ruffin, D.C.; Skrip, S.M., Jr.; Fallon, J.J.; Gilmer, E.L.; Bortner, M.J. In-situ monitoring of polymer flow temperature and pressure in extrusion based additive manufacturing. Addit. Manuf. 2019, 26, 76–83. [Google Scholar] [CrossRef]
  19. Maidin, S.; Muhamad, M.K.; Pei, E. Experimental setup for ultrasonic-assisted desktop fused deposition modeling system. Appl. Mech. Mater. 2015, 761, 324–328. [Google Scholar] [CrossRef]
  20. Nigmetzyanov, R.I.; Sundukov, S.K.; Fatyukhin, D.S.; Grib, V.V.; Kartsov, S.K. Additive Manufacturing with Ultrasound. Russ. Eng. Res. 2017, 37, 1070–1073. [Google Scholar] [CrossRef]
  21. Tofangchi, A.; Han, P.; Izquierdo, J.; Iyengar, A.; Hsu, K. Effect of ultrasonic vibration on interlayer adhesion in fused filament fabrication 3D printed ABS. Polymers 2019, 11, 315. [Google Scholar] [CrossRef]
  22. Li, G.; Zhao, J.; Jiang, J.; Jiang, H.; Wu, W.; Tang, M. Ultrasonic strengthening improves tensile mechanical performance of fused deposition modeling 3D printing. Int. J. Adv. Manuf. Technol. 2018, 96, 2747–2755. [Google Scholar] [CrossRef]
  23. Li, G.; Zhao, J.; Wu, W.; Jiang, J.; Wang, B.; Jiang, H.; Fuh, J.Y.H. Effect of ultrasonic vibration on mechanical properties of 3D printing non-crystalline and semi-crystalline polymers. Materials 2018, 11, 826. [Google Scholar] [CrossRef]
  24. Watson, N.J.; Johal, R.K.; Glover, Z.; Reinwald, Y.; White, L.J.; Ghaemmaghami, A.M.; Morgan, S.P.; Rose, F.R.A.J.; Povey, M.J.W.; Parker, N.G. Post-processing of polymer foam tissue scaffolds with high power ultrasound: A route to increased pore interconnectivity, pore size and fluid transport. Mater. Sci. Eng. 2013, 33, 4825–4832. [Google Scholar] [CrossRef]
  25. Brenken, B.; Barocio, E.; Favaloro, A.; Kunc, V.; Pipes, R.B. Fused filament fabrication of fiber-reinforced polymers: A review. Addit. Manuf. 2018, 21, 1–16. [Google Scholar] [CrossRef]
  26. Kishore, V.; Ajinjeru, C.; Nycz, A.; Post, B.; Lindahl, J.; Kunc, V.; Duty, C. Infrared preheating to improve interlayer strength of big area additive manufacturing (BAAM) components. Addit. Manuf. 2017, 14, 7–12. [Google Scholar] [CrossRef]
  27. Sabyrov, N.; Abilgaziyev, A.; Ali, M. Enhancing interlayer bonding strength of FDM 3D printing technology by diode laser-assisted system. Int. J. Adv. Manuf. Technol. 2020, 108, 603–611. [Google Scholar] [CrossRef]
  28. Fang, L.; Yan, Y.; Agarwal, O.; Yao, S.; Seppala, J.E.; Kang, S.H. Effects of environmental temperature and humidity on the geometry and strength of polycarbonate specimens prepared by fused filament fabrication. Materials 2020, 13, 4414. [Google Scholar] [CrossRef]
  29. Casavola, C.; Cazzato, A.; Karalekas, D.; Moramarco, V.; Pappalettera, G. The effect of chamber temperature on residual stresses of FDM parts. In Residual Stress, Thermomechanics & Infrared Imaging, Hybrid Techniques and Inverse Problems; Springer: Cham, Switzerland, 2019; Volume 7, pp. 87–92. [Google Scholar]
  30. Zhou, Y.; Lu, H.; Wang, G.; Wang, J.; Li, W. Voxelization modelling based finite element simulation and process parameter optimization for Fused Filament Fabrication. Mater. Des. 2020, 187, 108409. [Google Scholar] [CrossRef]
  31. Zhang, J.; Zheng, Y.; Li, H.; Feng, H. Simulation of Temperature Field in FDM Process. IOP Conf. Ser. Mater. Sci. Eng. 2019, 677, 032080. [Google Scholar] [CrossRef]
  32. El Moumen, A.; Tarfaoui, M.; Lafdi, K. Modelling of the temperature and residual stress fields during 3D printing of polymer composites. Int. J. Adv. Manuf. Technol. 2019, 104, 1661–1676. [Google Scholar] [CrossRef]
  33. Zhou, Y.; Nyberg, T.; Xiong, G.; Liu, D. Temperature analysis in the fused deposition modeling process. In Proceedings of the 2016 3rd International Conference on Information Science and Control Engineering (ICISCE), Beijing, China, 8–10 July 2016; pp. 678–682. [Google Scholar]
  34. Verma, A.; Vishnoi, P.; Sukhotskiy, V.; Furlani, E.P. Numerical simulation of extrusion additive manufacturing: Fused deposition modeling. TechConnect Briefs 2018, 4, 118–121. [Google Scholar]
  35. Xia, H.; Lu, J.; Dabiri, S.; Tryggvason, G. Fully resolved numerical simulations of fused deposition modeling. Part I: Fluid flow. Rapid Prototyp. J. 2018, 24, 463–476. [Google Scholar] [CrossRef]
  36. Mohamed, O.A.; Masood, S.H.; Bhowmik, J.L. Optimization of fused deposition modeling process parameters: A review of current research and future prospects. Adv. Manuf. 2015, 3, 42–53. [Google Scholar] [CrossRef]
  37. Sheoran, A.J.; Kumar, H. Fused Deposition modeling process parameters optimization and effect on mechanical properties and part quality: Review and reflection on present research. Mater. Today Proc. 2020, 21, 1659–1672. [Google Scholar] [CrossRef]
  38. Lee, B.H.; Abdullah, J.; Khan, Z.A. Optimization of rapid prototyping parameters for production of flexible ABS object. J. Mater. Process. Technol. 2005, 169, 54–61. [Google Scholar] [CrossRef]
  39. Srivastava, M.; Rathee, S. Optimisation of FDM process parameters by Taguchi method for imparting customised properties to components. Virtual Phys. Prototyp. 2018, 13, 203–210. [Google Scholar] [CrossRef]
  40. Raju, M.; Gupta, M.K.; Bhanot, N.; Sharma, V.S. A hybrid PSO–BFO evolutionary algorithm for optimization of fused deposition modelling process parameters. J. Intell. Manuf. 2019, 30, 2743–2758. [Google Scholar] [CrossRef]
  41. Dong, G.; Wijaya, G.; Tang, Y.; Zhao, Y.F. Optimizing process parameters of fused deposition modeling by Taguchi method for the fabrication of lattice structures. Addit. Manuf. 2018, 19, 62–72. [Google Scholar] [CrossRef]
  42. Hikmat, M.; Rostam, S.; Ahmed, Y.M. Investigation of tensile property-based Taguchi method of PLA parts fabricated by FDM 3D printing technology. Results Eng. 2021, 11, 100264. [Google Scholar] [CrossRef]
  43. Liu, X.; Zhang, M.; Li, S.; Si, L.; Peng, J.; Hu, Y. Mechanical property parametric appraisal of fused deposition modeling parts based on the gray Taguchi method. Int. J. Adv. Manuf. Technol. 2017, 89, 2387–2397. [Google Scholar] [CrossRef]
  44. Cho, E.E.; Hein, H.H.; Lynn, Z.; Hla, S.J.; Tran, T. Investigation on influence of infill pattern and layer thickness on mechanical strength of PLA material in 3D printing technology. J. Eng. Sci. Res. 2019, 3, 27–37. [Google Scholar]
  45. Tan, W.S. Application of Induction Heating to 3D Print Low Melting Point Metal Alloy: Final Project Summary Report 2015, UNSW@ADFA; IOP: Bristol, UK, 2015; p. 13. [Google Scholar]
  46. Hemang, J.; Manish, A. Induction Heating Based 3D Metal Printing of Eutectic Alloy Using Vibrating Nozzle. In Advances in Additive Manufacturing, Modeling Systems and 3D Prototyping; Springer: Cham, Switzerland, 2020; pp. 71–80. [Google Scholar]
  47. Carter, W.G.; Rios, O.; Akers, R.R.; Morrison, W.A. Low-Cost Electromagnetic Heating Technology for Polymer Extrusion-Based Additive Manufacturing; Oak Ridge National Laboratory: Oak Ridge, TN, USA, 2016. [Google Scholar]
  48. Seppala, J.E.; Han, S.H.; Hillgartner, K.E.; Davis, C.S.; Migler, K.B. Weld formation during material extrusion additive manufacturing. Soft Matter 2017, 13, 6761–6769. [Google Scholar] [CrossRef]
  49. Franco, C.; Acero, J.; Alonso, R.; Sagues, C.; Paesa, D. Inductive sensor for temperature measurement in induction heating applications. IEEE Sens. J. 2012, 12, 996–1003. [Google Scholar] [CrossRef]
  50. Lang, S. Temperature Measurement in a Cooking Vessel. U.S. Patent 9544947B2, 10 January 2017. [Google Scholar]
  51. Cojuhari, I.; Fiodorov, I.; Izvoreanu, B.; Moraru, D.; Botnaru, S. Automatic temperature control in 3D printing of the polymer details. In Proceedings of the 2017 International Conference on Electromechanical and Power Systems (SIELMEN), Iasi, Romania, 11–13 October 2017; pp. 31–35. [Google Scholar]
  52. Mir-Nasiri, N.; Ali, M.H.; Kurokawa, S. Development of 3D printer with integrated temperature control system. In Proceedings of the 2015 International Conference on Informatics, Electronics & Vision (ICIEV), Fukuoka, Japan, 15–18 June 2015; pp. 1–6. [Google Scholar]
  53. Oskolkov, A.; Bezukladnikov, I.; Trushnikov, D. Indirect Temperature Measurement in High Frequency Heating Systems. Sensors 2021, 21, 2561. [Google Scholar] [CrossRef]
  54. Mohan, N. Power Electronics. A First Course, 1st ed.; John Wiley & Sons: New York, NY, USA, 2011; p. 288. [Google Scholar]
  55. Texas Instruments. Phase-Shifted Full Bridge DC/DC Power Converter Design Guide; Texas Instruments: Dallas, TX, USA, 2015. [Google Scholar]
  56. Texas Instruments. INA240 High- and Low-Side, Bidirectional, Zero-Drift, Current-Sense Amplifier with Enhanced PWM Rejection; Texas Instruments: Dallas, TX, USA, 2018. [Google Scholar]
  57. Jackson, J.D. Classical Electrodynamics, 1st ed.; John Wiley & Sons: New York, NY, USA, 1962; p. 641. [Google Scholar]
  58. Serdeczny, M.P. Numerical and Experimental Analysis of Filament-Based Material Extrusion Additive Manufacturing. Ph.D. Thesis, Technical University of Denmark, Lyngby, Denmark, 2020. [Google Scholar]
  59. Coogan, T.J.; Kazmer, D.O. In-line rheological monitoring of fused deposition modeling. J. Rheol. 2019, 63, 141–155. [Google Scholar] [CrossRef]
  60. Phan, D.D.; Swain, Z.R.; Mackay, M.E. Rheological and heat transfer effects in fused filament fabrication. J. Rheol. 2018, 62, 1097–1107. [Google Scholar] [CrossRef]
  61. Pigeonneau, F.; Xu, D.; Vincent, M.; Agassant, J.F. Heating and flow computations of an amorphous polymer in the liquefier of a material extrusion 3D printer. Addit. Manuf. 2020, 32, 101001. [Google Scholar] [CrossRef]
  62. Dieckerhoff, S.; Ruan, M.J.; De Doncker, R.W. Design of an IGBT-based LCL-resonant inverter for high-frequency induction heating. In Proceedings of the Conference Record of the 1999 IEEE Industry Applications Conference, Thirty-Forth IAS Annual Meeting, Phoenix, AZ, USA, 3–7 October 1999; Volume 3, pp. 2039–2045. [Google Scholar]
  63. Silicon Laboratories Inc. Improving ADC Resolution by Oversampling and Averaging; Silicon Laboratories Inc.: Austin, TX, USA, 2015. [Google Scholar]
  64. Atmel Corporation. AVR121: Enhancing ADC Resolution by Oversampling; Atmel Corporation: San Jose, CA, USA, 2005. [Google Scholar]
  65. Fischer, G.L.; Doht, H. An inverter system for inductive tube welding utilizing resonance transformation. In Proceedings of the Conference Record of the 1994 IEEE Industry Applications Society Annual Meeting, Denver, CO, USA, 2–6 October 1994; Volume 2, pp. 833–840. [Google Scholar]
  66. RM0364. Reference Manual. STM32F334xx Advanced Arm//STMicroelectronics. 2017. 1124p. Available online: https://www.st.com/resource/en/reference_manual/dm00093941-stm32f334xx-advanced-arm-based-32-bit-mcus-stmicroelectronics.pdf (accessed on 10 July 2022).
  67. Dorf, R.C.; Bishop, R.H. Modern Control Systems, 11th ed.; Prentice Hall: Hoboken, NJ, USA, 2008; p. 1022. [Google Scholar]
  68. Astrom, K.J. PID Controllers, Theory, Design and Tuning, 2nd ed.; Instrument Society of America: Pittsburgh, PA, USA, 1995; p. 354. [Google Scholar]
  69. Standartinform. State All-Union Standard 11262-2017. PLASTICS. Tensile Test Method; Standartinform: Moscow, Russia, 2017. [Google Scholar]
  70. Ahn, S.H.; Montero, M.; Odell, D.; Roundy, S.; Wright, P.K. Anisotropic material properties of fused deposition modeling ABS. Rapid Prototyp. J. 2002, 8, 248–257. [Google Scholar] [CrossRef]
  71. Wang, J.Y.; Xu, D.D.; Sun, W.; Du, S.M.; Guo, J.J.; Xu, G.J. Effects of nozzle-bed distance on the surface quality and mechanical properties of fused filament fabrication parts. In Proceedings of the IOP Conference Series: Materials Science and Engineering, Bristol, UK, 1 February 2019; Volume 479, p. 012094. [Google Scholar]
  72. Cantrell, J.T.; Rohde, S.; Damiani, D.; Gurnani, R.; DiSandro, L.; Anton, J.; Young, A.; Jerez, A.; Steinbach, D.; Kroese, C.; et al. Experimental characterization of the mechanical properties of 3D-printed ABS and polycarbonate parts. Rapid Prototyp. J. 2017, 23, 811–824. [Google Scholar] [CrossRef]
  73. Li, H.; Wang, T.; Sun, J.; Yu, Z. The effect of process parameters in fused deposition modelling on bonding degree and mechanical properties. Rapid Prototyp. J. 2018, 24, 80–92. [Google Scholar] [CrossRef]
  74. Guo, Z.; Peng, X.; Sang, L. Enhancement of Mechanical Properties of PA6 Blending with Talcum for Fused Deposition Modeling. Macromol. Mater. Eng. 2020, 305, 2000355. [Google Scholar] [CrossRef]
  75. Masood, S.H.; Mau, K.; Song, W.Q. Tensile properties of processed FDM polycarbonate material. Mater. Sci. Forum 2010, 654, 2556–2559. [Google Scholar] [CrossRef]
  76. Domingo-Espin, M.; Puigoriol-Forcada, J.M.; Garcia-Granada, A.A.; Llumà, J.; Borros, S.; Reyes, G. Mechanical property characterization and simulation of fused deposition modeling Polycarbonate parts. Mater. Des. 2015, 83, 670–677. [Google Scholar] [CrossRef]
  77. Deng, X.; Zeng, Z.; Peng, B.; Yan, S.; Ke, W. Mechanical properties optimization of poly-ether-ether-ketone via fused deposition modeling. Materials 2018, 11, 216. [Google Scholar] [CrossRef]
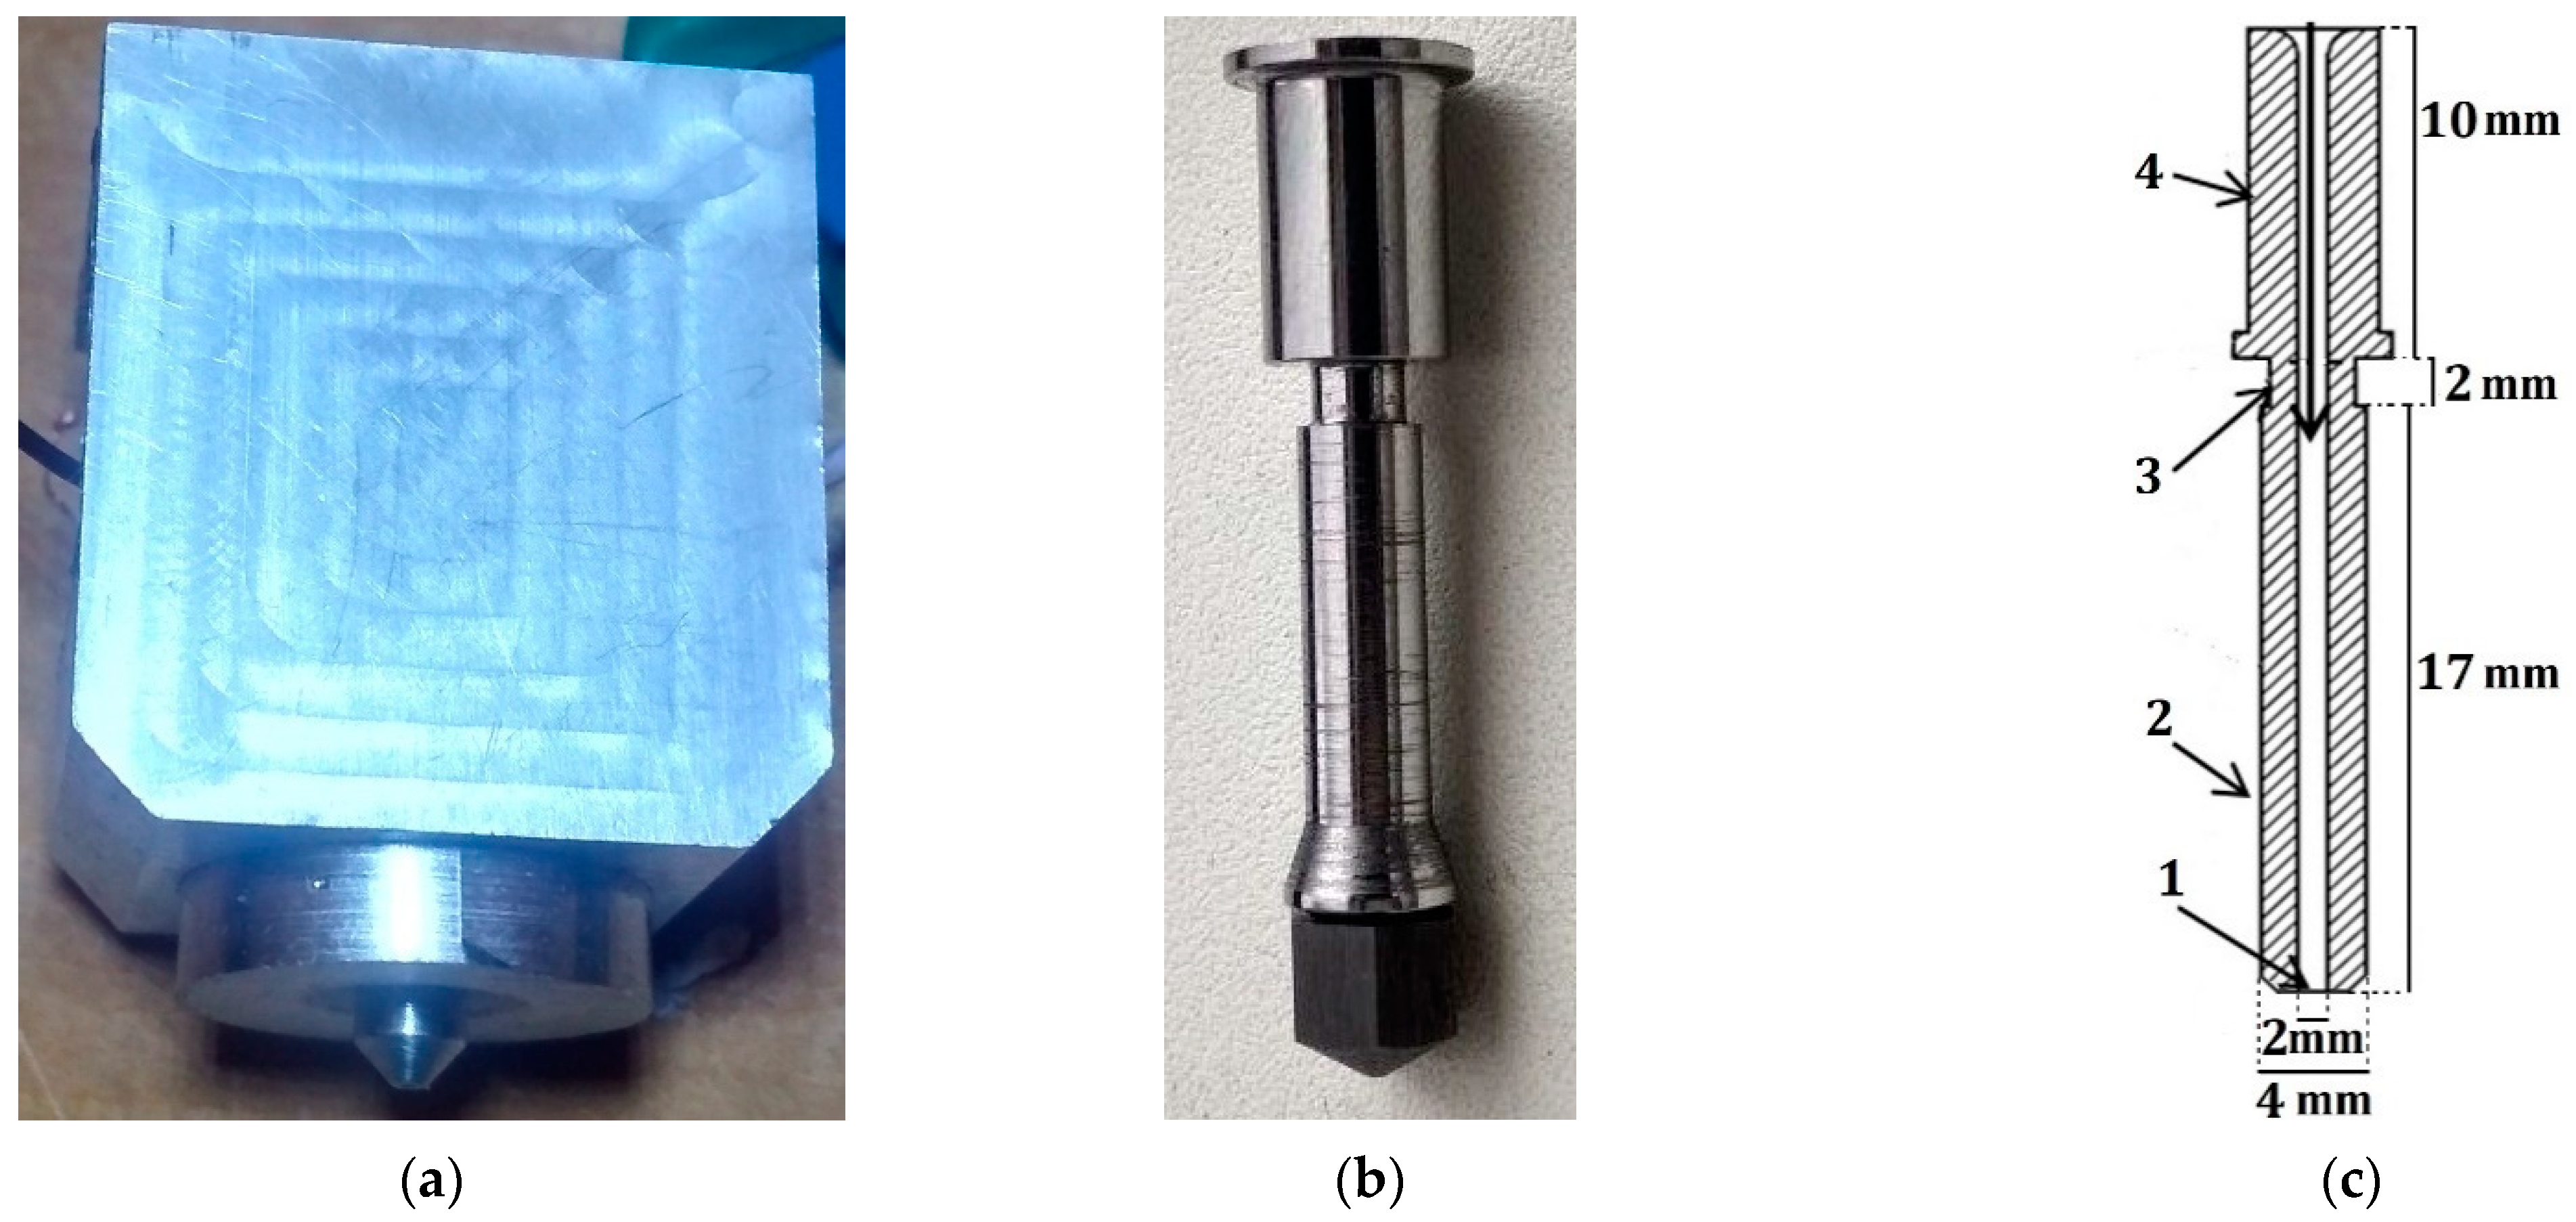
Figure 1. The developed extruder: (a) external appearance of the hot-end; (b) nozzle of a special shape; (c) nozzle section: (1) forming hole; (2) active zone; (3) heat break; (4) fasteners to the heatsink.
Applsci 12 08064 g001
Figure 2. Block diagram of the nozzle TACS: (1) inductor; (2) nozzle; (3) HF generator; (4) measuring coil; (5) signal registration and processing unit; (6) PID controller.
Applsci 12 08064 g002
Figure 3. Functional diagram of the HF generator and measuring circuit.
Applsci 12 08064 g003
Figure 4. Modelled geometry: (a) inductor; (b) magnetic flux concentrator; (c) a heatsink; (d) a nozzle; (e) thermoplastic material.
Applsci 12 08064 g004
Figure 5. Nozzle temperature distribution with a modified inductor for f = 115 kHz, t = 4 s, in the nozzle section r = 1.1 mm.
Applsci 12 08064 g005
Figure 6. Experimental and numerically simulated curves of nozzle cooling during operation at a set source power after the beginning of extrusion.
Applsci 12 08064 g006
Figure 7. Numerically simulated heating curves of the nozzle at a set source power level of 5% in an open-loop system for various Vext.
Applsci 12 08064 g007
Figure 8. Simulated model of a serial-parallel resonant circuit of the LCL topology in the Multisim environment.
Applsci 12 08064 g008
Figure 9. Controlled section of the PFR of the inductor L1 circuit.
Applsci 12 08064 g009
Figure 10. Timings for measurements of useful signal a and b at times O-n and O+n.
Applsci 12 08064 g010
Figure 11. Block diagram of a linearized TACS.
Applsci 12 08064 g011
Figure 12. Experimental and estimated transient response of a closed-loop ACS for 110, 260, 440, 600 and 750 °C setpoints.
Applsci 12 08064 g012
Figure 13. External appearance of test specimens after tensile testing: (a) PA 6; (b) PC; (c) PEEK.
Applsci 12 08064 g013
Figure 14. Tensile stress-strain curves: (a) PA 6; (b) PC; (c) PEEK.
Applsci 12 08064 g014
Table 1. Initial model data.
Materialρ, kg·m–3σ, Sm/mµεCp, J·kg –1·K–1λ, W·m–1·K–1
Steel AISI42076501.02·1071500148225
Copper 87005.998·10711385400
Supermalloy 79NM86000.00120,0004.513691.2
Polyamide PA 610500.0011420000.33
Aluminium alloy28003.774·10711920130
Table 2. The results of the calibration process of the temperature readings.
Setpoint Tset, °CSteady-State (after 30 s, Averaged over 5 s), °CValue Fluctuations (10 Consecutive Measurements after 30 s, in 5 s Intervals, No Averaging), °CSettling Time after Disabling Heater, sMax Overshoot, °C
Developed method250249.5249.4–249.60.320.9
Thermocouple inside, 10%236.3236.2–236.312.826
Thermocouple inside, 50% (reference)250.1250.0–250.26.311
Thermocouple inside, 90%221.4221.3–221.618.538
Thermocouple on the surface, 10%235.4235.3–235.53.26
Thermocouple on the surface, 50%250.0249.9–250.12.54
Thermocouple on the surface, 90%216.5216.4–216.74.88
Table 3. The results of the experiment devoted to the temperature control of the nozzle in a wide range for linear ACS with classical PID controller.
Setpoint, °CPID Controller Optimized for 260 °CPID Controller Optimized for 440 °CPID Controller Optimized for 750 °C
Max
Overshoot, %
Settling Time, sMax
Overshoot, %
Settling Time, sMax
Overshoot, %
Settling Time, s
2600.93.853.384.8
4401.57.21.14.25.55.8
7502.39.60.76.60.47.1
Table 4. Stimulus variables and estimated steady-state temperatures of the nozzle.
Power Level of HF Generator, %Phase Shift χ, °Power Consumed by the Inductor, WSource Voltage V1 and V2, VEstimated Currents I of the Inductor, AEstimated Steady-State Temperatures of the Nozzle T, °C
1183.32.42.659
105632.27.58.1548
208065.210.6611.51086
30989713141608
10018033124265549
Table 5. FDM 3d-printing process parameters.
MaterialNozzle
Temperature, °C
Bed
Temperature, °C
Raster Angle/No.Deposition
Speed, mm/s
Nozzle Diameter, mmLayer
Thickness, mm
−45°: 45°0°: 90°
PA 625013012400.60.2
26034
PC2401201240
25034
PEEK4401401225
45034
Table 6. Tensile stress test results.
MaterialNo.Tensile Strength, MPaElongation at Maximum Tensile Stress, %
PA 6148.3717.1
242.4214.5
345.9513.3
444.7313.5
PC168.135.7
268.486.2
364.946.1
465.245.6
PEEK189.914.7
280.724.3
377.344.4
471.564.9
Publisher’s Note: MDPI stays neutral with regard to jurisdictional claims in published maps and institutional affiliations.