
Application of Biofluorescent Particle Counters for Real-Time Bioburden Control in Aseptic Cleanroom Manufacturing


Abstract
:1. Introduction
2. Materials and Methods
2.1. Study Setup and Test Design
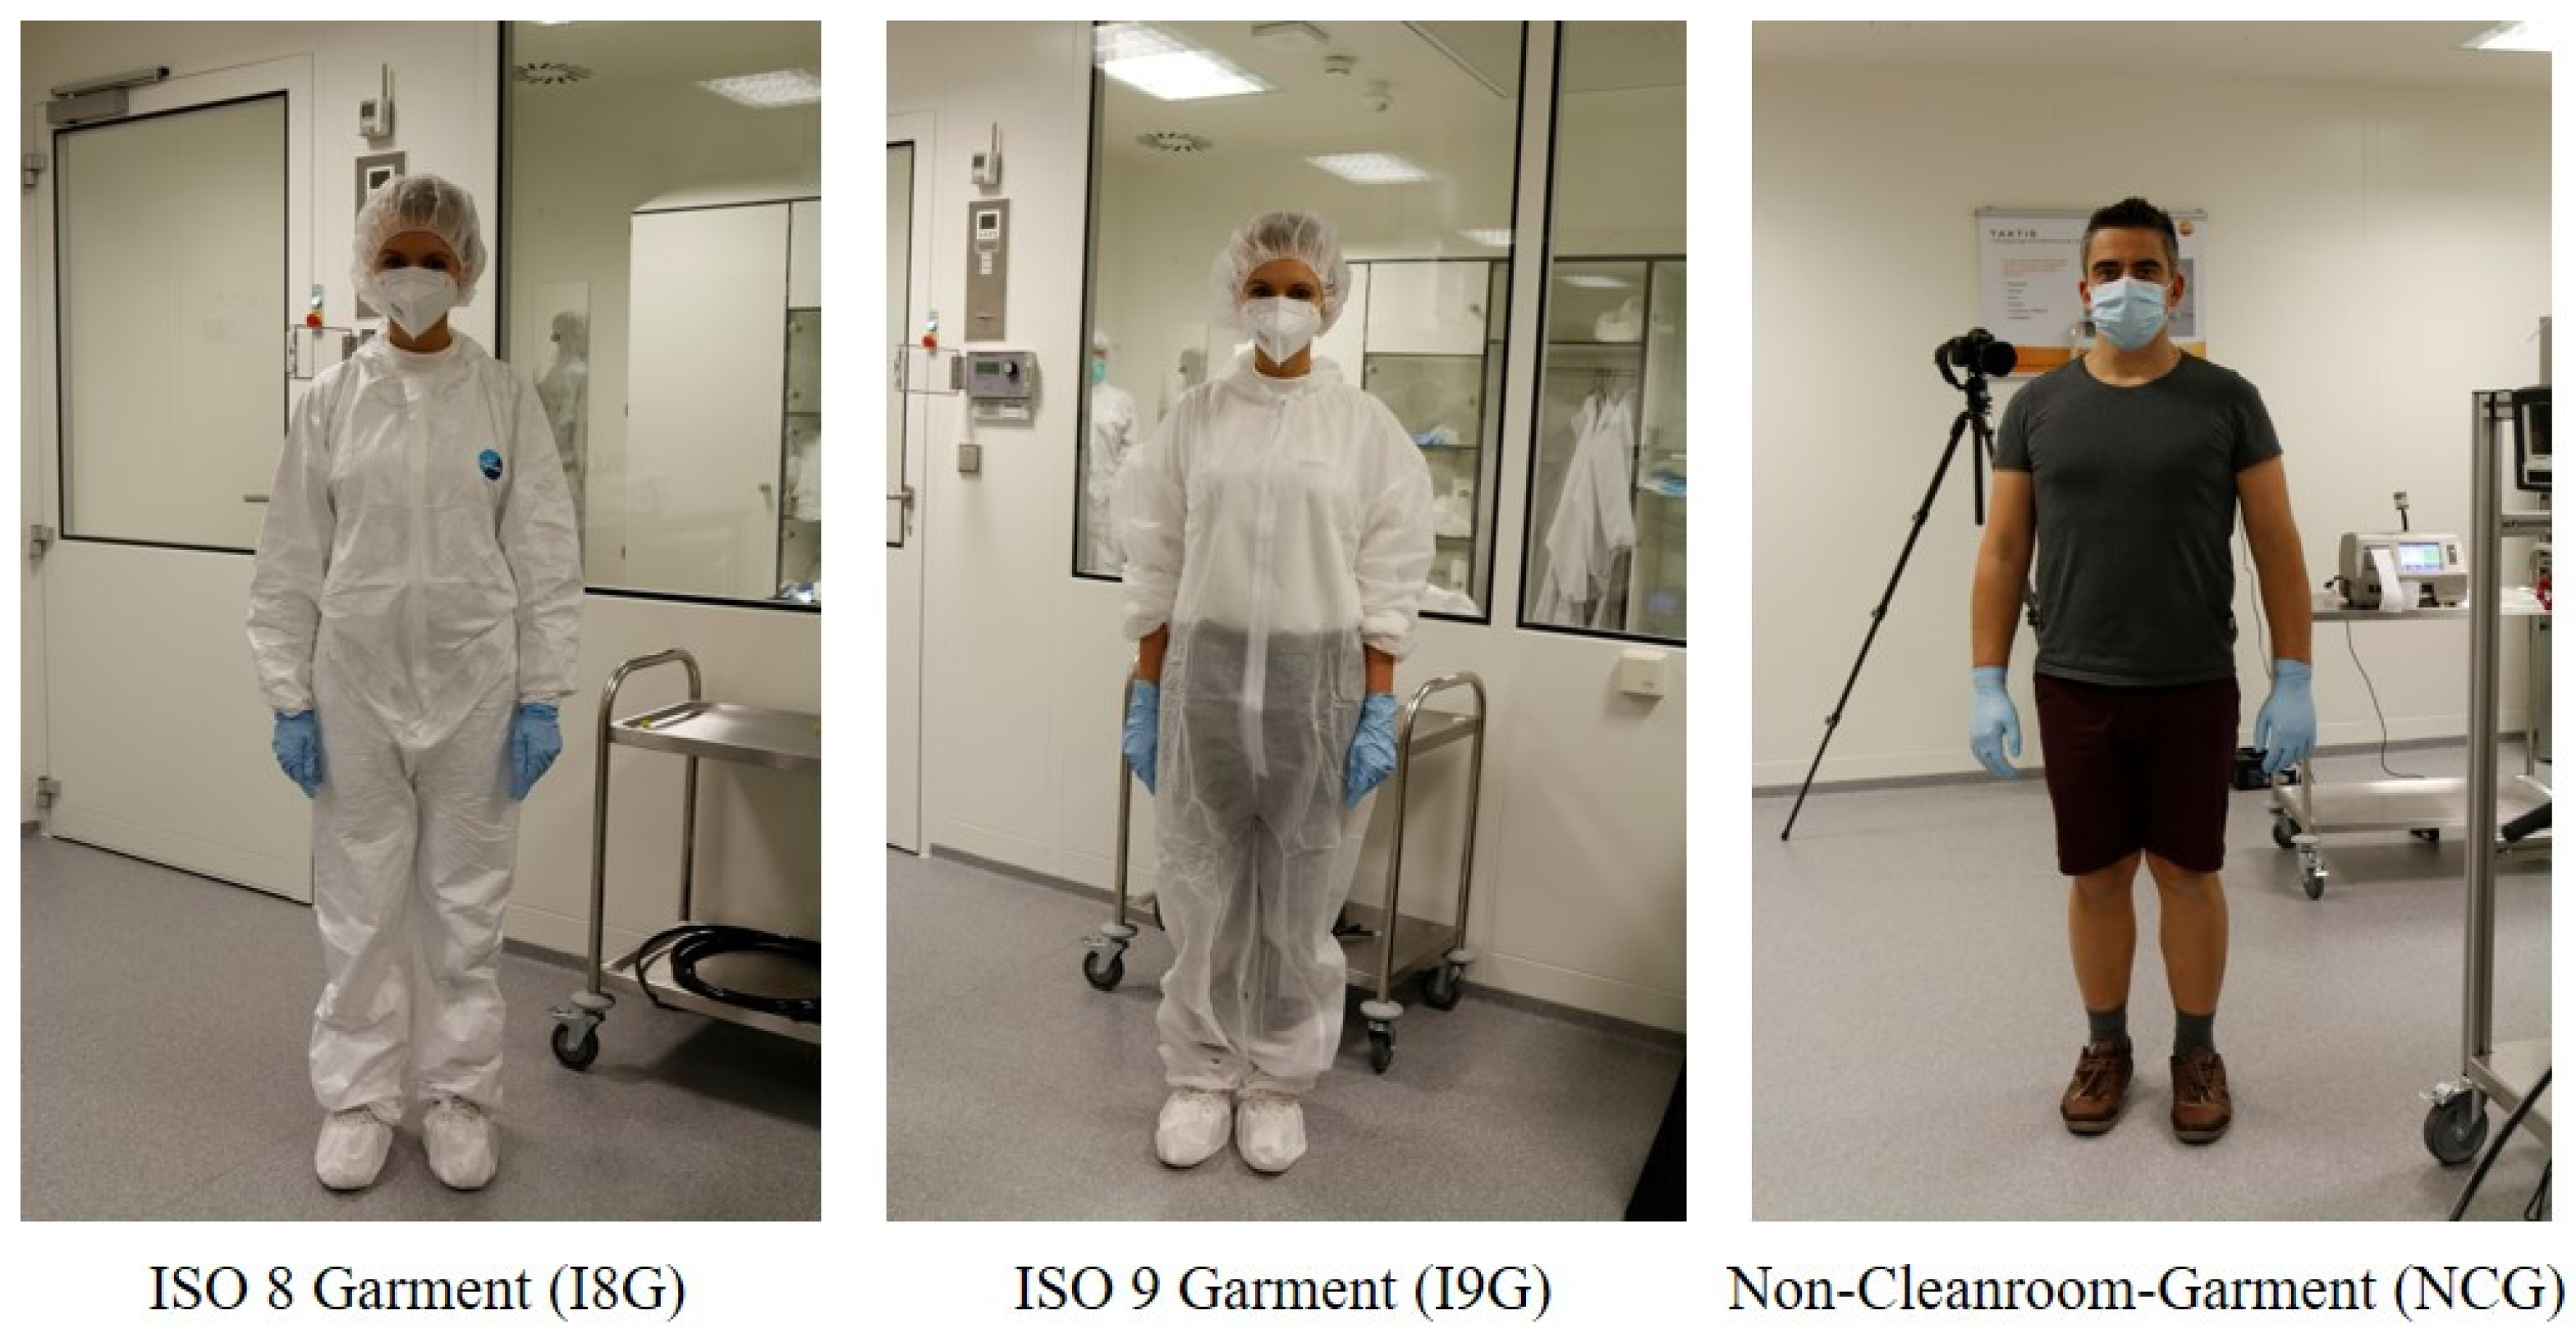
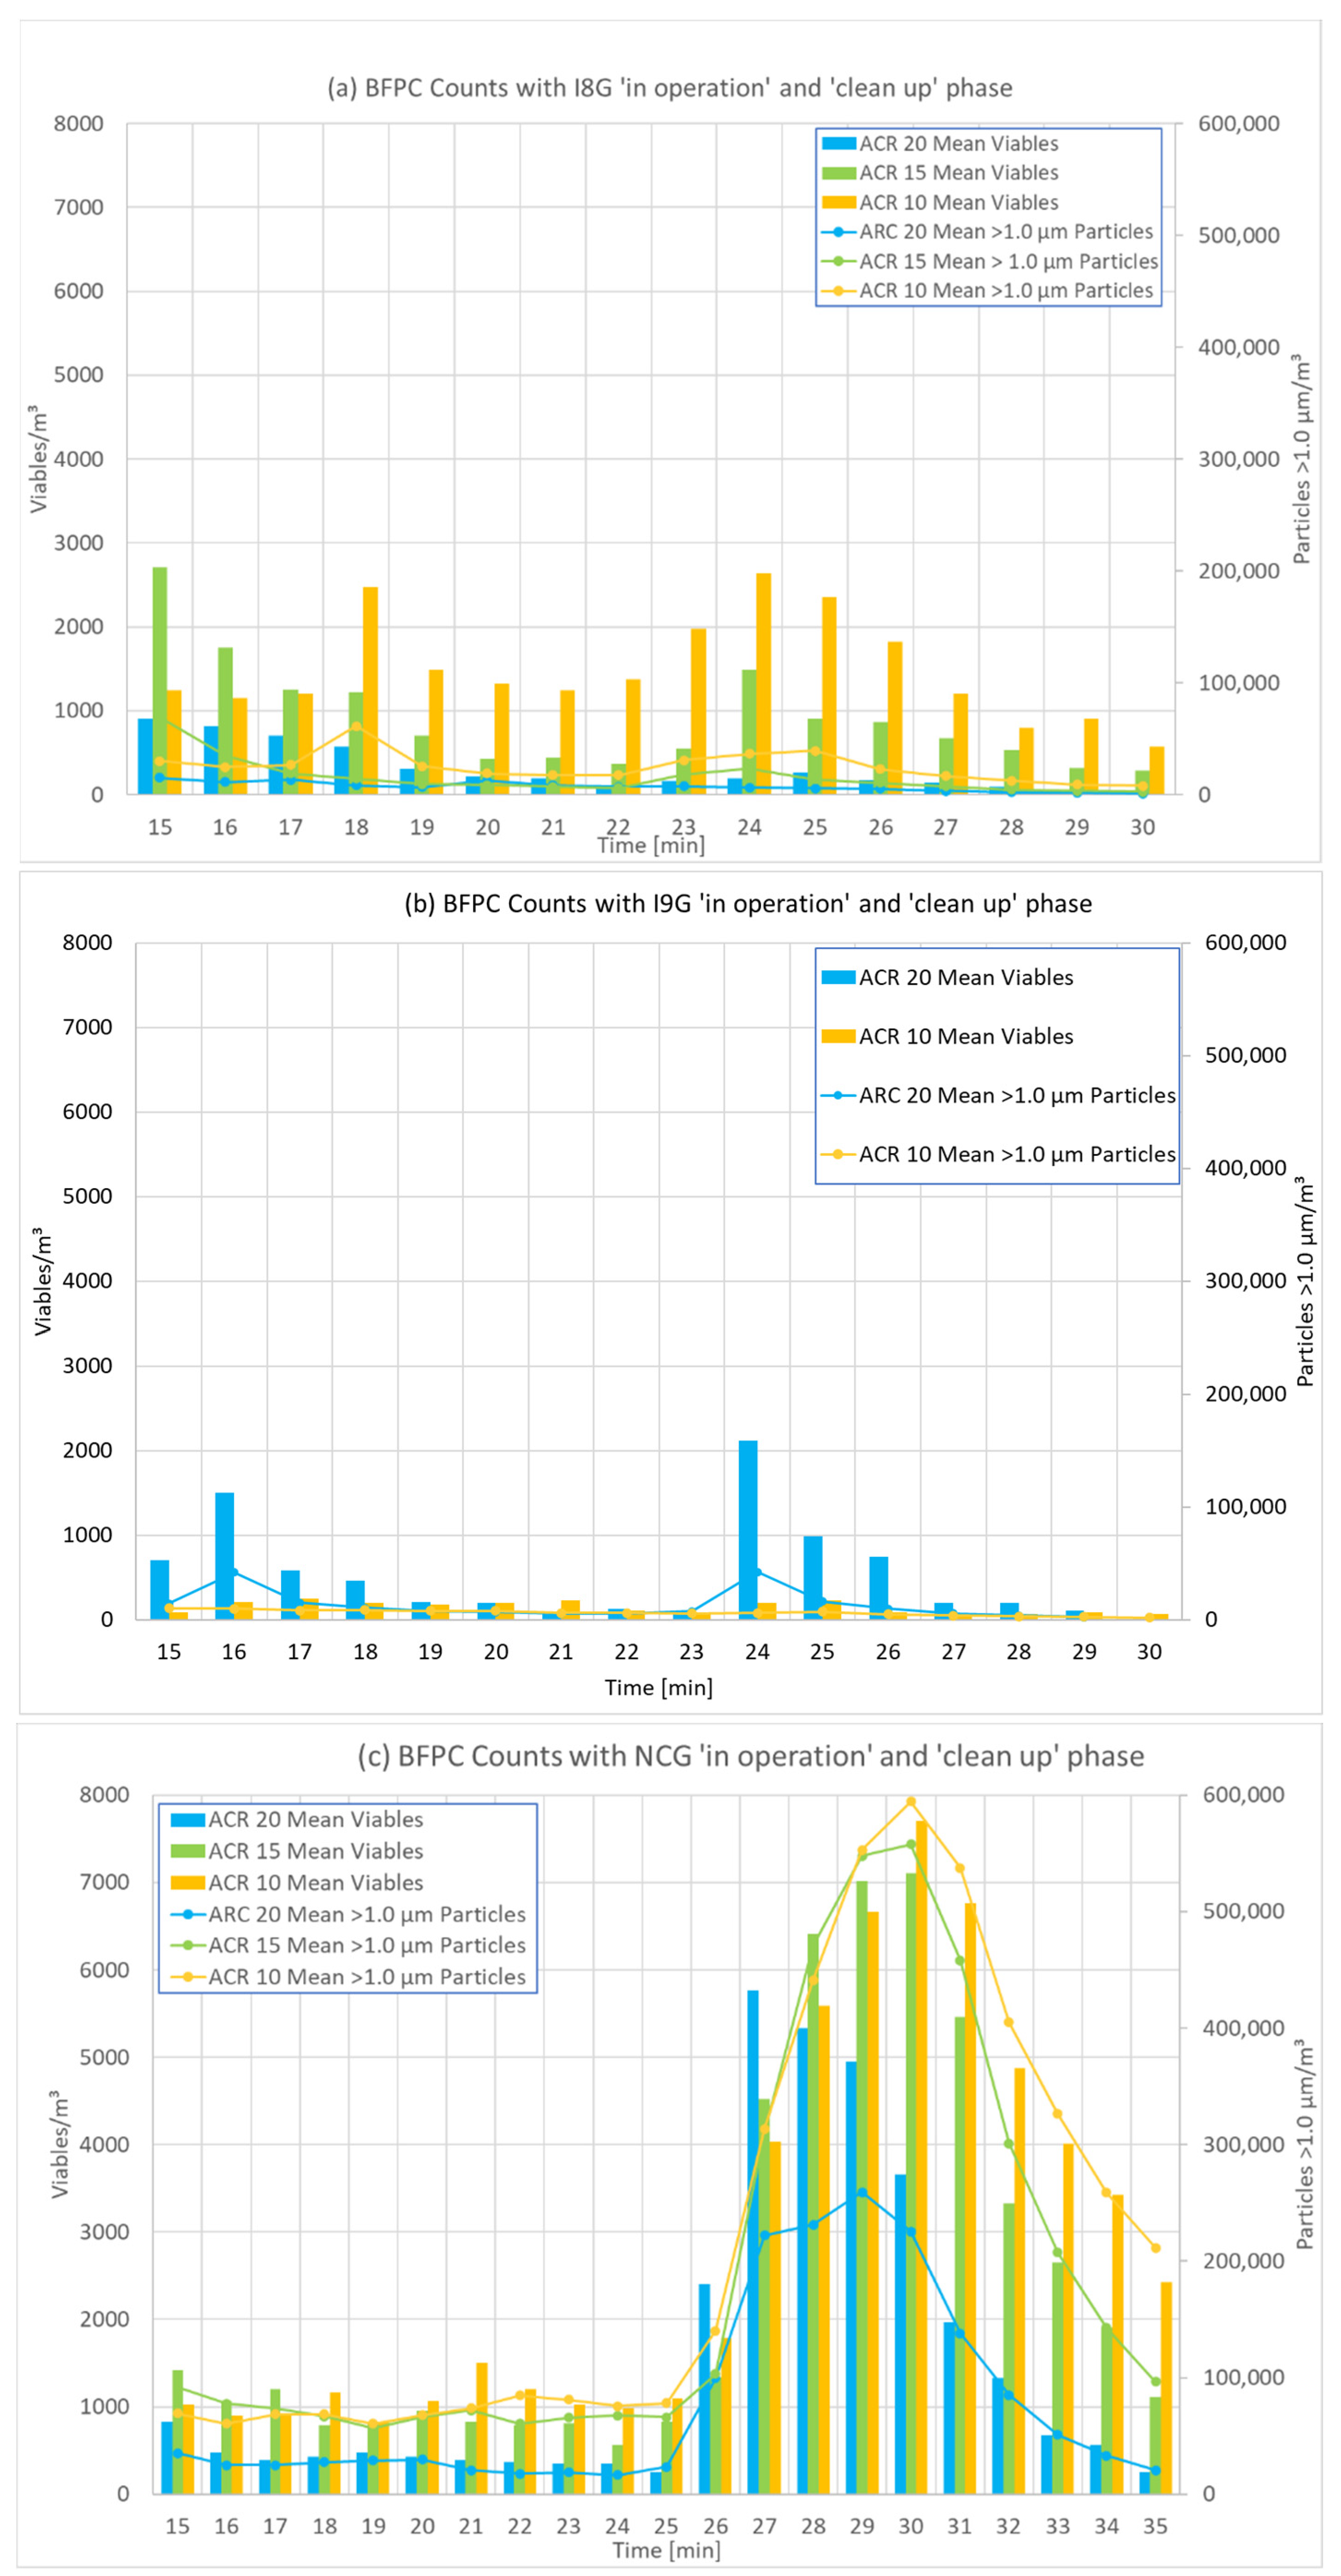
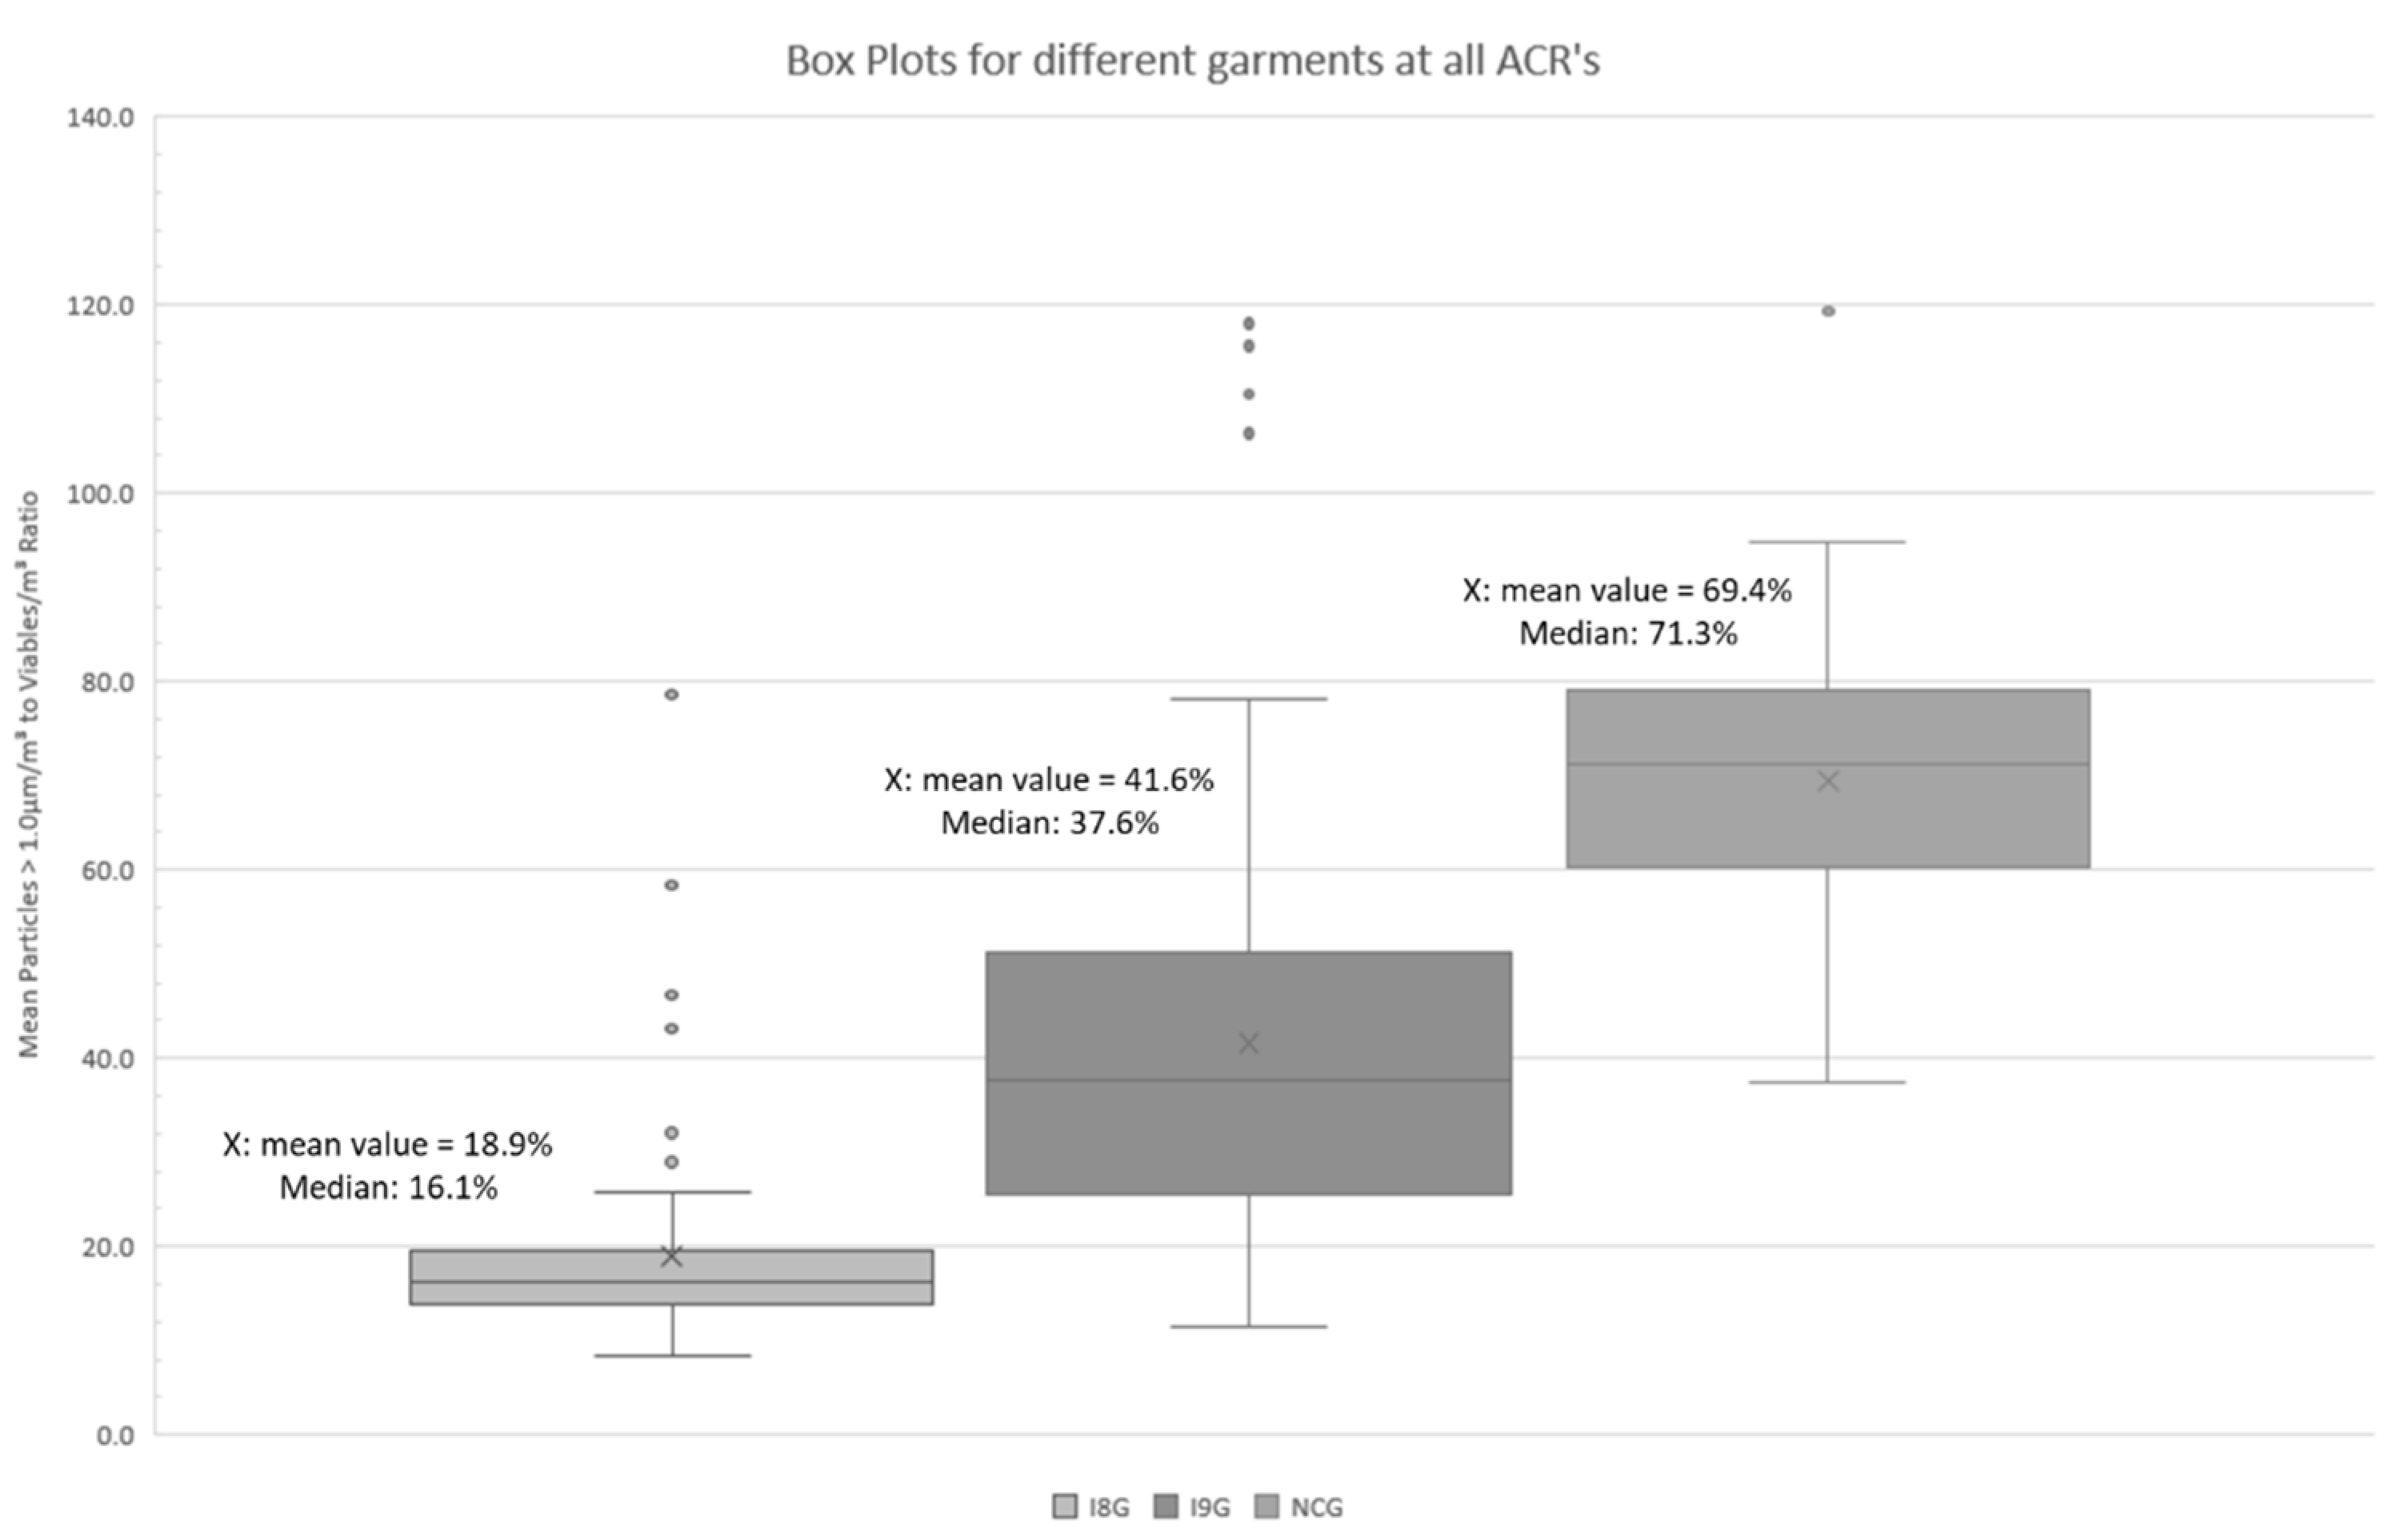
- I8G: ISO 8 garment: Single use Tyvek®-cleanroom-overall, overshoes, hairnet, face mask, gloves
- I9G: ISO 9 garment: Single use fabric cleanroom-overall, overshoes, hairnet, face mask, gloves
- NCG: Non-Cleanroom-Garment: Shorts, T-Shirt, face mask, and gloves
- ACR 20 h−1
- ACR 15 h−1
- ACR 10 h−1
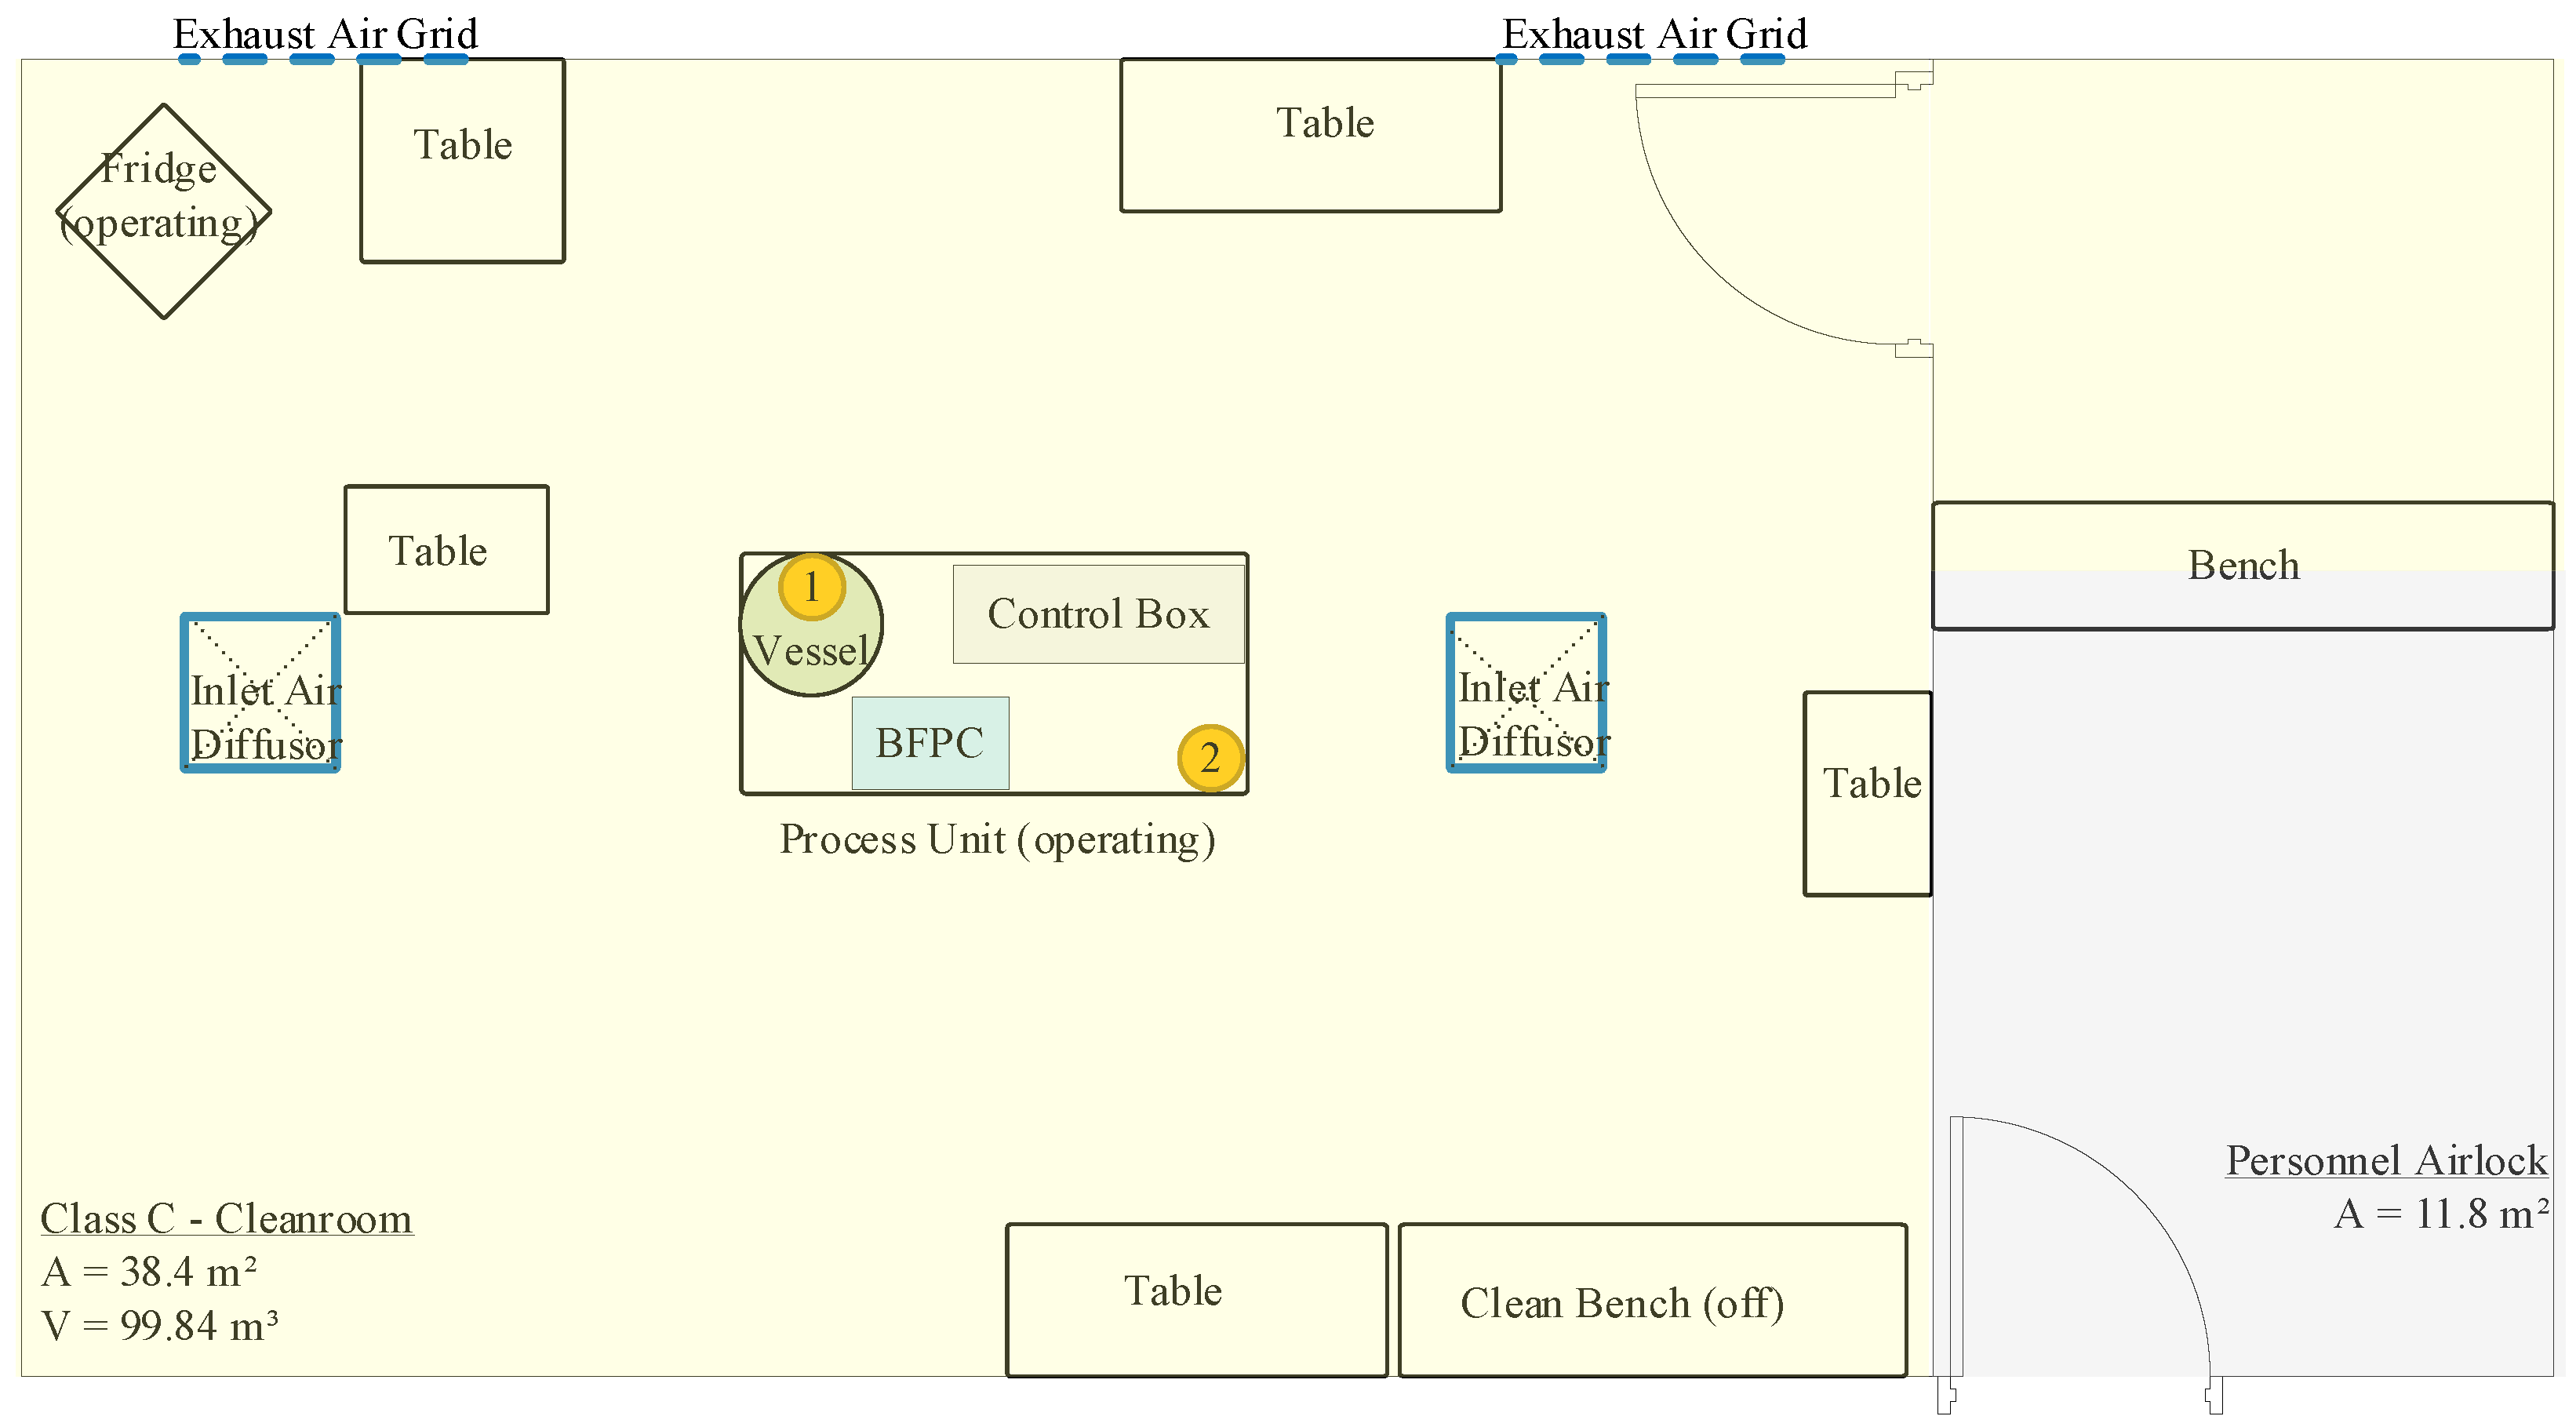
2.2. Cleanroom and Equipment
- I8G/I9G: 7 min/strip—total 683 L (four strips, 28 min + 2 min changeover time)
- NCG: 7 min/strip—total 683 L (four strips, 28 min + 2 min changeover time) plus 5 min with last strip (488 L)
3. Results
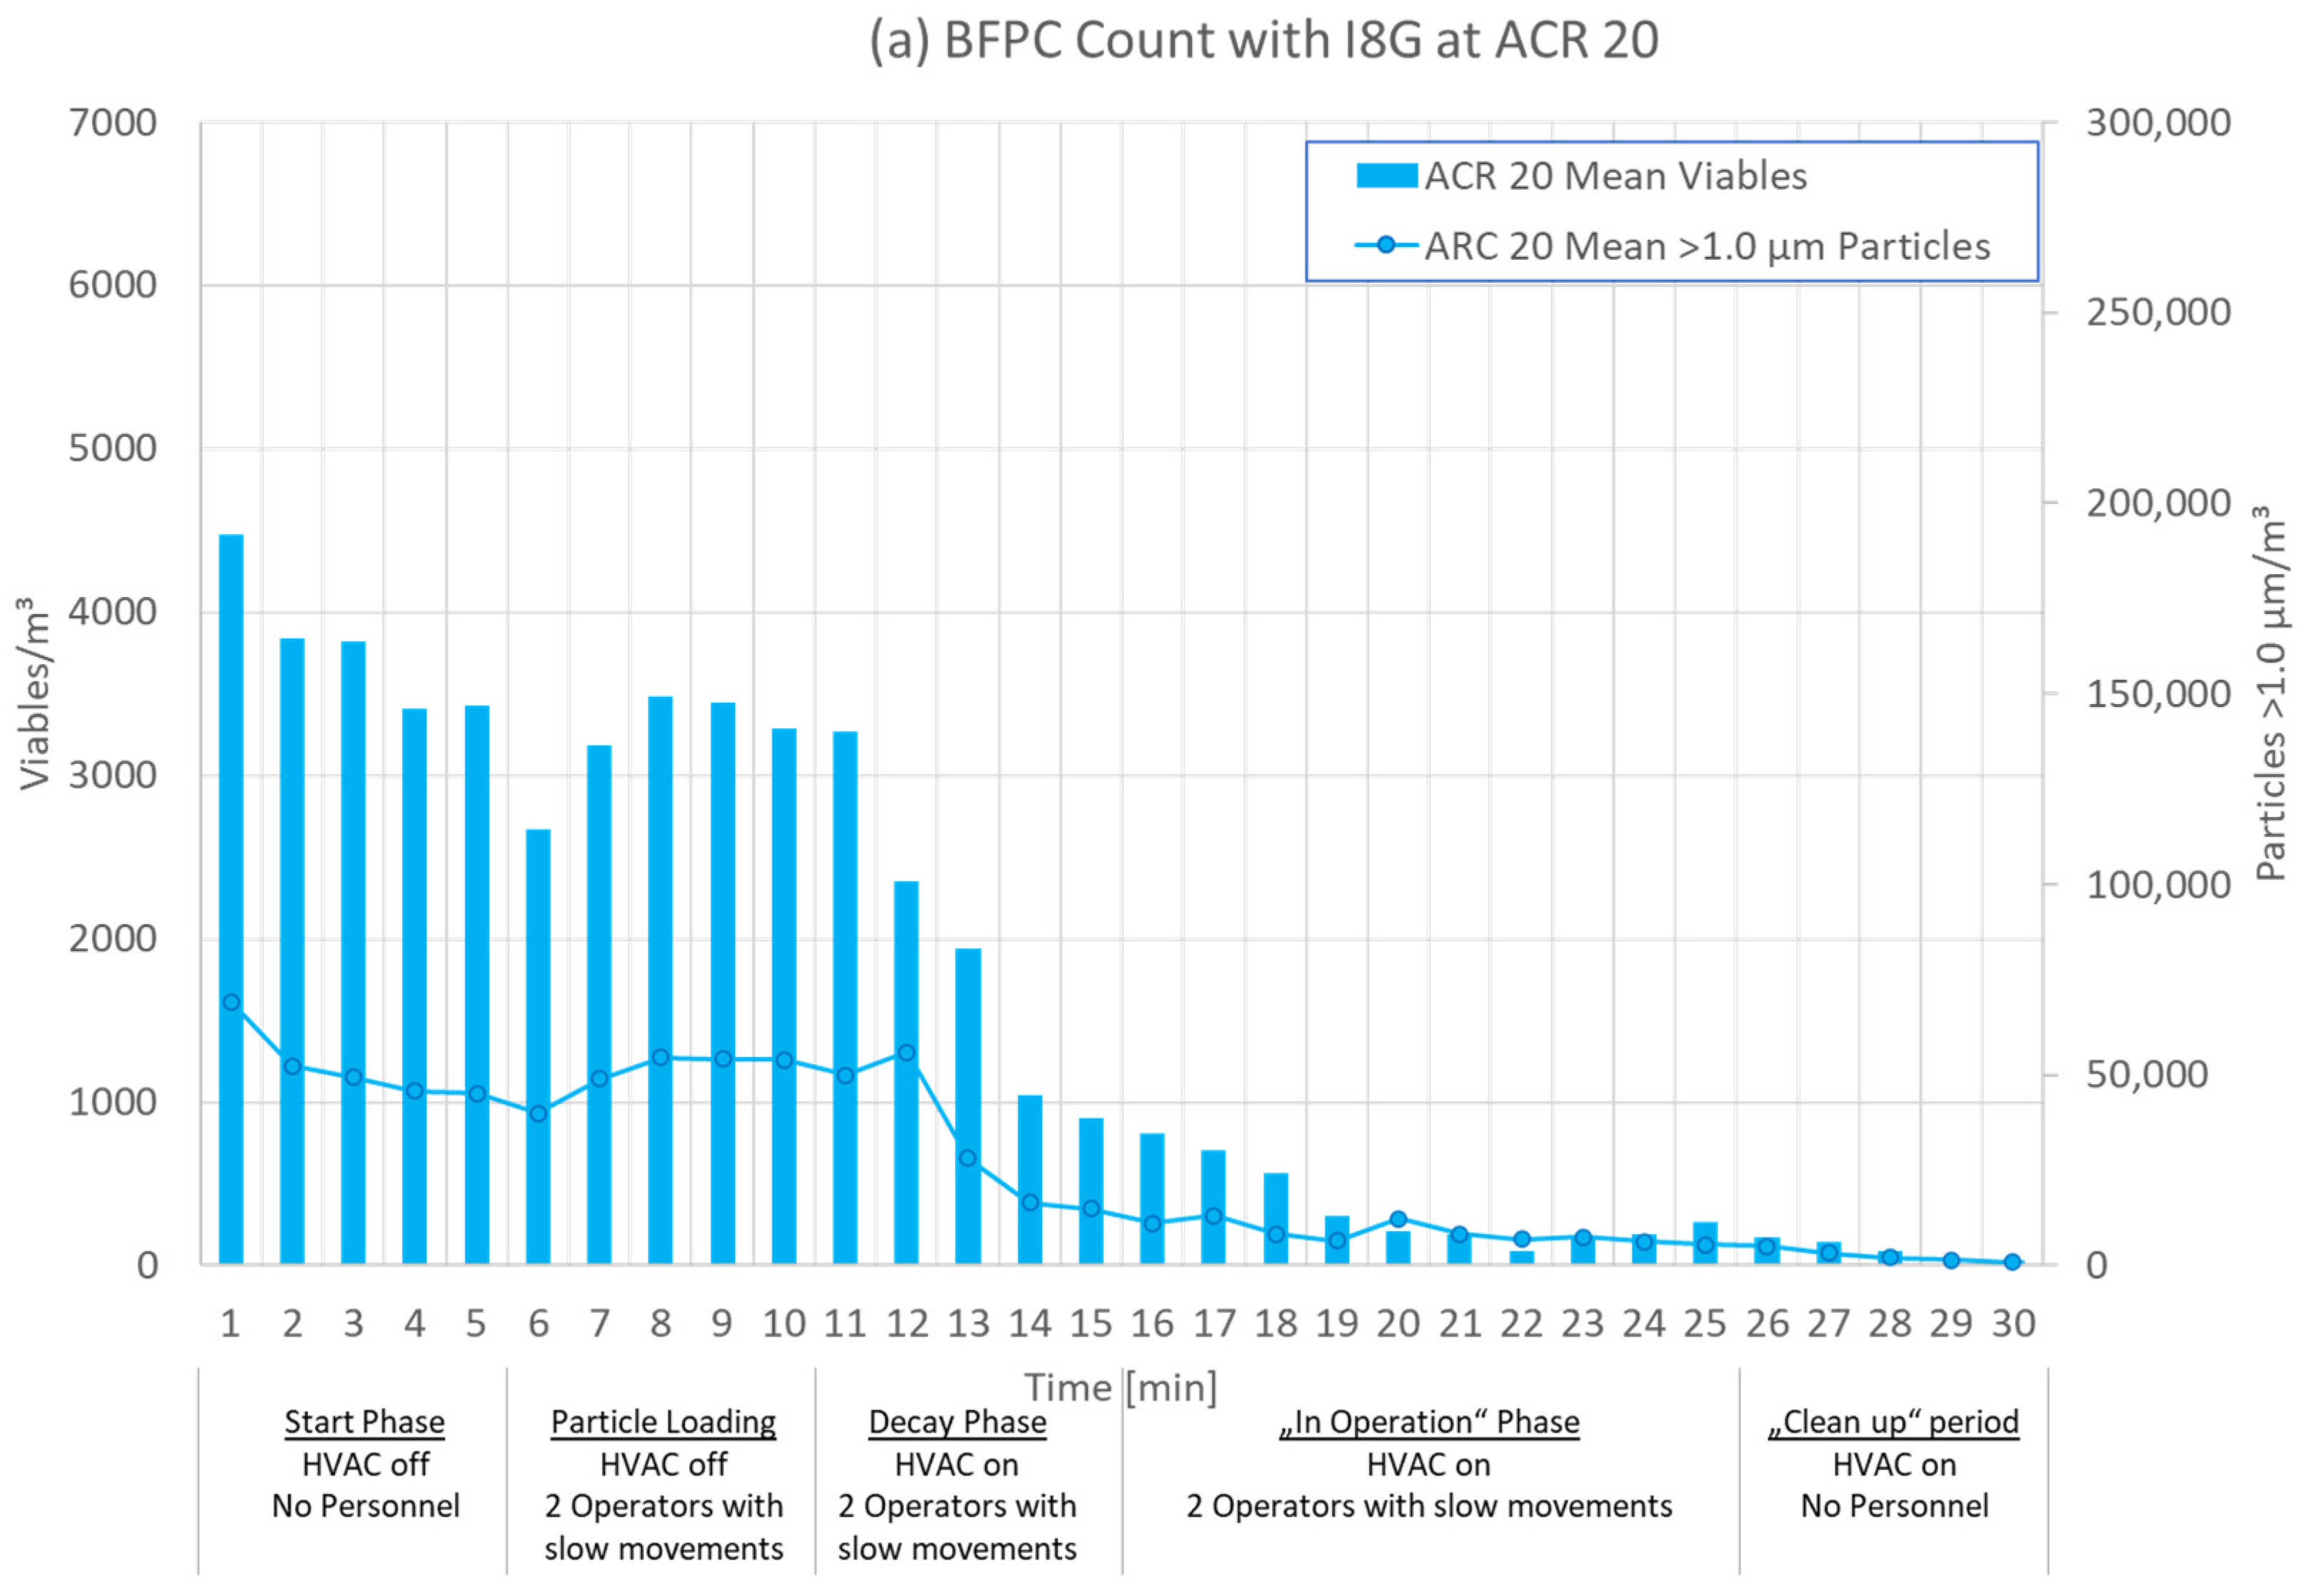
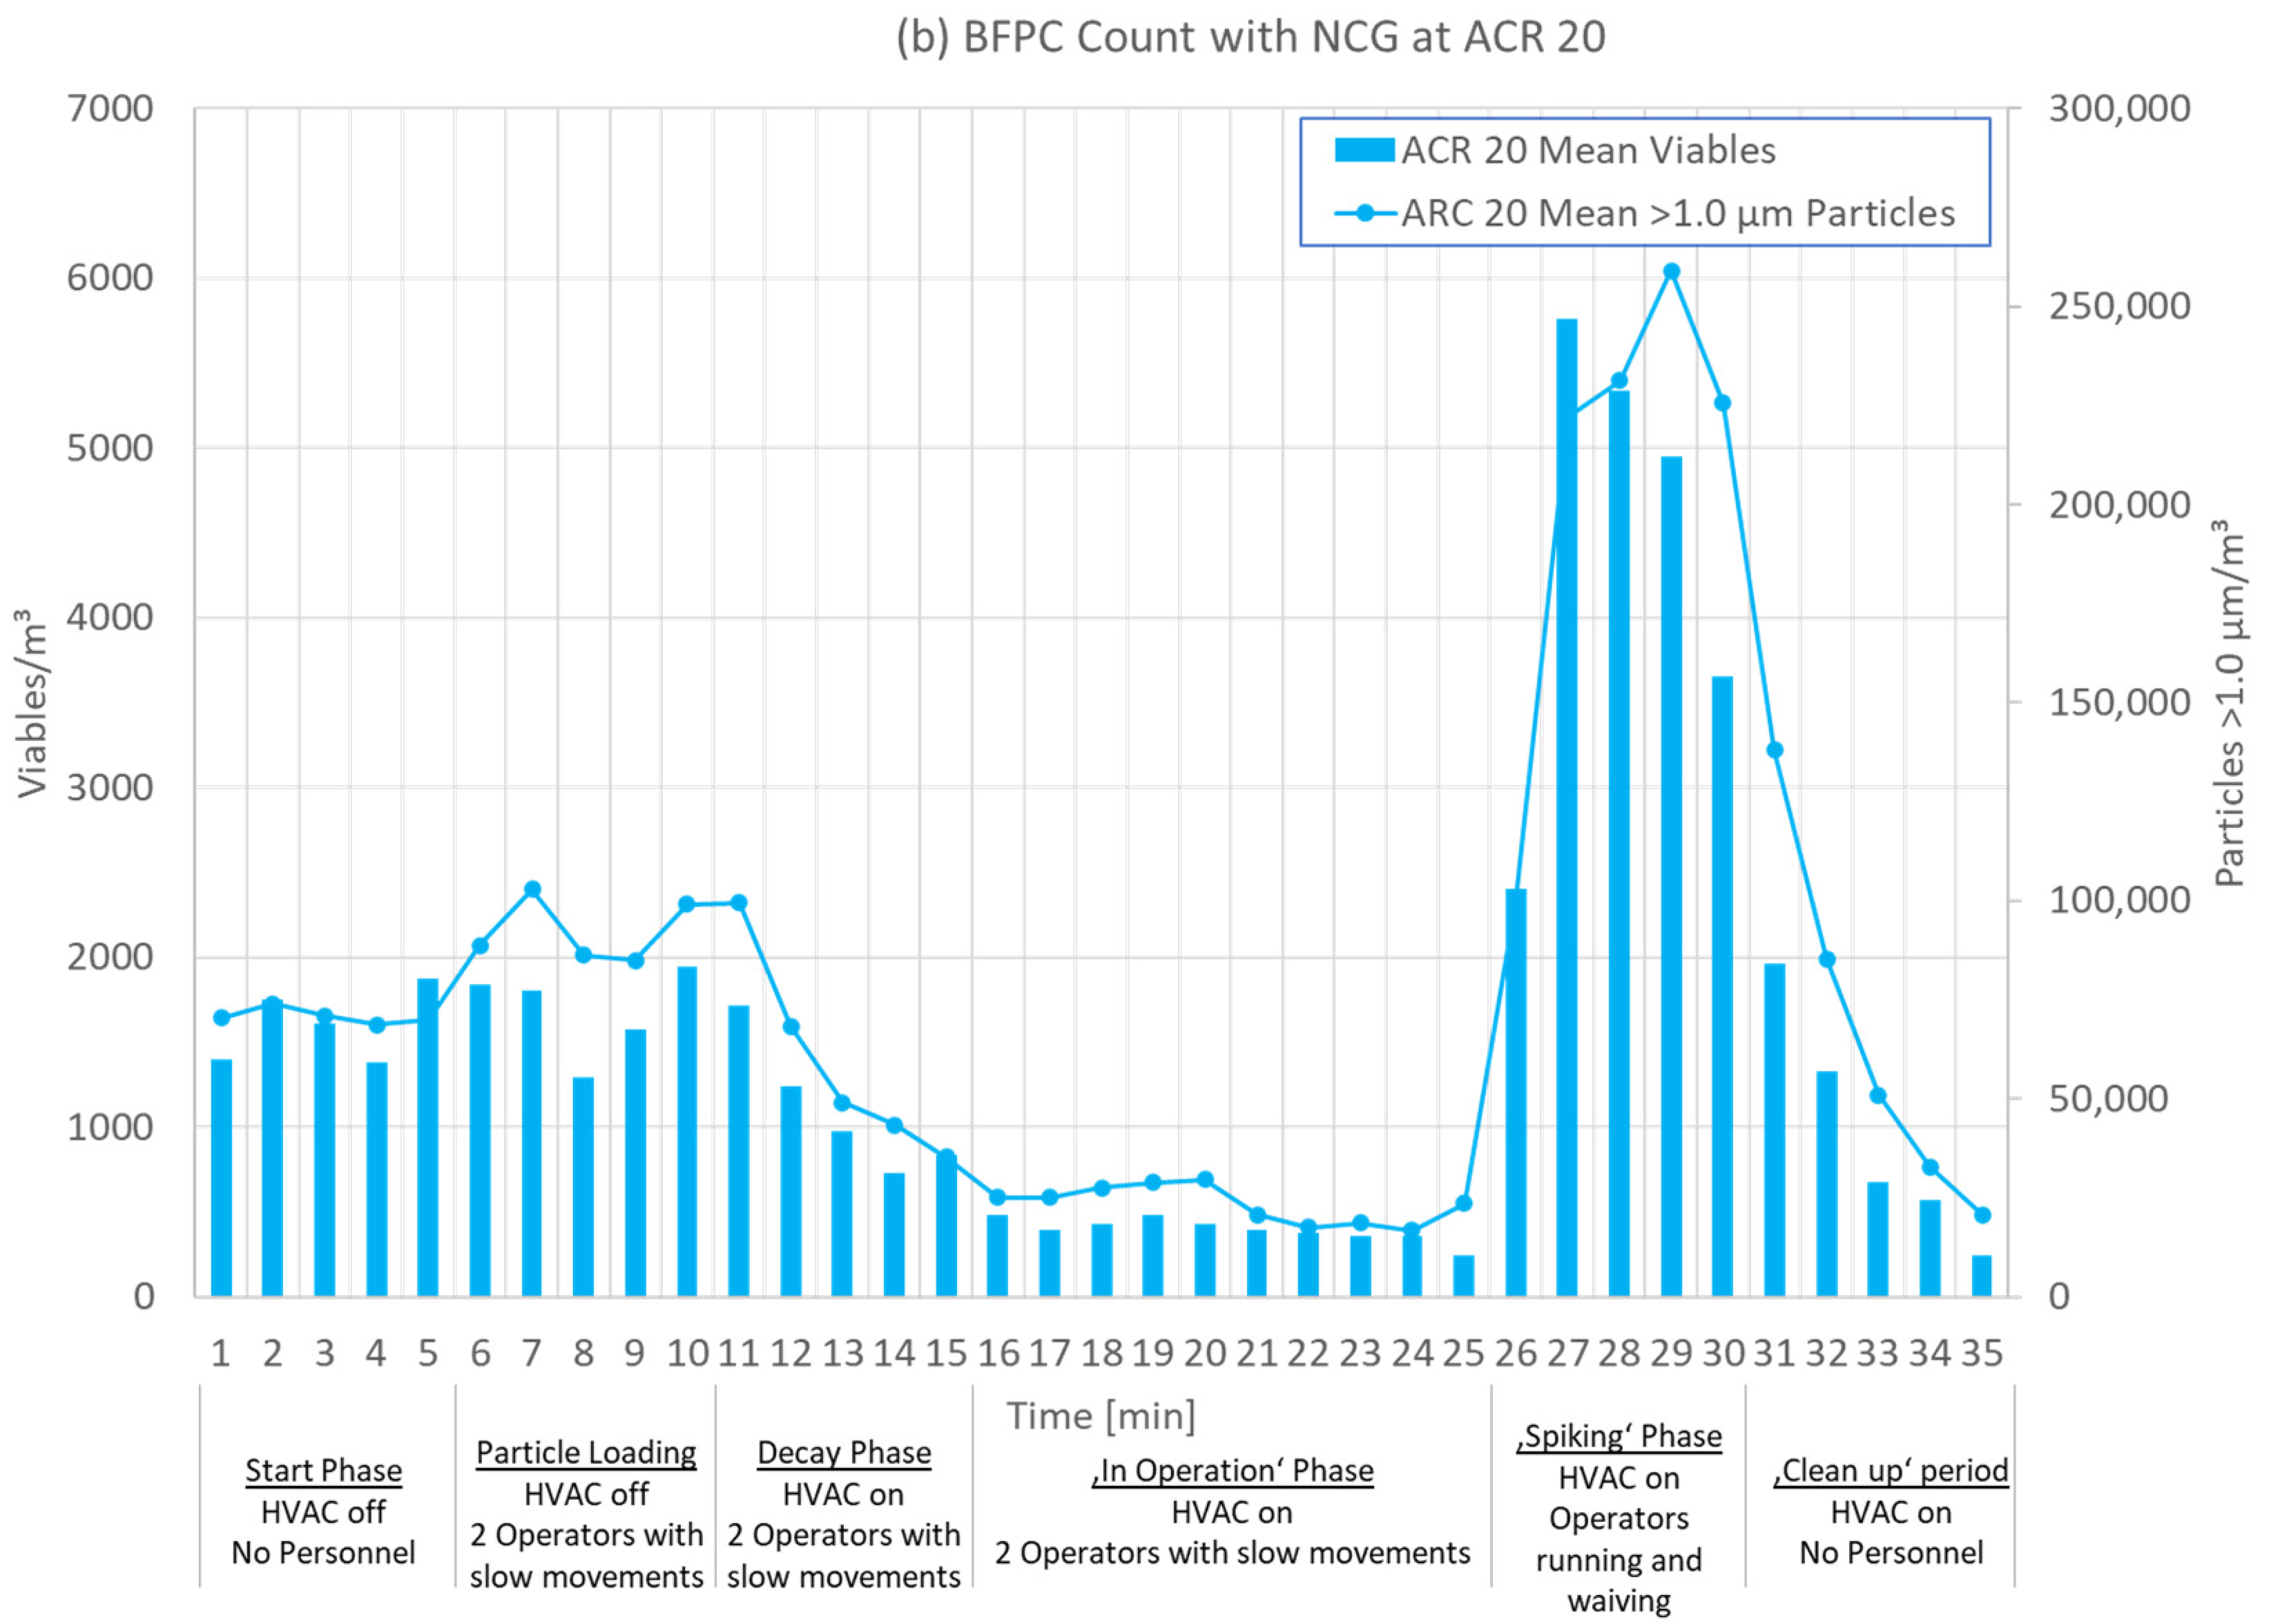
3.1. Test Phases
3.2. Results for Different ACRs
3.3. Viables Versus CFUs
3.4. Influence of 2-Propanol
4. Discussion
Study Limitations
5. Conclusions
Supplementary Materials
Author Contributions
Funding
Institutional Review Board Statement
Informed Consent Statement
Data Availability Statement
Acknowledgments
Conflicts of Interest
Abbreviations
| ACR | Air Change Rate |
| BFPC | Biofluorescent Particle Counter |
| CFU | Colony Forming Units |
| FDA | Food and Drug Administration |
| GMP | Good Manufacturing Practice |
| HVAC | Heating, Ventilation and Air Conditioning |
| IA | Impact Air MAS, low inside process unit |
| ISO | International Organization for Standardization |
| MAS | Microbial Air Sampler |
| MCP | Microbe-Carrying Particle |
| RCS | RCS® High Flow Touch MAS, high inside process unit |
| TSA | Tryptic Soy Agar |
References
- Miller, M.J.; Lindsay, H.; Valverde-Venura, R.; O’Conner, M.J. Evaluation of the BioVigilant IMD-A, a novel optical spectroscopy technology for the continuous and real-time environmental monitoring of viable and nonviable particles. Part I. Review of the technology and comparative studies with conventional methods. PDA J. Pharm. Sci. Technol. 2009, 63, 245–258. Available online: http://rapidmicromethods.com/references/miller_pdaj_part_1.pdf (accessed on 23 February 2022). [PubMed]
- Sandle, T. Real-time counting of airborne particles and microorganisms: A new technological wave? Clean Air Contain. Rev. 2012, 9, 4–6. [Google Scholar]
- Scott, A.; Forng, R.-Y.; Russ, M.; Dalmaso, G.; Hooper, S.; Villari, P.; Cannon, J.; Francis, J.; Dingle, M. A Discussion on Bio-Fluorescent Particle Counters: Summary of the Process and Environmental Monitoring Methods Working Group Meeting with the FDA Emerging Technology Team. PDA J. Pharm. Sci. Technol. 2021, 75, 207–212. [Google Scholar] [CrossRef] [PubMed]
- European Commission. Annex 1: Manufacture of Sterile Medicinal Products (Corrected Version); European Commission: Brussels, Belgium, 2009. [Google Scholar]
- Food and Drug Administration. Sterile Drug Products Produced by Aseptic Processing—Current Good Manufacturing Practice; FDA: Rockville, MD, USA, 2004. [Google Scholar]
- Fedotov. Saving energy in cleanrooms. Cleanroom Technol. 2014, 22, 14–18. [Google Scholar]
- Khoo, C.Y.; Lee, C.-C.; Hu, S.-C. An experimental study on the influences of air change rate and free area ratio of raised-floor on cleanroom particle concentrations. Build. Environ. 2012, 48, 84–88. [Google Scholar] [CrossRef]
- Tschudi, W.; Benschine, K.; Fok, S.; Rumsey, P. Cleanroom energy benchmarking in high-tech and biotech industries. In Proceedings of the 2001 ACEEE Summer Study on Energy Efficiency in Industry, New York, NY, USA, 24–27 July 2001. [Google Scholar]
- Kircher, K.; Shi, X.; Patil, S.; Zhang, K.M. Cleanroom energy efficiency strategies: Modeling and simulation. Energy Build. 2010, 42, 282–289. [Google Scholar] [CrossRef]
- Behrens, D.; Schaefer, J.; Keck, C.M.; Runkel, F.E. Effects of different air change rates on cleanroom ’in operation’ status. Drug Dev. Ind. Pharm. 2022, 47, 1643–1655. [Google Scholar] [CrossRef] [PubMed]
- Mičko, P.; Hečko, D.; Kapjor, A.; Nosek, R.; Kolková, Z.; Hrabovský, P.; Kantová, N.Č. Impact of the Speed of Airflow in a Cleanroom on the Degree of Air Pollution. Appl. Sci. 2022, 12, 2466. [Google Scholar] [CrossRef]
- Parat, S. Contribution of particle counting in assessment of exposure to airborne microorganisms. Atmos. Environ. 1999, 33, 951–959. [Google Scholar] [CrossRef]
- Behrens, D.; Bachhofer, J.; Zipp, B.; Keck, C.; Schäfer, J.; Runkel, F. Abreicherung von Partikeln im Reinraum in Abhängigkeit der Luftwechselrate Pt.1. Technopharm 2020, 10, 284–288. [Google Scholar]
- Behrens, D.; Bachhofer, J.; Zipp, B.; Keck, C.; Schäfer, J.; Runkel, F. Abreicherung von Partikeln im Reinraum in Abhängigkeit der Luftwechselrate Pt.2. Technopharm 2021, 11, 94–99. [Google Scholar]
- Loomans, M.; Ludlage, T.; van den Oever, H.; Molenaar, P.; Kort, H.; Joosten, P. Experimental investigation into cleanroom contamination build-up when applying reduced ventilation and pressure hierarchy conditions as part of demand controlled filtration. Build. Environ. 2020, 176, 106861. [Google Scholar] [CrossRef]
- Loomans, M.; Molenaar, P.; Kort, H.; Joosten, P. Energy demand reduction in pharmaceutical cleanrooms through optimization of ventilation. Energy Build. 2019, 202, 109346. [Google Scholar] [CrossRef]
- Molenaar, P.; Loomans, M.; Joosten, P.; Kort, H. Demand controlled filtration, a high potential energy savings measure for cleanrooms? REHVA J. 2019, 2019, 54–57. [Google Scholar]
- Hill, S.C.; Pinnick, R.G.; Niles, S.; Pan, Y.-L.; Holler, S.; Chang, R.K.; Bottiger, J.; Chen, B.T.; Orr, C.-S.; Feather, G. Real-time measurement of fluorescence spectra from single airborne biological particles. Field Anal. Chem. Technol. 1999, 3, 221–239. [Google Scholar] [CrossRef]
- Weber, J.; Hauschild, J.; Ijzerman-Boon, P.; Forng, R.-Y.; Horsch, J.; Yan, L.; Prasad, A.; Henry, R.B.; Claassen, M.; Villari, P.; et al. Continuous Microbiological Environmental Monitoring for Process Understanding and Reduced Interventions in Aseptic Manufacturing. PDA J. Pharm. Sci. Technol. 2019, 73, 121–134. [Google Scholar] [CrossRef] [PubMed]
- Sandle, T.; Leavy, C.; Jindal, H.; Rhodes, R. Application of rapid microbiological methods for the risk assessment of controlled biopharmaceutical environments. J. Appl. Microbiol. 2014, 116, 1495–1505. [Google Scholar] [CrossRef] [PubMed]
- Andon, B.M. Active air vs. passive air (settle plate) monitoring in routine environmental monitoring programs. PDA J. Pharm. Sci. Technol. 2006, 60, 350–355. [Google Scholar] [PubMed]
- Ayers, F.; Chen, J.-P.; Dingle, M.; Hooper, S.; Lawson, L.; Manzer, D.; Noverini, P.; Prasad, A.; Scott, A.; Villari, P.; et al. Biofluorescent particle counter-based real-time feedback and control of processing conditions. Eur. Pharm. Rev. 2019, 24, 54–57. [Google Scholar]
- Eaton, T.; Davenport, C.; Whyte, W. Airborne microbial monitoring in an operational cleanroom using an instantaneous detection system and high efficiency microbiological samplers. Eur. J. Parenter. Pharm. Sci. 2012, 17, 61–69. [Google Scholar]
- Sandle, T.; Leavy, C.; Rhodes, R. Assessing airborne contamination using a novel rapid microbiological method. Eur. J. Parenter. Pharm. Sci. 2014, 19, 131–141. [Google Scholar]
- Prasad, A.; Milling, A.; Hauschild, J.; Ruh, A.-C.; Horsch, J.; Weber, J.; Yan, L.; Plourde, L.; Claassen, M.; Villari, P.; et al. Practical Applications of Biofluorescent Particle Counting in Environmental Monitoring Investigations. PDA J. Pharm. Sci. Technol. 2020, 74, 318–323. [Google Scholar] [CrossRef] [PubMed]
- Eaton, T.; Wardle, C.; Whyte, W. Use of a real-time microbial air sampler for operational cleanroom monitoring. PDA J. Pharm. Sci. Technol. 2014, 68, 172–184. [Google Scholar] [CrossRef] [PubMed]
- Montenegro-Alvarado, J.-M.; Salvas, J.; Weber, J.; Mejías, S.; Arroyo, R. Pfizer Case Study Rapid Microbial Methods for Manufacturing Recovery after Hurricane María. Available online: https://www.pharmaceuticalonline.com/doc/pfizer-case-study-rapid-microbial-methods-for-manufacturing-recovery-after-hurricane-mar-a-0001 (accessed on 21 January 2022).
- TSI Incorporated. Microbial Monitoring—Continuous and Intervention Free. Available online: www.tsi.com (accessed on 1 August 2022).
- Hutchins, P.M. Real-Time Viable Particle Monitoring How does It Work How Can It Help. Available online: https://www.pharmaceuticalonline.com/doc/real-time-viable-particle-monitoring-how-does-it-work-how-can-it-help-0001?vm_tId=2045890&user=6c1c6778-9ed8-4c70-b761-8c894264be1c&utm_source=et_6214180&utm_medium=email&utm_campaign=PHARM_01-23-2018&utm_term=6c1c6778-9ed8-4c70-b761-8c894264be1c&utm_content=Real-Time%20Viable%20Particle%20Monitoring%3a%20How%20Does%20It%20Work%3f%20How%20Can%20It%20Help%3f (accessed on 26 May 2021).
- Merck Millipore. RCS® High Flow Touch: Microbial Safety at Your Fingertips. Available online: www.merckmillipore.com/biomonitoring (accessed on 19 April 2021).
- Pinpoint Scientific. ImpactAir_IS0-90_Brochure. Available online: https://www.pmtgb.com/fileadmin/Datasheets_UK/ImpactAir_IS0-90_Brochure.pdf (accessed on 23 February 2021).
- Merck Millipore. Tryptic Soy Agar + LTHTh—ICR: Technical Data Sheet. Available online: www.merckmillipore.com/biomonitoring (accessed on 19 April 2021).
- Merck Millipore. Hycon® Agar Strips TSM: Technical Data Sheet. Available online: www.merckmillipore.com/biomonitoring (accessed on 19 April 2021).
- Dinno, A. Nonparametric Pairwise Multiple Comparisons in Independent Groups using Dunn’s Test. Stata J. 2015, 15, 292–300. [Google Scholar] [CrossRef]
- DIN EN ISO 14644-1; Cleanrooms and Associated Controlled Environments-Part 1: Classification of Air Cleanliness by Particle Concentration. Beuth: Berlin, Germany, 2015.
- Bhupathiraju, V.K.; Varnau, B.; Nelson, J.R.; Jiang, J.P.; Bolotin, C. Evaluation of an Instantaneous Microbial Detection Systemin Controlledand Cleanroom Environments. BioPharm Int. 2007, 2007, 35–46. [Google Scholar]
- Tschudi. Energy efficiency strategies for cleanrooms without compromising environmental conditions. ASHRAE Trans. 2005, 111, 637. [Google Scholar]


| Test Sequence and Setup | ||
|---|---|---|
| Preparation Day | ||
| Cleaning & Disinfection | ||
| Test No. | ACR | Garment |
| 1st Day | ||
| Test 1 | 20 h−1 | I8G |
| Test 2 | 20 h−1 | I8G |
| Test 3 | 15 h−1 | I8G |
| Test 4 | 15 h−1 | I8G |
| Test 5 | 10 h−1 | I8G |
| Test 6 | 10 h−1 | I8G |
| Test 7 | 20 h−1 | I9G |
| 2nd Day | ||
| Test 8 | 20 h−1 | I9G |
| Test 9 | 15 h−1 | I9G |
| Test 10 | 15 h−1 | I9G |
| Test 11 | 10 h−1 | I9G |
| Test 12 | 10 h−1 | I9G |
| Test 13 | 20 h−1 | NCG |
| Test 14 | 20 h−1 | NCG |
| 3rd Day | ||
| Test 15 | 15 h−1 | NCG |
| Test 16 | 15 h−1 | NCG |
| Test 17 | 10 h−1 | NCG |
| Test 18 | 10 h−1 | NCG |
| 0–5 min | 6–10 min | 11–15 min | 16–25 min | 26–30 min |
|---|---|---|---|---|
| Start Phase | Particle Loading | Decay Phase | ‘In Operation’ Phase | ‘Clean up’ Phase |
| HVAC off No operators | HVAC off Two operators moving slowly | HVAC on Two operators moving slowly | HVAC on Two operators moving slowly | HVAC on No operators |
| No. | ACR | Garment | Particles > 1.0 µm/m3 | MCPs/m3 | Mean MCPs/m3 | Ratio | IA CFU/m3 | Mean IA CFU/m3 | RCS CFU/m3 | Mean RCS CFU/m3 | Spray Bottles Used |
|---|---|---|---|---|---|---|---|---|---|---|---|
| Test 1 | 20 | I8G | 5819 | 224 | 185.5 | 26.0 | 9.5 | 5 | 4.4 | 2 | No |
| Test 2 | 20 | I8G | 9817 | 147 | 66.8 | 0 | 0 | No | |||
| Test 3 | 15 | I8G | 11596 | 518 | 518 | 22.4 | - | - | 0 | 2 | No |
| Test 4 | 15 | I8G | 13592 | not valid due to disinfection spray bottle use | 15.6 | - | 4.4 | Yes | |||
| Test 5 | 10 | I8G | 23969 | 13.7 | 0 | 0 | 5.9 | 3 | Yes | ||
| Test 6 | 10 | I8G | 29240 | 15.6 | 0 | 0 | Yes | ||||
| Test 7 | 20 | I9G | 22750 | 20.1 | 0 | 5 | 1.5 | 1 | Yes | ||
| Test 8 | 20 | I9G | 5218 | 59 | 59 | 88.4 | 9.5 | 0 | No | ||
| Test 9 | 15 | I9G | 5277 | 100 | 82.5 | 52.8 | 0 | 0 | 1.5 | 2 | No |
| Test 10 | 15 | I9G | 3345 | 65 | 51.5 | 0 | 1.5 | No | |||
| Test 11 | 10 | I9G | 8846 | 183 | 174 | 48.3 | 9.5 | 10 | 8.8 | 6 | No |
| Test 12 | 10 | I9G | 4164 | 165 | 25.2 | 9.5 | 2.9 | No | |||
| Test 13 | 20 | NCG | 5430 | 159 | 356.5 | 34.2 | 33.3 | 58 | 48.3 | 57 | No |
| Test 14 | 20 | NCG | 37767 | 554 | 68.2 | 83.3 | 65.9 | No | |||
| Test 15 | 15 | NCG | 81331 | 931 | 798 | 87.4 | 158.3 | 113 | 82 | 75 | No |
| Test 16 | 15 | NCG | 51449 | 665 | 77.4 | 66.7 | 67.3 | No | |||
| Test 17 | 10 | NCG | 68993 | 895 | 1145.5 | 77.1 | 83.3 | 129 | 48.3 | 64 | No |
| Test 18 | 10 | NCG | 84717 | 1396 | 60.7 | 175 | 80.5 | No | |||
| Overall Correlation in Experimental Study | Spearman’s ρ | p | ||
|---|---|---|---|---|
| Particles > 1.0 µm/m3 | - | Viables/m3 | 0.864 | <0.001 |
| Particles > 1.0 µm/m3 | - | CFU/m3 on RCS-TSA strips | 0.778 | <0.001 |
| Particles > 1.0 µm/m3 | - | CFU/m3 on 90 mm TSA plate | 0.705 | <0.001 |
| Viables/m3 | - | CFU/m3 on RCS-TSA strips | 0.623 | <0.001 |
| Viables/m3 | - | CFU/m3 on 90 mm TSA plate | 0.472 | <0.001 |
| CFU/m3 on RCS-TSA strips | - | CFU/m3 on 90 mm TSA plate | 0.758 | <0.001 |
Publisher’s Note: MDPI stays neutral with regard to jurisdictional claims in published maps and institutional affiliations. |
© 2022 by the authors. Licensee MDPI, Basel, Switzerland. This article is an open access article distributed under the terms and conditions of the Creative Commons Attribution (CC BY) license (https://creativecommons.org/licenses/by/4.0/).
Share and Cite
Behrens, D.; Schaefer, J.; Keck, C.M.; Runkel, F.E. Application of Biofluorescent Particle Counters for Real-Time Bioburden Control in Aseptic Cleanroom Manufacturing. Appl. Sci. 2022, 12, 8108. https://doi.org/10.3390/app12168108
Behrens D, Schaefer J, Keck CM, Runkel FE. Application of Biofluorescent Particle Counters for Real-Time Bioburden Control in Aseptic Cleanroom Manufacturing. Applied Sciences. 2022; 12(16):8108. https://doi.org/10.3390/app12168108
Chicago/Turabian StyleBehrens, Detlef, Jens Schaefer, Cornelia M. Keck, and Frank E. Runkel. 2022. "Application of Biofluorescent Particle Counters for Real-Time Bioburden Control in Aseptic Cleanroom Manufacturing" Applied Sciences 12, no. 16: 8108. https://doi.org/10.3390/app12168108
APA StyleBehrens, D., Schaefer, J., Keck, C. M., & Runkel, F. E. (2022). Application of Biofluorescent Particle Counters for Real-Time Bioburden Control in Aseptic Cleanroom Manufacturing. Applied Sciences, 12(16), 8108. https://doi.org/10.3390/app12168108