Article

Large-Scale 3D Multi-Story Enterprise Layout Design in a New Type of Industrial Park in China

1
Research Institute of Macro-Safety Science, School of Civil & Resource Engineering, University of Science and Technology Beijing, Beijing 100083, China
2
Department of Statistics & Operations Research, College of Sciences, King Saud University, Riyadh 11451, Saudi Arabia
*
Author to whom correspondence should be addressed.
Appl. Sci. 2022, 12(16), 8110; https://doi.org/10.3390/app12168110
Submission received: 20 July 2022 / Revised: 7 August 2022 / Accepted: 8 August 2022 / Published: 12 August 2022
(This article belongs to the Special Issue Advanced Manufacturing Technologies: Development and Prospect)

Abstract

:
In the new-type clustered industrial park, the closer distance between enterprises leads to risk aggregation, and the layout of enterprises affects the safety and economy of the park. However, previous studies have often paid insufficient attention to safety, and few studies have considered park profits. To address this issue, a bi-level three-dimensional layout optimization model was proposed to minimize the overall association risk of the park and maximize the rental profit. In particular, this article explained the enterprise association risks and provided calculation formulas, considering multiple risk types. To solve the proposed nonlinear model, a specific variable conversion method was presented to reduce the problem scale. Subsequently, an improved genetic algorithm was developed and applied to obtain the layout results. Furthermore, a case study of an industrial park was conducted, and the computational results indicated the validity of the model and methods. Finally, two different scenarios were implemented, and critical parameters were tested to provide valuable management insights.

1. Introduction

The layout problem in new-type industrial parks is the large-scale 3D multi-story enterprise layout design (3DMSELD). According to certain principles, the enterprises will be reasonably distributed on all floors of each building in the park. Traditional industrial park layout problems are mainly carried out on a two-dimensional plane [1]. However, intensive production models have become increasingly common with economic development. Many new-type clustered industrial parks have emerged in China and are distributed in the eastern coastal region. These parks generally have multiple multistory buildings leased to dozens of enterprises, which involves the large-scale 3DMSELD problem. Factory intensification can significantly improve land and infrastructure utilization rates. However, it also creates a concentration of risks. The shortening distance between enterprises has led to a greater possibility of risk interactions. An accident in one enterprise can lead to injury or property damage to others and may even trigger a domino effect [2]. Therefore, it is necessary to consider the risk factors in the park layout problems.
With social development, people attach greater importance to safety, and how to reduce risk through layout has become the research focus. Most studies involving safety have considered safety factors as safety costs or constraints. For instance, Caputo [3] demonstrated that safety-related costs are relevant for defining optimal layout; Wang [4] treated multiple hazard sources as risk costs in the objective function. However, the safety status of enterprises in clustered industrial parks is closely related, and it is worthwhile to focus on safety factors separately. In particular, Wang [5] argued that it would be inappropriate to turn safety issues into economic numbers in objective functions. The layout problem has been around for a long time; many previous studies have focused on the single-story layout of a facility [6]. Rosenblatt [7] proposed a combined quantitative and qualitative approach to the facilities layout problem on a two-dimensional plane. Penteado [8] constructed a model to provide a chemical plant’s optimal layout of process equipment. These studies did not solve the three-dimensional layout problem. Research on multi-story layouts has become a hot topic with an increase in multi-story workshops. Kia [9] and Latifi [10] presented two 3D models to describe the facility layout problem. However, there are few studies on the three-dimensional optimization layouts at the industrial park level with enterprises as the smallest layout unit. In addition, the park management party’s main profit comes from rent affected by the layout. Nevertheless, this has rarely been considered in previous studies.
Although significant progress has been made in related fields, we can get some research gaps from the above discussion. First, there is a lack of theoretical research on the large-scale 3DMSELD problem; Second, researchers have not treated the risk impact between enterprises in much detail; Third, there is a lack of consideration for rental profit in the layout problem. To address the gaps mentioned above, this study used a bi-level integer nonlinear programming (BLINLP) model considering enterprise association risks and rental profit to make hierarchical decisions at the layout stage. First, settled enterprises were divided into risk and non/low risk enterprises. Priority was given to reducing the risk level of the parks. Because the enterprise’s inherent risks do not change with location, this study only considered the associated risk between enterprises. For non/low risk enterprises, rents were considered to create enterprise layouts to maximize the park’s income. Subsequently, a BLINLP model was presented to solve the large-scale 3DMSELD problem. To reduce problem size, a specific variable conversion method was proposed. Then, an improved evolutionary algorithm was applied. In addition, a case study was conducted using data from an industrial park in Shunde. Consequently, this study focuses on addressing the large-scale 3DMSELD problem considering enterprise association risk and rental profit. The following key questions are required to address the main concerns of this study:
(1) 
How to define the enterprise association risk?
(2) 
How to formulate a bi-level optimization model for the large-scale 3DMSELD problem?
(3) 
How to solve the proposed nonlinear bi-level model?
To solve the large-scale 3DMSELD problem with the above questions, a BLINLP model was developed in this study. Compared with the existing studies, this work makes the following main contributions: (a) this study considers a three-dimensional layout optimization problem with multi-building, multi-floor, and multi-enterprises factors; (b) the enterprises association risk calculation formulas are proposed and used as the layout goal; (c) our study constructs a BLINLP model and proposes a variable conversion strategy to reduce the problem size. The remainder of this article is organized as follows. Section 2 presents a literature review of the main concerns of this study, in which research gaps are identified. Section 3 describes the enterprise layout problem with two goals, where the association risks are explained and calculated. To address this problem, the BLINLP model is presented in Section 4. Then, an improved genetic algorithm (GA) is developed and presented after the decision variables are converted in Section 5. Section 6 presents a case study in which the obtained results validate the effectiveness of the proposed model. Finally, Section 7 concludes the study by summarizing the findings and highlighting future directions.

2. Literature Review

Our work aims to develop a computable BLINLP model to solve the large-scale 3DMSELD problem. This section reviews the literature by discussing dozens of studies on the influencing factors in the layout, formulation of association risks, mathematical programming, and solving algorithms.

2.1. Influencing Factors in Layout

The facility layout in a single plant or plant layout in an industrial area significantly impacts manufacturing costs, energy losses [11], enterprise performance, and safety [12,13]. Economy and safety are the two main factors considered in the layout design. Previous research has focused on minimizing the layout costs [14], including pipelines [15], land, and internal costs (e.g., cost of moving materials). Wang [16] proposed a model to minimize the piping investment, pump power, land, and floor construction costs. Derhami [17] focused on reducing the operational costs of warehouses by layout. The park leases plants to the enterprise, and rent is the primary profit source of the park. Unlike previous studies that considered costs, this study sets maximizing rental profits as an objective function.
In addition, some studies have considered safety factors in the layout [18]. de Lira-Flores [19] proposed a mixed integer nonlinear programming (MINLP) approach to solve the plant layout problem with the objective of reducing the risk of the process plant. Medina-Herrera [20] used quantitative risk analysis (QRA) to design a plant layout. Factors of multiple hazard sources in explosion accidents were considered in Wang [4]. Latifi [10] considered the toxic release risk and possible scenarios of fire, explosion, and domino effects in their layout model. To address safety issues, this study considered the risk association between enterprises in the optimization model.

2.2. Formulation of Association Risks

The industrial park acts as a complex system in which enterprises interact with each other. Enterprise association risk reflects the degree of impact between enterprise risks. A critical issue in studying association risk is its measurement. Wang [5] adopted the trinitrotoluene (TNT) equivalent and Pasquill-Gifford models to evaluate workers’ death probabilities and structural damage to buildings. Groth [21] used a software toolkit to conduct a QRA and consequence analysis relevant to assessing the safety of hydrogen fueling and storage infrastructure. Medina-Herrera [20] used consequence analyses and probit models to quantify the effects of catastrophic outcomes. Brunoro Ahumada [18] developed a framework integrating layout formulation with a QRA method.
In addition, domino accidents [22,23] can occur in the new-type clustered industrial parks, and studies have been conducted to describe them quantitatively. Hazardous events such as pool fires, jet fires, flash fires, fireballs, and blast waves resulting from explosions were considered by Ejeh [24]. An optimization-based approach for obtaining safe plant layout designs using the domino hazard index was presented in this article. Liu [25] established a consequence and probability model for the domino effect initiated by fires and explosions. Ding [26] modeled the spatial-temporal evolution of domino effects, and the risk was assessed by the time to failure and escalation probability. Ni [27] proposed a relative risk model to assess the domino effect in the chemical process industry. Furthermore, field theory and Monte Carlo simulations have been adopted for the risk assessment of domino accidents [28]. Although many relevant studies exist, the association risks between enterprises in a three-dimensional space still need to be further classified and studied.

2.3. Bi-Level Optimization Model

Both practical and theoretical studies have demonstrated the importance of properly constructing mathematical models for layouts involving multiple buildings, multiple stories, and multiple enterprises. Layout issues often involve multiple goals, and these goals are not necessarily considered to have the same priority. Multilayer optimization models can reflect hierarchical relationships. Lu [29] introduced bi-level and tri-level decision making. Cao [30] proposed a fuzzy bi-level optimization model for multi-period post-disaster relief distribution. Yang [31] constructed a bi-level optimization model for large-scale electric vehicle charging. Although bi-level optimization theory is relatively mature, the current research on layout problems basically use single-level programming. For instance, Che [32] proposed a bi-objective MINLP model to minimize the total material handling cost and total occupied room area. Martinez-Gomez [33] considered the economic and safety issues in a single-level programming model. Because our study has two goals and is more focused on minimizing risk, a hierarchical optimization model is used that differs from previous ones.

2.4. Model Solving Algorithm

Optimization model solving strategies can be divided into exact and heuristic algorithms. For exact algorithms, the simplex algorithm [34], branch-and-bound algorithm [35], and Benders decomposition algorithms are commonly used. For instance, Ahmadi [36] used the CPLEX software to precisely solve the proposed multiple-stage mathematical programming model. However, exact algorithms are more suitable for solving small-scale linear models and more challenging for large-scale problems. Therefore, many studies have used heuristic algorithms to solve these problems [37,38]. Caputo [3] proposed a method based on a GA to optimize the process plant layout. Chen [39] presented a heuristic approach combining an improved adaptive GA with scatter search. In the present study, an improved GA was used.

2.5. Summary

In addition to the discussion above, Table 1 provides a comprehensive literature review. Some gaps in the literature can be addressed as follows. First, many recent studies have focused on single-story facility layouts in plants. However, only a few studies have addressed multi-story layout problems. Second, most existing studies do not pay sufficient attention to risk, often only adding risk as a risk cost to the objective function of minimizing layout costs. Third, previous studies scarcely considered parks’ profits. Therefore, this study focuses on the large-scale 3DMSELD problem considering risk and profit. In addition, a BLINLP model is proposed to formulate the above problem, which has two goals: (a) minimization of association risk and (b) maximization of rental profit. To solve this problem, a special decision variable conversion method is first presented to reduce the problem scale. This study also applied an improved GA method to handle large-scale problems. Finally, a case study with different scenario simulations and a sensitivity analysis was implemented to validate the proposed nonlinear model and solution methods.

3. Problem Description

The new-type clustered industrial park layout involves multiple buildings and floors, considering the enterprises association risk and rental profit. This section describes the main problem in the following four subsections.

3.1. New-Type Clustered Industrial Park

The new-type clustered industrial parks are currently numerous in China and have the following characteristics: (a) they contain several multi-story buildings, (b) their factories are intensive and standard. The enterprise leases one or more factories for production and operation, and (c) complete supporting services. The park management party manages the entire park and provides complementary services. Each building in the park may consist of multiple enterprises of different types, such as packaging and printing, machinery and equipment, e-commerce, and furniture manufacturing. These enterprises are geographically located in the park and share park infrastructure, creating a concentration of safety risks.

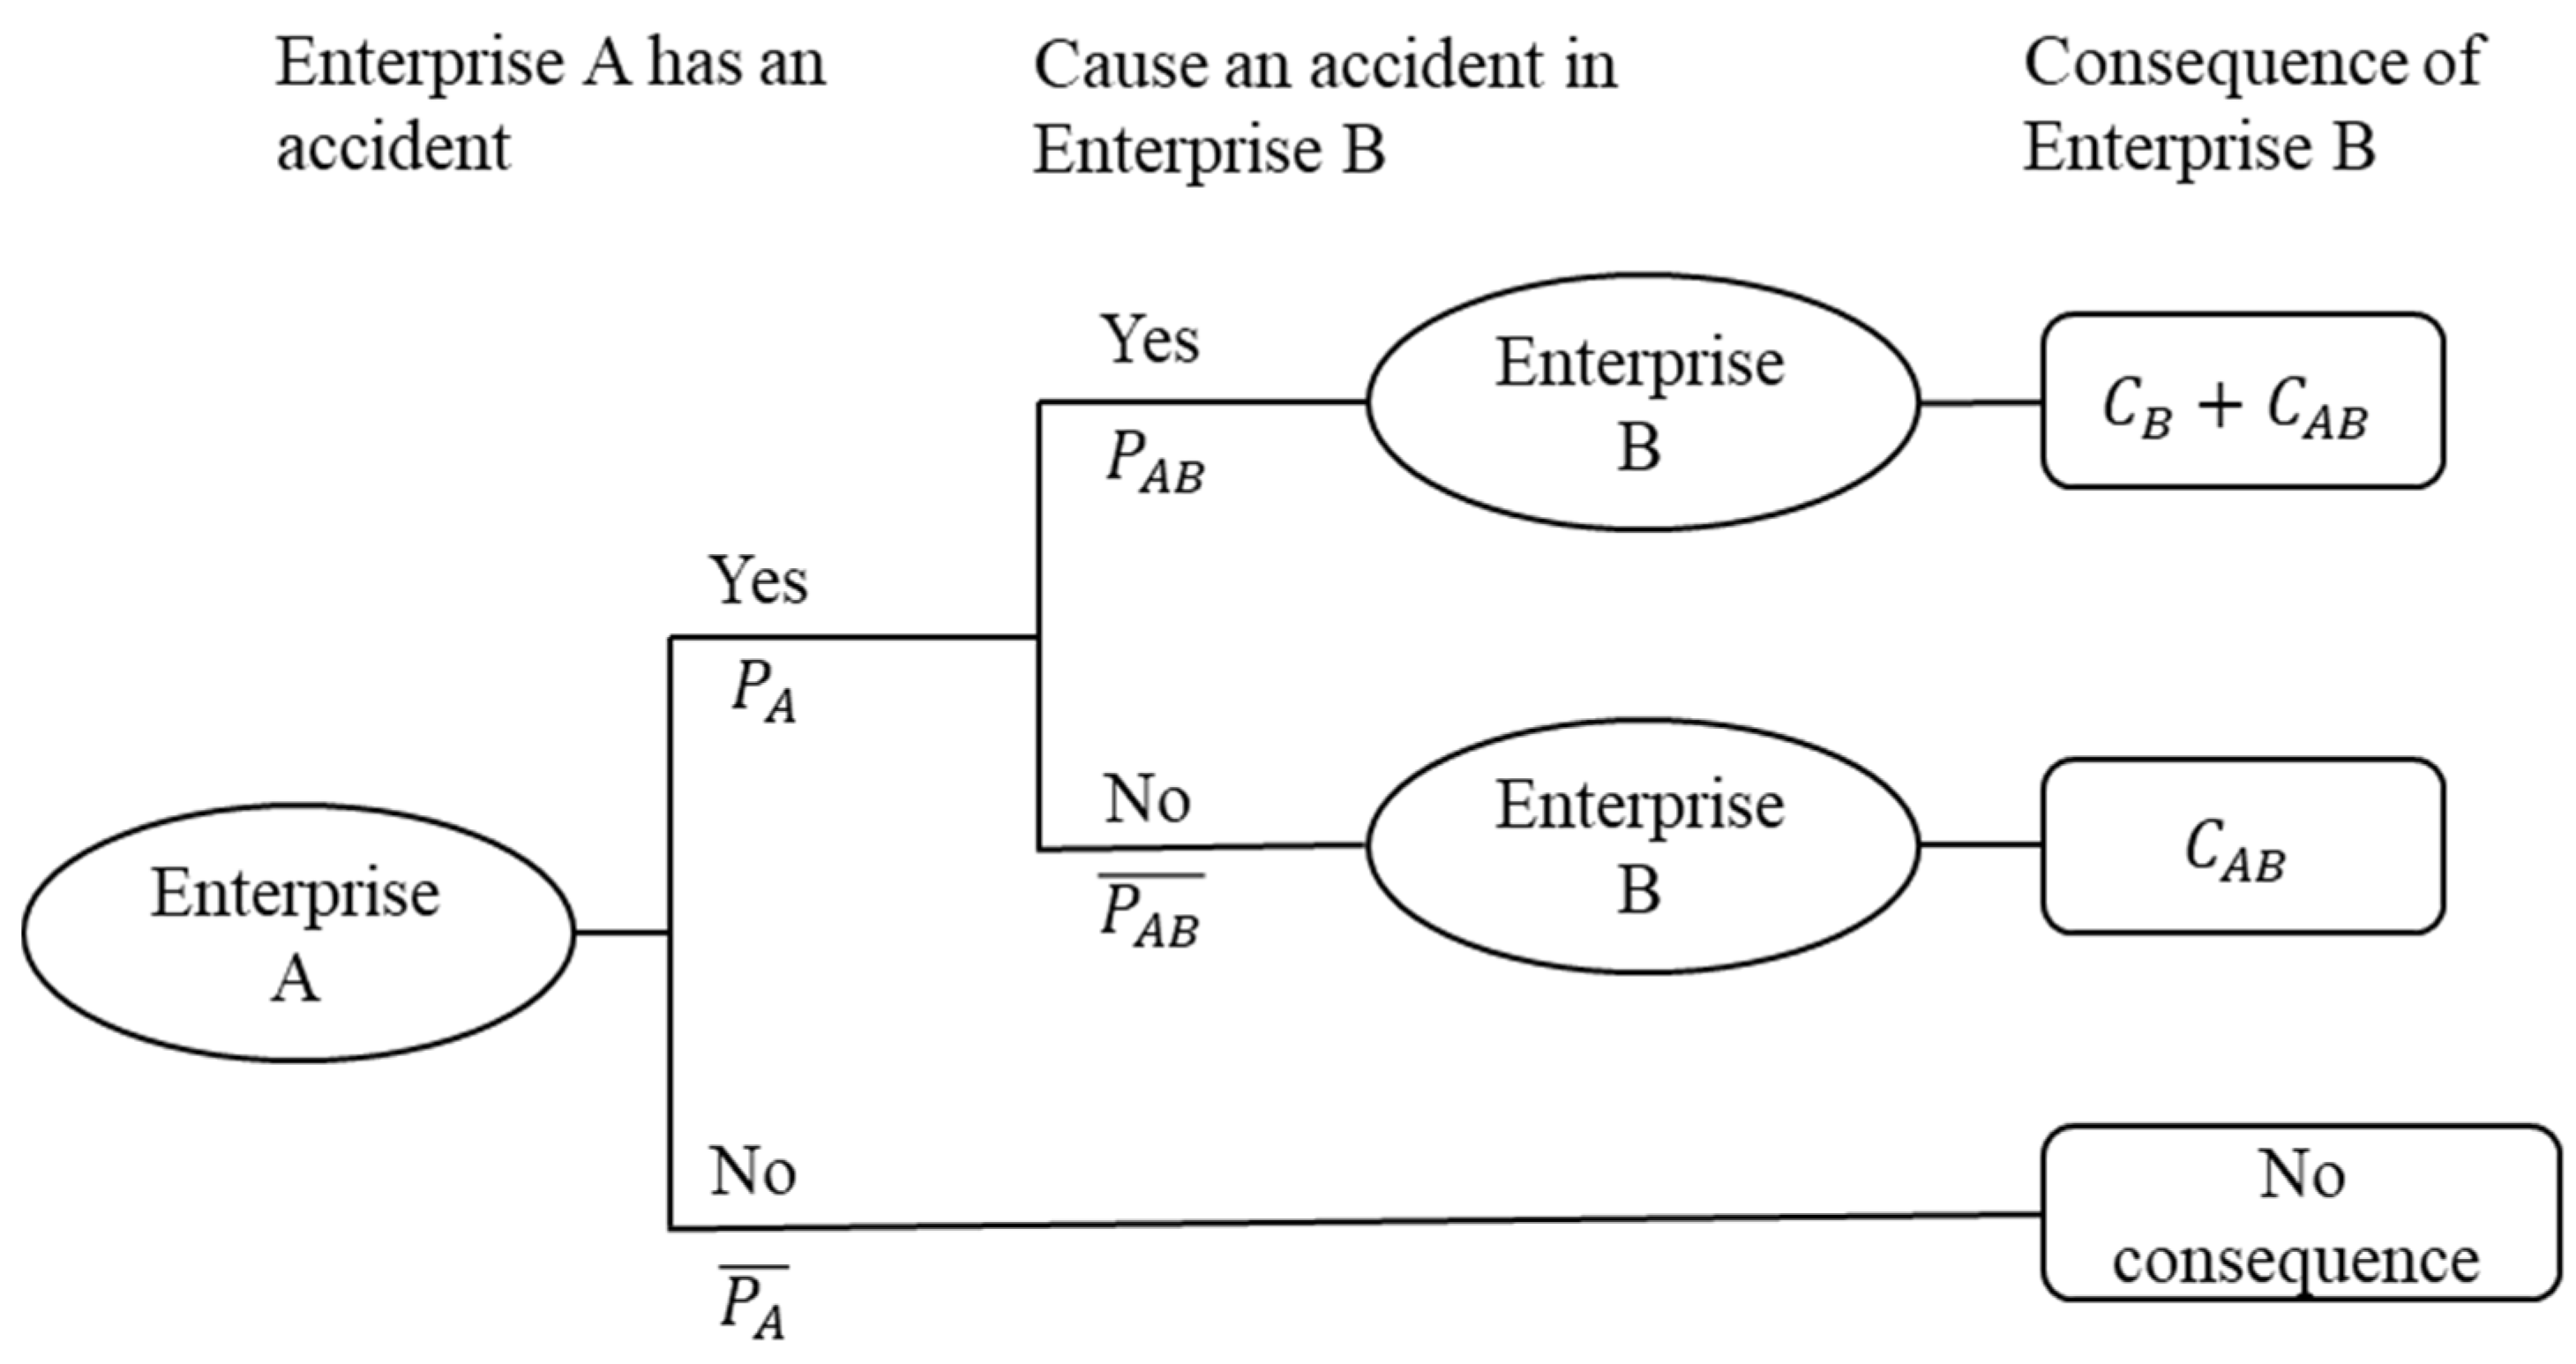
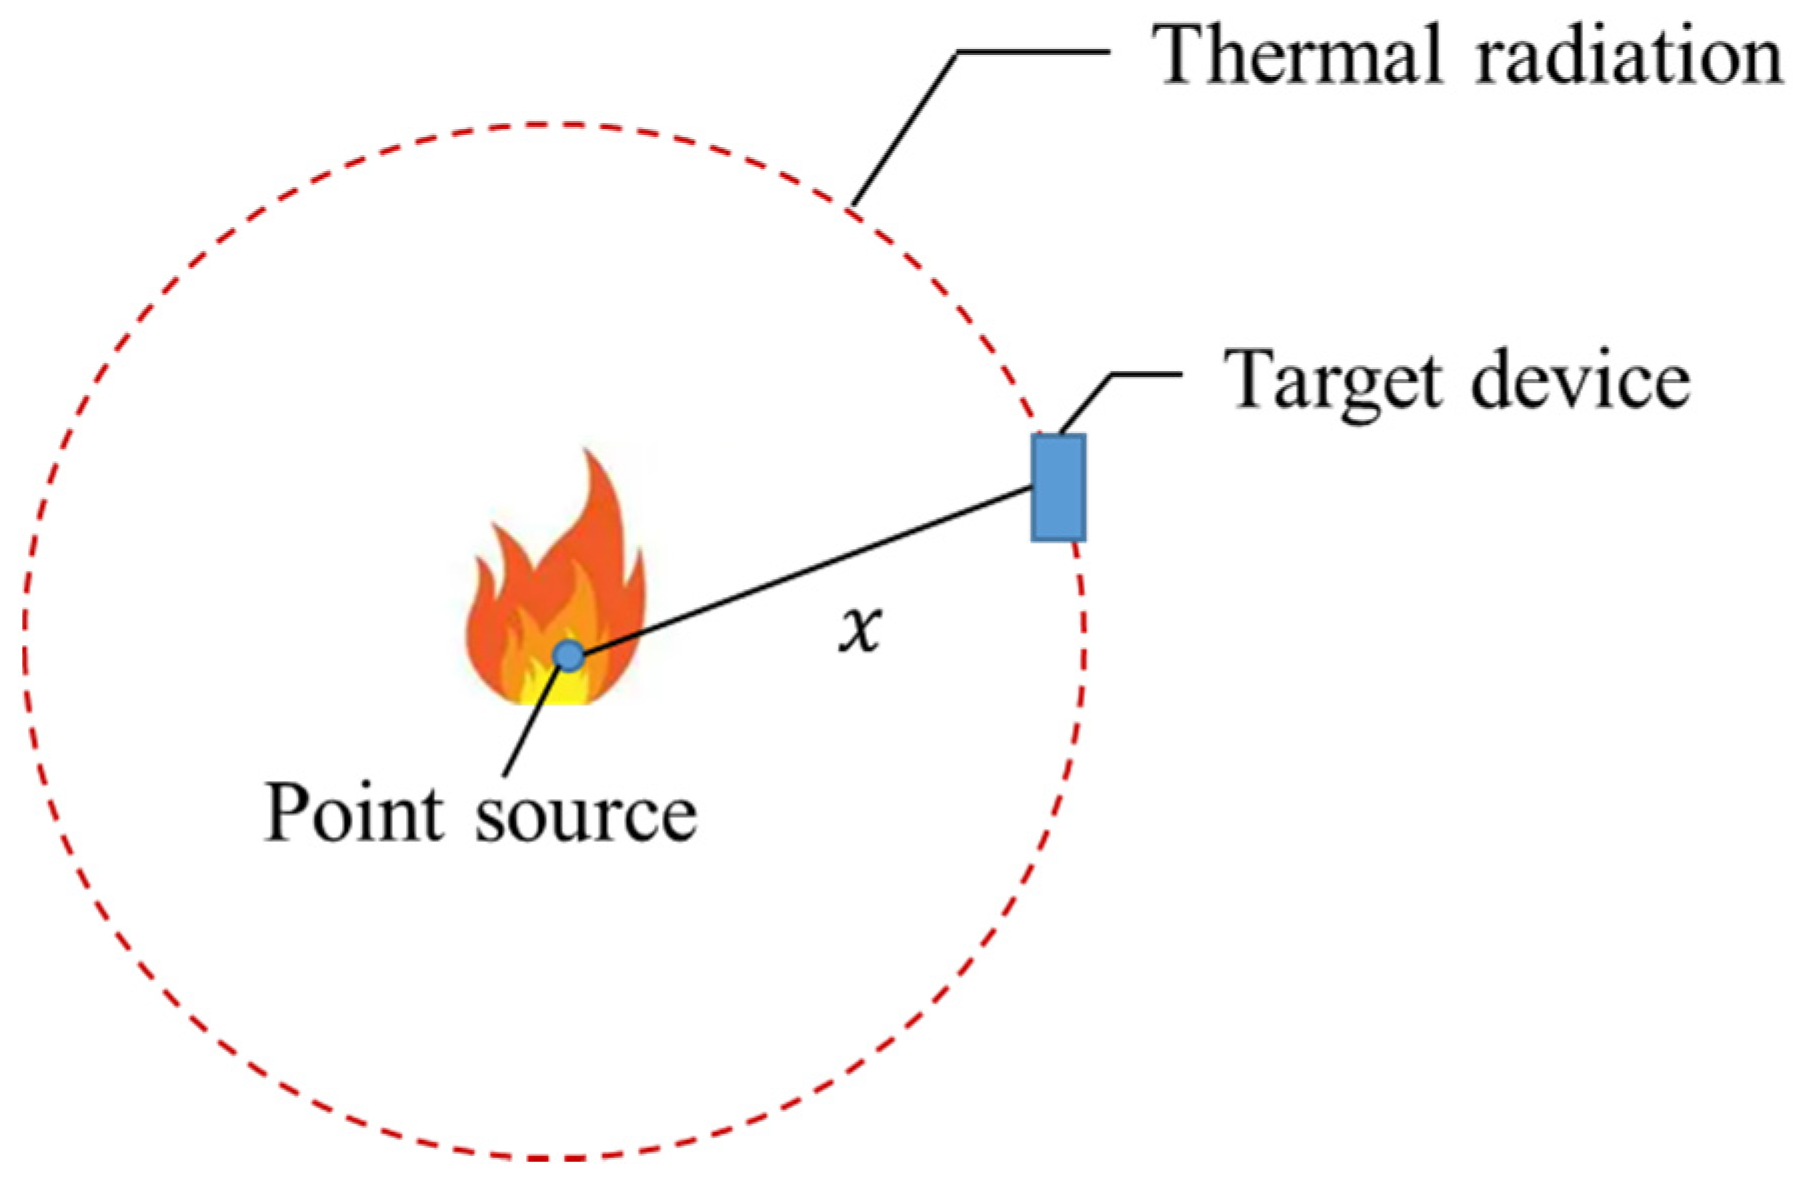
3.2. Association Safety Risks

The new-type clustered industrial park is a complex system in which enterprises are risk-related. This risk correlation can partially be explained by the domino effect. The occurrence of the domino effect is only possible when the energy of the initial accident is sufficiently large to affect other enterprises within the range. It is generally believed that the spread of an initial accident must at least cause a secondary accident to happen [25]. The association safety risk of Enterprise A to Enterprise B is the size of the risk faced by Enterprise B from Enterprise A. Unlike the domino effect risk, the association safety risk also includes the possibility that Enterprise A did not cause a secondary accident in Enterprise B but only led to harm Enterprise B. The impact of an accident in Enterprise A on Enterprise B is illustrated in Figure 1.
Where P A is the probability of an accident in Enterprise A, P A B is the probability that an accident in Enterprise A causes a secondary accident in Enterprise B, C B is the loss caused by the secondary accident in Enterprise B, and C A B is the loss in Enterprise B caused by an accident in Enterprise A. It should be noted that C A B may be 0. That is, an accident at Enterprise A will not affect Enterprise B. Risk can be expressed as a function of probability and consequence [50]. The association safety risk R A B of Enterprises A to B can be calculated by
R A B = P A P A B ( C B + C A B ) + P A P A B ¯ C A B
From engineering experience and previous research, it has been found that the farther away locations are from the flashpoint of risk events, the less they are affected. However, the distance between multiple enterprises is unknown before the layout is implemented, and the specific location of the dangerous equipment is unknown. This article takes the enterprise as the smallest layout unit. The actual association risk assessment steps between enterprises were simplified to reduce the calculation scale and improve the feasibility of the layout model. The specific steps are as follows: (a) classify enterprises according to the category of the most severe risk event; (b) consider only the most severe risk event and assess the association risk when two enterprises are adjacent; (c) determine the diffusion coefficient functions for different risk events; (d) determine the association risk change between enterprises when the distance changes according to the risk diffusion coefficient function. The specific steps are as follows:
(1) Step 1: Risk enterprise classification
There are many types of enterprises in the new-type industrial parks, and accidents that may occur include fires, explosions, object strikes, electric shocks, and mechanical injuries. This study examines the interactions between enterprises. The domino effect is caused by the following physical effects: fire heat radiation, overpressure of an explosion shock wave, and propellant fragments. Accidents causing the domino effect can be divided into fires and explosions [25]. These two types of accidents are also the focus of our work. New-type industrial parks typically contain multiple multistory buildings, and fires spread rapidly in high-rise buildings. Furthermore, some enterprises have pressure vessels, which increases the risk of explosion. Therefore, risk enterprises were classified according to the most severe dangerous events categories: (1) fire risk enterprises, (2) explosion risk enterprises, and (3) other types of risk enterprises. This study only calculates the fire and explosion risks separately and does not consider situations in which both occur simultaneously.
(2) Step 2: Assessment of association risk with neighboring enterprises
Many studies have conducted quantitative assessments of risk for fixed-location enterprises. Luo [51] proposed a QRA method that combines a risk matrix, fault tree, and fishbone diagram model. First, the two enterprises to be evaluated are considered adjacent. The probability of a primary risk event occurring can be calculated based on a fault tree. The domino effect extension probability model [25] can be used to calculate the probability of accidents caused by other enterprises. The consequences of an accident can be analyzed using the Dao chemical index method. The risk matrix method can determine the probability and severity of the consequences. Finally, based on Equation (1), the associated safety risk when enterprises are adjacent is obtained. This method determines accident probability among enterprises by merely considering the occurrence of the most severe risk event. This moderately simplified approach aims to reduce the magnitude of computing complexity without losing the rationality of the enterprise layouts.
(3) Step 3: Risk diffusion coefficient function
The risk diffusion coefficient function identifies the degree to which the risk value decreases with an increase in distance from the risk event flashpoint and is a function of distance. The layout points used in this study were fixed. Thus, the distances are discrete and can be approximated as floor differences.
(i) Fire risk enterprises
Accidents that cause fires can generally be divided into pool fires, jet fires, fireballs, and flash fires, and the main hazard is thermal radiation [28]. The point source model is simple, easy to manage, and widely used to calculate fire thermal radiation. May [52] first hypothesized that the fire source was a point heat source and used the square ratio theorem to calculate the thermal radiation intensity at any target point around the flame. However, they did not construct a perfect mathematical calculation model. Modak [53] set the location of the point heat source at half the height of the flame above the flame centerline based on their predecessors and derived a mathematical calculation model of the single point heat source model through theoretical derivation. Sivathanu [54] proposed a method for estimating the total radiant output of turbulent jet flames by measuring the radiative heat flux at a single location. This study examined the impact of enterprises that are distant and suitable for applying point source models. The general formula for the application of the single-point source model to thermal radiation in pool fires is
I p = Q t c 4 π x 2
where I p is the intensity of the thermal radiation at the target point, Q is the total thermal radiation of the pool fire, t c is the thermal conductivity, and x is the distance from the target point to the center of the flame.
The point source model reduces the flame to a radiant emission point in a spherical shape that radiates heat into the surrounding space based on the inverse ratio of the intensity of the thermal radiation to the square of the distance to the radiation source. The point source model is shown in Figure 2. Referring to the point source model, the fire risk diffusion coefficient function is defined as follows:
γ f ( D i j ) = { 1                     i f   D i j = 0 β 1 ( b D i j ) 2             i f   D i j > 0 β 2 ( b D i j ) 2             i f   D i j < 0
where D i j is the floor difference between enterprise j and enterprise i , b is the floor-to-floor height, and β 1 and β 2 are the correction parameters.
(ii) Explosion risk enterprises
The physical effects corresponding to an explosion are the overpressure of the explosion shock waves, propellant fragments, and thermal radiation. One of the most representative types of damage is shockwave damage, which spreads widely and quickly and may cause chain damage. Shockwave injuries and destructive effects can be assessed using the overpressure criterion. When the shock wave overpressure reaches a specific value, it causes inevitable damage. In the shockwave propagation method, the energy propagates outward from the center of the explosion source. Its propagation characteristic is that the farther away from the center it is, the smaller the effect of the overpressure state. The shockwave peak overpressure is generally considered a function of the distance. Many experimental studies have been conducted, and various empirical formulas have been summarized [55,56]. Yang [57] compared and analyzed the prediction results of multiple empirical formulas and summarized the following formulas:
Z = R W 1 / 3
P s o = { 0.084 Z + 0.27 Z 2 + 0.7 Z 3                       i f   Z 1                     0.084 Z + 0.255 Z 2 + 0.65 Z 3             i f   1 < Z 15
where Z is the proportional distance, R is the distance between the target point and burst center, W is the equivalent TNT dosage, and P s o is the shock wave peak overpressure. The explosion risk diffusion coefficient function is defined as follows:
γ e ( D i j ) = { 1                           i f   D i j = 0 α 1 b D i j + α 2 ( b D i j ) 2 + α 3 ( b D i j ) 3       i f   D i j > 0 α 4 b D i j + α 5 ( b D i j ) 2 + α 6 ( b D i j ) 3       i f   D i j < 0
where α 1 , α 2 , α 3 , α 4 , α 5 , and α 6 are correction parameters. When considering other environmental impact factors, such as wind direction, wall thickness, and safety barriers, the risk diffusion coefficient can be adjusted using correction parameters based on actual engineering experience. Furthermore, it can be combined with expert evaluations to increase the model’s flexibility.
(iii) Other types of risk enterprises
In addition to fires and explosions, enterprises can also have other accidents. The model only considers the impact on the same floor for accidents that are less likely to occur or have a smaller scope of impact. The diffusion coefficient function is defined as follows:
γ o ( D i j ) = { 1               i f   D i j = 0 0             otherwise
(4) Step 4: Determination of actual association safety risks
Based on the above steps, the actual association risk of enterprises is determined by:
R i j a = { R i j γ f ( D i j )           i f   i F R i j γ e ( D i j )           i f   i E R i j γ o ( D i j )           i f   i O
where R i j a is the actual association risk with enterprises i and j , R i j is the association safety risk where enterprises i and j are adjacent, and F , E , and O represent fire types, explosion types, and other types of enterprises, respectively.

3.3. Profit

In addition to safety issues, park management needs to consider profit. The profit of the new-type industrial park is affected by many factors, such as factory rent, management costs, and government support. Among these, rent is an important source of profit for the park. Standardized factories and supporting service facilities have led to certain increases in costs and rent. Most parks begin to attract enterprises during the construction process. The new-type industrial park generally consists of several multistory buildings. To obtain greater rental profits, the park is more inclined to choose negotiable pricing to achieve park management and enterprise consistency. In particular, different enterprises have different affordability values for each floor. For example, enterprises that need to move large goods frequently are more willing to pay higher rents for the first floor. Therefore, the layout results of enterprises can have an impact on rental profits, which is worth noting. This study considers only rental profits for non/low-risk enterprises.

3.4. Goals

This study considers two levels: the goal of the upper level is to achieve minimum association safety risks, and the lower-level goal is to maximize the park rental profit. At a certain point in time, the risk enterprises that need to be prioritized are identified. In addition to the enterprise’s inherent risks, there is also a risk correlation between enterprises. The enterprise’s inherent risks do not change with location and cannot be reduced by optimizing the park layout. From Section 3.2, it can be seen that the enterprise association risk affected by distance reflects the degree of impact between enterprise risks. By optimizing the facility layout, the distance between risky enterprises can be changed, thereby reducing the overall associated risk of the park. Consequently, this study takes the minimization of the total association risk as the upper-level goal.
Based on achieving the first goal, the rent is considered, and the layout of the remaining enterprises is determined. In particular, the decision variables for the two goals are different. In this study, improving the safety level of parks is a priority. Therefore, the upper optimal solution is first calculated, and the upper-level result is used as the constraint of the lower level.

4. Bi-Level Programming Model Formulation

4.1. Notations

Sets
I Set   of   risk   enterprises ,   indexed   by   i I .
F Set   of   fire   risk   enterprises ,   indexed   by   f F .
E Set   of   explosion   risk   enterprises ,   indexed   by   e E .
O Set   of   other   types   of   risk   enterprises ,   indexed   by   o O .
J Set   of   non / low - risk   enterprises ,   indexed   by   j J .
B Set   of   buildings ,   indexed   by   b B .
S Set   of   floors ,   indexed   by   s S .
Area parameters
Q b s Size   of   s S   in   b B .
A i Area   required   by   enterprise   i I .
A j Area   required   by   enterprise   j J .
Risk parameters
R f i Association   risk   where   enterprises   f F   and   i I are adjacent.
R e i Association   risk   where   enterprises   e E   and   i I are adjacent.
R o i Association   risk   where   enterprises   o O   and   i I are adjacent.
γ f ( d ) Fire   risk   diffusion   coefficient   function ;   d is the floor difference.
γ e ( d ) Explosion   risk   diffusion   coefficient   function ;   d is the floor difference.
γ o ( d ) Other   types   of   risk   diffusion   coefficient   function ;   d is the floor difference.
Rent parameter
Z j s Expected   rent   of   j J   on   s S .
Other parameter
N s specific   floor   value   of   s S .
Particularly:
F   E   O = I
F   E , E   O , F   O = 0
Decision variables:
x b s i = { 1   Enterprise   i I   on   s S   in   b B 0   otherwise  
x b s f = { 1   Enterprise   f F   on   s S   in   b B 0   otherwise  
x b s e = { 1   Enterprise   e E   on   s S   in   b B 0   otherwise  
x b s o = { 1   Enterprise   o O   on   s S   in   b B 0   otherwise  
x b s j = { 1   Enterprise   j J   on   s S   in   b B 0   otherwise  
x b f i = { 1   Enterprises   f F   and   i I   in   b B 0   otherwise  
x b e i = { 1   Enterprises   e E   and   i I   in   b B 0   otherwise  
x b o i = { 1   Enterprises   o O   and   i I   in   b B 0   otherwise  

4.2. Assumptions

Three assumptions were postulated for the BLINLP model.
(i)
An enterprise can be located on only one floor of a building. A few enterprises that need to be located on multiple floors are treated as independent enterprises.
(ii)
The associated safety risk can only occur between two enterprises when the two enterprises are located in the same building. This study does not consider the interactions between enterprises located in different buildings.
(iii)
The types of enterprises and the association risks of adjacent enterprises are known. The specific determination process is described in Section 3.

4.3. Bi-Level Integer Programming Model

In this subsection, the BLINLP model is defined using Equations (11)–(25).
Ψ 1 = Min b B f F i I R f i γ f ( s S x b s f N s s S x b s i N s ) x b f i + b B e E i I R e i γ e ( s S x b s e N s s S x b s i N s ) x b e i + b B o O i I R o i γ o ( s S x b s o N s s S x b s i N s ) x b o i
s.t.
i I A i x b s i Q b s   b B , s S
b B s S x b s f = 1   f F
b B s S x b s e = 1   e E
b B s S x b s o = 1   o O
b B s S x b s i = 1   i I
s S x b s f = s S x b s i   b B , f F , i I , f = i
s S x b s e = s S x b s i   b B , e E , i I , e = i
s S x b s o = s S x b s i   b B , o O , i I , o = i
x b f i = Min { s S x b s f , s S x b s i }   b B , f F , i I
x b e i = Min { s S x b s e , s S x b s i }   b B , e E , i I
x b o i = Min { s S x b s o , s S x b s i }   b B , o O , i I
Ψ 2 = Max b B s S j J Z j s x b s j A j
s.t.
j J A j x b s j Q b s i I A i x b s i   b B , s S
b B s S x b s j = 1   j J
In this model, Equations (11)–(22) define the optimization model of the upper-level problem. Equation (11) minimizes the overall association risk of the park. Constraint (12) guarantees that the sum of the enterprise areas of each floor cannot exceed this monolayer area. Constraints (13)–(16) restrict an enterprise to having only one specific location and thus cannot be at multiple locations. Constraints (17)–(19) guarantee that each enterprise can be assigned to only one building. Constraints (20)–(22) represent the relationships between the decision variables. The optimization problem of the lower level is defined by Equations (23)–(25). Specifically, Equation (23) describes the objective function of the lower-level problem as the maximization of rental profit for the park. Constraint (24) prevents enterprises from overlapping. Constraint (25) guarantees that each enterprise is located in one location.
In addition, the proposed model allows some enterprises’ locations that are given in advance, which is more realistic in the industry park. If the current enterprises’ locations are provided, constraints can be added to the model to ensure the accuracy of layout results. Consequently, the current layout of the industry park is considered when applying the proposed model for designing the next stage layout.

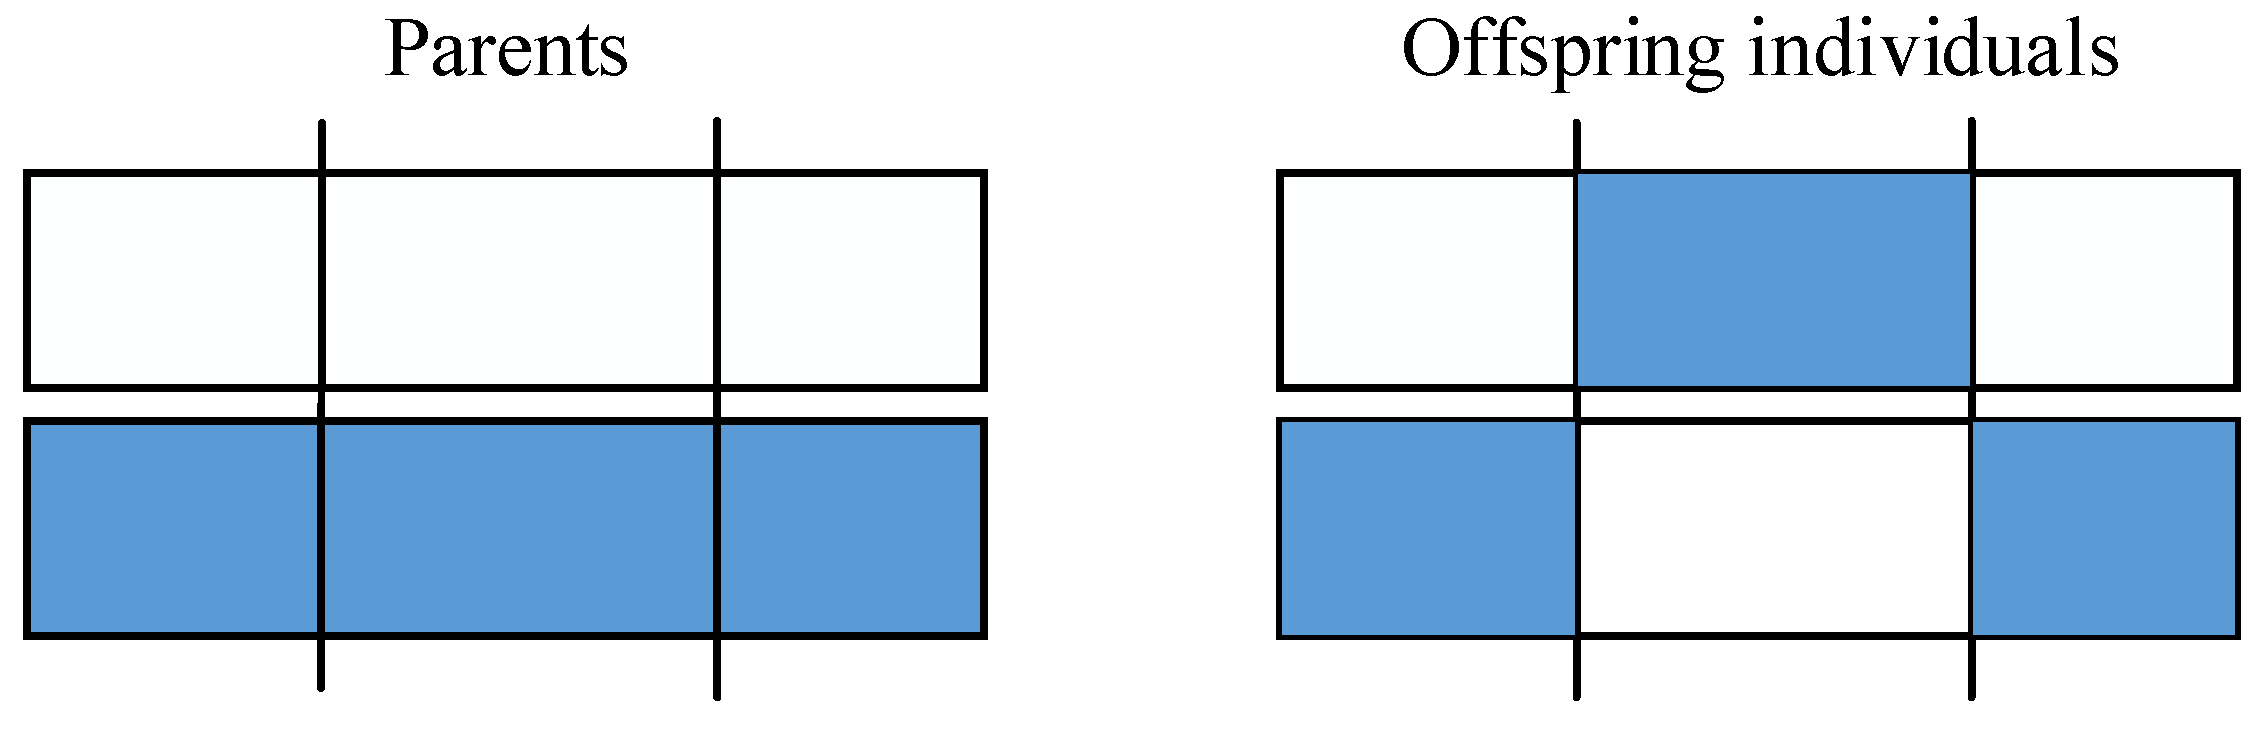
5. Solution Strategy

The proposed mathematical model for the large-scale 3DMSELD problem contained a large number of decision variables. In particular, calculation efficiency can be enhanced by reducing the number of decision variables. Therefore, new parameters and variables were introduced to rewrite the original decision variables. These parameters and variables are given by
N b specific building value of b B .
b i The building in which the enterprise i is located.
s i The floor on which the enterprise i is located.
b j The building in which the enterprise j is located.
s j The floor on which the enterprise j is located.
b i , s i , b j , and s j are nonnegative integer variables.
Then, the original decision variables are reformulated as
b i = b B s S x b s i N b   i I
s i = b B s S x b s i N s   i I
b j = b B s S x b s j N b   j J
s j = b B s S x b s j N s   j J
At a certain point in time, determine the input parameters and the limitations are imposed by the current layout of the park. Then, an improved GA was employed to solve the problem. A GA imitates the evolution of biology in nature to obtain a relatively optimal solution [58]. The selection, crossover, and mutation operations were implemented in the GA [1]. Our study adopts an improved GA with enhanced elite retention strategies to address the problem of slow convergence of the classical GA. The main process is as follows:
(1) Step 1: Determine the coding mechanism
How the variables in the actual problem are translated into genetic algorithms depends on the coding mechanism to be solved. Therefore, the feasible and initial solutions should be encoded to facilitate the identification and operation of the algorithm. Common coding mechanisms for genetic algorithms are binary coding, floating-point coding, symbolic coding, and gray coding. The new decision variables in the proposed model are integer variables, and the concept of floating-point coding is straightforward and convenient for subsequent evolutionary operations. In particular, these new decision variables were set as integers within a range.
(2) Step 2: Generate the initial population
Each new decision variable was numbered, and the chromosome length was defined as the size of the new decision variables. At the beginning of the algorithm, a population is randomly generated, the size of which is given in advance. As shown in Equation (30), the initial population contains multiple integer codes, each representing a particular layout situation. The population size affects the efficiency of the algorithm. This study establishes constraints based on area, etc., and substituting them can improve the algorithm operation efficiency and reduce the search scope of the algorithms.
pop = ( x 1 , 1 x 2 , 1 x N , 1   x 1 , 2 x 2 , 2 x N , 2     x 1 , L x 2 , L x N , L )
where x stands for the decision variables, L is the number of new decision variables, and N is the size of the population (i.e., the number of individuals in the population). Each row corresponds to a layout situation, and each column corresponds to a decision variable.
(3) Step 3: Fitness evaluation
Fitness refers to the ability of individuals in a population to adapt to their environment. The objective function was used to obtain the fitness function. It is necessary to establish a reasonable mapping relationship between the objective and fitness functions to ensure that the direction of the increase in adaptability is consistent with the optimization direction of the objective function. Linear fitness scaling can be used to calculate the fitness values. The calculation formula is as follows:
F i t = m F i t + n
where F i t is the fitness value, F i t is the objective function value, and m and n are the transform parameters. In particular, F i t needs to meet two conditions: (a) the average of the new fitness values after the linear scale transformation is equal to the original mean, and (b) after a linear scale transformation, the maximum fitness is equal to the specified multiple of the mean of the original fitness. The proposed layout model contains two objective functions that require separate fitness scaling. Through linear transformation, the degree of fitness difference between individuals can be reduced, which is conducive to maintaining the population diversity.
(4) Step 4: Evolutionary operations
The selection is generally based on individual fitness. The classic choice operators include roulette wheel selection, stochastic universal sampling, tournament selection, and truncation selection. The tournament selection mechanism was adopted in our study, and a specific theory can be found in Blickle [59]. The most common crossover methods are single-point, double-point, and multipoint crossing. This study used a double-point crossover, and the schematic diagram is shown in Figure 3. The mutation increases the population diversity and reduces the risk of algorithms falling into local optimal solutions. In our work, the mutation operation of the breeder GA was used, which can be found in Mühlenbein [60].
Compared with the classical GA, the improved GA used in this study merges the parent population and the resulting cross-mutation population to obtain a population twice the size. From the merged population, half of the individuals with high fitness are selected to obtain the next generation population, which retains elite individuals.

6. Case Study

This study mainly focuses on two goals: (i) minimizing association risk at the upper level and (ii) maximizing rental profits at the lower level. The decision variables for the two processes were different. The upper-level layout is for risk enterprises, and the lower-level layout is for non/low-risk enterprises. The overall layout design considers multiple buildings, floors, and enterprises. In addition, our model prioritized safety. A case study of the Shunde industrial park was conducted to validate the effectiveness of the proposed model and approach, and the results are reported in this section. The proposed model was implemented using Geatpy [61] (version 2.7.0) and encoded using Python 3.7. All experiments were performed on a computer with an 11th Gen Intel(R) Core (TM) i5-1135G7 @ 2.40GHz and 16 GB memory, with a Windows 10 operating system.

6.1. Data Introduction
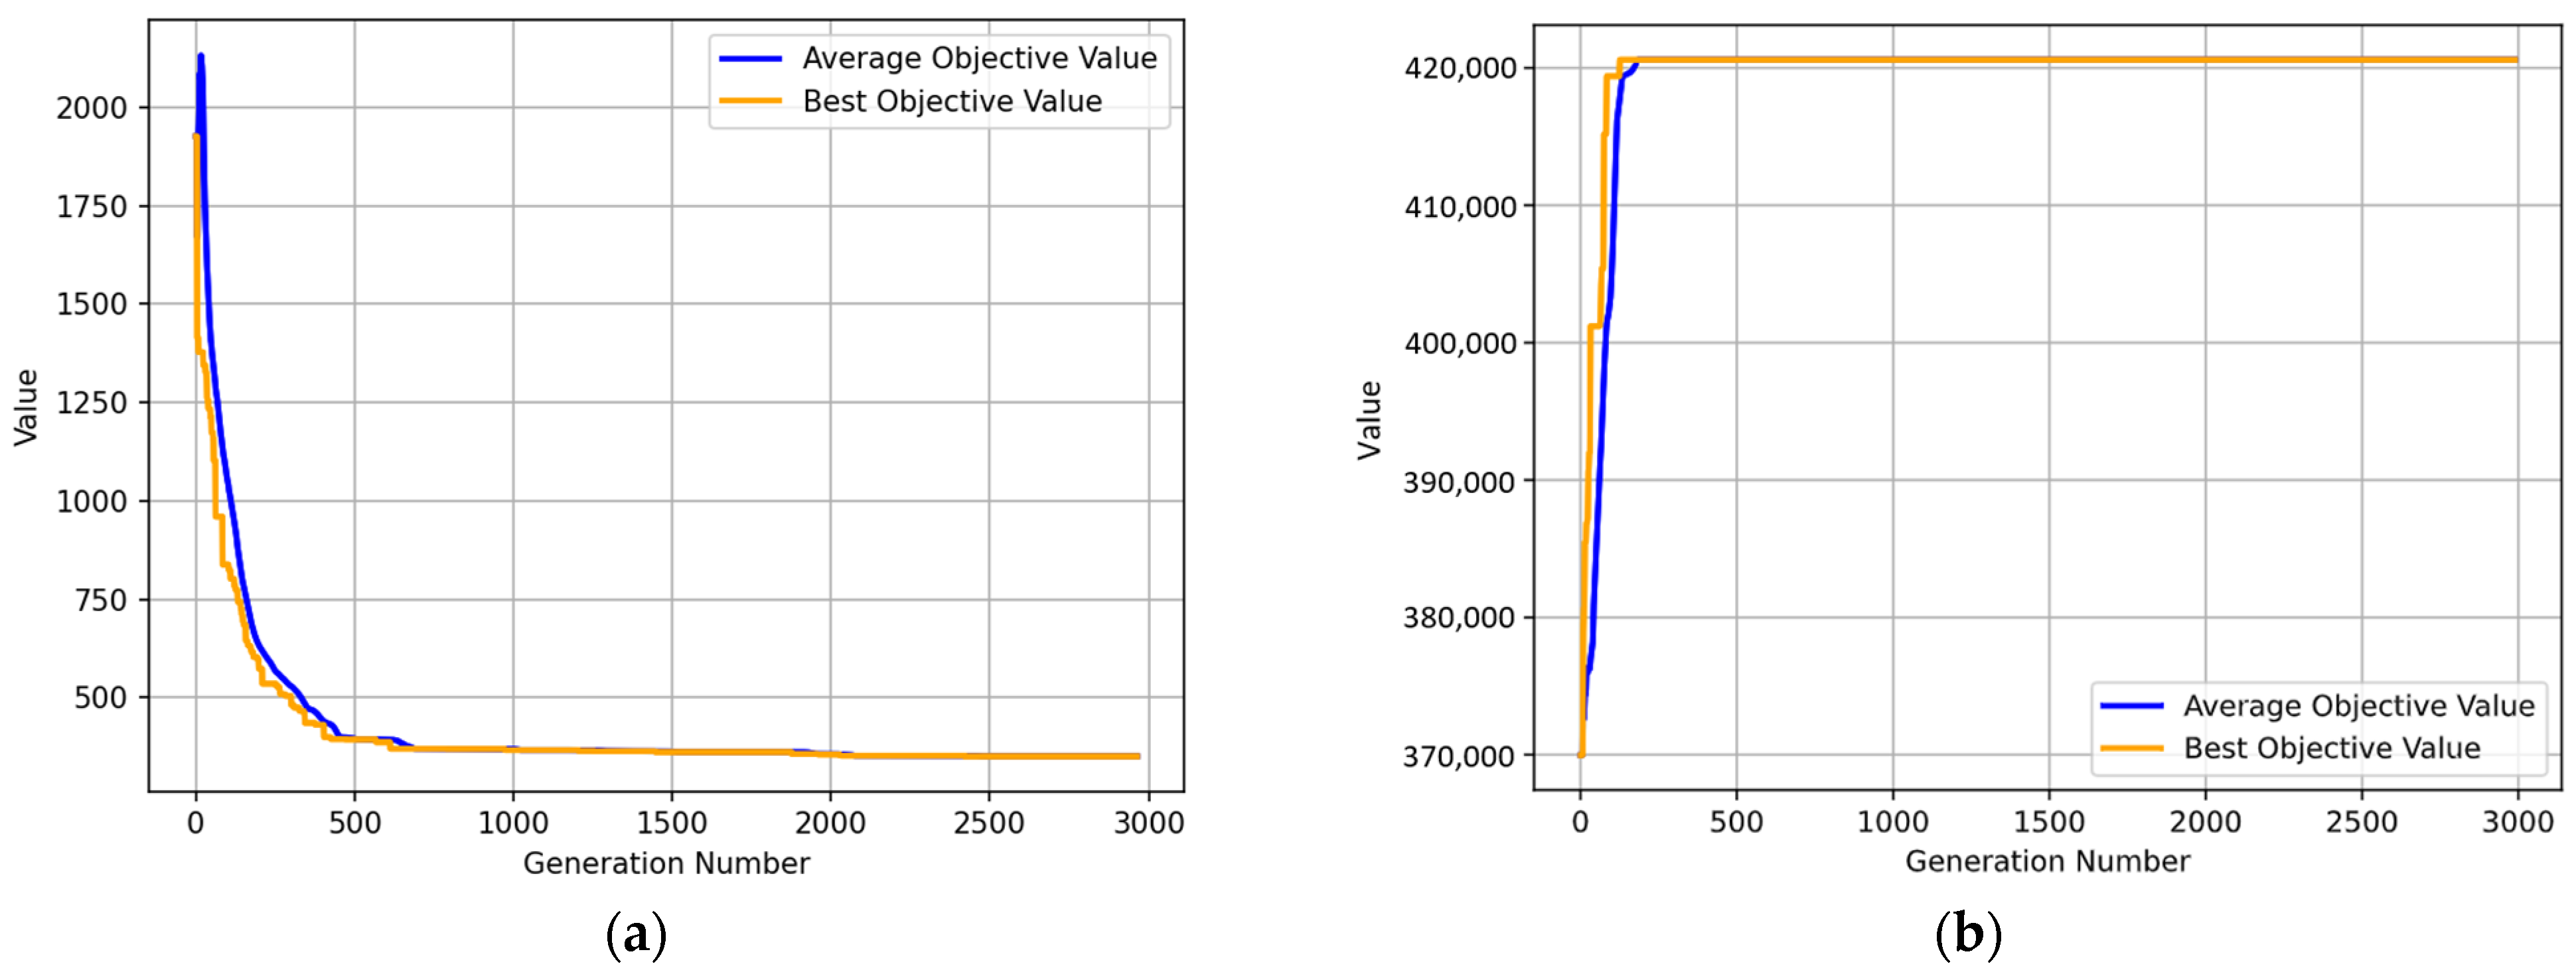
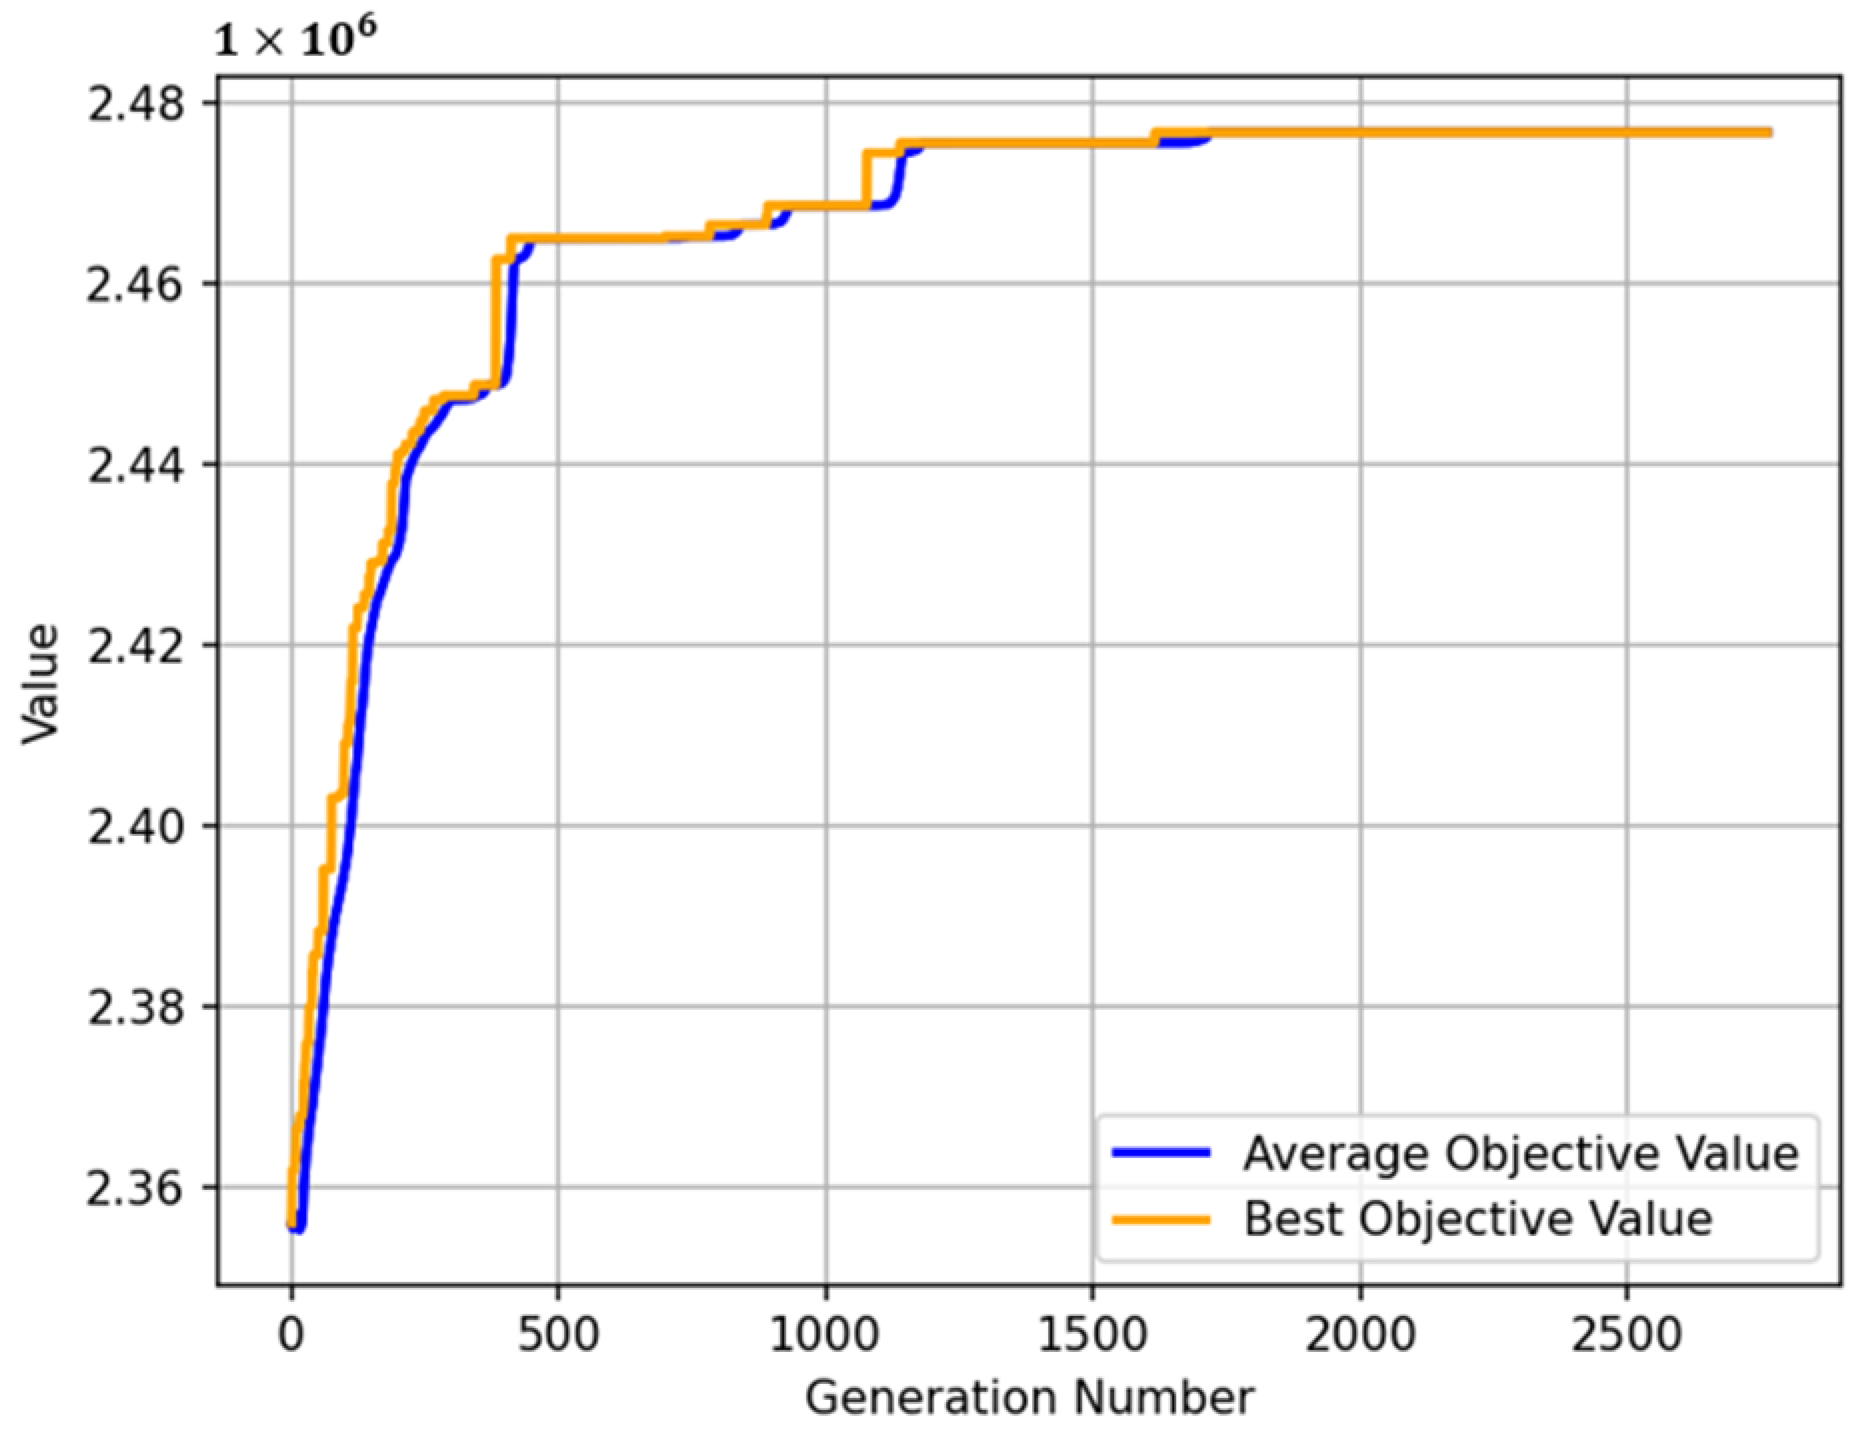
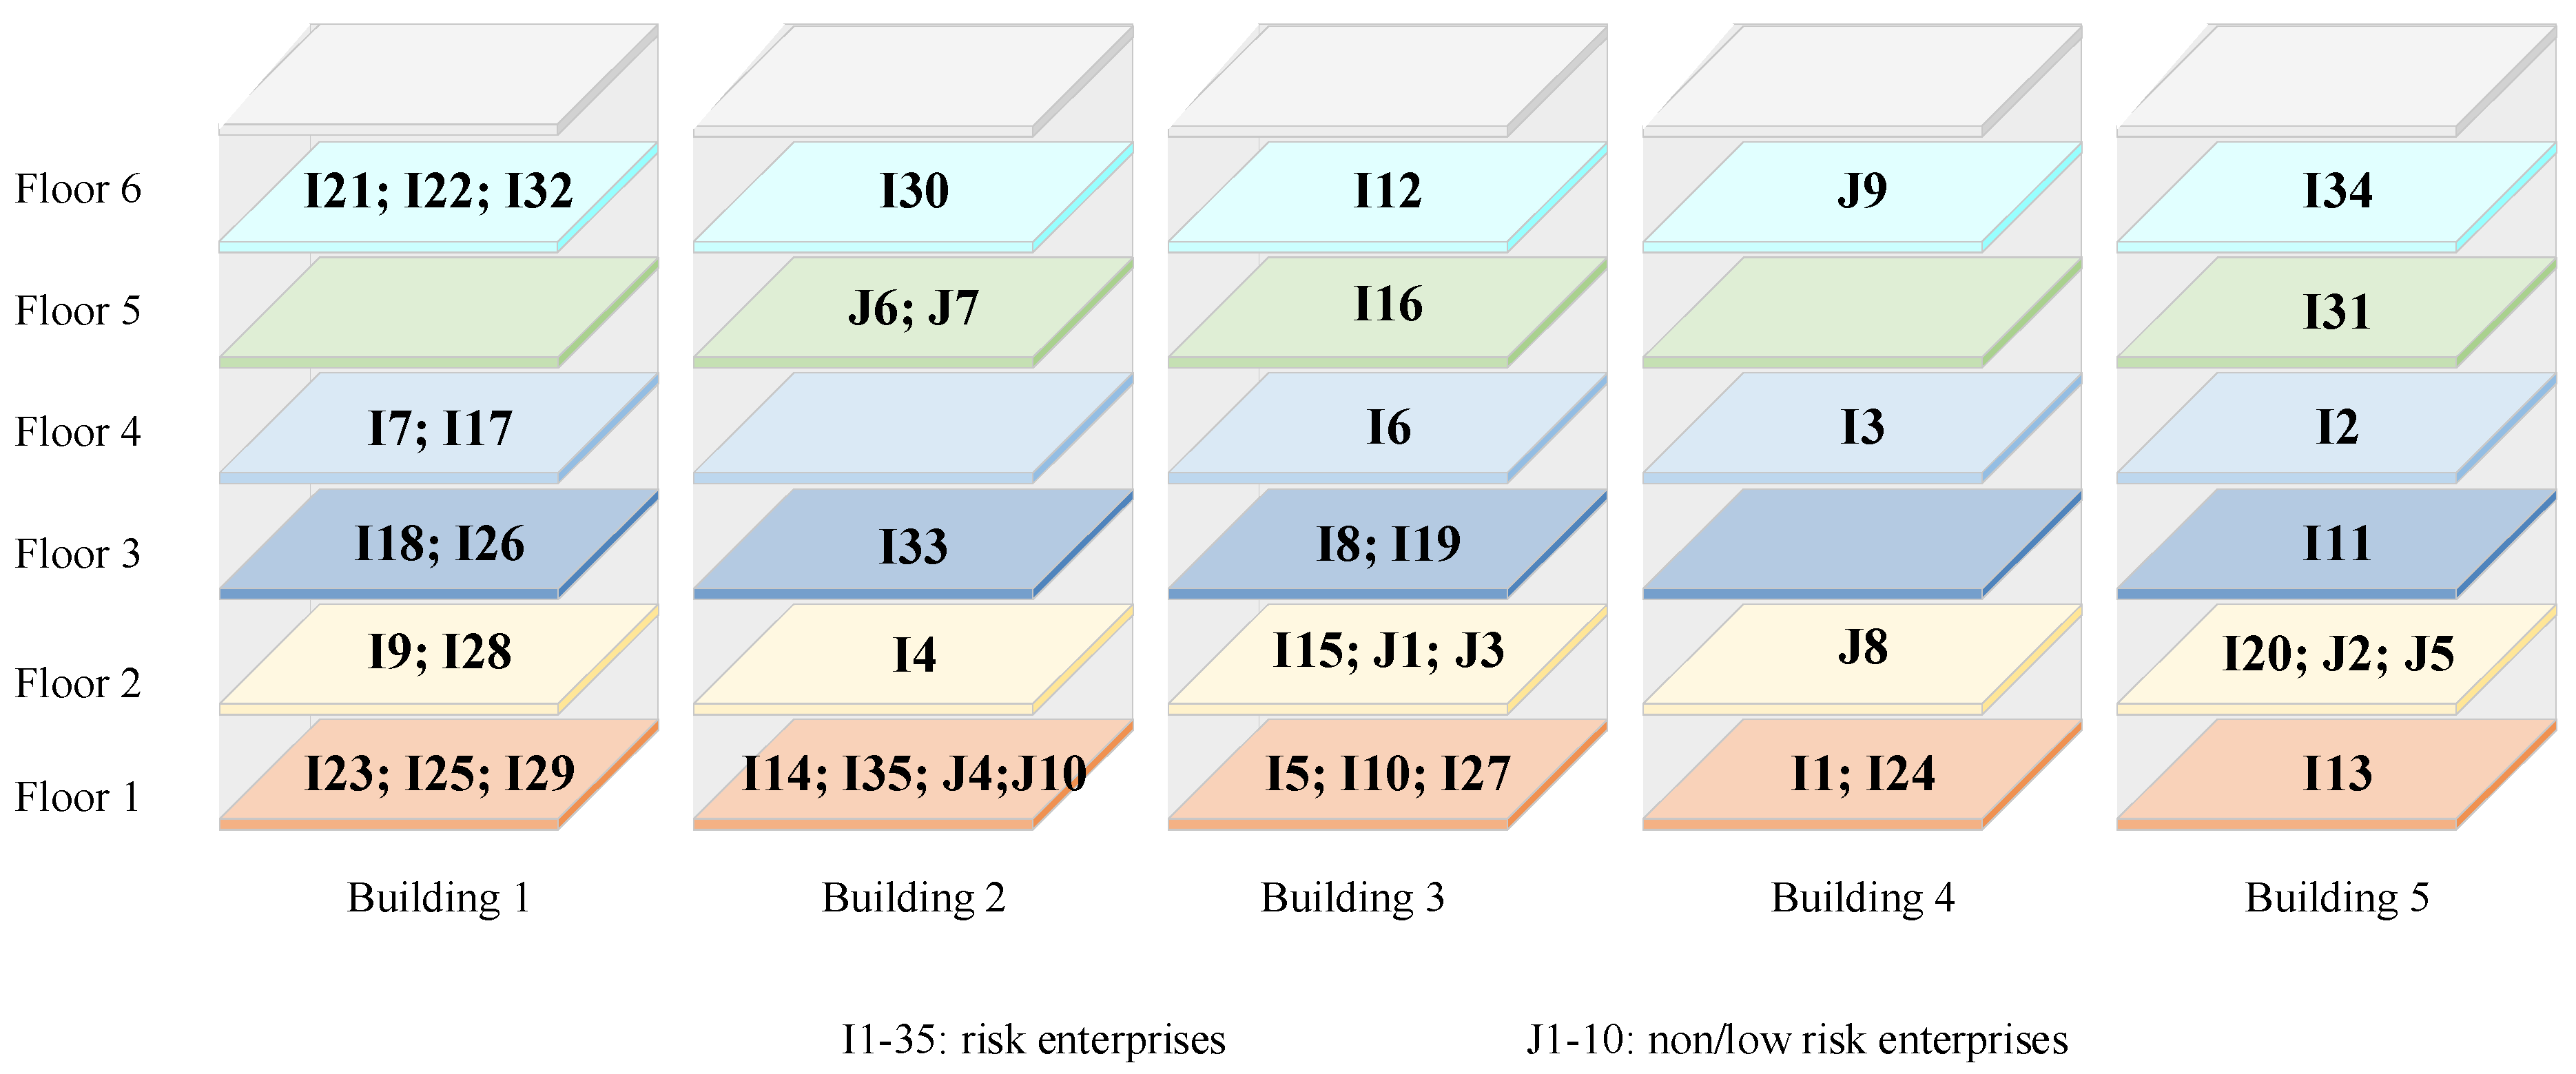
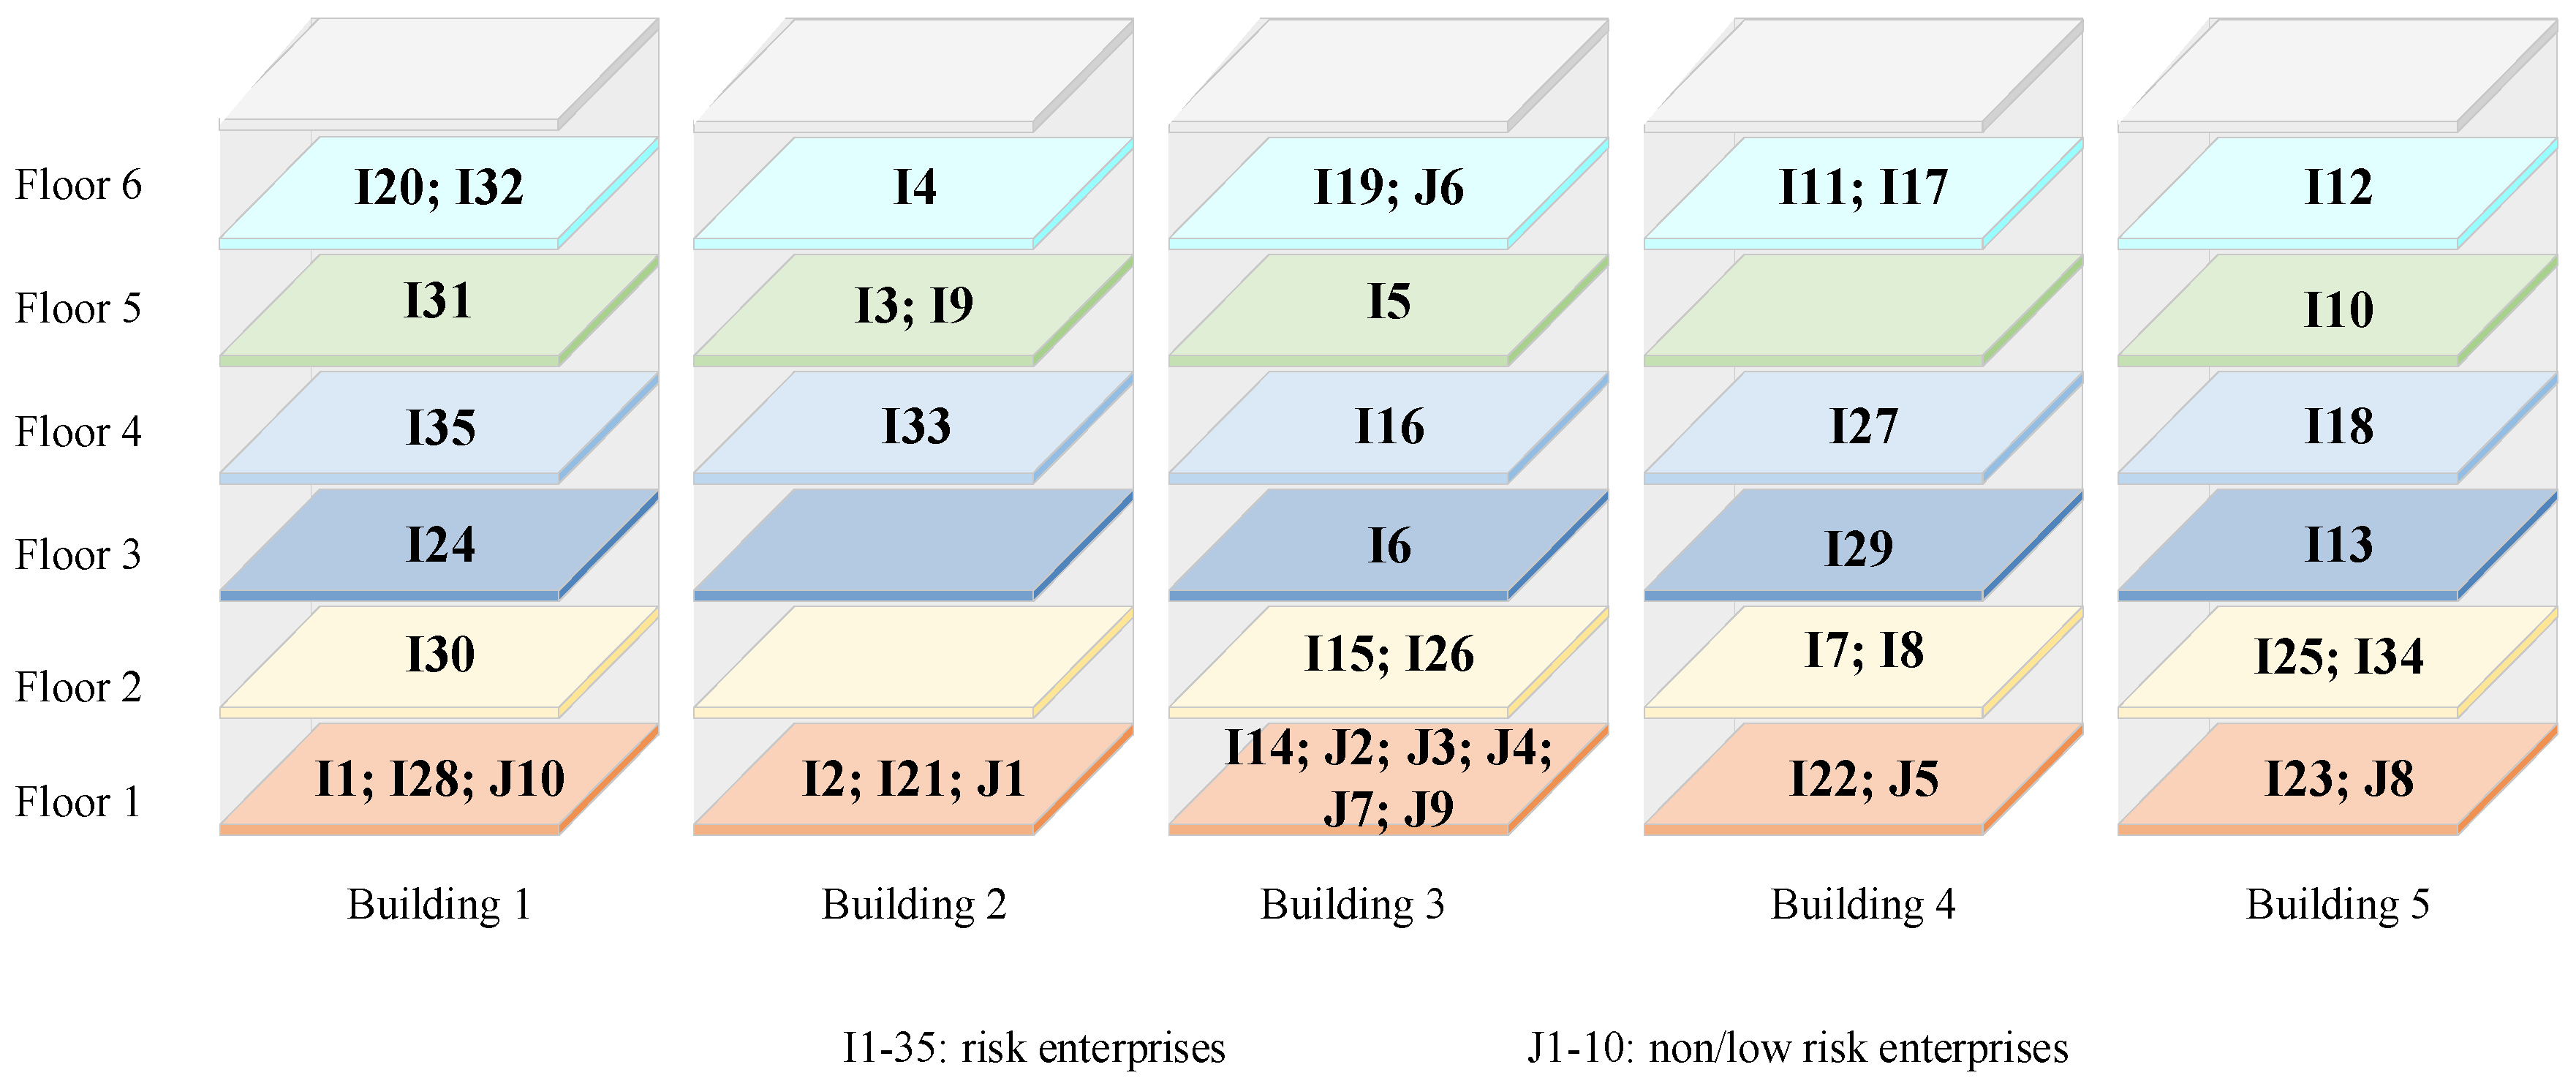
An industrial park in Shunde was chosen to obtain relevant data. The park’s scale (see Table 2), area parameters, etc., were provided by the park and enterprises. The risk and rent parameters were assumed according to the type of settled enterprise, local environment, and economy, as it is difficult to collect complete and realistic data. The data we set up is general and is used to demonstrate the layout process and conduct case studies. The park contained five buildings, and each building had six floors, with a total of 45 enterprises to be laid out. There were 13 fire risk enterprises (i.e., I1–I13), 8 explosion risk enterprises (i.e., I14–I21), and 14 other types of risk enterprises (i.e., I22–I35), and the upper-level layout of these enterprises was carried out to minimize the association risk; there are 10 non/low-risk enterprises (i.e., J1–I10), and the lower-level layout of these enterprises was carried out to maximize the rental profit. At present, there is no unified statement regarding the population size of the GA. However, it is generally accepted that the larger the population size, the more likely it is to obtain an optimal solution. To obtain a better solution, a more extensive initial population (i.e., 300) and the number of evolutions (i.e., 3000) were chosen.

6.2. Layout Result

In this subsection, the main results for the layout problem are presented. After variable conversion (Equations (26)–(29)), the scale of the decision variables in the upper-level layout was changed from 1050 to 70, and the size of the decision variables in the lower level was converted from 300 to 20, which significantly reduced the problem scale. In addition, the model was solved three times, and the optimal value was obtained to ensure that the global optimal solution was obtained as much as possible. This study first provided the approximate optimal layout results of 35 risk enterprises (see Figure 4a and Figure 5). As shown in Figure 4a, as the population iterated, the association risk value gradually decreased and stabilized by 2100. The approximate optimal solution was 350.6. Then, 10 non/low risk enterprises were laid out in the remaining space to obtain the maximum rental profit (i.e., 420,592 yuan). The layout results for the 45 enterprises are shown in Figure 5.

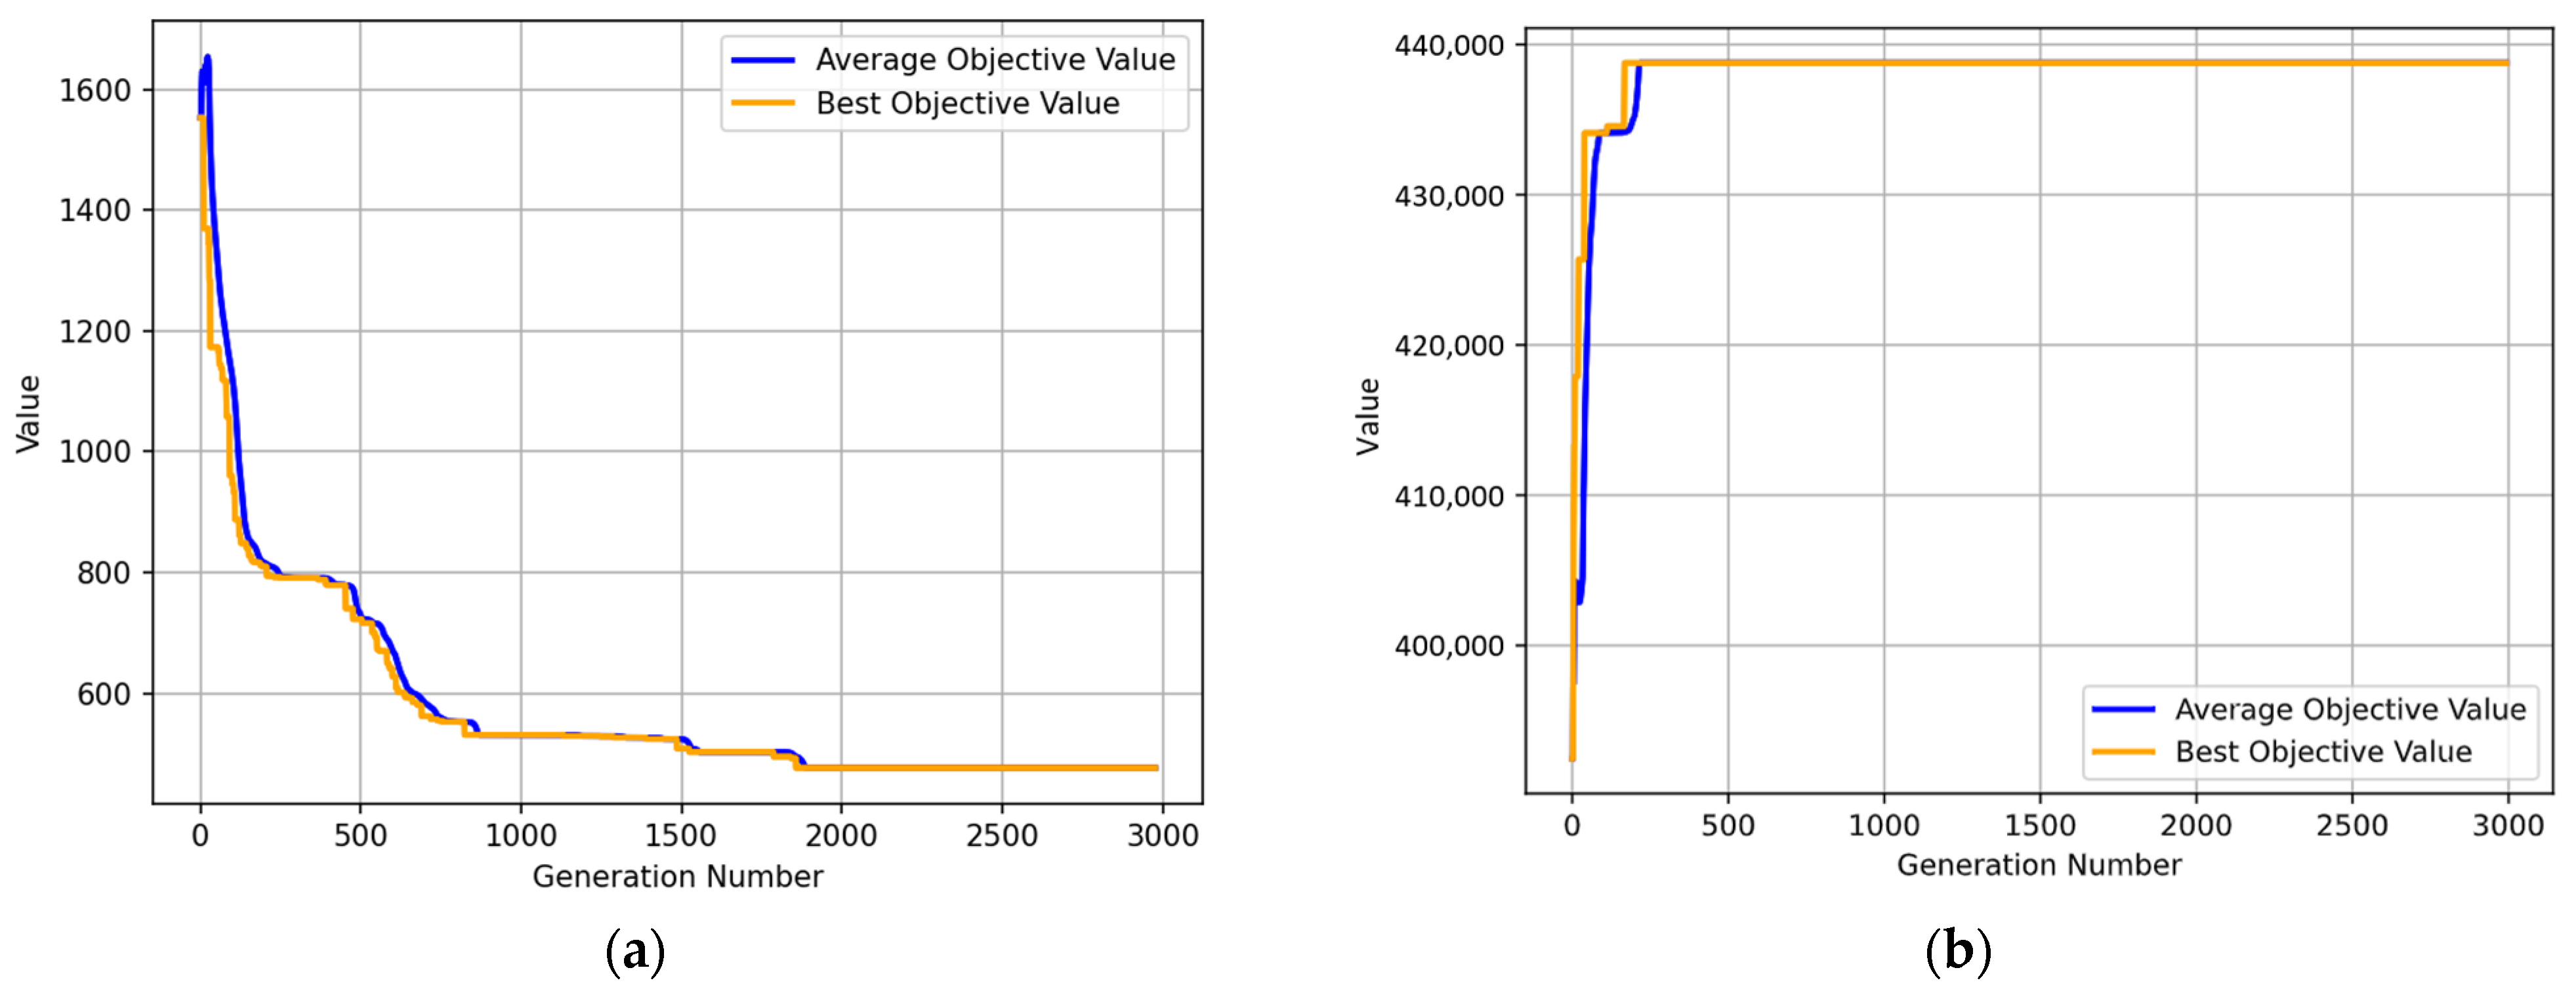
6.3. Computational Results in Different Scenarios

6.3.1. Only the Profits Are Considered

The overall association risk of the park was measured when considering rent only. Owing to the convenience of moving and unloading goods on the first floor, many enterprises compete to lease lower floors, resulting in enterprises being more willing to pay relatively high rents for lower floors. For 45 enterprises, only the lower-level layout was implemented. In other words, only rental profit was considered, and the layout results are shown in Figure 6 and Figure 7. When the improved GA iteration was approximately 1750 generations, the target value tended to stabilize, with a maximum rental profit of 2,476,679 yuan. As shown in Figure 7, enterprises tended to congregate on the lower floors. According to the calculation of the layout result and risk parameters, the total association risk value in this layout case was 2048.2, which is much higher than the result considering the risk (i.e., 350.6). This also shows that it is necessary to consider the risk factors.

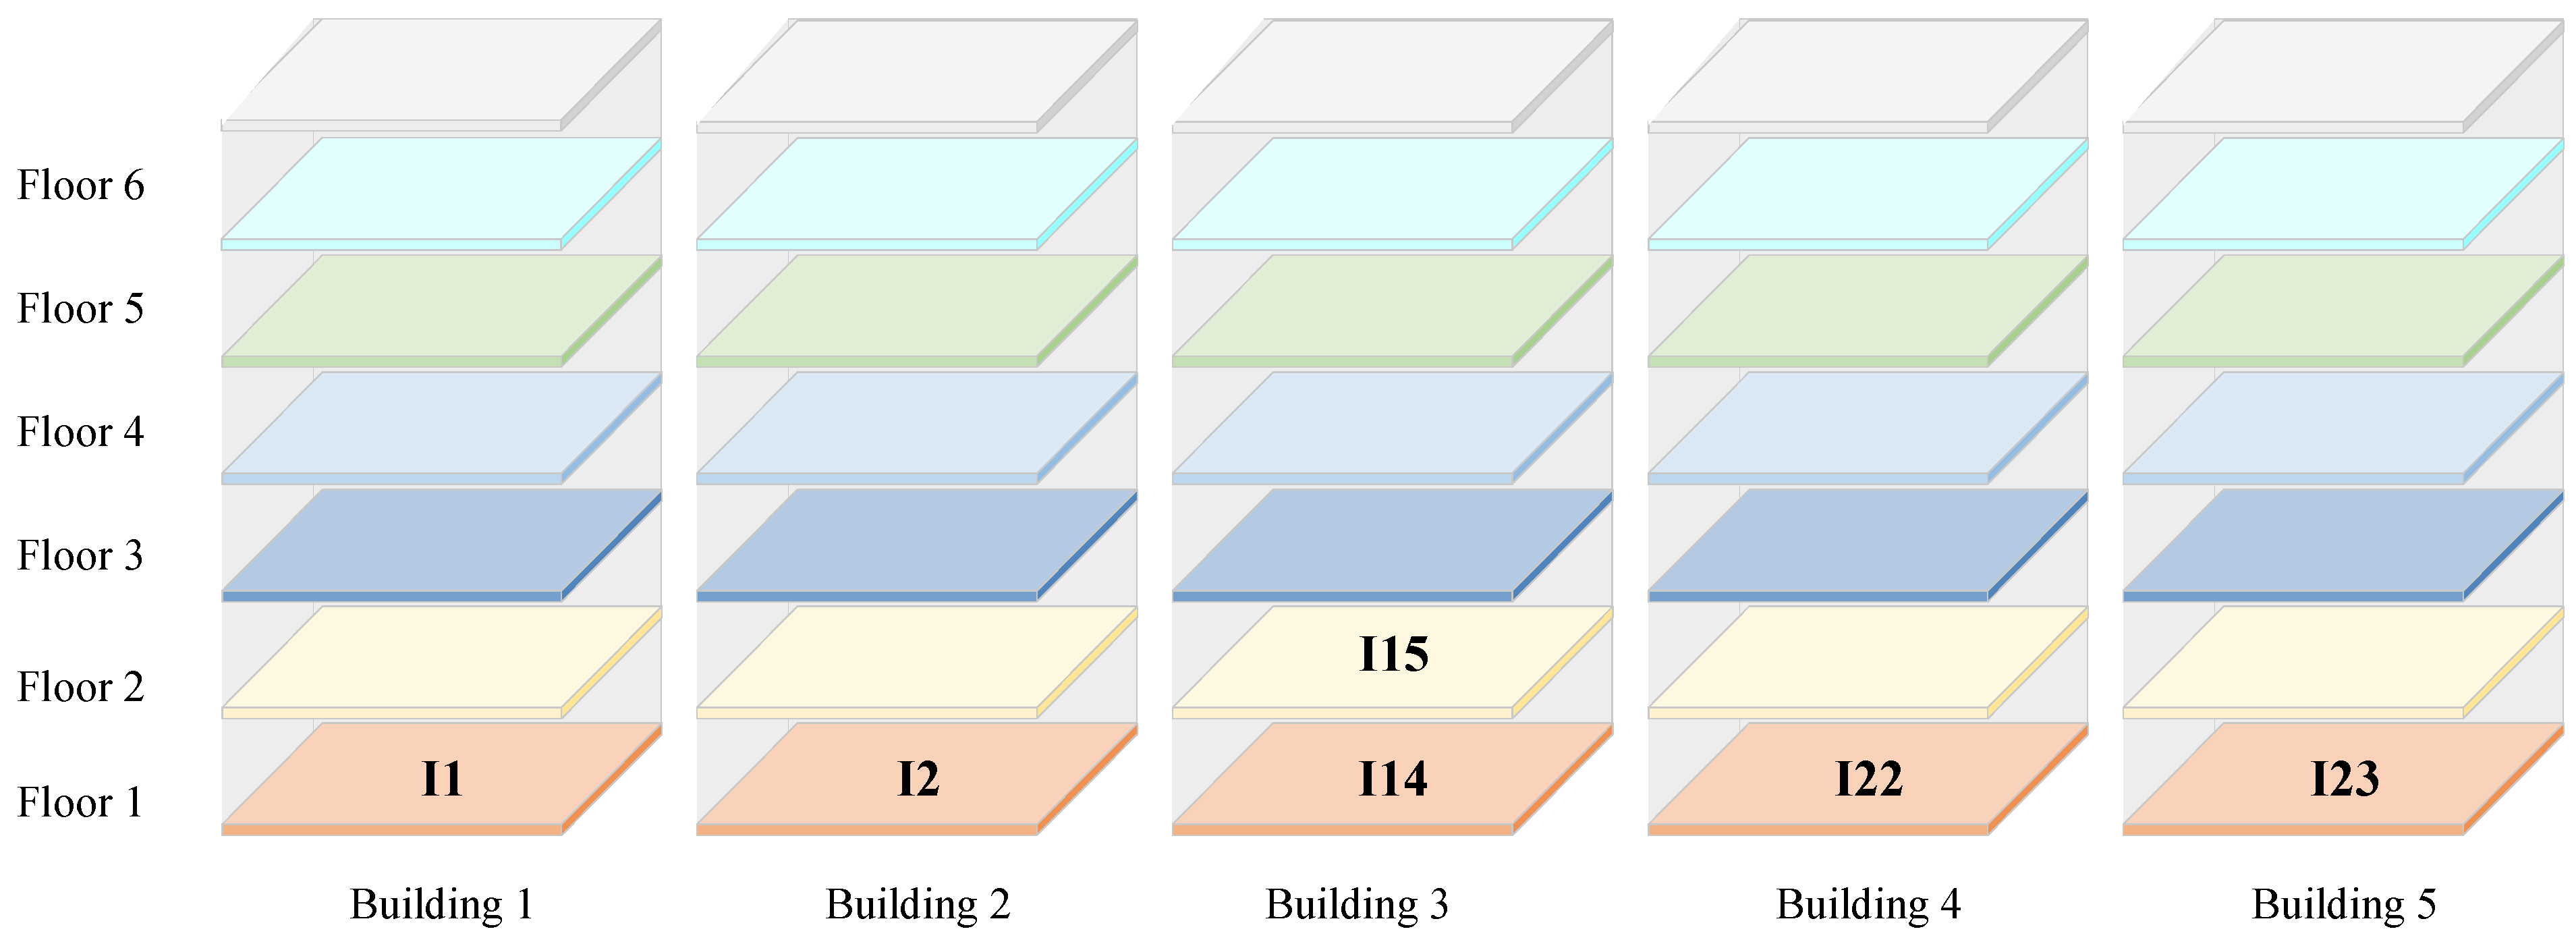
6.3.2. Consider Current Layout

One of the problems that must be considered when determining a layout is that several enterprises in the park have already determined the advanced location. These enterprises will also affect the overall risk value of the park; therefore, the current layout is needed to consider. Six risk enterprises (I1, I2, I14, I15, I22, and I23) from three different risk enterprise categories were taken to determine the locations in advance. In this case, the location layout of the remaining 29 enterprises was determined.
First, considering the area constraint, the locations of these enterprises (see Figure 8) were assumed, and constraints were added to the solution algorithm. The model was then solved, and the results are shown in Figure 9 and Figure 10. The overall association risk value of the park was 476.3, which was greater than the original layout result (i.e., 350.6). This also reminds us that, when optimizing the layout considering risks, try to conduct unified planning for all enterprises, which is more likely to obtain better results. The rental profit of 10 non/low-risk enterprises was 438,772 yuan, an increase. As can be seen from the layout results in Figure 10, most non/low-risk enterprises were located on the first floor, which may lead to higher rental profits. In the proposed model, rental profit is significantly affected by the upper-level layout. The advanced location of some risk enterprises may also positively impact rental profits.
From the above scenario simulation, we can see that the proposed model can implement the function of dynamic layout. By changing the input parameters and adding corresponding constraints, the layout of the park at any specific moment can be conducted. Because the lease terms signed by enterprises and the park are generally longer and the frequency of enterprise changes is low, this study did not consider time variables. However, as time goes on and the number of enterprises increases, the total association risk value may change significantly. In addition, from the layout results, it is better to lay out multiple enterprises at once than multiple times. In this sense, it is advisable to re-plan the layout of all enterprises when the total associated risk value exceeds the acceptable level of the industrial park. Achieving enterprise reallocation is a complex issue that requires multi-party coordination. Consequently, this model is more suitable for solving the layout problem when a large number of enterprises settle in the early stages of the park.

6.4. Sensitivity Analysis

To verify the proposed model and solution strategy, a sensitivity analysis was conducted to investigate the consequences of varying the critical parameters.

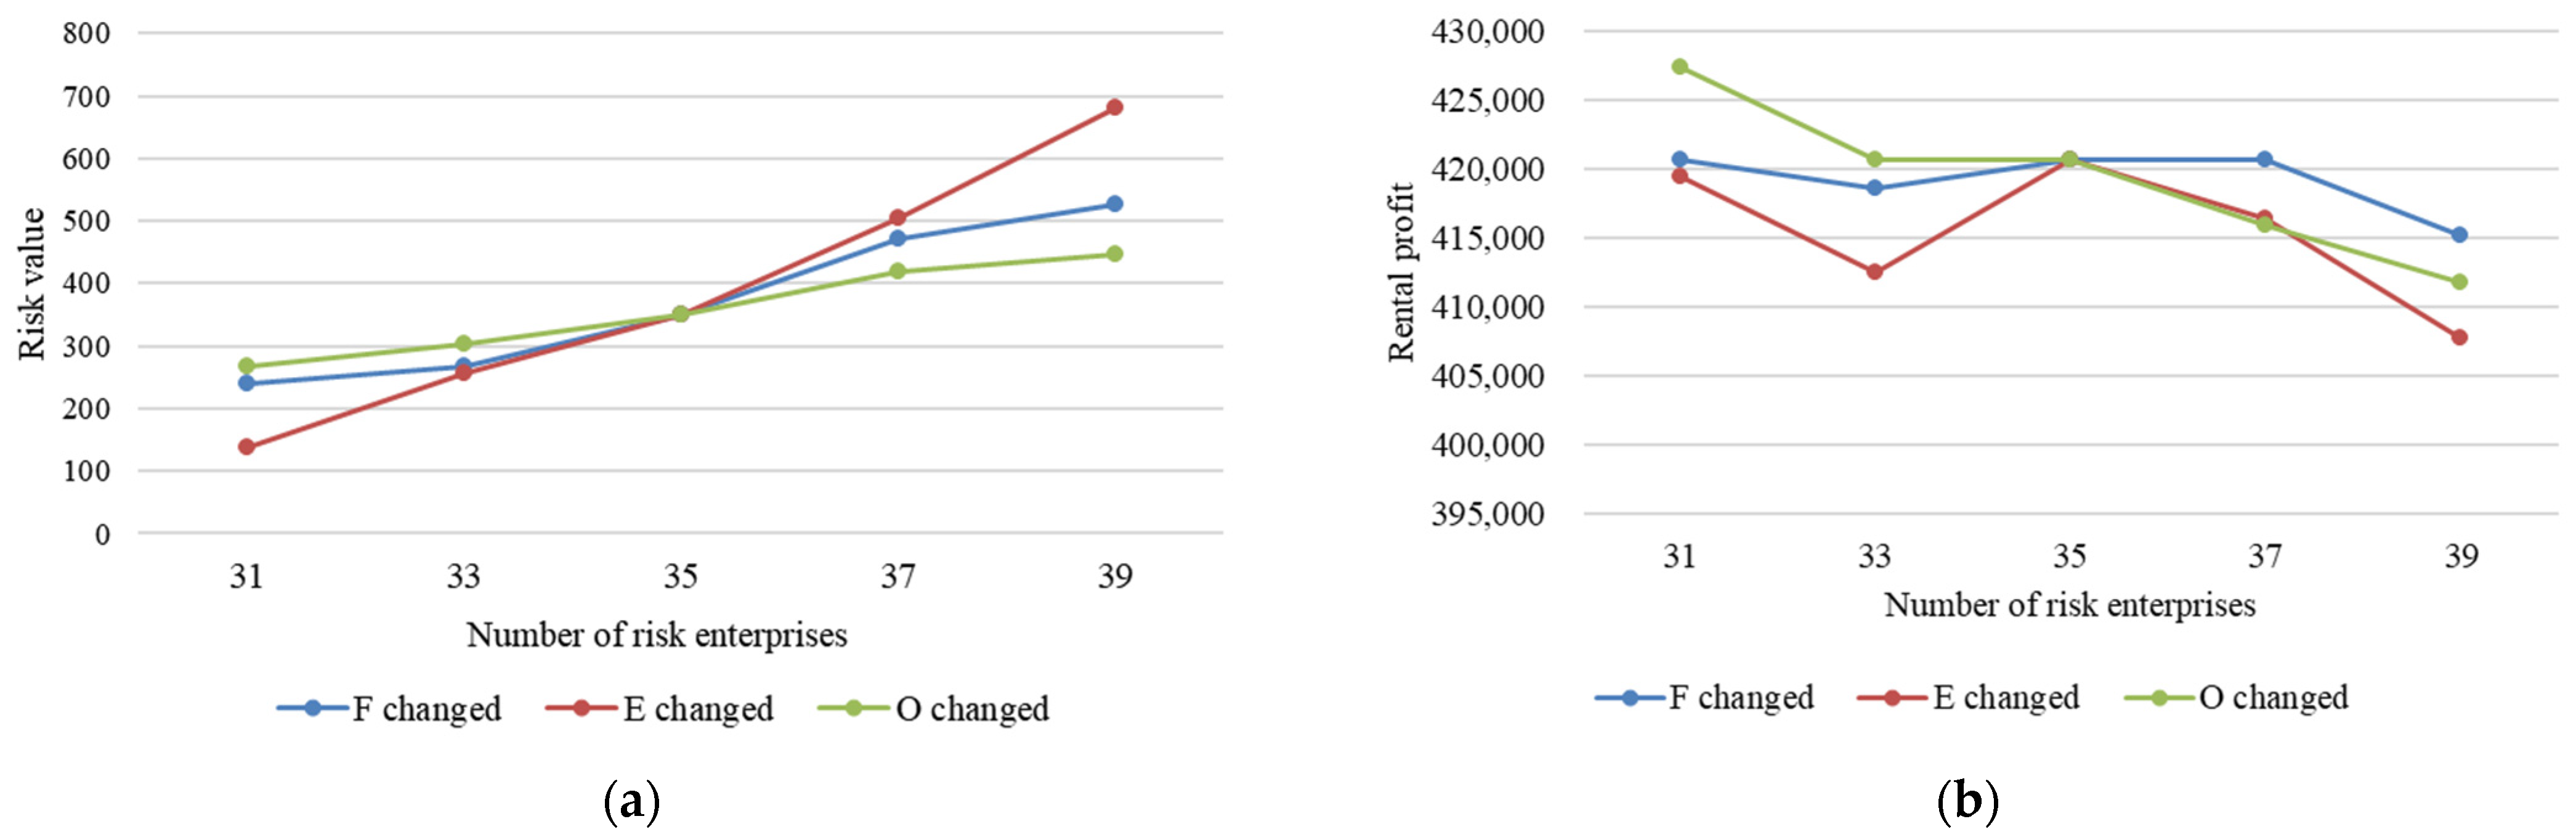
6.4.1. Sensitivity to the Number of Risk Enterprises

The number of risk enterprises had a significant influence on the overall risk level of the park. The numbers of risk enterprises in the three categories were changed separately, and the changes in the associated risk value and rental profit were observed. That is, the number of fire risk enterprises ranged from 9 to 17, the number of explosion risk enterprises ranged from 4 to 12, other risk enterprises ranged from 10 to 18, and the total number of enterprises ranged from 31 to 39. The simulation results are shown in Figure 11. In addition, when increasing the number of enterprises, there is a situation in which the areas of some enterprises are too large to be laid out, so the area parameters are appropriately adjusted.
Overall, the total association risk value increased with the number of the three types of risk enterprises (see Figure 11a). Explosion risk enterprises had the most significant change, from 138.5 to 681, while other risk enterprises had the least significant change, from 268.3 to 446.5. This phenomenon may occur because the risk parameter values of explosion-risk enterprises are larger than those of the other two types. In addition, the results remind park administrators to conduct a risk assessment of enterprises before they enter the park and to limit the number of risky enterprises as much as possible. Rental profit decreases with an increase in risk enterprises, but there are fluctuations. Overall, profit changes were minor. The third type of risk enterprise had the most significant risk change: the rental profit decreased from 427,392 yuan to 411,740 yuan, a decrease of 3.7%. The rent profit is insensitive to small changes in the number of risk enterprises.

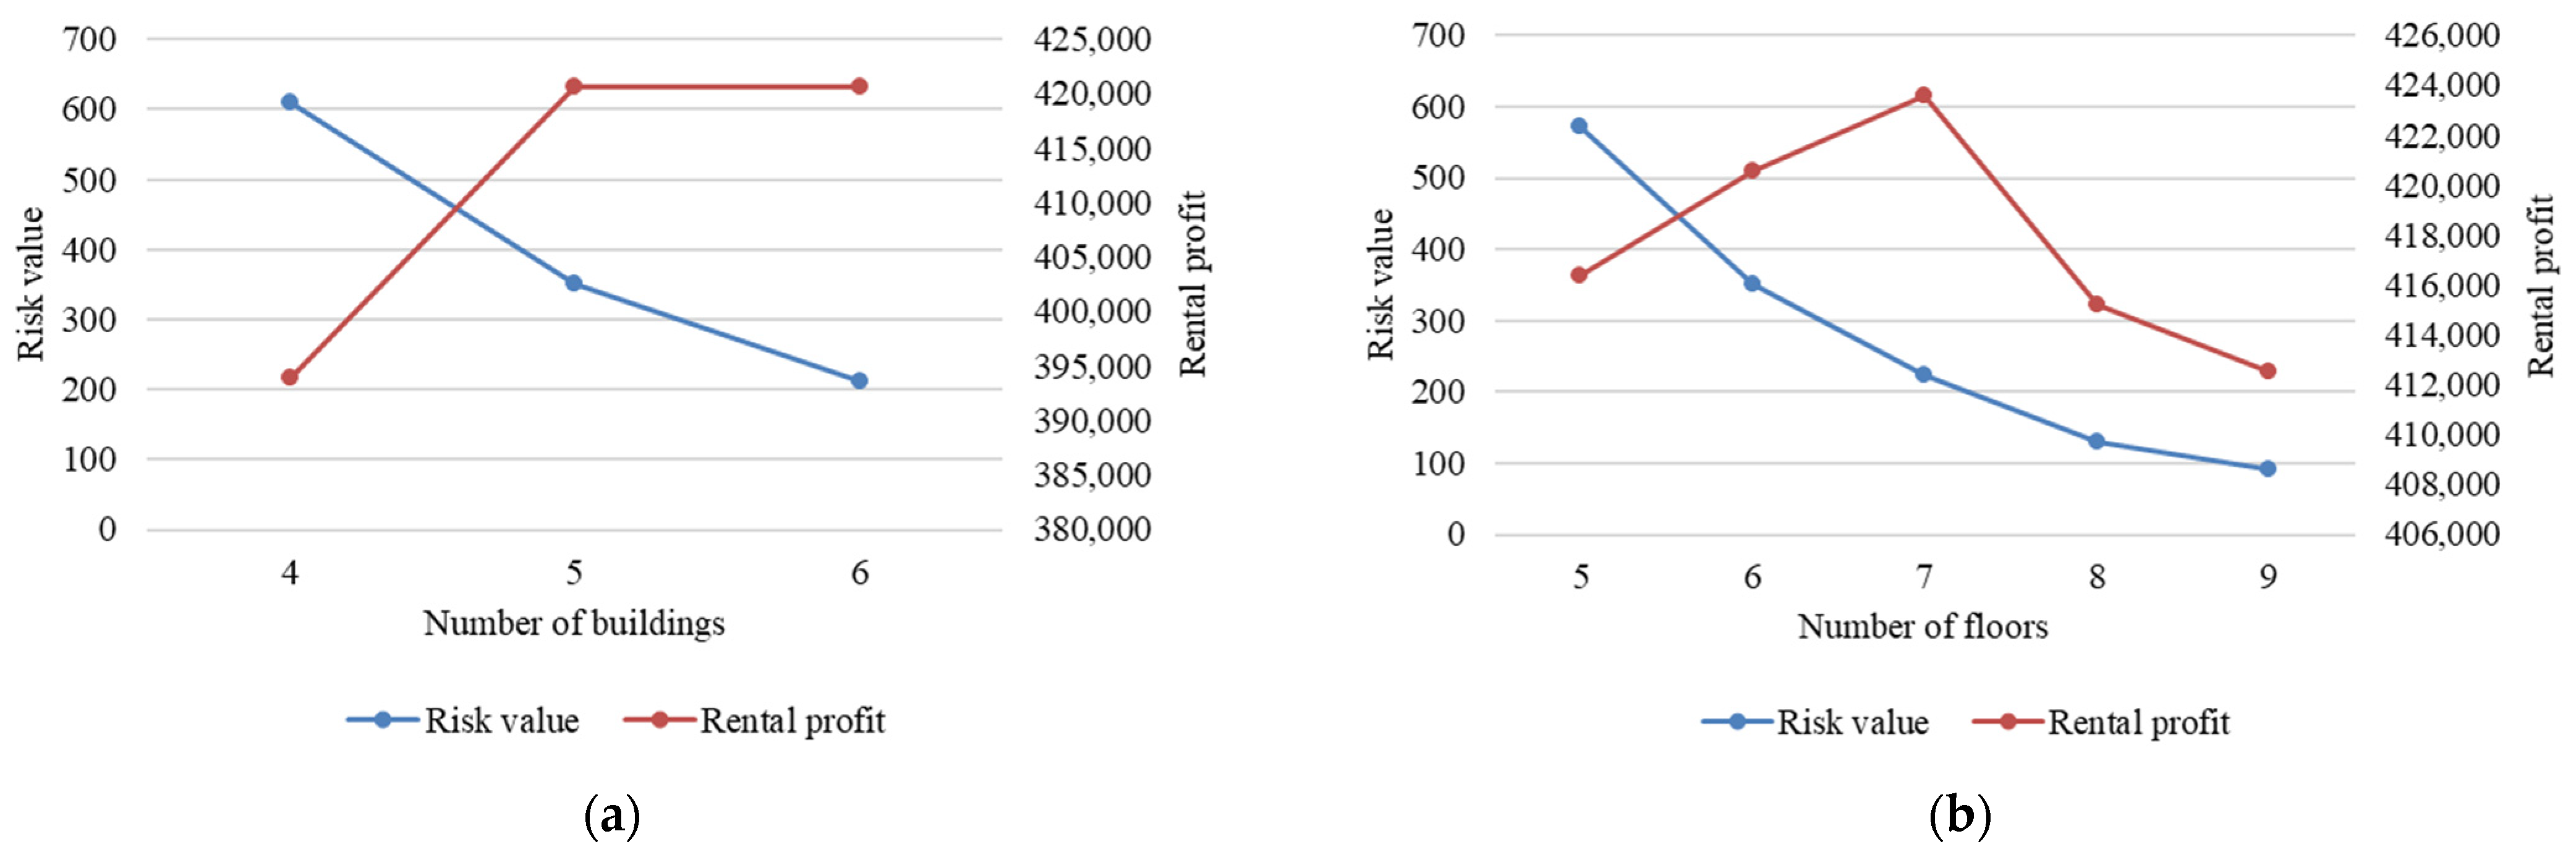
6.4.2. Sensitivity to the Size of the Industry Park

The changes in the number of buildings and floors were considered as examples to illustrate the impact of the size of the park on the layout results. The risk value and rental profit were simulated when the number of buildings was four, five, or six. As shown in Figure 12a, the risk value decreased with an increase in the number of buildings and varied significantly. This is because the association risk is greatly affected by distance. In addition, the model assumed that an association risk exists only between enterprises in the same building. When the number of buildings changed from four to five, the rental profit was greatly improved, whereas when the number changed from five to six, the rental profit did not change.
Considering the area constraint, the number of floors in the industrial park was changed from five to nine, and the changes in risk value and rental profit were observed (see Figure 12b). The total association risk value decreased as the number of floors increased, which is consistent with our expectations because the risk diffusion coefficient decreases as the floor difference increases. The rate of change in rental profit was insignificant, and Figure 12b shows that the rental profit did not show a linear increasing trend. The rental profit was also insensitive to changes in the number of floors. The rental profit was affected by the results of the upper-level layout. When the number of floors exceeded a particular value, increasing the number of floors did not help rental profit. This may be because enterprises prefer to be located on the lower floors.

7. Conclusions

This study investigated the layout problem of enterprises in a new-type clustered industrial park. First, the association risk was defined, and the calculation formulas were given in combination with the QRA method and domino effect. Risk enterprises were divided into three types: fire risk enterprises, explosion risk enterprises, and other types. Subsequently, a BLINLP model was proposed to formulate the large-scale 3DMSELD problem. In the proposed model, minimizing the total association risk was the upper-level goal. The lower-level goal was to maximize the rental profit of the park. However, the proposed model was difficult to get a global optimum as the problem size was large. In this sense, the decision variables were first transformed to reduce the problem scale. Then, an improved GA was applied. Finally, a case study of the Shunde Industry Park was conducted to validate the proposed model and approach. Two different scenarios were implemented, and critical parameters were tested to provide valuable management insights.
Several insights on the theory and practice of the large-scale 3DMSELD problem considering risk and profit are obtained based on the results in Section 6. First, the bi-level optimization theory represents the hierarchical relationship between layout objectives, which is rarely considered in the existing literature. This model prioritizes enterprise association risk affected by distance: the farther the distance, the smaller the association risk. Secondly, the strategy we propose solves the problem that it is difficult to obtain an optimal solution for nonlinear models built for large-scale problems. It can be seen from the tracking plots (e.g., Figure 9) that the optimal objective value change curve converges well, and the change amplitude is large. In practice, the proposed model and approach are suitable for modeling such problems. Optimal layout results can be obtained that greatly dramatically reduces the total association risk and improves the rental profit. From the layout results, it is found that it is imperative to consider the association risks in the actual layout problem. When laying out considering rental profit only, the risk increased from 350.6 to 2048.2, which validates the effectiveness of the proposed model. In particular, the model considers the impact of existing layouts that often appear in real-world scenarios. It can be seen from the simulation results that a unified layout for all enterprises is more conducive to reducing the overall association risk of the park. In addition, the number of risk enterprises and the size of the park have a significant impact on the total association risk, which is in line with our engineering experience. Finally, the rental profit to the park manager from non/low-risk enterprises is significantly affected by the layout results of the risk enterprises. As can be seen from the sensitivity analysis, rental profit fluctuates but does not change significantly. However, the lower-level layout can still improve rental profit (see Figure 4b).
Despite these contributions and novelties, our study has several potential directions that can be further investigated. The layout results identify the floor on which the enterprise is located, but detailed explanations and constraints on single-floor layouts are lacking. Our work mainly focuses on the risks of fire and explosion, and there is a shortage of investigation on other risks. In addition, our study only considered the current risk level of the enterprise to be laid out; however, risk changes over its lifespan. Therefore, potential future work can be done to (a) add a single-floor specific location layout and form a multi-stage layout framework to solve the large-scale 3DMSELD problem; (b) include other factors in the analysis, such as emergency facilities of risk enterprises and toxic and harmful gas leakage; and (c) study the risk changes during the lease period of enterprises and improve the layout model.

Author Contributions

Conceptualization, X.L. and X.G.; methodology, X.L. and X.G.; validation, H.L.; formal analysis, H.L.; investigation, X.G.; data curation, G.H., S.O.; writing—original draft preparation, X.L.; writing—review and editing, H.L., I.M.H.; visualization, S.O.; supervision, G.H. and S.O.; project administration, G.H.; funding acquisition, X.G. All authors have read and agreed to the published version of the manuscript.

Funding

This work was supported by Interdisciplinary Research Project for Young Teachers of USTB (Fundamental Research Funds for the Central Universities with grant number FRF-IDRY-21-016) and researchers supporting project with grant number (RSP-2021/389) from King Saud University, Riyadh, Saudi Arabia.

Institutional Review Board Statement

Not applicable.

Informed Consent Statement

Not applicable.

Data Availability Statement

Not applicable.

Conflicts of Interest

The authors declare no conflict of interest.

References

  1. Wang, R.; Wu, Y.; Wang, Y.; Feng, X. An industrial area layout design methodology considering piping and safety using genetic algorithm. J. Clean. Prod. 2017, 167, 23–31. [Google Scholar] [CrossRef]
  2. Heikkilä, A.-M.; Malmén, Y.; Nissilä, M.; Kortelainen, H. Challenges in risk management in multi-company industrial parks. Saf. Sci. 2010, 48, 430–435. [Google Scholar] [CrossRef]
  3. Caputo, A.C.; Pelagagge, P.M.; Palumbo, M.; Salini, P. Safety-based process plant layout using genetic algorithm. J. Loss Prev. Process Ind. 2015, 34, 139–150. [Google Scholar] [CrossRef]
  4. Wang, R.; Wang, Y.; Gundersen, T.; Wu, Y.; Feng, X.; Liu, M. A layout design method for an industrial park based on a novel arrangement algorithm—Consideration of pipe network and multiple hazard sources. Chem. Eng. Sci. 2020, 227, 115929. [Google Scholar] [CrossRef]
  5. Wang, R.; Wang, Y.; Gundersen, T.; Wu, Y.; Feng, X.; Liu, M. A multi-objective optimization method for industrial park layout design: The trade-off between economy and safety. Chem. Eng. Sci. 2021, 235, 116471. [Google Scholar] [CrossRef]
  6. Şahin, R.; Niroomand, S.; Durmaz, E.D.; Molla-Alizadeh-Zavardehi, S. Mathematical formulation and hybrid meta-heuristic solution approaches for dynamic single row facility layout problem. Ann. Oper. Res. 2020, 295, 313–336. [Google Scholar] [CrossRef]
  7. Rosenblatt, M.J. The facilities layout problem: A multi-goal approach. Int. J. Prod. Res. 1979, 17, 323–332. [Google Scholar] [CrossRef]
  8. Penteado, F.D.; Ciric, A.R. An MINLP approach for safe process plant layout. Ind. Eng. Chem. Res. 1996, 35, 1354–1361. [Google Scholar] [CrossRef]
  9. Kia, R.; Khaksar-Haghani, F.; Javadian, N.; Tavakkoli-Moghaddam, R. Solving a multi-floor layout design model of a dynamic cellular manufacturing system by an efficient genetic algorithm. J. Manuf. Syst. 2014, 33, 218–232. [Google Scholar] [CrossRef]
  10. Latifi, S.E.; Mohammadi, E.; Khakzad, N. Process plant layout optimization with uncertainty and considering risk. Comput. Chem. Eng. 2017, 106, 224–242. [Google Scholar] [CrossRef]
  11. Sonta, A.; Dougherty, T.R.; Jain, R.K. Data-driven optimization of building layouts for energy efficiency. Energy Build. 2021, 238, 110815. [Google Scholar] [CrossRef]
  12. Wu, Y.; Wang, Y. A chemical industry area-wide layout design methodology for piping implementation. Chem. Eng. Res. Des. 2017, 118, 81–93. [Google Scholar] [CrossRef]
  13. Al-Zubaidi, S.Q.D.; Fantoni, G.; Failli, F. Analysis of drivers for solving facility layout problems: A Literature review. J. Ind. Inf. Integr. 2021, 21, 100187. [Google Scholar] [CrossRef]
  14. Ingole, S.; Singh, D. Unequal-area, fixed-shape facility layout problems using the firefly algorithm. Eng. Optim. 2017, 49, 1097–1115. [Google Scholar] [CrossRef]
  15. Wang, R.; Wu, Y.; Wang, Y.; Feng, X.; Liu, M. An Industrial Park Layout Design Method Considering Pipeline Length Based on FLUTE Algorithm. In Computer Aided Chemical Engineering; Eden, M.R., Ierapetritou, M.G., Towler, G.P., Eds.; Elsevier: Amsterdam, The Netherlands, 2018; Volume 44, pp. 193–198. [Google Scholar]
  16. Wang, R.; Zhao, H.; Wu, Y.; Wang, Y.; Feng, X.; Liu, M. An industrial facility layout design method considering energy saving based on surplus rectangle fill algorithm. Energy 2018, 158, 1038–1051. [Google Scholar] [CrossRef]
  17. Derhami, S.; Smith, J.S.; Gue, K.R. A simulation-based optimization approach to design optimal layouts for block stacking warehouses. Int. J. Prod. Econ. 2020, 223, 107525. [Google Scholar] [CrossRef]
  18. Brunoro Ahumada, C.; Quddus, N.; Mannan, M.S. A method for facility layout optimisation including stochastic risk assessment. Process Saf. Environ. Prot. 2018, 117, 616–628. [Google Scholar] [CrossRef]
  19. de Lira-Flores, J.A.; López-Molina, A.; Gutiérrez-Antonio, C.; Vázquez-Román, R. Optimal plant layout considering the safety instrumented system design for hazardous equipment. Process Saf. Environ. Prot. 2019, 124, 97–120. [Google Scholar] [CrossRef]
  20. Medina-Herrera, N.; Jiménez-Gutiérrez, A.; Grossmann, I.E. A mathematical programming model for optimal layout considering quantitative risk analysis. Comput. Chem. Eng. 2014, 68, 165–181. [Google Scholar] [CrossRef]
  21. Groth, K.M.; Hecht, E.S. HyRAM: A methodology and toolkit for quantitative risk assessment of hydrogen systems. Int. J. Hydrogen Energy 2017, 42, 7485–7493. [Google Scholar] [CrossRef]
  22. Cozzani, V.; Gubinelli, G.; Antonioni, G.; Spadoni, G.; Zanelli, S. The assessment of risk caused by domino effect in quantitative area risk analysis. J. Hazard. Mater. 2005, 127, 14–30. [Google Scholar] [CrossRef] [PubMed]
  23. Zhou, J.; Reniers, G.; Cozzani, V. Improved probit models to assess equipment failure caused by domino effect accounting for dynamic and synergistic effects of multiple fires. Process Saf. Environ. Prot. 2021, 154, 306–314. [Google Scholar] [CrossRef]
  24. Ejeh, J.O.; Liu, S.; Papageorgiou, L.G. An MILP model for safe multi-floor process plant layout using the domino hazard index. Process Saf. Environ. Prot. 2021, 148, 137–165. [Google Scholar] [CrossRef]
  25. Liu, A.; Wu, C.; Peng, X. Research on Area Risk Assessment for Chemical Park based on Domino Effect Model. Procedia Eng. 2012, 45, 47–52. [Google Scholar] [CrossRef]
  26. Ding, L.; Khan, F.; Ji, J. A novel approach for domino effects modeling and risk analysis based on synergistic effect and accident evidence. Reliab. Eng. Syst. Saf. 2020, 203, 107109. [Google Scholar] [CrossRef]
  27. Ni, Z.-j.; Wang, Y.; Yin, Z. Relative risk model for assessing domino effect in chemical process industry. Saf. Sci. 2016, 87, 156–166. [Google Scholar] [CrossRef]
  28. He, Z.; Weng, W. A dynamic and simulation-based method for quantitative risk assessment of the domino accident in chemical industry. Process Saf. Environ. Prot. 2020, 144, 79–92. [Google Scholar] [CrossRef]
  29. Lu, J.; Han, J.; Hu, Y.; Zhang, G. Multilevel decision-making: A survey. Inf. Sci. 2016, 346, 463–487. [Google Scholar] [CrossRef]
  30. Cao, C.; Liu, Y.; Tang, O.; Gao, X. A fuzzy bi-level optimization model for multi-period post-disaster relief distribution in sustainable humanitarian supply chains. Int. J. Prod. Econ. 2021, 235, 108081. [Google Scholar] [CrossRef]
  31. Yang, X.; Niu, D.; Sun, L.; Ji, Z.; Zhou, J.; Wang, K.; Siqin, Z. A bi-level optimization model for electric vehicle charging strategy based on regional grid load following. J. Clean. Prod. 2021, 325, 129313. [Google Scholar] [CrossRef]
  32. Che, A.; Zhang, Y.; Feng, J. Bi-objective optimization for multi-floor facility layout problem with fixed inner configuration and room adjacency constraints. Comput. Ind. Eng. 2017, 105, 265–276. [Google Scholar] [CrossRef]
  33. Martinez-Gomez, J.; Nápoles-Rivera, F.; Ponce-Ortega, J.M.; Serna-González, M.; El-Halwagi, M.M. Optimization of facility location and reallocation in an industrial plant through a multi-annual framework accounting for economic and safety issues. J. Loss Prev. Process Ind. 2015, 33, 129–139. [Google Scholar] [CrossRef]
  34. Nabli, H. An overview on the simplex algorithm. Appl. Math. Comput. 2009, 210, 479–489. [Google Scholar] [CrossRef]
  35. Xie, W.; Sahinidis, N.V. A branch-and-bound algorithm for the continuous facility layout problem. Comput. Chem. Eng. 2008, 32, 1016–1028. [Google Scholar] [CrossRef]
  36. Ahmadi, A.; Akbari Jokar, M.R. An efficient multiple-stage mathematical programming method for advanced single and multi-floor facility layout problems. Appl. Math. Model. 2016, 40, 5605–5620. [Google Scholar] [CrossRef]
  37. Kulturel-Konak, S.; Konak, A. A large-scale hybrid simulated annealing algorithm for cyclic facility layout problems. Eng. Optim. 2015, 47, 963–978. [Google Scholar] [CrossRef]
  38. Chalupa, D.; Nielsen, P. A simple and robust Monte Carlo hybrid local search algorithm for the facility location problem. Eng. Optim. 2019, 51, 832–845. [Google Scholar] [CrossRef]
  39. Chen, Y.; Jiang, Y.; Wahab, M.I.M.; Long, X. The facility layout problem in non-rectangular logistics parks with split lines. Expert Syst. Appl. 2015, 42, 7768–7780. [Google Scholar] [CrossRef]
  40. Balakrishnan, J.; Cheng, C.H.; Conway, D.G.; Lau, C.M. A hybrid genetic algorithm for the dynamic plant layout problem. Int. J. Prod. Econ. 2003, 86, 107–120. [Google Scholar] [CrossRef]
  41. Patsiatzis, D.I.; Knight, G.; Papageorgiou, L.G. An MILP Approach to Safe Process Plant Layout. Chem. Eng. Res. Des. 2004, 82, 579–586. [Google Scholar] [CrossRef]
  42. Vázquez-Román, R.; Lee, J.-H.; Jung, S.; Mannan, M.S. Optimal facility layout under toxic release in process facilities: A stochastic approach. Comput. Chem. Eng. 2010, 34, 122–133. [Google Scholar] [CrossRef]
  43. Cheng, M.-Y.; Lien, L.-C. A hybrid AI-based particle bee algorithm for facility layout optimization. Eng. Comput. 2012, 28, 57–69. [Google Scholar] [CrossRef]
  44. Xu, Y.; Wang, Z.; Zhu, Q. An Improved Hybrid Genetic Algorithm for Chemical Plant Layout Optimization with Novel Non-overlapping and Toxic Gas Dispersion Constraints. Chin. J. Chem. Eng. 2013, 21, 412–419. [Google Scholar] [CrossRef]
  45. Emami, S.; Nookabadi, A.S. Managing a new multi-objective model for the dynamic facility layout problem. Int. J. Adv. Manuf. Technol. 2013, 68, 2215–2228. [Google Scholar] [CrossRef]
  46. Izadinia, N.; Eshghi, K.; Salmani, M.H. A robust model for multi-floor layout problem. Comput. Ind. Eng. 2014, 78, 127–134. [Google Scholar] [CrossRef]
  47. Alves, D.T.S.; de Medeiros, J.L.; Araújo, O.d.Q.F. Optimal determination of chemical plant layout via minimization of risk to general public using Monte Carlo and Simulated Annealing techniques. J. Loss Prev. Process Ind. 2016, 41, 202–214. [Google Scholar] [CrossRef]
  48. Zhang, G.; Nishi, T.; Turner, S.D.O.; Oga, K.; Li, X. An integrated strategy for a production planning and warehouse layout problem: Modeling and solution approaches. Omega 2017, 68, 85–94. [Google Scholar] [CrossRef]
  49. Arnaout, J.-P. Worm optimization for the multiple level warehouse layout problem. Ann. Oper. Res. 2018, 269, 29–51. [Google Scholar] [CrossRef]
  50. Ikwan, F.; Sanders, D.; Hassan, M. Safety evaluation of leak in a storage tank using fault tree analysis and risk matrix analysis. J. Loss Prev. Process Ind. 2021, 73, 104597. [Google Scholar] [CrossRef]
  51. Luo, T.; Wu, C.; Duan, L. Fishbone diagram and risk matrix analysis method and its application in safety assessment of natural gas spherical tank. J. Clean. Prod. 2018, 174, 296–304. [Google Scholar] [CrossRef]
  52. May, W.G.; McQueen, W. Radiation from Large Liquefied Natural Gas Fires. Combust. Sci. Technol. 1973, 7, 51–56. [Google Scholar] [CrossRef]
  53. Modak, A.T. Thermal radiation from pool fires. Combust. Flame 1977, 29, 177–192. [Google Scholar] [CrossRef]
  54. Sivathanu, Y.R.; Gore, J.P. Total radiative heat loss in jet flames from single point radiative flux measurements. Combust. Flame 1993, 94, 265–270. [Google Scholar] [CrossRef]
  55. Wu, C.; Hao, H. Modeling of simultaneous ground shock and airblast pressure on nearby structures from surface explosions. Int. J. Impact Eng. 2005, 31, 699–717. [Google Scholar] [CrossRef]
  56. Brode, H.L. Blast Wave from a Spherical Charge. Phys. Fluids 1959, 2, 217–229. [Google Scholar] [CrossRef]
  57. Yang, X.; Shi, S.; Cheng, P. Forecast and Simulation of Peak Overpressure of TNT Explosion Shock Wave in the air. Blasting 2008, 25, 15–18. (In Chinese) [Google Scholar]
  58. Zhou, G.; Zhu, Z.; Luo, S. Location optimization of electric vehicle charging stations: Based on cost model and genetic algorithm. Energy 2022, 247, 123437. [Google Scholar] [CrossRef]
  59. Blickle, T.; Thiele, L. A Comparison of Selection Schemes Used in Evolutionary Algorithms. Evol. Comput. 1996, 4, 361–394. [Google Scholar] [CrossRef]
  60. Mühlenbein, H.; Schlierkamp-Voosen, D. Predictive Models for the Breeder Genetic Algorithm I. Continuous Parameter Optimization. Evol. Comput. 1993, 1, 25–49. [Google Scholar]
  61. Jazzbin, e.a. Geatpy: The Genetic and Evolutionary Algorithm Toolbox with High Performance in Python. Available online: http://www.geatpy.com/ (accessed on 2 March 2022).
Figure 1. Impact of an accident in Enterprise A on Enterprise B.
Applsci 12 08110 g001
Figure 2. Schematic of the point source model.
Applsci 12 08110 g002
Figure 3. Double-point crossing.
Applsci 12 08110 g003
Figure 4. Trace plots of the improved GA solving: (a) Trace plot of upper-level layout; (b) Trace plot of lower-level layout.
Applsci 12 08110 g004
Figure 5. Multi-enterprises layout results.
Applsci 12 08110 g005
Figure 6. Trace plot considering only the rental profit.
Applsci 12 08110 g006
Figure 7. Layout results considering only rental profit.
Applsci 12 08110 g007
Figure 8. Current layout to consider.
Applsci 12 08110 g008
Figure 9. Trace plots of the improved GA solving considering current layout: (a) Trace plot of upper-level layout; (b) Trace plot of lower-level layout.
Applsci 12 08110 g009
Figure 10. Layout results when some enterprise locations have been determined.
Applsci 12 08110 g010
Figure 11. Results under different numbers of risk enterprises: (a) Association risk value; (b) Rental profit.
Applsci 12 08110 g011
Figure 12. Results under different industry park sizes: (a) Number of buildings; (b) Number of floors.
Applsci 12 08110 g012
Table 1. Summary of the literature on the layout operations.
ArticleMain ProblemMulti-Story LayoutRiskProfitCost *HierarchyApproach
Balakrishnan [40]Plant layoutNoNoNoYesSingleHeuristic
Patsiatzis [41]Process plant layoutNoYesNoYesSingleExact
Vázquez-Román [42]Facility layoutNoYesNoYesSingleExact
Cheng [43]Facility layoutNoNoNoNoSingleHeuristic
Xu [44]Chemical Plant LayoutNoYesNoYesSingleHeuristic
Emami [45]Dynamic facility layoutNoNoNoYesSingleHeuristic
Medina-Herrera [20]Plant layoutYesYesNoYesSingleExact
Kia [9]Dynamic cellular manufacturing systems layoutYesNoNoYesSingleHeuristic
Izadinia [46]Multi-floor layout problemYesNoNoYesSingleExact
Caputo [3]Process plant layoutNoYesNoYesSingleHeuristic
Alves [47]Chemical plant layoutNoYesNoNoSingleHeuristic
Ahmadi [36]Facility layoutYesNoNoYesSingleExact
Wang [1]Industrial area layoutNoYesNoYesSingleHeuristic
Che [32]Facility layoutYesNoNoYesSingleExact
Latifi [10]Process plant layoutNoYesNoYesSingleHeuristic
Zhang [48]Warehouse layoutNoNoNoYesSingleHeuristic
Arnaout [49]Warehouse layoutNoNoNoYesMultipleHeuristic
Wang [4]Industrial park layoutNoYesNoYesSingleHeuristic
Şahin [6]Facility layoutNoNoNoYesSingleHeuristic
Ejeh [24]Process plant layoutYesYesNoYesSingleExact
This studyIndustrial park layoutYesYesYesNoMultipleHeuristic
* does not include costs related to safety and risk but only the actual economic outlay.
Table 2. Basic building information of the park.
Building IDNumber of Floors Floor   Area   ( m 2 )
162332
263475
368211
462180
562934
Publisher’s Note: MDPI stays neutral with regard to jurisdictional claims in published maps and institutional affiliations.

