1. Introduction
Despite the early recognition of social bots on Twitter, and the good performance of different bot detection techniques that have been proposed in the literature [
1,
2,
3], detection performance drops when they are tested on new data [
4,
5], for two main reasons. The first reason is that labeled data play an important role in supervised learning (SL) performance. Thus, the majority of proposed work in bot detection has been performed in this manner, using human annotation to label Twitter accounts as humans or bots [
6,
7]. SL techniques are based on labeled data for training and testing the learning model. Therefore, the issue of obtaining labeled data that contain representative samples of different generations of bots, for this problem, is a very challenging task in terms of time, cost, and effort. In fact, obtaining labeled data for real-world problems, such as bot detection, is one of the limitations associated with SL techniques [
8]. The second reason is that bots adapt their behavior and features very quickly to avoid being detected by artificial intelligence and Chatbot advancements [
6,
9]. For this reason, learning models fail to detect new updated versions of bot accounts, and show a significant drop in performance.
Consequently, semi-supervised learning (SSL) techniques aim to mitigate this limitation in SL, by using both labeled and unlabeled data to build learning models for classification problems [
10]. Both graph and non-graph SSL have been implemented to enhance classification or to obtain more hidden information that unlabeled data can reveal [
11]. The common techniques of SSL that have been proposed in the literature vary in their mechanisms. For example, there are graph neural network (GNN) techniques that have been shown to be successful in several domains, such as graph convolutional networks (GCN) and graph attention networks (GAT). Additionally, there are SSL wrapper techniques, such as self-training (another name is self-labeling or pseudo-labeling) and co-training. Furthermore, there are generative model techniques, where the focus is on generating data using labeled data such as generative adversarial networks (GAN). In our case, we focused on graph SSL techniques, in particular GAT, as we aimed to work out the hidden relationships between nodes of a trending hashtag, to be able to predict the label of a given node. Non-graph techniques cannot reveal such information, due to the absence of graph structural information.
In this paper, we address the issue of labeled data for the bot detection problem, to enhance performance using related labeled and unlabeled data within a graph attention network mechanism by using the transfer learning (TL) approach. We aimed to combine the success of GNN and TL approaches, to overcome the issue of the scarcity of data for the bot detection problem, and to enhance classification. Our framework, Bot-MGAT, was designed based on multi-view graph attention networks, to distinguish the importance of different nodes within the neighborhood using node representations to predict the label. GAT has efficiency in operating, and can be applied to different degrees of nodes, in contrast to GCN, where nodes have equal or pre-defined weights. Bot-MGAT uses profile features only, as they have been shown to be effective in detecting social bots [
12]. Our model evaluation was compared using baseline models and cross-domain evaluation. The success of this classification task will save the effort and tedium of manual labeling for learning models. Additionally, it will improve the detection of bots, as it will accelerate the labeling process, to obtain large amounts of data for models that require large volumes of data to improve prediction. Additionally, using a deep learning attention mechanism is more efficient for applying node representation learning, and discovering hidden link information in embedding space that a regular classifier fails to detect.
Our work’s contributions were as follows:
We proposed a framework based on the transfer learning model, using the multi-view graph attention mechanism to enhance bot detection on Twitter;
We built our model using two different types of links: friendship and interaction;
We used profile features only, to predict labels and apply cross-validation, in order to estimate accuracy and avoid uncertainty in the model performance;
We performed a cross-domain evaluation of Bot-MGAT performance, by training the model using a diverse dataset, and testing the model using two other datasets that were not used in training.
The rest of this paper is organized as follows: the review of the literature is presented in
Section 2; in
Section 3, we present background details;
Section 4 discusses the materials and methods;
Section 5 discusses the results of the proposed framework;
Section 6 highlights the challenges that remain in this domain, and considers future directions for research efforts that aim to address this problem.
2. Related Work
In this section, we briefly review the related literature on graph neural networks as an SSL technique, and related bot detection work that has been recently proposed in the literature. In addition, we discuss and highlight the remaining issues relating to the detection of social bots on Twitter.
2.1. Graph Neural Networks
Deep learning has demonstrated successful performance in recent years in different domains. Research efforts have proven the powerfulness of this machine-learning approach to extracting complex patterns from massive amounts of irregular data [
13]. Therefore, using these machine-learning techniques to analyze graphs has been frequently proposed in recent years. The objective of this task was to overcome the challenges that remain in applying traditional deep learning to graphs [
14]. These challenges included the irregular structures of graphs, the heterogeneity and diversity of graphs, and large-scale graphs.
Graph neural networks (GNNs) were promoted after the success of neural networks and their ability to learn to extract latent representation from complex relations and interactions of a given network. GNNs are categorized into: recurrent graph neural networks (RGNNs), convolutional graph neural networks (CGNNs), graph auto-encoders (GAEs) and spatial–temporal graph neural networks (STGNNs) [
15]. GNNs can graph structured data to perform tasks such as node classification, link prediction, and graph classification. Therefore, GNNs can be trained in a semi-supervised manner by using the labeled nodes to classify the unlabeled ones in the graph [
16].
Spatially based GNN models such as GAT are preferred, as they maintain efficiency, generalizability, and flexibility of implementation compared to spectral models. This is because spatial models can handle multi-source graph inputs, in contrast to spectral models that only handle undirected graphs [
15]. In addition, spatial models are more scalable, as they perform graph convolutions locally on individual nodes, and share weights across different locations and structures. GAT models as a spatial model are considered a GCN model with an attention mechanism, and have achieved good performance in the literature [
17]. This has encouraged research to expand this model into multi-view perspectives, where different views of data are integrated [
18,
19].
Recent studies have proposed using GCNNs to enhance bot detection using relational graph convolution networks (BotRGCN) [
20] and GCNNs for spam bot detection [
21]. In [
20], the authors aimed to construct a heterogeneous graph of Twitter, and to apply relational GCN to detect bot communities. In [
21], the authors deployed graph convolutional neural networks to a well-known spam bot dataset that outperformed previous methods with regard to the results. Hence, the issue with previous datasets is that they were easily detected and did not include recent generations of bots.
2.2. Bot Detection
Social bots differ in their behavior patterns, based on their goals. Thus, common approaches proposed in the literature to detect social bots, using SL, include feature-based, network or graph-based, and crowdsourcing approaches [
6,
22]. In the feature-based approach, machine learning algorithms are applied, to identify social bot accounts based on selected features. In the graph-based approach, an understanding of social network information, through links and edges of relationships between accounts, is applied to detect activity. In the crowdsourcing approach, human expert ability is utilized to identify, evaluate, and determine the behavior of social bots.
Table 1 summarizes the strengths and limitations for each of the bot detection approaches in SL.
Accordingly, researchers have been looking for techniques other than SL, that might improve the classification task of social bot detection. A recent work was proposed by [
23], using the GAN method and long short-term memory (LSTM), to detect bots based on textual content. Their goal was to detect the behavioral patterns of bot samples for a given classifier, by improving true positive rates and reducing false negatives. Feng, et al., proposed a self-learning framework (SATAR) for Twitter bot detection, where the framework adapted itself by pre-training a massive number of users [
24]. They aimed to solve the issue of failing to adapt to new generations of Twitter bots. They constructed their framework based on tweet semantics, profile properties, and neighbors’ networks; the strength of this work lay in considering these three aspects for bot detection, as the experimental results conveyed.
3. Background
In this section, we model our problem, and provide details about graph attention networks, multi-view graph attention networks, and transfer learning.
3.1. Problem Definition
We let be a graph defined as , where was a set of nodes of size ; each node represented a Twitter account, and E was the adjacency matrix. Nodes of the graph were described using the feature matrix of dimension , where F was the number of features in total for each node, and each row was the feature vector of node . Each account was associated with a set of numerical features, , and categorical features, . Therefore, for .
The relationships among the different nodes were presented in the adjacency matrix of size , where indicated whether there was an edge (relationship) between node and . The diagonal elements of this matrix were the self-loop edges of the nodes (an edge from the node to itself). As our graph was undirected, the adjacency matrix was symmetric, and hence .
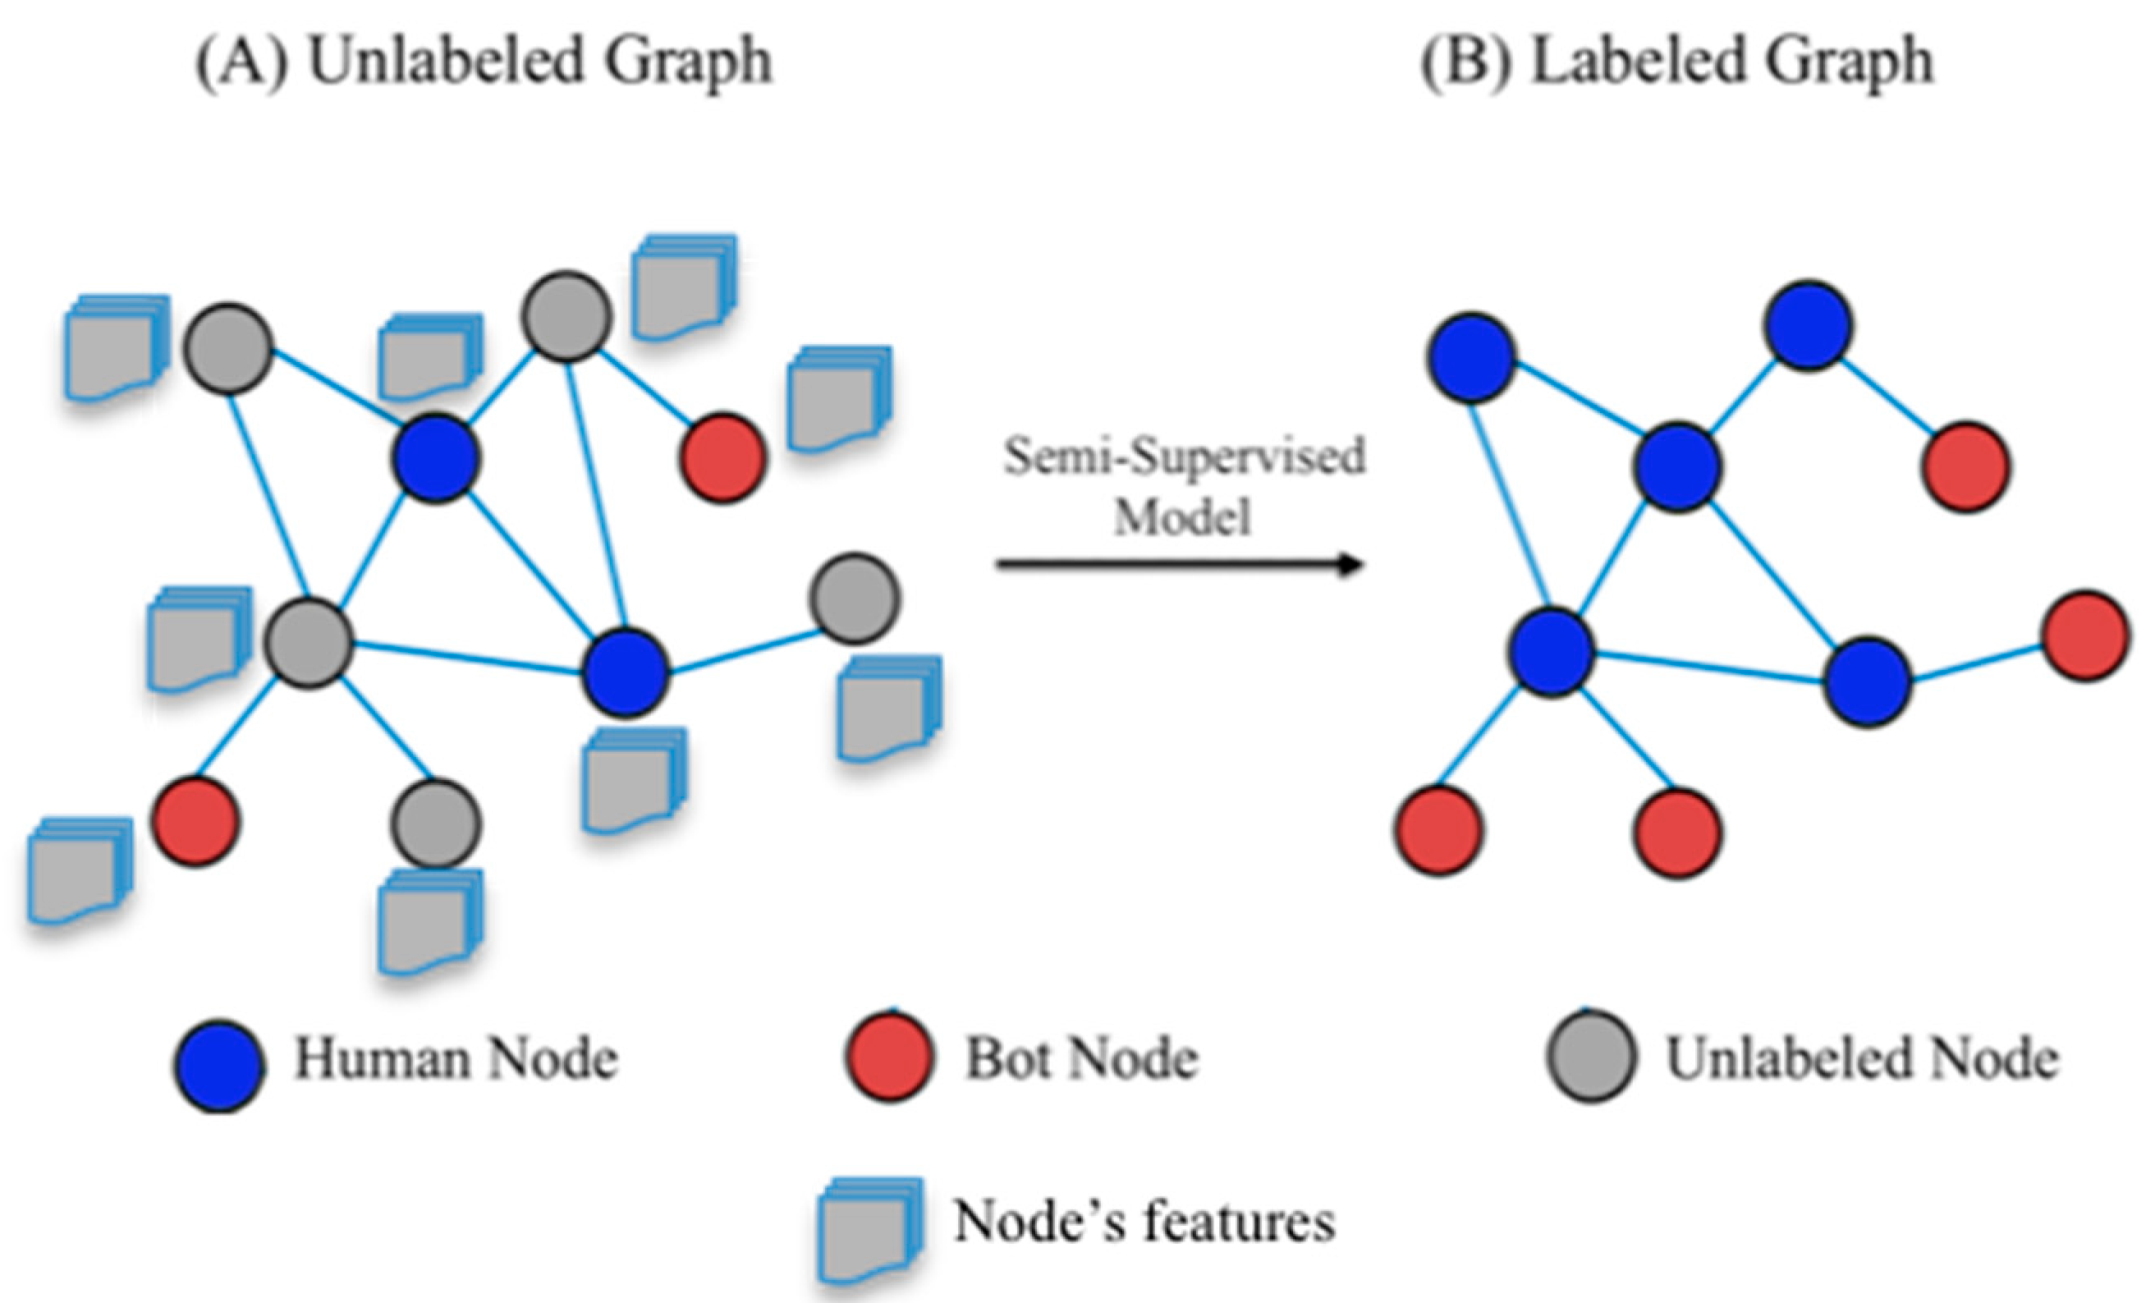
Labels of the nodes were included in the label vector of size , where was the ground truth of node , to indicate if this node was a human account or a bot account .
The Twitter bot detection problem was modeled as a binary classification task under the semi-supervised learning schema shown in
Figure 1. This was because we had a large dataset, but only a few nodes were labeled. Here, we found a function
that mapped each feature vector of a node to its true label, such that the predicted label
was close to the ground truth
for maximum prediction accuracy (or minimum prediction error).
3.2. Graph Attention Network
Graph attention networks (GATs) are a type of graph neural network in which the edges of the graph are weighted differently, to indicate the importance of nodes with respect to other nodes. The weighting is performed through a self-attention mechanism [
37]. Initially, the node representations (node embeddings) are the raw features
with a size
Then, a series of linear transformations can be applied through weight matrix multiplication, as follows in Equation (1):
where
is the weight matrix of the
linear layer, with a size of
. Consider
as the number of inputs of the
layer, and
as the number of outputs of the
layer.
is the additive bias vector of the
layer, and of size
.
activation function to add non-linearity is
. The linear layer can be applied separately for numerical features
and categorical features
of each node.
To calculate the weight of each edge (including the self-loops), we used Equation (2):
where
was the self-attention mechanism. These weights were not normalized, and therefore a Softmax function was utilized for normalization, as in Equation (3):
where
was the attention coefficient;
represented the neighbors of node
; LeakyReLU was an activation function, defined as follows in Equation (4):
where
was the negative slope.
The attention mechanism was performed by concatenating the representation of node
and node
(after linear transformation), and multiplying this by a learnable weighting vector
of size
. The result was passed through the LeakyReLU function. Thus, the attention coefficient in Equation (3) could be re-written as shown in Equation (5):
where
represented the transpose operator and || was the concatenation operator.
In [
38], the authors discovered that the implementation of the GAT had a static attention nature. The reason for this was the application of the
and
in the above equation sequentially. The authors fixed this by altering the operations, in which multiplication by
was performed after concatenating the nodes’ representations, a LeakyReLU was applied, and multiplication by
was carried out as a final step. This is shown in Equation (6):
This is called modified GAT (or GATv2), and we used it in our framework.
To obtain the final node representations
, we included the learned attention coefficients when aggregating the representations of the neighbors, as in Equation (7):
The first term was for the self-loops, and the second term was the weighted sum of the neighbors’ representations. These final representations could be utilized for different prediction tasks. In our work, we decided to use the single-head attention mechanism.
3.3. Multi-View Graph Attention Networks
A multi-view graph is a relational graph that consists of different relationships among the nodes (or, technically, multiple graphs with the same nodes, but different edges). This inspired [
39] to extend the graph convolutional networks (GCNs) to relational graph convolutional networks (RGCNs), to consider them. Let
be the number of relations. In regard to Twitter, relationships can include following/follower, tweet/retweet, replies/mentions, or any interaction. The updated node representation was modified to include the relations, as indicated in Equation (8):
where
represented the neighbors of node
with respect to relation
.
was the relation-independent weight matrix for the self-loop edges to include node
representation. This equation summed the nodes’ representations across all relations, to obtain the final nodes’ representations. As can be seen, RGCN—which was modeled using Equation (8)—did not consider the importance of the neighbors among the relations. We propose our framework, a multi-view graph attention network which was adopted from [
18], and combines both GAT and RGCN. The new model calculated the relation-wise attention coefficients for ranking the influence of the neighbors among different interactions (relationships). We simply modified Equation (8) to define the view-specific node representation as follows:
The relation-specific attention coefficient in Equation (9) was described by
. This time, the attention for the self-loop term was relation-specific. The reason for this was because every node had a different set of neighbors in each relation. The formula for calculating
is shown in Equation (10):
Finally, we aggregated the nodes’ representations across the different views by using a weighted sum with parameter
(number between 0 and 1). This differed from the approach used in [
18], as we did not want to add overhead to the training of the model. Additionally, because we had datasets with different types of relations (edges), we decided to combine them into two views only (
, where a view contained a set of the edges, and the rest were in the other view. This was done for each dataset. Thus, the aggregation across the views is shown in Equation (11):
where
were the two views (
. The model was trained by optimizing the loss function, using the Adam optimizer. We used the binary cross-entropy loss function, as we had only two classes (human and bot):
We considered only a portion of the labeled samples for calculating the training loss, as indicated by .
3.4. Transfer Learning (TL)
Transfer learning is one of the machine learning tools that leverage knowledge (features, weights, etc.) from previously trained models to train newer models. It aims to solve the issue of insufficient training data for a learning model [
40]. There are three categories of TL. Inductive transfer learning occurs when the labels are available only in the target domain, and are missing in the source. Both source and target tasks are related but different. Unsupervised transfer learning is another category of TL, in which no labels exist in both source and target domains. A transductive transfer learning technique is applied when source labels are available but target labels are missing [
41].
In our scenario, there were similarities between the source and target tasks, in that both were Twitter datasets. The difference was that the source dataset was built on friendship links (i.e., account A followed account B), while the target dataset was built on interaction links. In this setting, the source domain had a lot of labeled data, while the target domain had none. Therefore, we adopted the transductive TL in our work, as shown in
Figure 2. We trained our model using TwiBot-20 (source), which has different types of bots, to transfer as much knowledge as possible, so as to distinguish between bots and human classes in new data (target). We used this approach to make our model more generalized for bot detection, especially with the growth of sophisticated bots that are able to avoid being detected. The results of our model in
Section 5 emphasize that our model outperformed previous models, and that it had the ability to predict unlabeled data classes, successfully using the transfer learning approach.
4. Methodology
In this section, we provide details of the used datasets and preprocessing steps. We then discuss the selected features and environmental setup for the experiments. Then, we provide the required details of our proposed framework and parameter settings.
4.1. Data and Preprocessing
For our experiments, we used a recent benchmark dataset TwiBot20 [
42] that included samples from the Twittersphere to train our model. The authors of TwiBot-20 divided users into four interest domains: politics; business; entertainment; and sports. For each user, TwiBot-20 contains the tweets, profile properties, and neighborhood information of a Twitter user. This dataset includes 229,573 Twitter users, 33,488,192 tweets, and 455,958 following relationship links.
TwiBot20 includes 38 features for profile metadata. These features are called the user’s metadata, as they represent the profile information. We extracted 18 profile features in addition to the account label, either as a human user or bot, from three files, Train/Test/dev. These profile features are shown in
Table 2. The total number of labeled accounts that the three files had was 11,826. According to the data, 55.7% of the samples consisted of bot accounts, and 45.3% were human.
Figure 3 depicts the distribution classes of bots and humans in the TwiBot-20 data.
To test our model, we used two different hashtag datasets from NodeXL [
43,
44]. The first dataset was for a climate hashtag, “#actonclimate”, and we refer to it as “climate hashtag”. This dataset had a total of 5664 nodes and 15,651 edges. The second dataset was constructed based on the keywords “#IStandWithPutin” OR “#IStandWithRussia” OR “#StandWithRussia” OR “#NaziUkraine”. This dataset contains 4941 nodes, and 6944 links. We refer to this dataset as “Russian hashtag”. For both datasets, we extracted the profile features shown in
Table 2, in addition to the links of interaction to build the graphs for the attention mechanism.
Table 3 provides the summary statistics of the used datasets.
For data preprocessing, we deleted the IDs and lang features for better processing, as the lang value was null for all the records. We thus worked with 16 out of the 18 features in
Table 2. To avoid any encoding process, we tried to deal with features in terms of numerical value. Therefore, we considered the screen name length instead of the screen name character encoding. Furthermore, the Boolean and string features were converted to 0 and 1 to indicate the changing of default status. In addition, the created date string was used to calculate the account age in days. The labels in the account type represented humans with zero and bot accounts with one.
4.2. Selected Features
Many proposed works in the literature addressed feature selection to train learning models. However, the number of selected features varied from 1000 [
4] to much less [
3,
12]. In our experiments, we aimed to focus on using fewer features to enhance the efficiency and interpretability of our learning model. This will assure lower complexity costs when used in an online manner. In addition, recent studies [
12,
45,
46] have shown that profile features are predictive enough to detect social bots. Therefore, we used profile numerical features, and we considered the availability of a value for a certain feature such as description, to eliminate any encoding process. Thus, if a user filled in the description field or location, we considered this as 1; otherwise, it would be 0; we employed a similar treatment for a number of other features, so as to avoid any language processing costs. Our final selected features are shown in the last column in
Table 2.
4.3. Environmental Setup
In our work, all our experiments were undertaken on a workstation with a processor model Intel core i7-1087 = CPU with a RAM of 32 GB and NVIDIA GeForce RTX 3070 Max-Q GPU with 6 GB of VRAM. All the machine-learning models were built using python Scikit-learn library. All the graph-learning models were implemented using PyTorch geometric (PyG) (
https://pytorch-geometric.readthedocs.io/en/latest/index.html accessed on 1 September 2021).
4.4. Proposed Framework
Our proposed framework model architecture utilized the transfer learning approach, as
Figure 4 demonstrates. In this framework, there are two learning phases. The first phase is called “Source Training Phase”. The model is trained to use multi-view graph attention networks on a partially labeled dataset. Once the model is trained, phase two starts. This phase is called “Target Training Phase”. In this phase, another dataset, that is totally unlabeled, is tested, to predict the classes for data points using the trained model from the first phase. The output of this phase is labels for the new data that are unlabeled. Consequently, an evaluation process takes place to evaluate the output predictions, after applying a machine-learning classifier to ensure that the model can distinguish between classes.
Accordingly, we used TwiBot-20 as the input for the source domain model. We extracted the features into multi-view perspectives. These views can provide a different view of the data, for example (following, followers, mentions...etc.). In our case, as
Figure 5 depicts, we used the edges’ views that represented the following links (i.e., friendship) and interaction graphs. We implemented a linear layer to transform the input features into sufficient higher-level expressive representation for every node, as shown in
Section 3.2. An importance weight was calculated using the attention mechanism for every node and its neighboring nodes. We applied an activation function (LeakyReLU) to maintain nonlinearity. We used only one message-passing layer in each view, to avoid over-smoothing, which could occur when we had cascaded message-passing layers. This was because it would result in nodes with the same representations, and this would make the classification process more difficult.
We used a weighted sum with parameter
to aggregate the representations from the different views of our graph. Although this parameter can be learnable through a linear layer or an attention layer, we decided to use a fixed value to reduce the complexity of the model. In
Table 4, we present Bot-MGAT’s parameters.
Once the model was trained on TwiBot-20, we transferred the learning by utilizing the model with target data, namely unlabeled “climate hashtag”. We applied the same steps for preprocessing and feature selection. Then, we applied the MGAT model to predict the label for every node in the target data. Once we obtained the labels, we evaluated the labeling process using a machine-learning classifier. We chose random forest (RF), as it performs well in this classification problem, as shown in different studies [
12,
47].
We used the “Russian hashtag” dataset, which was not used in the training or testing phases, to validate our model. We applied the same steps and model to verify our results. We evaluated our model using three different evaluation metrics: accuracy, F1 score, and MCC. The accuracy aimed to evaluate the model correctness. The F1 score and Matthews correlation coefficient (MCC) were used as more balanced evaluation metrics for the binary classification task. Bot-MGAT’s performance is shown in
Section 5. We summarized the steps in Algorithm 1.
| Algorithm 1 Bot-MGAT with TL
|
| Input: |
|
| Output: | |
| Train Phase: |
| 1. | |
| 2. | : |
| 3. | : |
| 4. | using Equations (1) and (9)–(11) |
| 5. | End For |
| 6. | using Equation (12) |
| 7. | |
| 8. | Update the parameters through back propagation |
| 9. | |
| 10. | |
| 11. | End For |
| 12. | |
| Prediction Phase: |
| 13. | : |
| 14. | |
| 15. | End For |
| 16. | |
| 17. | Record performance |
5. Results
In this section, we discuss the performance results of Bot-MGAT in two states: with and without the TL approach. We highlight the performance by addressing evaluation metrics such as accuracy, MCC, and F1. We compare our performance to baselines, including works that addressed the bot detection problem.
5.1. Bot-MGAT without TL
As an initial step, we used TwiBot-20 to train and test Bot-MGAT without the TL phase. We used the profile features mentioned in
Section 4.2. We compared our model with other graph neural networks models, namely GCN, GAT, and RGCN, as shown in
Table 5. We chose these models as they were close to our model’s implementation, and remained in the domain of GNN. For example, RGCN is an application of a relational graph convolutional network for link prediction and classification. We tested a simple GCN, to find the difference between the base model and the RGCN model. Based on the results, RGCN performed better than GCN, and (0.01) better than GAT. This highlighted the reported performance in the literature of RGCN [
20]. For GAT, a single attention graph network was applied, with a single view of the dataset. We applied cross validation (10 folds) for all models, to ensure confidence that there was no over-fitting issue in the trained models.
Bot-MGAT without TL outperformed the other GNN models slightly, with an accuracy score of 80.98%, an F1 score of 0.8485, and an MCC of 0.6491. This indicated that there was scope for improvement in Bot-MGAT with TL. In addition, GAT and RGCN both showed similar performance to Bot-MGAT in terms of accuracy and F1 scores: they achieved a score of 79.62% and 80.69%, respectively, for accuracy, and 0.8399 and 0.8470, respectively, for F1. This highlighted the hidden information that attention mechanism models aim to reveal.
5.2. Bot-MGAT with TL
Our objective was to use node representations to predict the label of a given node by applying the attention mechanism with a multi-view of trained data. As an initial step, we used an available tool [
48] to label both datasets “climate hashtag” and “Russian hashtag”, using Botometer API (
https://botometer.osome.iu.edu/ accessed on 12 May 2022). This tool has been used in the literature [
49,
50]. The labeling process used a complete automation probability (CAP) score, with a threshold of 75%, in order to determine that the account label was a bot if it was higher than the threshold. After the labeling process was completed, we applied cross-validation (10 folds) and the random forest (RF) classifier to the climate hashtag and Russian hashtag, as shown in
Table 6. We chose RF, as mentioned previously; it performed well with the bot detection problem.
The labeling results in
Table 6, after using Botometer, show that the Russian hashtag results were convenient and better, compared to the climate hashtag. This was due to the issue of imbalance that is common in this problem. In the Russian hashtag, there were 2807 accounts labeled as bots out of the total; for the climate hashtag, there were fewer accounts labeled as bots. The results, compared to TwiBot-20, were obviously poor and average, in terms of F1 score. Twibot-20 was able to maintain a good F1 score of 0.8371 among both hashtags. This was due to the sophisticated bots’ design, in order to avoid being detected [
7]. Therefore, TL was useful in our case, especially as both the source and target datasets were Twitter data, and they had a similar task: the detection of bots.
Consequently, we trained Bot-MGAT with TwiBot-20, as it was a recent diverse dataset that was available for experimentation. In addition, it covered different domains of both humans and bots, which increased the probability of detecting different types of bot account when tested on a specific domain. After the training phase, we tested the model, using the climate hashtag dataset.
Table 7 shows the results of our framework comparison using TL compared to not using TL.
Bot-MGAT with TL, using the Twibot-20 and climate hashtag datasets, outperformed the results of the other models, with a 15% improvement in accuracy, a 13% increase in F1 score, and an 18% increase in MCC. This indicated the ability of our model to distinguish the properties of each view of data with a completely unseen dataset used for testing. This showed the efficiency and flexibility of GAT-based models that outperformed in the literature [
18,
37,
51,
52].
We used the Russian hashtag dataset, which was not used in training or testing, to validate our model. We applied the same experiment that we performed with the climate hashtag dataset. The results are shown in
Table 7. It outperformed the model without TL, demonstrating a score of 0.9780 for accuracy, 0.9842 for F1 score, and 0.9481 for MCC. This emphasized the effectiveness of TL in the bot detection problem. This incorporated the fact that GAT models are capable of obtaining hidden representations of each node in the graph, using self-attention and neighboring nodes embedding for the classification task.
Figure 6 provides the results for BotMGAT with TL receiver operating characteristics (ROC) and area under the receiver operating characteristic curve (AUC) for Twibot20, the climate hashtag, and the Russian hashtag. The reason for the high AUC (0.98) in the Russian hashtag was the number of bots involved. Unlike TwiBot-20 (AUC = 0.79), which was created based on the different interests of the users, and the climate dataset (AUC = 0.84), which was created based on the influence of the climate change hashtag, it seems that modern bots mostly interact with political topics.
5.3. Comparison with Baselines
Table 8 shows that the performance of our model, Bot-MGAT with TL, outperformed other baseline works that aimed to detect social bots in Twitter. In BotRGCN [
20], the proposed framework encoded different types of features (description, profile, tweet) into numeric features, to avoid feature engineering, to construct a heterogeneous graph of different types of edges between users in Twitter. The strength of this approach is that it focused on the following links of the graph to detect bots accounts. However, a recent study [
53] found that bot accounts show a lower number of followers and friends with respect to humans. This contrasted with the fact that early generations of bots had a higher ratio of following rate [
35]. In [
21], an inductive representation learning was proposed, using GCNN to detect spam bots on Twitter. They used the same approach proposed by [
54,
55] to learn the embedding for nodes in the graph structure, using a neural network and propagation methods. They tested their model using early bot datasets that included fake accounts that proved to be easier to detect and distinguish from recent bots.
Bot-MGAT with TL outperformed other models because the graph attention mechanism with multi-view was able to reveal the hidden representations of nodes. Additionally, TL was the key player in enhancing the model, as shown in
Table 8; using a training dataset that is recent, and rich in different domains of samples of bots, made it reliable to detect bot accounts in a specific domain (for example, a hashtag). It is clear, therefore, that semi-supervised graph neural network models with profile features can predict bot accounts with good performance.
6. Conclusions
The evolving nature of recent bot accounts makes bot detection a challenging task. Using traditional techniques has proved to perform poorly with new bot generations. In this paper, we propose the Bot-MGAT framework with a transfer learning approach based on the attention mechanism. The results show that our model outperformed other GNN models and baseline work, with an accuracy of 97.80%, an F1 score of 0.9842, and an MCC score of 0.9481. We evaluated our model using two different datasets that were not used in the training phase, and the results were the best reported.
Bot-MGAT with TL outperformed other models because the graph attention mechanism with multi-view was able to reveal the hidden representations of nodes. The results showed that our model was able to identify bot class very effectively, using profile features only, and the implementation of TL with a multi-view approach. In addition, this should reduce the effort and the tedious process of manual labeling, and highlight the sophisticated design of recent social bots that are able to avoid detection. For future work, we will test our model using additional views for graphs, and different parameters for the model.
Author Contributions
Conceptualization, E.A. and H.A.; Data curation, E.A. and M.S.; Formal analysis, E.A. and M.S.; Methodology, E.A.; Project administration, H.A.; Software, E.A. and M.S.; Supervision, H.A.; Validation, K.H. and H.A.; Visualization, E.A.; Writing—original draft, E.A.; Writing—review and editing, M.S., K.H. and H.A. All authors have read and agreed to the published version of the manuscript.
Funding
This research received no external funding.
Data Availability Statement
We used public datasets for our experiments, as cited in
Section 4.1, and have provided a reference to them in the list of references.
Conflicts of Interest
The authors declare no conflict of interest.
References
- Davis, C.A.; Varol, O.; Ferrara, E.; Flammini, A.; Menczer, F. Botornot: A system to evaluate social bots. In Proceedings of the 25th International Conference Companion on World Wide Web, Montreal, QC, Canada, 11–15 April 2016; pp. 273–274. [Google Scholar]
- Cresci, S.; Di Pietro, R.; Petrocchi, M.; Spognardi, A.; Tesconi, M. The paradigm-shift of social spambots: Evidence, theories, and tools for the arms race. In Proceedings of the 26th International World Wide Web Conference 2017, WWW 2017 Companion, Geneva, Switzerland, 3–7 April 2017; pp. 963–972. [Google Scholar]
- Kudugunta, S.; Ferrara, E. Deep neural networks for bot detection. Inf. Sci. 2018, 467, 312–322. [Google Scholar] [CrossRef]
- Varol, O.; Ferrara, E.; Davis, C.; Menczer, F.; Flammini, A. Online human-bot interactions: Detection, estimation, and characterization. In Proceedings of the International AAAI Conference on Web and Social Media, ICWSM 2017, Atlanta, GA, USA, 6–9 June 2017; pp. 280–289. [Google Scholar]
- Antenore, M.; Camacho-Rodriguez, J.M.; Panizzi, E. A comparative study of Bot Detection techniques methods with an application related to COVID-19 discourse on twitter. arXiv 2021, arXiv:2102.01148. [Google Scholar]
- Orabi, M.; Mouheb, D.; Al Aghbari, Z.; Kamel, I. Detection of Bots in Social Media: A Systematic Review. Inf. Process. Manag. 2020, 57, 102250. [Google Scholar] [CrossRef]
- Cresci, S. A decade of social bot detection. Commun. ACM 2020, 63, 72–83. [Google Scholar] [CrossRef]
- Latah, M. Detection of malicious social bots: A survey and a refined taxonomy. Expert Syst. Appl. 2020, 151, 113383. [Google Scholar] [CrossRef]
- Cresci, S.; Di Pietro, R.; Petrocchi, M.; Spognardi, A.; Tesconi, M. Social Fingerprinting: Detection of Spambot Groups Through DNA-Inspired Behavioral Modeling. IEEE Trans. Dependable Secur. Comput. 2018, 15, 561–576. [Google Scholar] [CrossRef]
- Teljstedt, C.; Rosell, M.; Johansson, F. A Semi-automatic Approach for Labeling Large Amounts of Automated and Non-automated Social Media User Accounts. In Proceedings of the 2nd European Network Intelligence Conference, ENIC 2015, Karlskrona, Sweden, 21–22 September 2015; pp. 155–159. [Google Scholar]
- van Engelen, J.E.; Hoos, H.H. A survey on semi-supervised learning. Mach. Learn. 2020, 109, 373–440. [Google Scholar] [CrossRef]
- Alothali, E.; Hayawi, K.; Alashwal, H. Hybrid feature selection approach to identify optimal features of profile metadata to detect social bots in Twitter. Soc. Netw. Anal. Min. 2021, 11, 84. [Google Scholar] [CrossRef]
- Xia, F.; Sun, K.; Yu, S.; Aziz, A.; Wan, L.; Pan, S.; Liu, H. Graph Learning: A Survey. arXiv 2021, arXiv:210500696. [Google Scholar] [CrossRef]
- Zhang, Z.; Peng, C.; Wenwu, Z. Deep learning on graphs: A survey. IEEE Trans. Knowl. Data Eng. 2020, 34, 249–270. [Google Scholar] [CrossRef]
- Wu, Z.; Pan, S.; Chen, F.; Long, G.; Zhang, C.; Philip, S.Y. A comprehensive survey on graph neural networks. IEEE Trans. Neural Netw. Learn. Syst. 2020, 32, 4–24. [Google Scholar] [CrossRef] [PubMed]
- Kipf, T.N.; Welling, M. Semi-supervised classification with graph convolutional networks. arXiv 2016, arXiv:160902907. [Google Scholar]
- Thekumparampil, K.K.; Wang, C.; Oh, S.; Li, L.J. Attention-based graph neural network for semi-supervised learning. arXiv 2018, arXiv:180303735. [Google Scholar]
- Xie, Y.; Zhang, Y.; Gong, M.; Tang, Z.; Han, C. MGAT: Multi-view graph attention networks. Neural Netw. 2020, 132, 180–189. [Google Scholar] [CrossRef]
- Cui, W.; Du, J.; Wang, D.; Kou, F.; Xue, Z. MVGAN: Multi-view graph attention network for social event detection. ACM Trans. Intell. Syst. Technol. 2021, 12, 1–24. [Google Scholar] [CrossRef]
- Feng, S.; Wan, H.; Wang, N.; Luo, M. BotRGCN: Twitter Bot Detection with Relational Graph Convolutional Networks. arXiv 2021, arXiv:210613092. [Google Scholar]
- Ali Alhosseini, S.; Bin Tareaf, R.; Najafi, P.; Meinel, C. Detect me if you can: Spam bot detection using inductive representation learning. In Proceedings of the 2019 World Wide Web Conference, San Francisco, CA, USA, 13–17 May 2019; pp. 148–153. [Google Scholar]
- Alothali, E.; Zaki, N.; Mohamed, E.A.; Alashwal, H. Detecting Social Bots on Twitter: A Literature Review. In Proceedings of the 2018 International Conference on Innovations in Information Technology (IIT), Al Ain, United Arab Emirates, 18–19 November 2018; pp. 175–180. [Google Scholar]
- Najari, S.; Salehi, M.; Farahbakhsh, R. GANBOT: A GAN-based framework for social bot detection. Soc. Netw. Anal. Min. 2022, 12, 4. [Google Scholar] [CrossRef]
- Feng, S.; Wan, H.; Wang, N.; Li, J.; Luo, M. SATAR: A Self-supervised Approach to Twitter Account Representation Learning and its Application in Bot Detection. arXiv 2021, arXiv:2106.13089. Available online: https://arxiv.org/abs/2106.13089 (accessed on 21 September 2021).
- Yang, K.; Varol, O.; Davis, C.A.; Ferrara, E.; Flammini, A.; Menczer, F. Arming the public with artificial intelligence to counter social bots. Hum. Behav. Emerg. Technol. 2019, 1, 48–61. [Google Scholar] [CrossRef]
- Albadi, N.; Kurdi, M.; Mishra, S. Hateful People or Hateful Bots? Detection and Characterization of Bots Spreading Religious Hatred in Arabic Social Media. arXiv 2019, arXiv:190800153. [Google Scholar]
- Botometer. Datasets. 2020. Available online: https://botometer.osome.iu.edu/bot-repository/datasets.html (accessed on 2 July 2021).
- Nazer, T.H.; Davis, M.; Karami, M.; Akoglu, L.; Koelle, D.; Liu, H. Bot detection: Will focusing on recall cause overall performance deterioration? In Lecture Notes in Computer Science (Including Subseries Lecture Notes in Artificial Intelligence and Lecture Notes in Bioinformatics); Springer: Cham, Switzerland, 2019; pp. 39–49. [Google Scholar] [CrossRef]
- Rizoiu, M.A.; Graham, T.; Zhang, R.; Zhang, Y.; Ackland, R.; Xie, L. DEBATENIGHT: The role and influence of socialbots on twitter during the first 2016 U.S. presidential debate. In Proceedings of the 12th International AAAI Conference on Web and Social Media, ICWSM 2018, Palo Alto, CA, USA, 25–28 June 2018; pp. 300–309. [Google Scholar]
- Mehrotra, A.; Sarreddy, M.; Singh, S. Detection of fake Twitter followers using graph centrality measures. In Proceedings of the Contemporary Computing and Informatics (IC3I), 2016 2nd International Conference, Greater Noida, India, 14–17 December 2016; pp. 499–504. [Google Scholar]
- Grover, P.; Kar, A.K.; Dwivedi, Y.K.; Janssen, M. Polarization and acculturation in US Election 2016 outcomes—Can twitter analytics predict changes in voting preferences. Technol. Forecast. Soc. Chang. 2019, 145, 438–460. [Google Scholar] [CrossRef]
- Jia, J.; Wang, B.; Gong, N.Z. Random Walk Based Fake Account Detection in Online Social Networks. In Proceedings of the Dependable Systems and Networks (DSN), 2017 47th Annual IEEE/IFIP International Conference, Denver, CO, USA, 26–29 June 2017; pp. 273–284. [Google Scholar]
- Alarifi, A.; Alsaleh, M.; Al-Salman, A. Twitter turing test: Identifying social machines. Inf. Sci. 2016, 372, 332–346. [Google Scholar] [CrossRef]
- Gilani, Z.; Farahbakhsh, R.; Tyson, G.; Crowcroft, J. A Large-scale Behavioural Analysis of Bots and Humans on Twitter. ACM Trans. Web 2019, 13, 1–23. [Google Scholar] [CrossRef]
- Gilani, Z.; Kochmar, E.; Crowcroft, J. Classification of twitter accounts into automated agents and human users. In Proceedings of the 2017 IEEE/ACM International Conference on Advances in Social Networks Analysis and Mining 2017, Sydney, Australia, 31 July–3 August 2017; pp. 489–496. [Google Scholar]
- Chu, Z.; Gianvecchio, S.; Wang, H.; Jajodia, S. Who is tweeting on twitter: Human, bot, or cyborg? In Proceedings of the Annual Computer Security Applications Conference, ACSAC, Austin, TX, USA, 6–10 December 2010; pp. 21–30. [Google Scholar]
- Veličković, P.; Cucurull, G.; Casanova, A.; Romero, A.; Liò, P.; Bengio, Y. Graph attention networks. arXiv 2017, arXiv:171010903. [Google Scholar]
- Brody, S.; Alon, U.; Yahav, E. How attentive are graph attention networks? arXiv 2021, arXiv:210514491. [Google Scholar]
- Schlichtkrull, M.; Kipf, T.N.; Bloem, P.; Van Den Berg, R.; Titov, I.; Welling, M. Modeling relational data with graph convolutional networks. In European Semantic Web Conference; Springer: Berlin/Heidelberg, Germany, 2018; pp. 593–607. [Google Scholar]
- Tan, C.; Sun, F.; Kong, T.; Zhang, W.; Yang, C.; Liu, C. A survey on deep transfer learning. In Lecture Notes in Computer Science (Including Subseries Lecture Notes in Artificial Intelligence and Lecture Notes in Bioinformatics); Springer: Cham, Switzerland, 2018; pp. 270–279. [Google Scholar]
- Pan, S.J. Transfer learning. In Data Classification: Algorithms and Applications; Springer: Cham, Switzerland, 2014; Volume 21, pp. 537–570. [Google Scholar] [CrossRef]
- Feng, S.; Wan, H.; Wang, N.; Li, J.; Luo, M. TwiBot-20: A Comprehensive Twitter Bot Detection Benchmark. In Proceedings of the 30th ACM International Conference on Information & Knowledge Management, Gold Coast, QLD, Australia, 1–5 November 2021; pp. 4485–4494. [Google Scholar]
- Socialmedia Research Foundation. NodeXLgraph Gallery (#actonclimate). Available online: https://nodexlgraphgallery.org/Pages/Graph.aspx?graphID=274361 (accessed on 15 April 2022).
- Socialmedia Research Foundation. NodeXLgraphGallery (#IStandWithPutin OR #IStandWithRussia...). Available online: https://nodexlgraphgallery.org/Pages/Graph.aspx?graphID=275885 (accessed on 10 May 2022).
- Hayawi, K.; Mathew, S.; Venugopal, N.; Masud, M.M.; Ho, P.-H. DeeProBot: A hybrid deep neural network model for social bot detection based on user profile data. Soc. Netw. Anal. Min. 2022, 12, 43. [Google Scholar] [CrossRef] [PubMed]
- Mendoza, M.; Tesconi, M.; Cresci, S. Bots in Social and Interaction Networks. ACM Trans. Inf. Syst. 2021, 39, 1–32. [Google Scholar] [CrossRef]
- Yang, K.-C.; Varol, O.; Hui, P.-M.; Menczer, F. Scalable and Generalizable Social Bot Detection through Data Selection. Proc. AAAI Conf. Artif. Intell. 2020, 34, 1096–1103. [Google Scholar] [CrossRef]
- Yang, K.-C.; Ferrara, E.; Menczer, F. Botometer 101: Social bot practicum for computational social scientists. arXiv 2022, arXiv:220101608. [Google Scholar]
- Martini, F.; Samula, P.; Keller, T.R.; Klinger, U. Bot, or not? Comparing three methods for detecting social bots in five political discourses. Big Data Soc. 2021, 8, 20539517211033570. [Google Scholar] [CrossRef]
- Aldayel, A.; Magdy, W. Characterizing the role of bots’ in polarized stance on social media. Soc. Netw. Anal. Min. 2022, 12, 1–24. [Google Scholar] [CrossRef] [PubMed]
- Huang, Q.; Yu, J.; Wu, J.; Wang, B. Heterogeneous Graph Attention Networks for Early Detection of Rumors on Twitter. In Proceedings of the 2020 International Joint Conference on Neural Networks (IJCNN), Glasgow, UK, 28 September 2020; pp. 1–8. [Google Scholar]
- Ran, H.; Jia, C.; Zhang, P.; Li, X. MGAT-ESM: Multi-channel graph attention neural network with event-sharing module for rumor detection. Inf. Sci. 2022, 592, 402–416. [Google Scholar] [CrossRef]
- Tardelli, S.; Avvenuti, M.; Tesconi, M.; Cresci, S. Characterizing social bots spreading financial disinformation. In International Conference on Human–Computer Interaction; Springer: Berlin/Heidelberg, Germany, 2020; pp. 376–392. [Google Scholar]
- Hamilton, W.L.; Ying, R.; Leskovec, J. Representation Learning on Graphs: Methods and Applications. arXiv 2017, arXiv:1709.05584. [Google Scholar]
- Hamilton, W.L.; Ying, R.; Leskovec, J. Inductive representation learning on large graphs. In Proceedings of the 31st International Conference on Neural Information Processing Systems, Long Beach, CA, USA, 4–9 December 2017; pp. 1025–1035. [Google Scholar]
- Yang, C.; Harkreader, R.; Gu, G. Empirical evaluation and new design for fighting evolving twitter spammers. IEEE Trans. Inf. Forensics Secur. 2013, 8, 1280–1293. [Google Scholar] [CrossRef]
| Publisher’s Note: MDPI stays neutral with regard to jurisdictional claims in published maps and institutional affiliations. |
© 2022 by the authors. Licensee MDPI, Basel, Switzerland. This article is an open access article distributed under the terms and conditions of the Creative Commons Attribution (CC BY) license (https://creativecommons.org/licenses/by/4.0/).


