Article

Pathological Voice Detection Using Joint Subsapce Transfer Learning

School of Optoelectronic Science and Engineering, Soochow University, Suzhou 215000, China
*
Authors to whom correspondence should be addressed.
Appl. Sci. 2022, 12(16), 8129; https://doi.org/10.3390/app12168129
Submission received: 18 July 2022 / Revised: 8 August 2022 / Accepted: 9 August 2022 / Published: 14 August 2022

Abstract

:
A pathological voice detection system is designed to detect pathological characteristics of vocal cords from speech. Such systems are particularly susceptible to domain mismatch where the training and testing data come from the source and target domains, respectively. Due to the difference in speech disease etiology, recording environment, and device, etc., the feature distributions of source and target domain are quite different. Meanwhile, considering the high costs of annotating labels, it is hard to acquire labeled data in the target domain. This paper attempts to formulate cross-domain pathological voice detection as an unsupervised domain adaptation problem. Joint subspace transfer learning (JSTL) aims to find a projection matrix to transform source and target domain data into a common space. The maximum mean discrepancy function is used to measure the divergence across databases. Intra-class and inter-class distance act as regularization to guarantee the maximum separability between different classes. A graph matrix is constructed to help transfer knowledge from the relevant source data to the target data. Three popular pathological voice databases were selected in this paper. For six cross-database experiments, the accuracy of the method proposed increased by up to 15%. For different voice categories, the category of structural voice showed the most significant increase, nearly 20%.

1. Introduction

Voice, as the most effective method of communication, is crucial to people’s daily life. However, according to statistics, about 3–9% of people around the world have voice problems [1] due to the deterioration of air quality, overuse of voice, and so on. Therefore, more importance should be attached to the early diagnosis of vocal fold diseases.
Over the past few decades, a number of machine learning methods have been proposed in the field of pathological voice detection and classification, such as support vector machine (SVM) [2,3], hidden Markov model (HMM) [4], Gaussian mixture model (GMM) [5], Artificial Neural Network (ANN) [6], and so on. Meanwhile, by the method of combining signal processing and machine learning, pathological voice detection and classification has achieved encouraging results. Sudarsana et al. [7] combined glottal source features with Mel Frequency Cepstral Coefficients (MFCCs) and achieved a recognition rate of 74.32% in SVD. Wu [8] believed that the glottal wave could better reflect the characteristics of the vocal cords than ordinary speech signals. Therefore, the features were extracted from glottal waves and combined with MPEG-7 features. The method finally achieved a recognition rate of 88.52% in SVD. Zhou et al. [9] proposed gammatone spectral latitude (GTSL) features, which could use a gammatone filter to simulate the auditory perception of the human ear. Finally, this feature achieved an average accuracy of 99.6%, 89.9%, and 97.4% in MEEI, SVD and HUPA databases, respectively. However, all this research has made a common assumption: the source data and target data are from the same database, in other words, the data from the source and target domain have the same distribution [10]. When the distribution changes, the recognition rate tends to drop [11]. Furthermore, in application, the change in distribution means the rebuild of the machine learning model, which is expensive and does not scale. Another fact is that the scales of the pathological voice database are usually small due to the expense of manual labeling. According to a survey [12], there are mainly three pathological voice databases used by researchers. Although the voice samples chosen from the databases are mostly sustained vowels /a/, the sharing of the available databases also suffers from a number of factors, such as different sampling frequencies, voice loudness, sex [13], types of recording situations, and so on.
In contrast with traditional machine learning methods, transfer learning methods allow the source domain and target domain to have different distributions [14]. The aim of transfer learning is to eliminate the divergence among databases by feature transformation. Meanwhile, transfer learning has achieved great success in cross-domain recognition and classification problems, such as semantic segmentation [15], natural language processing [16], automatic speech recognition [17], and so on. Furthermore, various transfer learning methods have been proposed to deal with the mismatch between the source and target domain. From the point of geometric feature transformation method, Fernando [18] proposed a subspace alignment (SA) method. This method aimed to find a linear transformation matrix, which aligned the source subspace with the target one. Subspace distribution alignment (SDA) [19] was proposed, which was combined with conditional distribution adaptation based on subspace alignment. Different from SA and SDA, which only focus on the first-order statistics of the source and target distributions, CORrelation Alignment [20] minimizes the domain shift by aligning the second-order statistics of the source and target distributions. In [21], Yan proposed weighted MMD and applied weighted MMD to the neural network. Zong et al. [22,23] proposed a new transfer learning method to reduce the marginal distribution across domains by constructing a least squares regression model. Recently, Song et al. [24] used nonnegative matrix factorization to select features from voice. In their research, the maximum mean discrepancy (MMD) [25] was used to compute the difference between the source and target domain. Taking the MMD as the regular term, the resulting mapping matrix can further eliminate the difference between the source domain and target domain while selecting features. More recently, Song [26] proposed a new feature selection method called FSTSL [26]. In FSTSL, MMD acted as regular term, and the PCA was used to reduce feature dimension. On the basis of Song, Chen [27] utilized MMD as the global difference, and Graph Embedding (GE) was used as the local difference to quantify the difference between the source and target domain. However, these methods all only used MMD as a regularization term, and only marginal feature distributions were considered, ignoring conditional feature distributions.
The method proposed in this paper is named joint subspace transfer learning (JSTL). Discriminative MMD and graph embedding are both taken into account to act as regularization. However, compared with DSTL, which only focuses on marginal distribution, conditional distribution is also considered in the proposed method. First, the maximum mean discrepancy was constructed on the source and target domain to measure the divergence across databases and predict the pseudo labels of the target data, then inter-class and intra-class distance acted as regularization to ensure the feature separability. Furthermore, graph embedding also acted as a regularization to reduce the divergence between the source and target domain and preserve the local structural consistencies over labels. By minimizing the divergence across databases, a feature mapping matrix was calculated to transform the source and target domain into a common subspace domain. Then, two close low-dimensional feature spaces were obtained for the source and target database, respectively. Finally, a traditional machine learning classifier was trained on the labeled source database and applied to an unlabeled target database for pathological voice detection and classification. To summarize, the main contributions of our work are as follows:
  • A new cross-corpus pathological voice recognition framework is proposed in this paper. Our method effectively eliminates the discrepancy between the source domain and the target domain to increase the recognition rate of cross-corpus pathological voice experiments.
  • The aim of the JSTL is to find a projection matrix, which transforms the source domain samples and target domain samples into a common space. The MMD is used to quantify the distance between the source and target domains. Graph embedding and interclass and intraclass distance are used as regular terms. The experimental results show that in the case of regular term constraints, the mapped features have better separability.
  • Compared to other methods that do not account for differences in conditional distributions, pseudo labels are used to construct the MMD matrix and graph embedding matrix.

2. Methods

In this section, the maximum mean discrepancy is introduced to measure the divergence across databases. Then, intra-class distance and inter-class distance act as regularization to guarantee the maximum separability of features. Finally, we use true and pseudo labels to construct a graph to keep the local structural consistencies on labels. Figure 1 illustrates the flowchart of the proposed approach. The parameters used in this paper are listed in Table 1.

2.1. Maximum Mean Discrepancy

Firstly, the MMD was employed as the discrepancy metric. The aim of the MMD [25] was to map the samples in the source and target domains into a Reproducing Kernel Hilbert Space (RKHS) [28]. Then, we calculated the mean difference between the source and target domains in the RKHS to measure the similarity of different data sets. The smaller the gap, the more similar the distribution; the larger the gap, the greater the difference in distribution. The MMD can be written as follows    
D x s , x t = 1 n s i = 1 n s P T x i 1 n t j = n s + 1 n s + n t P T x j = P T 1 n s 2 X s I s I s T X s T 1 n s n t X s I s I t T X t T + 1 n t n s X t I t I s T X s T 1 n t 2 X t I t I t T X t T P = tr P T X M 0 X T P
where M 0 is the MMD matrix, which can be written as
M 0 i j = 1 n s 2 x i , x j D s 1 n t 2 x i , x j D t 1 n s n t otherwise
Although the MMD can eliminate the divergence in marginal distribution across domains, the difference of the conditional distribution cannot be reduced well. In real research, conditional distribution matters. Therefore, similar to the JDA [29] method, when computing conditional distribution adaptation, the label of the target data is unknown. The solution is to train a set of classifiers on the source data, then apply the classifier to the target data to obtain the labels of the target data. Then, the true and pseudo labels of the data are employed to calculate the conditional distribution. Here, the MMD is modified to measure the class-conditional distributions:
D x s , x t = 1 n s c x i X s c P T x i 1 n t c x j X t c P T x j = tr P T X M c X T P
where n s c and n t c represent the number of samples in the source and target data which pertain to c class, respectively. X s c and X t c are the feature set which pertain to c class in the source and target domains, respectively. M c is the MMD matrix, which can be written as
M c i j = 1 n c 2 , x i , x j D s ( c ) 1 m c 2 , x i , x j D t ( c ) 1 m c n c , x i D s ( c ) , x j D t ( c ) x i D t ( c ) , x j D s ( c ) 0 , otherwise

2.2. Intra-Class Distance and Inter-Class Distance

In order to separate the various classes alongside the domain transfer, inter-class distance and intra-class distance are employed as regularization in the MMD function.
Suppose data set D s = x 1 , y 1 , x 2 , y 2 , , x m , y m , where sample x i is an n-dimensional vector, and y i { 0 , 1 , , c } . N c is defined as the number of samples of class c. μ c and c are defined as the mean and covariance matrix of class c, respectively.
Assume that the central point projections of different categories are A T μ c . The distance between category centers of different categories of data should be as large as possible. In another word, we should maximize the inter-class divergence matrix. Meanwhile, it is expected that the projection points of the same kind of data should be as close as possible, that is, the covariance of the projection points of the same sample A T Σ c should be as small as possible. In other words, we should minimize the intra-class divergence matrix. The intra-class divergence matrix S w and inter-class divergence matrix S b can be written as follows, respectively,
S w = c C x i D s t x i μ c T x i μ c
S w = c C N c μ μ c T μ μ c
Here, we formulate the optimization problem:
min A tr A T S w A tr A T S b A
In combination with the other part, the final optimization function can be written as
min c = 0 c t r A T X M c X T + λ ( S w     S b ) + I A + A F 2

2.3. Graph Embedding

GE [30] is used as a distribution difference constraint to measure the difference between domains by maintaining a similar relationship between samples in the neighborhood. x i can be linearly represented by its neighborhood samples x j , x k , and x l , which can be shown as follows
x i = w i j x j + w i k x k + w i l x 1
We give greater weight to the points with high similarity w i j . To retain the structure information of the data, the graph embedding method treats each sample vector as a vertex. By calculating the distance between the points, the neighboring points are assigned higher weights, and the non-adjacent points are assigned lower weights. Finally, a similarity matrix W describes the geometric characteristics of the data.
In order to keep the local structural consistencies on labels, true and pseudo labels are used to structure the graph. We introduce inter-database similarity matrices W s t and W s t . It is assumed that if x i s and x j t pertain to the same class, and x i s , x j t are the k nearest neighbors of x j t and x i s , respectively. Then, x i s and x j t can be seen as similar. Furthermore, intra-database similarity matrices W s s and W t t are also introduced to describe the neighbor similarity across database.
W i j s t = exp x i s x j t 2 2 σ 2 x i s N k x j t or x j t N k x i s x i s , x j t belong to the same class 0 otherwise
W i j t s = exp x j t x i s 2 2 σ 2 x j t N k x i s or x i s N k x j t x j t , x i s belong to the same class 0 otherwise
W i j s s = exp x j t x i s 2 2 σ 2 x j s N k x i s or x i s N k x j s x j s , x i s belong to the same class 0 otherwise
W i j t t = exp x j t x i t 2 2 σ 2 x j t N k x i t or x i t N k x j t x j t , x i t belong to the same class 0 otherwise
Then, W s t , W t s , W s s , and W t t are combined to construct a new matrix W:
W = W s s W s t W t s W t t
Each element of W represents the similarity between the samples. Finally, the objective function of graph embedding is expressed as
G ( K ) = 1 2 i . j = 1 N x i x j 2 w i j = 1 2 i = 1 N x i 2 j = 1 N w i j + j = 1 N x i 2 i = 1 N w i j 2 i = 1 N j = 1 N x i x j w i j = i = 1 N x i 2 D i i i = 1 N j = 1 N x i x j w i j = tr P T X L X T P
where L is a Laplacian matrix, which can be expressed as L = D W , and D is a diagonal matrix whose entries are the column sums of W. In combination with the other part, the final optimization function can be written as
min c = 0 c tr A T X M c + μ L X T + λ ( S w     S b ) + I A + A F 2
Then, the Lagrange multiplier method is employed to further optimize this formula
L = tr A T X c = 0 C W c + μ L X T + λ ( S w     S b ) + I A + tr I A T X H X T A ϕ
Considering d L d A = 0 , the generalized eigen decomposition is achieved as follows:
X c = 0 C W c + μ L X T + λ ( S w     S b ) + I A = X H X T A ϕ
By solving this equation, we obtain a mapping matrix A, which acts on the source and target domains. Then, two close low-dimensional feature spaces are obtained for the source and target database, respectively. Finally, a traditional machine learning classifier is trained on the labeled source database and applied to an unlabeled target database for pathological voice detection and classification. Algorithm 1 presents the complete flow of the JSTL.
Algorithm 1 The proposed JSTL algorithm
1: Input: source and target data X; source domain labels y s ; regularization parameter λ , μ
2: Output: target domain labels y t
3: M 0 , S w , S b
4: repeat until convergence
5: construct the graph matrix by true and pseudo label
6: solve eigendecomposition X c = 0 C W c + μ L X T + λ ( S w S b ) + I A = X H X T A ϕ and k smallest eigenvectors as adaptation matrix A
7: update pseudo target labels using a standard classifier f trained on projected source data
8: update ( M c ) i j and L
9: end repeat
10: return target domain labels y t determined by classifier f

3. Experimental Methodology

In this section, we introduce three databases commonly used in pathological voice research [31], feature set, and feature selection.

3.1. Database

The cross-database training samples were selected from three pathological voice database. The Massachusetts Eye and Ear Infirmary (MEEI) [32] database consists of English voices from 53 healthy and 657 pathological speakers, which are sustained vowels /a/. The healthy speech recordings in the MEEI are sampled at 50 kHz, while the pathological ones are sampled at 25 kHz.
The Saarbruecken Voice Database (SVD) [33] includes 687 healthy and 1356 pathological voice samples, which are all sampled at 50 kHz. The voices for each speaker consist of vowels /a/, /i/, and /u/.
The Hospital Universitario Principe de Asturias (HUPA) [34] database consists of 239 healthy and 169 pathological voice samples. Each voice is sampled at 25 kHz with the sustained vowels /a/.
The diseases, which are clinically common and widely studied, were selected and divided into two categories. Neuromuscular voices consist of vocal fold paralysis and Parkinsonian disease, while structural voices include vocal fold polyps, nodules, edema, and vocal leukoplakia. The healthy and pathological samples from three different databases are presented in Table 2. We conduct the following six cross-database recognition settings for evaluation, which can be seen in Table 3.
We conducted the following six cross-database experiment settings for evaluation:
Table 3. Cross-database experiment settings.
M-SM-HS-MS-HH-MH-S
Training setMEEIMEEISVDSVDHUPAHUPA
Testing setSVDHUPAMEEIHUPAMEEISVD

3.2. Feature Set

The IS09 feature set in OpenSmile [35] was utilized to extract the features. A total of 384 dimensional features were obtained by calculating the first-order difference and second-order difference of 16 LLDS. The details are presented in Table 4.
We chose the INTERSPEECH 2009 feature set because the features in IS09, including the MFCC [36], HNR [37], and F0 [38] are often used in pathological voice research.

3.3. Feature Selection

According to [27], a feature set consists of important and unimportant features. Unimportant features will affect the result of experiments and increase the time complexity of the model construction. Therefore, feature selection should be used to choose the useful features for classification. The FDR value is used to rank the selected features, which is computed as follows
F D R ( k ) = μ n , k μ p , k 2 σ n , k 2 + σ p , k 2 , k = 1 , 2 , 3
where k is the number of features, μ n , k and μ n , p are the means of the k-th feature for classes of normal and pathological voices, respectively. σ n , k and σ n , p are the variances of k-th feature for classes of normal and pathological voices, respectively.
For a certain feature, the more satisfactory results obtained, the higher the FDR. After the FDR, the 384 dimensions were reduced to 160 dimensions. From Figure 2, it can be found that after the FDR method, the feature set performs better.

4. Results and Discussion

4.1. Cross-Database Experiments

In this section, we compared our method with traditional methods and other transfer learning methods. KNN was chosen as the base classifier, since it does not require tuning cross-validation parameters [39]. The recognition rate is given in Table 5. From Table 5, it can also be observed that:
Firstly, compared with traditional machine learning methods such as NN and PCA, the transfer learning methods achieved a higher recognition rate, which demonstrates that the feature distributions were quite different leading to the low recognition in the cross-database experiment. Meanwhile, since transfer learning methods can eliminate the distribution divergence across databases, transfer learning methods performed better in the experimental results. Secondly, the SJDA method, which combined the MMD with intra-class distance and inter-class distance achieved higher accuracy than the TCA and JDA. This shows that, in the process of feature transformation, intra-class distance and inter-class distance as regularization can guarantee the maximum separability among different classes. Thirdly, compared with DSTL which also used a graph as a regularization but did not take conditional distribution into account, the method we proposed, which calculated the graph matrix and the MMD distance between different classes achieved higher accuracy. Accordingly, the improvement of the DSTL compared to other transfer learning was not significant, and there was even a decrease in some groups. This demonstrates that when eliminating the divergence between different databases, conditional distribution affects the effect of transfer learning methods. Fourthly, the JDA, which used the MMD function as the distance measurement and took conditional distribution into account did not show much advantage over the TCA. However, the method we proposed achieved the highest accuracy, because the graph matrix acting as a regularization improved the accuracy of the pseudo labels, which further constructed the graph matrix. Fifthly, the recognition rate of our method was higher than the other transfer learning methods, because our proposed method constructed a graph with true and pseudo labels, which eliminated the difference between the source and target domain well and retained the local structural consistencies on labels.
Table 6 shows the average accuracy of different methods. Our proposed method achieved the highest recognition accuracy in the categories of healthy and structural. In particular, in the category of structural, the recognition accuracy of the proposed method was significantly higher than other methods. The reason why the accuracy of neuromuscular disease is lower than the other methods may be due to the nature of machine learning. As is known, when training the machine learning models, minority samples can be easily misclassified as majority samples. Table 3 shows that the number of neuromuscular disease samples was much smaller than other categories. After iteration in the algorithm, the model could not learn the characteristics of neuromuscular disease well, which led to the decrease in accuracy.
Figure 3 shows the confusion matrices of our method. The healthy category was more easily recognized compared with other categories, which proves the performance of our method on the pathological voice detection among cross-database experiments. When the HUPA was used as the training set, the accuracy of the neuromuscular category was small compared to other categories, which tended to cause the mismatch of the machine learning model. From Figure 3e,f, when the HUPA was used as the training set, the accuracy of the neuromuscular disease was the lowest, which confirms what we noted. On the contrary, when the MEEI and SVD were used as the training set, the confusion matrix was the most evenly distributed.

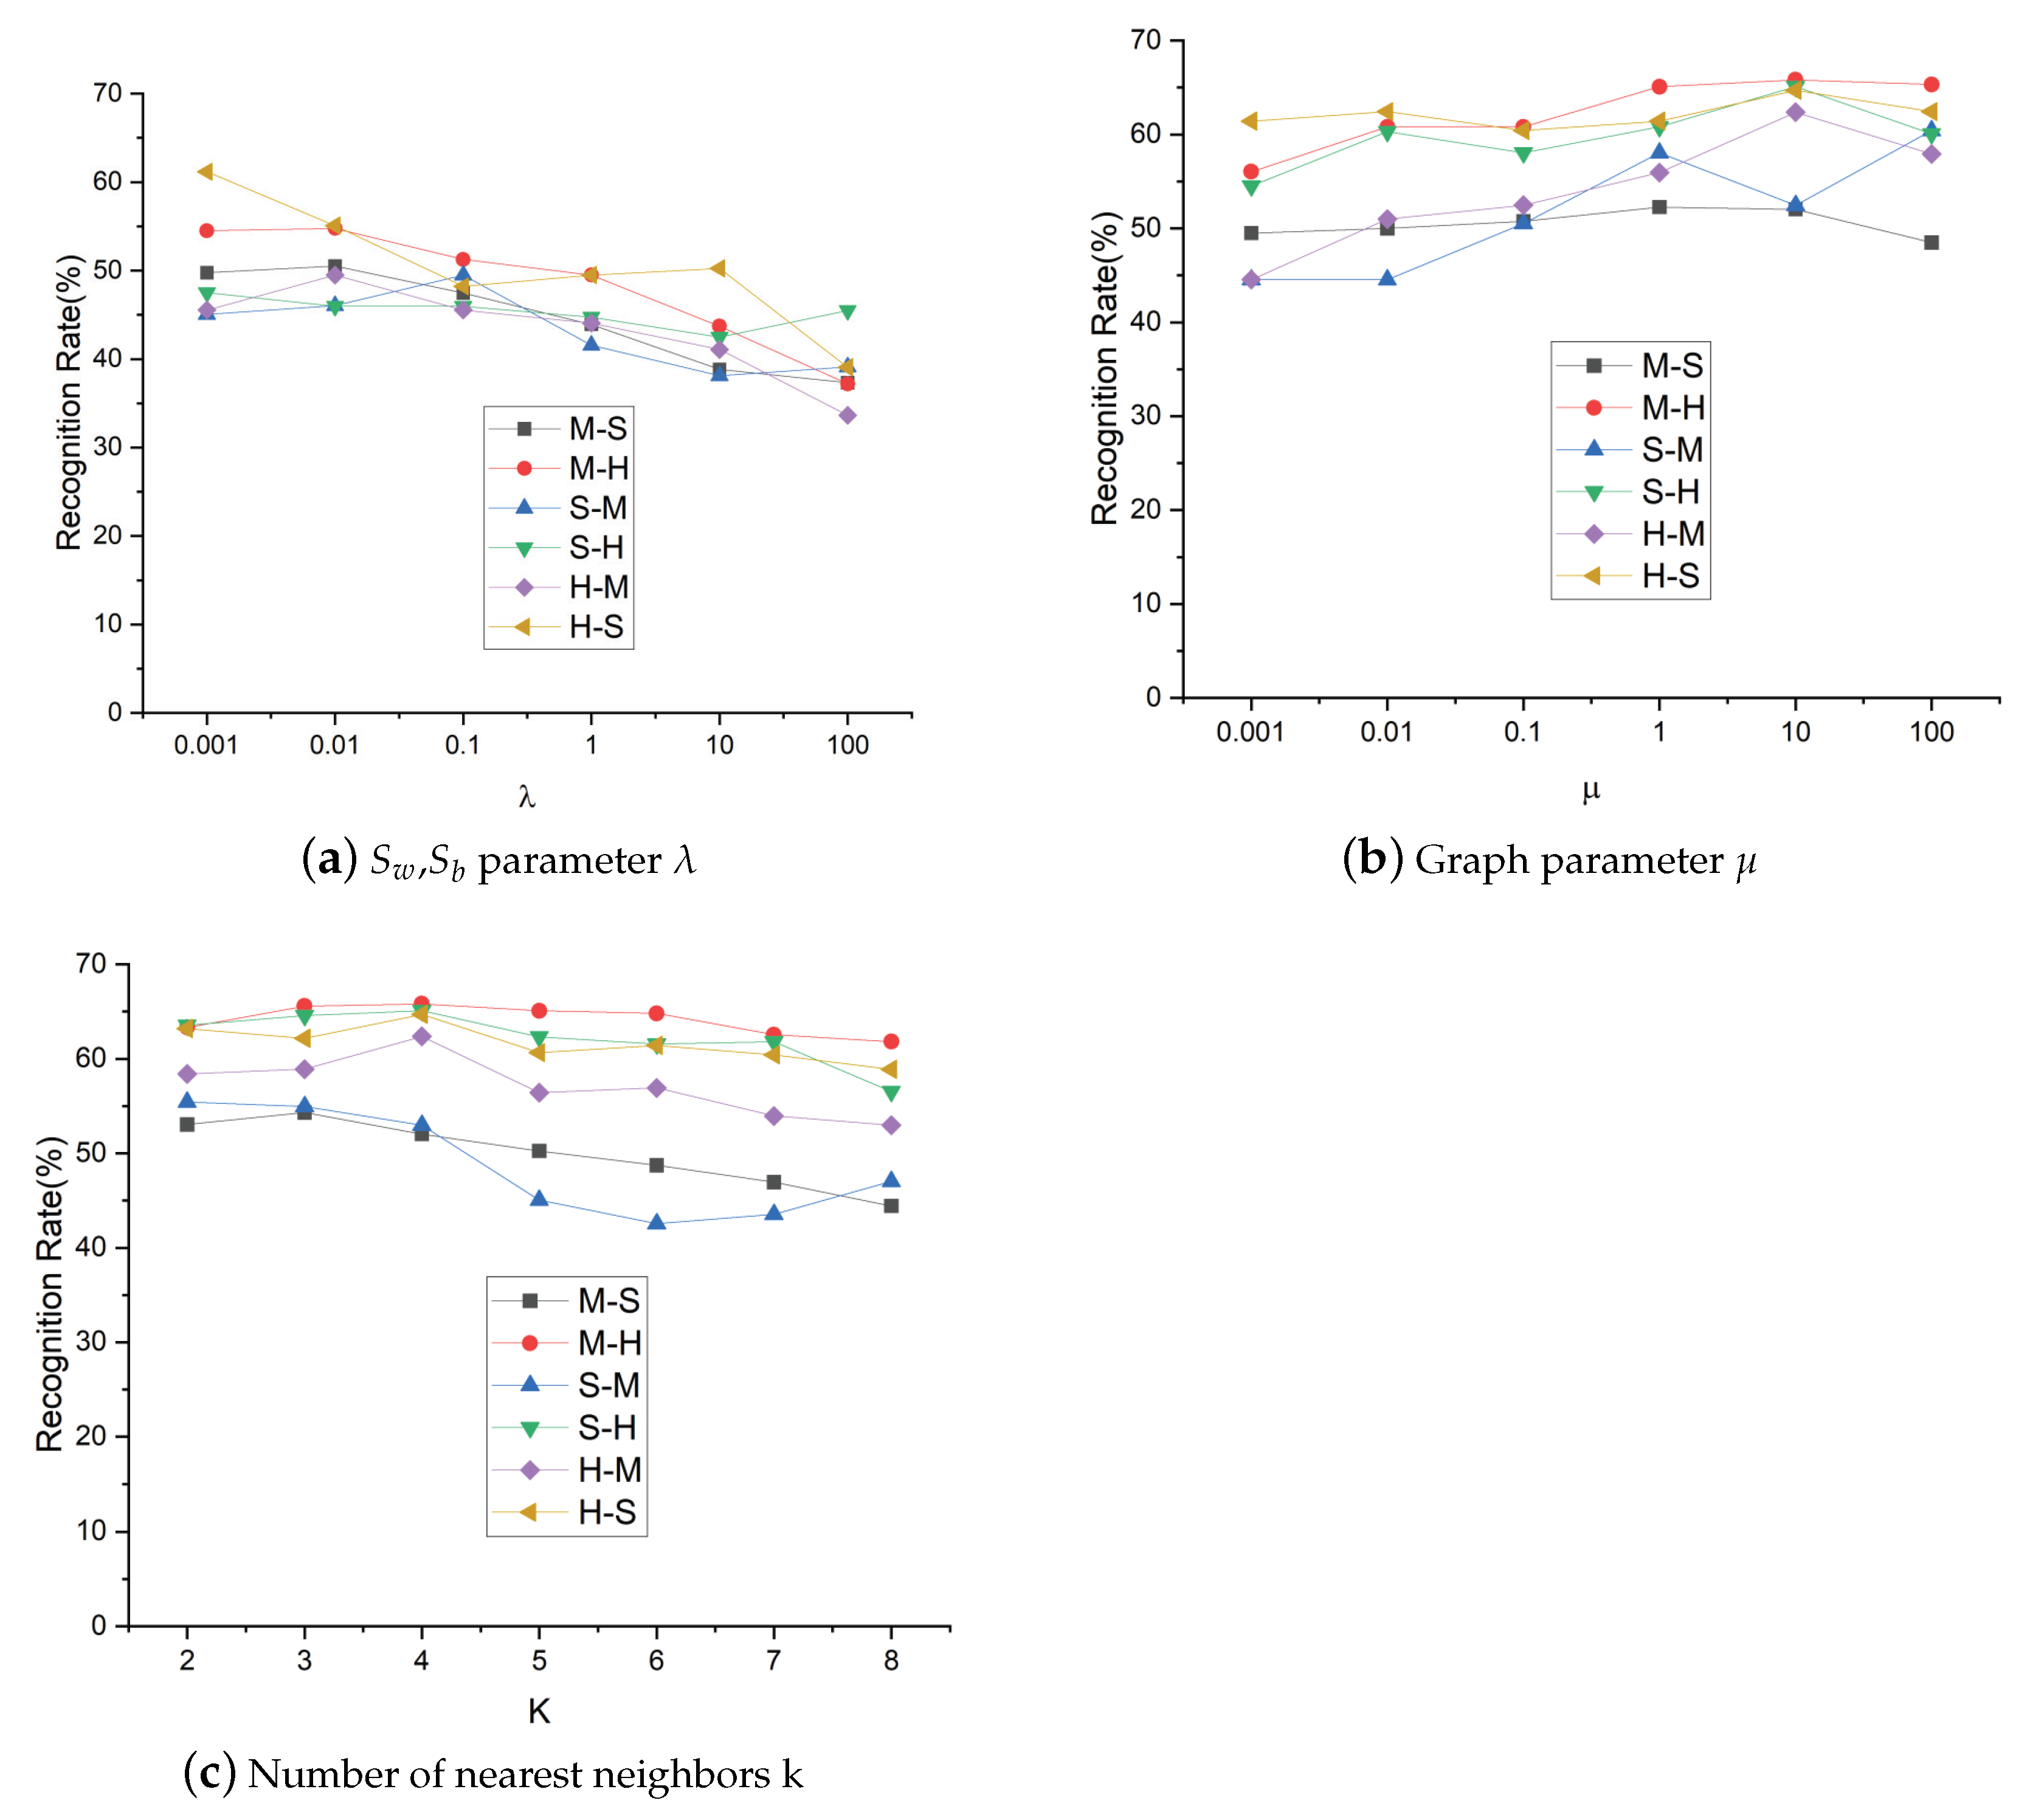
4.2. Parameter Sensitivity Analysis

We conducted parameter sensitivity analysis, which indicated that the proposed method achieved an optimal recognition performance with a wide range of parameter values. We plot the recognition accuracies of different parameters in Figure 4.
With the parameter λ varying from 0.001 to 100, the overall recognition rate had a downward trend. Meanwhile, when λ = 0.01, most of the settings achieved the highest accuracy.
With the parameter μ varying from 0.001 to 100, with the increase in the value of μ , the recognition rate also increased, and five settings achieved the highest accuracy when μ = 10.
With the parameter k varying from 2 to 8, when the value of K was small, the k-nearest neighbor model was more complicated, and it was prone to overfitting; when the k value was larger, the k-nearest neighbor model was simpler. When k = 4, four settings achieved the highest accuracy.

4.3. Feature Visualization

Before using transfer learning, the top three features from the MEEI and SVD were selected by PCA [40], respectively, which were named PCA1, PCA2, and PCA3. Those chosen from our method were named F1, F2, F3, which can be seen in Figure 5. From Figure 5a,b, it is obvious that the feature distributions from the MEEI and SVD were quite different. For the MEEI, the feature distribution was relatively sparse, and the points were mostly concentrated at the bottom. For the SVD, the feature distribution was more even, but the points were all clustered together. Furthermore, if we take PCA3 as an example, the value of the MEEI varied from −0.2 to 0.4, while the value of the SVD varied from −0.2 to 0.1. However, in Figure 5c,d, the feature distributions in the MEEI and SVD were similar. This demonstrates that transfer learning methods can effectively eliminate the discrepancy between the source and the target domain.

5. Conclusions

To improve the performance of cross-database pathological voice recognition, joint subspace transfer learning was proposed. This method took conditional distribution into account. Furthermore, intra-class distance, inter-class distance, and graph matrix acted as regularization, which guaranteed the maximal separability among databases and preserved the local structural consistencies over labels. The average recognition rate of our proposed method was 9.92% higher than that of SJDA, which demonstrates that the graph embedding matrix effectively maintained the structure of the label and guaranteed the robustness of the model in the iterative process. At the same time, the recognition rate of our method was 10.39% higher than that of DSTL. It can be concluded that conditional feature distributions should be given more attention, as they effectively eliminated the discrepancy between the source and target domain. For six cross-database experiment settings, the H-M setting achieved the highest improvement, with a 15% increase, and the H-S setting achieved the lowest improvement, with a 2.5% increase. For different voice categories, the categories of structural voice and heathy voice tested by proposed method showed a higher accuracy than the other transfer learning methods. Finally, three dimensional scatter plots were drawn to observe the feature distribution of samples. It is obvious that the feature distribution became similar after the transfer learning methods.
From Section 4, several problems should be solved in the future. The categories of neuromuscular and structural diseases will be further subdivided, and a multi-class experiment will be discussed. Furthermore, the problem where the minority class was classified as the majority class due to the sample imbalance will be studied in further work.

Author Contributions

Conceptualization, Y.Z.; methodology, Y.Z.; software, J.Q.; validation, Y.Z., J.Q. and X.Z.; formal analysis, X.Z.; investigation, J.Q.; resources, Y.Z.; data curation, J.Q.; writing—original draft preparation, Y.Z.; writing—review and editing, Y.Z.; visualization, Y.X.; supervision, Z.T.; project administration, Z.T.; funding acquisition, Y.X. All authors have read and agreed to the published version of the manuscript.

Funding

This work was supported by the National Natural Science Foundation of China under Grant 61271359.

Institutional Review Board Statement

Not applicable.

Informed Consent Statement

Not applicable.

Data Availability Statement

The MEEI database is commercialized and not publicly available. The SVD database, Available online: http://www.stimmdatenbank.coli.uni-saarland.de, accessed on 17 July 2022. The HUPA database is not publicly available.

Conflicts of Interest

The authors declare no conflict of interest.

References

  1. LeBorgne, W.; Donahue, E.N. Voice Therapy as Primary Treatment of Vocal Fold Pathology. Otolaryngol. Clin. 2019, 52, 649–656. [Google Scholar] [CrossRef]
  2. Saeedi, N.E.; Almasganj, F.; Torabinejad, F. Support vector wavelet adaptation for pathological voice assessment. Comput. Biol. Med. 2011, 41, 822–828. [Google Scholar] [CrossRef] [PubMed]
  3. Turkmen, H.I.; Karsligil, M.E.; Kocak, I. Classification of laryngeal disorders based on shape and vascular defects of vocal folds. Comput. Biol. Med. 2015, 62, 76–85. [Google Scholar] [CrossRef] [PubMed]
  4. Arias-Londoño, J.D.; Godino-Llorente, J.I.; Sáenz-Lechón, N.; Osma-Ruiz, V.; Castellanos-Domínguez, G. An improved method for voice pathology detection by means of a HMM-based feature space transformation. Pattern Recognit. 2010, 43, 3100–3112. [Google Scholar] [CrossRef]
  5. Ali, Z.; Elamvazuthi, I.; Alsulaiman, M.; Muhammad, G. Automatic voice pathology detection with running speech by using estimation of auditory spectrum and cepstral coefficients based on the all-pole model. J. Voice 2016, 30, 757-e7. [Google Scholar] [CrossRef] [PubMed]
  6. Hireš, M.; Gazda, M.; Drotár, P.; Pah, N.D.; Motin, M.A.; Kumar, D.K. Convolutional neural network ensemble for Parkinson’s disease detection from voice recordings. Comput. Biol. Med. 2021, 141, 105021. [Google Scholar] [CrossRef]
  7. Kadiri, S.R.; Alku, P. Analysis and detection of pathological voice using glottal source features. IEEE J. Sel. Top. Signal Process. 2019, 14, 367–379. [Google Scholar] [CrossRef]
  8. Wu, Y.; Zhou, C.; Fan, Z.; Wu, D.; Zhang, X.; Tao, Z. Investigation and Evaluation of Glottal Flow Waveform for Voice Pathology Detection. IEEE Access 2020, 9, 30–44. [Google Scholar] [CrossRef]
  9. Zhou, C.; Wu, Y.; Fan, Z.; Zhang, X.; Wu, D.; Tao, Z. Gammatone spectral latitude features extraction for pathological voice detection and classification. Appl. Acoust. 2022, 185, 108417. [Google Scholar] [CrossRef]
  10. Daume, H., III; Marcu, D. Domain adaptation for statistical classifiers. J. Artif. Intell. Res. 2006, 26, 101–126. [Google Scholar] [CrossRef]
  11. Al-Nasheri, A.; Muhammad, G.; Alsulaiman, M.; Ali, Z.; Malki, K.H.; Mesallam, T.A.; Ibrahim, M.F. Voice pathology detection and classification using auto-correlation and entropy features in different frequency regions. IEEE Access 2017, 6, 6961–6974. [Google Scholar] [CrossRef]
  12. Hegde, S.; Shetty, S.; Rai, S.; Dodderi, T. A survey on machine learning approaches for automatic detection of voice disorders. J. Voice 2019, 33, 947. [Google Scholar] [CrossRef] [PubMed]
  13. Brockmann, M.; Storck, C.; Carding, P.N.; Drinnan, M.J. Voice loudness and gender effects on jitter and shimmer in healthy adults. J. Speech Lang. Hear. Res. 2008, 51, 1152–1160. [Google Scholar] [CrossRef]
  14. Pan, S.J.; Yang, Q. A survey on transfer learning. IEEE Trans. Knowl. Data Eng. 2009, 22, 1345–1359. [Google Scholar] [CrossRef]
  15. Li, Y.; Yuan, L.; Vasconcelos, N. Bidirectional learning for domain adaptation of semantic segmentation. In Proceedings of the IEEE/CVF Conference on Computer Vision and Pattern Recognition, Long Beach, CA, USA, 15–20 June 2019; pp. 6936–6945. [Google Scholar]
  16. Poncelas, A.; Way, A. Selecting artificially-generated sentences for fine-tuning neural machine translation. arXiv 2019, arXiv:1909.12016. [Google Scholar]
  17. Li, B.; Wang, X.; Beigi, H. Cantonese automatic speech recognition using transfer learning from mandarin. arXiv 2019, arXiv:1911.09271. [Google Scholar]
  18. Fernando, B.; Habrard, A.; Sebban, M.; Tuytelaars, T. Unsupervised visual domain adaptation using subspace alignment. In Proceedings of the IEEE International Conference on Computer Vision, Sydney, Australia, 1–8 December 2013; pp. 2960–2967. [Google Scholar]
  19. Sun, B.; Saenko, K. Subspace distribution alignment for unsupervised domain adaptation. In Proceedings of the BMVC, Swansea, UK, 7–10 September 2015; Volume 4, pp. 21–24. [Google Scholar]
  20. Sun, B.; Feng, J.; Saenko, K. Correlation alignment for unsupervised domain adaptation. In Domain Adaptation in Computer Vision Applications; Springer: Berlin/Heidelberg, Germany, 2017; pp. 153–171. [Google Scholar]
  21. Yan, H.; Ding, Y.; Li, P.; Wang, Q.; Xu, Y.; Zuo, W. Mind the class weight bias: Weighted maximum mean discrepancy for unsupervised domain adaptation. In Proceedings of the IEEE Conference on Computer Vision and Pattern Recognition, Honolulu, HI, USA, 21–26 July 2017; pp. 2272–2281. [Google Scholar]
  22. Zong, Y.; Zheng, W.; Zhang, T.; Huang, X. Cross-corpus speech emotion recognition based on domain-adaptive least-squares regression. IEEE Signal Process. Lett. 2016, 23, 585–589. [Google Scholar] [CrossRef]
  23. Zong, Y.; Zheng, W.; Huang, X.; Yan, K.; Yan, J.; Zhang, T. Emotion recognition in the wild via sparse transductive transfer linear discriminant analysis. J. Multimodal User Interfaces 2016, 10, 163–172. [Google Scholar] [CrossRef]
  24. Song, P.; Zheng, W.; Ou, S.; Zhang, X.; Jin, Y.; Liu, J.; Yu, Y. Cross-corpus speech emotion recognition based on transfer non-negative matrix factorization. Speech Commun. 2016, 83, 34–41. [Google Scholar] [CrossRef]
  25. Borgwardt, K.M.; Gretton, A.; Rasch, M.J.; Kriegel, H.P.; Schölkopf, B.; Smola, A.J. Integrating structured biological data by kernel maximum mean discrepancy. Bioinformatics 2006, 22, e49–e57. [Google Scholar] [CrossRef]
  26. Song, P.; Zheng, W. Feature selection based transfer subspace learning for speech emotion recognition. IEEE Trans. Affect. Comput. 2018, 11, 373–382. [Google Scholar] [CrossRef]
  27. Chen, Y.; Xiao, Z.; Zhang, X.; Tao, Z. DSTL: Solution to Limitation of Small Corpus in Speech Emotion Recognition. J. Artif. Intell. Res. 2019, 66, 381–410. [Google Scholar] [CrossRef]
  28. Pan, S.J.; Tsang, I.W.; Kwok, J.T.; Yang, Q. Domain adaptation via transfer component analysis. IEEE Trans. Neural Netw. 2010, 22, 199–210. [Google Scholar] [CrossRef] [PubMed]
  29. Long, M.; Wang, J.; Ding, G.; Sun, J.; Yu, P.S. Transfer feature learning with joint distribution adaptation. In Proceedings of the IEEE International Conference on Computer Vision, Sydney, Australia, 1–8 December 2013; pp. 2200–2207. [Google Scholar]
  30. Yan, S.; Xu, D.; Zhang, B.; Zhang, H.J.; Yang, Q.; Lin, S. Graph embedding and extensions: A general framework for dimensionality reduction. IEEE Trans. Pattern Anal. Mach. Intell. 2006, 29, 40–51. [Google Scholar] [CrossRef]
  31. Islam, R.; Tarique, M.; Abdel-Raheem, E. A Survey on Signal Processing Based Pathological Voice Detection Techniques. IEEE Access 2020, 8, 66749–66776. [Google Scholar] [CrossRef]
  32. Saenz-Lechon, N.; Godino-Llorente, J.I.; Osma-Ruiz, V.; Gomez-Vilda, P. Methodological issues in the development of automatic systems for voice pathology detection. Biomed. Signal Process. Control 2006, 1, 120–128. [Google Scholar] [CrossRef]
  33. Barry, W.; Putzer, M. Saarbrucken Voice Database; Institute of Phonetics University of Saarland: Saarland, Germany, 2007. [Google Scholar]
  34. Mekyska, J.; Janousova, E.; Gomez-Vilda, P.; Smekal, Z.; Rektorova, I.; Eliasova, I.; Kostalova, M.; Mrackova, M.; Alonso-Hernandez, J.B.; Faundez-Zanuy, M.; et al. Robust and complex approach of pathological speech signal analysis. Neurocomputing 2015, 167, 94–111. [Google Scholar] [CrossRef]
  35. Eyben, F.; Wöllmer, M.; Schuller, B. Opensmile: The munich versatile and fast open-source audio feature extractor. In Proceedings of the 18th ACM International Conference on Multimedia, Florence, Italy, 25–29 October 2010; pp. 1459–1462. [Google Scholar]
  36. Holi, M.S. Wavelet transform features to hybrid classifier for detection of neurological-disordered voices. J. Clin. Eng. 2017, 42, 89–98. [Google Scholar]
  37. Belalcazar-Bolanos, E.; Orozco-Arroyave, J.; Arias-Londono, J.; Vargas-Bonilla, J.; Nöth, E. Automatic detection of Parkinson’s disease using noise measures of speech. In Proceedings of the Symposium of Signals, Images and Artificial Vision-2013: STSIVA, Bogota, Colombia, 11–13 September 2013; pp. 1–5. [Google Scholar]
  38. Dahmani, M.; Guerti, M. Vocal folds pathologies classification using Naïve Bayes Networks. In Proceedings of the 2017 6th International Conference on Systems and Control (ICSC), Batna, Algeria, 7–9 July 2017; pp. 426–432. [Google Scholar]
  39. Gong, B.; Shi, Y.; Sha, F.; Grauman, K. Geodesic flow kernel for unsupervised domain adaptation. In Proceedings of the 2012 IEEE Conference on Computer Vision and Pattern Recognition, Providence, RI, USA, 16–21 June 2012; pp. 2066–2073. [Google Scholar]
  40. Anzai, Y. Pattern Recognition and Machine Learning; Elsevier: Amsterdam, The Netherlands, 2012. [Google Scholar]
Figure 1. Flowchart of the proposed method.
Applsci 12 08129 g001
Figure 2. The results of the experiments for the FDR and non-FDR.
Applsci 12 08129 g002
Figure 3. Confusion matrices of the proposed method under the six settings.
Applsci 12 08129 g003
Figure 4. Parameter sensitivity analysis.
Applsci 12 08129 g004
Figure 5. Three dimensional scatter plots of MEEI and SVD extracted by PCA and JSTL.
Applsci 12 08129 g005
Table 1. Description of frequently used parameters.
ParametersDescription
X s R m × n s , X t R m × n t Labeled source/unlabeled target features
M 0 R n × n , M c R n × n MMD matrix
L R n × n Laplacian matrix
D s , D t Source/target domain
S w , S b Intraclass/interclass divergence matrix
cthe c-th pathological voice category
λ regularization parameter of S w , S b
μ regularization parameter of GE
knumber of nearest neighbors
Table 2. Voice samples selected from the pathological voice database.
DatabaseHealthyNeuromuscularStructural
MEEI536782
SVD20064130
HUPA23931128
Table 4. Features in INTERSPEECH 2009 Emotion Challenge.
LLDNumberFunctionals (12)
ZCR1mean
Δ ZCR1
RMS1Energy standard deviation
Δ RMS1
F01kurtosis, skewness
Δ F01
HNR1Extremes: Value, rel. position, range
Δ HNR1
MFCC1-1212linear regression: offset, slope, MSE
Δ MFCC1-1212
Table 5. Accuracy (%) of different methods under six cases.
CasesNNPCATCAJDAGFKSJDADSTLJSTL
M-S40.1035.2848.4846.7038.0749.7545.1852.03
M-H42.7138.4451.2654.0241.2154.5251.5165.83
S-M42.5735.6445.0545.0548.0245.0550.0052.97
S-H52.5151.5146.2345.4854.7747.4948.4965.08
H-M43.5643.0744.0642.5744.0645.5447.3762.38
H-S58.8853.5558.1262.1757.6161.1758.1264.72
Table 6. Average accuracy (%) of different categories of different methods.
CategoryNNPCATCAJDAGFKSJDADSTLJSTL
Healthy63.3358.9668.0970.0864.3670.3968.1475.37
Neuromuscular39.1033.0043.9047.5440.6045.2343.5937.96
Structural40.5936.6636.4335.2540.2237.9738.5562.96
Publisher’s Note: MDPI stays neutral with regard to jurisdictional claims in published maps and institutional affiliations.

