Article

Magnitude Modeling of Personalized HRTF Based on Ear Images and Anthropometric Measurements

Shanghai Institute for Advanced Communication and Data Science, Key Laboratory of Specialty Fiber Optics and Optical Access Networks, Shanghai University, Shanghai 200444, China
*
Author to whom correspondence should be addressed.
Appl. Sci. 2022, 12(16), 8155; https://doi.org/10.3390/app12168155
Submission received: 23 June 2022 / Revised: 1 August 2022 / Accepted: 10 August 2022 / Published: 15 August 2022
(This article belongs to the Section Acoustics and Vibrations)

Abstract

:
In this paper, we propose a global personalized head-related transfer function (HRTF) method based on anthropometric measurements and ear images. The model consists of two sub-networks. The first is the VGG-Ear Model, which extracts features from the ear images. The second sub-network uses anthropometric measurements, ear features, and frequency information to predict the spherical harmonic (SH) coefficients. Finally, the personalized HRTF is obtained through inverse spherical harmonic transform (SHT) reconstruction. With only one training, the HRTF in all directions can be obtained, which greatly reduces the parameters and training cost of the model. To objectively evaluate the proposed method, we calculate the spectral distance (SD) between the predicted HRTF and the actual HRTF. The results show that the SD provided by this method is 5.31 dB, which is better than the average HRTF of 7.61 dB. In particular, the SD value is only increased by 0.09 dB compared to directly using the pinna measurements.

1. Introduction

In recent years, virtual reality (VR) and augmented reality (AR) have developed rapidly. Virtual stereo, as an important part of virtual reality, has been widely used in games, video conferencing, humanoid robot interaction, hearing aids, and other fields [1]. In short, the quality of spatial sound is particularly important for achieving high-fidelity immersive experiences in virtual environment.
To generate virtual audio, it is necessary to study the spatial cues of the human auditory system. The positioning factors of spatial hearing are mainly based on binaural and monaural cues [2]. Binaural cues include the interaural time difference (ITD) and the interaural level difference (ILD). ITD describes the time difference between the same sound reaching the two ears, and ILD describes the difference in binaural intensity caused by the weakening of the sound caused by the diffraction effect of the pinna and head. These cues are closely related to the perceived horizontal direction of the sound source. The monaural cues include the scattering and diffraction effects of the pinna, torso, etc. on the sound [3,4]. The listener can distinguish the spatial direction of the sound source to a certain extent based on these cues.
At present, spatial audio technology has supported playback on various devices. The head-related transfer function is essential for the headset to reproduce virtual audio. The head-related transfer function (HRTF) or head-related impulse response (HRIR) in the time-domain describes the sound filtering effect of the head, torso, and pinna in the process from the sound source to the eardrum of the listener in a free-field environment. The HRTF depends on the morphological characteristics of the listener. Due to different anatomical parameters, the HRTFs of users are also different. When using non-personalized data, users are prone to “head-center effect, front-to-back position confusion, and up-and-down confusion” [5,6].
To avoid the above problems and reduce sound source localization errors, the personalized HRTF that matches the morphological characteristics of each listener needs to be individually designed. To this end, researchers have proposed a variety of HRTF personalization methods, including acoustical measurement methods [7,8,9], database matching methods [10,11], numerical modeling methods [12,13,14], and anthropometric parameter regression methods. Among them, the acoustical measurement method is the most accurate, Li et al. [9] provides an overview of some state-of-the-art measurement methods, but these methods require specialized equipment and environment. Therefore, the anthropometric parameter regression method is widely studied because the predictive model can be reused once it is determined.
For instance, Lei et al. [15] proposed to use principal component analysis (PCA) to obtain the weight matrix and feature matrix of HRTF, use canonical correlation analysis to remove redundant information of anthropometric features, and use generalized regression network (GRNN) to analyze the relationship between anthropometric features and HRTF weight matrix.
Grijalva et al. [16] proposed to use the isometric mapping (ISOMAP) method to extract the feature description of HRTF, use artificial neural network (ANN) to establish the relationship between physiological parameters and low-dimensional HRTF, and use the domain reconstruction method to reconstruct the HRTF in the complete space.
With deep learning showing great ability in optimizing estimation [17], Chun et al. [18] proposed a deep neural network (DNN) model. After inputting the head, torso, and pinna information, they let the DNN select the importance of training features and directly obtain the HRTF, thus simplifying the operation steps of the entire model.
As measurements related to the pinna are still challenging to obtain in real life, Lee et al. [19] further proposed to use a convolutional neural network (CNN) to extract features from ear images instead of directly measuring the human pinna. The model provides the Log Spectral Distance (LSD) of 4.47 dB, which are lower by 0.85 dB than the DNN-based method using anthropometric data without pinna measurements. However, this model uses different machine learning models for different azimuths and elevation, and a total of 1250 models (25 azimuths and 50 elevations) have been established, which is inconvenient to use. In recent years, some studies have proposed to use HRTF as a function defined on a spherical surface to reproduce binaural signals using spherical harmonics. Ben-Hur et al. [20] demonstrated that accurate positioning performance can be restored to a greater extent by using spherical harmonic representation as low as 4th order. Wang et al. [21] proposed a global HRTF personalization method, which using spherical harmonic transform as a compact representation of the HRTF magnitude spectrum, showing significant improvements upon finite element acoustic calculations.
Kulkarni and Colburn [22] proposed to truncate the HRTF log-magnitude spectrum after Fourier series expansion, and the resulting smooth HRTF still remains perceptually relevant. On this basis, Romigh et al. [23] explored a method for smoothing HRTFs by utilizing a truncated spherical harmonic expansion, and the results showed that the significant smoothing of HRTF in frequency brought by the low-order spherical harmonic representation does not affect the perceived position of the sound.
Based upon this previous work, we propose two hypotheses: (1) After truncating SH, the expanded and reconstructed HRTF are perceptually indistinguishable from the original. (2) The higher the accuracy of the ear recognition model, the more personalized and accurate the extracted ear features.
In this paper, we propose an acoustic model consisting of two sub-networks. The first network extracts ear features using the VGG-Ear model, where VGG-Ear involves transfer learning from the VGG19 network proposed by the Visual Geometry Group at Oxford University. The second network combines parameters such as ear features, head and torso measurements, and frequency points to predict the spherical harmonic (SH) coefficients. Finally, we use the inverse spherical harmonic transform (SHT) to obtain the personalized HRTF. At the same time, the performance of the proposed method is compared with method with precise pinna measurements. The spectral distance (SD) is then used to evaluate the error between the estimated HRTF and the actual HRTF.
The structure of this paper is as follows. In Section 2, the database and related parameters used in the experiments are presented. Section 3 introduces the framework and individual component modules of personalized HRTF. Section 4 analyzes the experimental results and evaluates the performance of the proposed method. Section 5 summarizes the whole paper and looks forward to future work.

2. Database

2.1. CIPIC Database

In the process of designing and implementing personalized HRTF, the HRTF database publicly provided by the Center for Image Processing and Integrated Computing (CIPIC) [24] of the University of California is used. The database contains the head-related impulse response (HRIR) of 45 subjects at 25 azimuths and 50 elevations, with a sampling length of 200 and a sampling rate of 44.1 kHz. The spatial sampling is roughly evenly distributed on a sphere with a radius of 1 m. The horizontal azimuth ranges from −80° to +80°, and the elevation ranges from −45° to 230.625°. The sampling points are shown in Figure 1.
The database also provides anthropometric parameters and ear images of each subject, including 17 head and torso parameters and 10 pinna parameters. The specific measurement parameters are shown in Figure 2.

2.2. Ear Image Database

The ear images from AWE database used in this work have been provided by the University of Ljubljana, Slovenia [25,26,27]. The AWE database contains 1000 ear images of 100 subjects, and each object has 10 images of different quality and size. The sample image is shown in Figure 3.

3. Proposed Method

The whole model is divided into two parts. The first part uses the VGG-Ear model pre-trained in the AWE database to extract ear features. The second part uses anthropometric parameters, ear features, and frequency index to predict SH coefficients. Finally, HRTF is represented by spherical harmonic basis functions and SH coefficients.

3.1. VGG-Ear Model

The precise pinna measurements in Figure 2b are difficult in practice, and anthropometric data may lose information for estimating HRTF. Therefore, the method proposed in this paper uses ear images directly. In addition, there are few human ear images in the CIPIC database. When the number of network layers is small, the feature extraction accuracy is not high, and the problem of over-fitting is easy to occur. Therefore, this paper uses the pre-trained VGG19 network and then performs transfer learning on the AWE database to obtain the VGG-Ear model, and then uses the VGG-Ear model to extract the features of the ear images in CIPIC as the first output of the network.

3.1.1. Transfer Learning

Convolutional Neural Networks (CNN) have shown impressive performance in various computer vision tasks in recent years, such as image classification, face recognition [28], object detection [29], etc. It is well known that deep CNN networks require abundant training data to achieve better results. Although ear recognition has grown in popularity in recent years, unlike the field of face recognition, ear datasets are limited to thousands of images and hundreds of identities. Therefore, how to utilize the concepts of deep learning to identify limited ear datasets is a big challenge.
Transfer learning is a CNN architecture trained on a large dataset and then reused to train other datasets. Transfer learning leverages the knowledge gained from previous training to improve its learning ability in new complex tasks. This method dramatically reduces the depth of traditional deep learning models, better alleviates the common overfitting problem of small samples and has remarkable achievements in the field of medical images.
Ž. Emeršič et al. [30] proposed using transfer learning to use active data augmentation and selective learning on existing models to significantly improve the recognition rate of ear images. Alshazly H. et al. [31] proposed to train different networks by randomly initializing the weights and fine-tuning the pretrained model to build the best model and improve the recognition performance. The above methods fully demonstrate the effectiveness of the ear recognition model based on transfer learning.
This paper compares the existing commonly used pre-training networks VGG19 [32], ResNet50 [33], InceptionV3 [34], Xception [35], and MobileNet [36] on the AWE dataset, and the optimal model VGG-Ear is obtained.

3.1.2. Ear Data Augmentation

Since the process of deep learning often requires a large number of labeled training samples, the existing ear datasets have limited data, which can easily lead to over-fitting problems. Therefore, data augmentation is often used in image research to increase the number of training samples. By artificially introducing appearance variations, multiple variants of the original image can be generated without additional labeling costs. The data augmentation step is the preprocessing of the original dataset before being fed into the model.
Due to the limited number of images in the AWE dataset, we applied data augmentation to increase the amount of data and take into account the appearance changes caused by image changes. This paper used the Imgaug tool to enhance the original data set with translation slight rotation. Below is a list of enhancement programs that we used to increase the amount of available training data:
  • Add Gaussian noise to the image.
  • Rotate the image by −40 to +40 degrees.
  • Gaussian blurring the image ( σ varies from 1 to 4).
  • Adjust brightness of the image ( γ varies from 0.5 to 2).
  • Crop and occlude the image by 10% to 40%.
Figure 4 shows some example images of data augmentation. We augment each training image to 30 images by randomly performing the above image augmentation techniques.

3.1.3. The VGG-Ear Architecture

In the model design, the network weights pre-trained on ImageNet are first loaded, and the last fully connected layer of the network is removed. Then we add the Pooling layer, Softmax layer, and the class prediction is 100 output neurons. Figure 5 shows the architecture diagram of the VGG-Ear. To evaluate the results of the networks, the AWE dataset was split into two groups: 80% for training and 20% for testing. Due to the limited training images, we applied the data from the augmentation techniques described above to them, yielded 24,800 training samples. Then we split the boosted training set into 80% for training and 20% for validation.
The model adopts the categorical cross-entropy loss function as the cost function and uses a gradient descent-based back propagation method to update the weights by minimizing the cost function. The algorithm is further optimized using the gradient adaptive Adam method during this process, and the learning rate is set to 0.001.The technique of dropout (0.2) is used to improve the convergence speed further and prevent over-fitting.
After obtaining the most accurate ear recognition model, we replace the Softmax layer with the fully connected layer (nodes = 10), and use these nodes as the output of the VGG-Ear.

3.2. Deep Learning Model Design

We process the HRIR data provided in the database to obtain HRTF of different frequencies and then use spherical harmonic basis functions and SH coefficients to represent HRTF. Then a deep learning model is designed to predict the SH coefficients using head, torso parameters, frequency index, and the ear features output by the VGG-Ear Model.
Figure 6 shows the block diagram of the model. The input of the deep learning model is the ear features obtained by the VGG-Ear model (10-d vector), head and torso parameters from CIPIC database (17-d vector), and frequency index (44-d vector). The specific frequency index is 44 frequency points from 1 to 87 with a uniform interval of 2, and the corresponding frequency range is 0–15 kHz. These parameters are separately input into the fully connected (FC) layer for encoding, and another FC layer is used to fuse the information. Finally, it is sent to the 1D convolutional neural network to obtain the predicted SH coefficients.
By incorporating frequency information, the proposed personalization method can obtain HRTF prediction results for all 1250 directions (25 azimuths and 50 elevations) in one training. Therefore, the proposed method requires fewer models and fewer parameters in terms of the number of models to train.

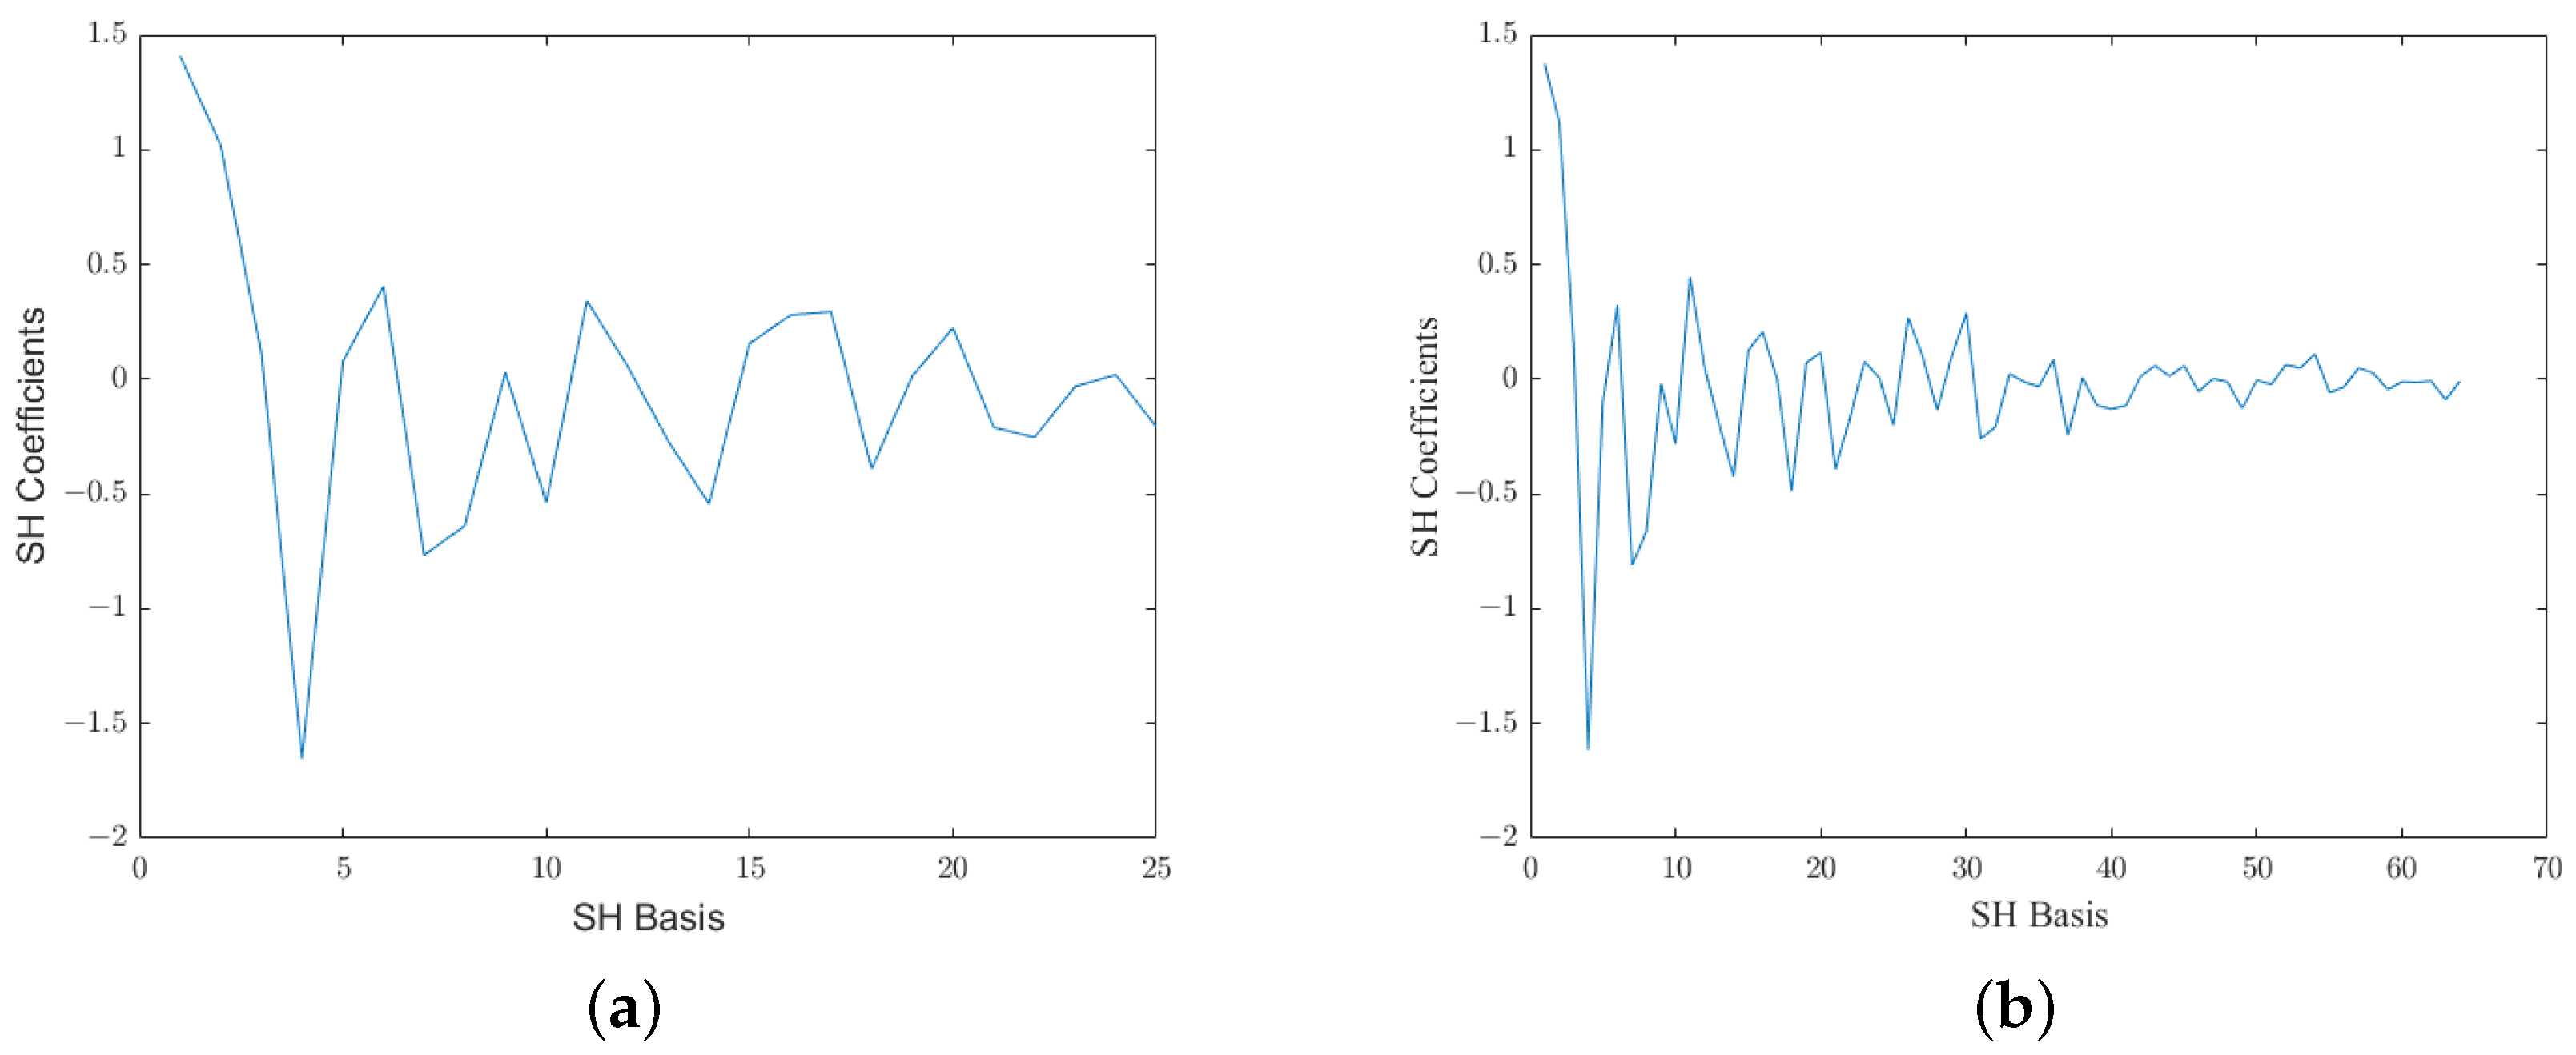
3.2.1. Spherical Harmonic Decomposition

The spherical harmonics (SH) are a set of the orthogonal basis of spherical coordinates. The target HRTF amplitude H ( θ , ϕ ) along the direction can be expressed as the weighted sum of real-valued spherical harmonic functions, as the function below:
H ( θ , ϕ ) = l , k Y l k ( θ , ϕ ) β l k
where H ( θ , ϕ ) represents the HRTF, in which the azimuth θ [ 0 , π ] is measured from the z-axis and the elevation ϕ [ 0 , 2 π ] is measured from the x-axis. Y l k ( θ , ϕ ) denotes the spherical harmonic basis function of order l and degree k; β l k is the SH decomposed coefficients.
The real spherical harmonics are defined as follows. The real spherical harmonics have the same orthonormality properties as the complex spherical harmonics.
Y l k ( θ , ϕ ) = ( 2 l + 1 ) 2 π ( l | k | ) ! ( l + | k | ) ! P l k ( cos θ ) cos ( k ϕ ) k > 0 ( 2 l + 1 ) 4 π P l k ( cos θ ) k = 0 ( 2 l + 1 ) 2 π ( l | k | ) ! ( l + | k | ) ! P l | k | ( cos θ ) sin ( | k | ϕ ) k < 0
where P l k is the associated Legendre function of order l and degree k. Figure 7 shows the real parts of the first 4th order SH basis. The spherical harmonic function of order 0 is an omnidirectional sphere, so the recorded sound field has no azimuth information. The 1st order spherical harmonic function is three 8-shaped, which respectively receive the information components in the x, y, and z directions. The number of components added to each order is 2 × (l + 1), so the number of L-order spherical harmonic basis functions is ( L + 1 ) 2 .
The process of SHT is to calculate the coefficients of each SH basis function [37]. Representing (1) in matrix form, we have:
h = Y b
where
h = [ h ( θ 1 , ϕ 1 ) , h ( θ s , ϕ s ) ] T Y = [ y 00 , y 1 1 , y 10 , y l l ] Y l k = [ Y l k ( θ 1 , ϕ 1 ) , Y l k ( θ s , ϕ s ) ] T b = [ b 00 , b 1 1 , b 10 , b l l ] .
In Equation (4), h contains the original magnitude values on S spatial directions, Y contains SH base values of up to order L, and b is the SH coefficients. To calculate the vector b, we use the least-squares (LS) approach the decomposition coefficients. That is:
b = ( Y T Y + λ I ) 1 Y T h
The spherical harmonic coefficient b includes the spatial orientation characteristics of the HRTF at a certain position in space, and the reconstructed HRTF at a certain position can be obtained by multiplying the spherical harmonic coefficient and the spherical harmonic basis function.
Ref. [23] proposes and verifies that the HRTF model based on 4th order SH can retain accurate localization performance. The audience is not sensitive to fine spectral details in the HRTF amplitude spectrum. Therefore, in the method of this paper, the truncation order of SH is set to L = 4, the amplitude operation is performed on the HRTF of the subject, and the SHT is performed for each frequency to obtain the corresponding SH base coefficients (b vector). Finally, the b vector of each frequency bin is connected as a reference value for the model.

3.2.2. Implementation Details

In this paper, we adopt the SOFA format data provided by the HRTF dataset. SOFA is a file format for storing spatially oriented acoustic data like head-related transfer functions (HRTFs) and binaural or spatial room impulse responses (BRIRs, SRIRs). SOFA has been standardized by the Audio Engineering Society (AES) as AES69-2015. Establish a spherical coordinate system in which the azimuth θ and elevation ϕ represent the spatial position. For statistical and perceptual feasibility, we obtain HRTFs by 256-point discrete Fourier transform of HRIRs, and employ log-magnitude spectra to further compensate for the perceptual sensitivity of loudness.
Since the size of anthropometric data is different, the auricle parameters of small data may have less impact on deep learning than head and torso parameters. Therefore, ignoring the subject, using the mean and variance of all training data, and using the sigmoid function to normalize each input element of the model, we obtain:
z i ¯ = ( 1 + e ( z i μ i ) σ i ) 1
where z i is the i-th component of the input and normalized feature vector, and μ i and σ i are the mean and standard deviation of all the training subjects, respectively.

3.2.3. Architecture Used to Obtain SH Coefficients

The model uses a back-propagation algorithm to update the weights by minimizing the MSE between the reference value (SH coefficients) and the estimated value. During this process, the Adam optimization technique was used to apply 1st order moment decay rates and 2nd order moment decay rates of 0.9 and 0.999, and the learning rate was set to 0.0003. At the same time to improve the convergence speed and prevent over-fitting, layer normalization and Max Pooling layer are applied after each 1D-CNN. Finally, the configured model was trained for 1000 epochs.

4. Performance and Evaluation

In this section, we objectively evaluate the proposed personalized HRTF estimation method. To avoid confusion, the performance of the proposed method is compared with other HRTF estimation methods: (1) an HRTF estimation method based on our model but using accurate pinna measurements instead of ear images (using 27 parameters), called “Full-measurements HRTF”; (2) an HRTF estimation method using average HRTF of 32 subjects, called “Average HRTF”; (3) Towards Fast And Convenient End-To-End HRTF [38], called “TFACE HRTF”; and (4) the proposed method is called “Proposed HRTF”.
All methods are implemented using Pytorch version 2.4.0 and Python version 3.8.0. The CIPIC dataset includes HRTF (left ear) of 32 subjects, 17 head and torso measurements, and left ear images of subjects. Due to the small amount of data in the dataset, to avoid the problem of over-fitting, this paper divides the data into a training set and test set through “leave-one-out validation”, and then conducts 32 cross-validation rounds and takes the average of the validation results.

4.1. Objective Evaluation

The spectral distortion (SD) error was used to evaluate the accuracy of personalized HRTF. The indicator is defined as follows:
S D ( d ) ( H , H ^ ) = 1 K k = f m i n f m a x ( 20 log 10 H ( k ) d H ^ ( k ) d ) 2
where H ( k ) d and H ^ ( k ) d denote the magnitude of the true HRTF and the predicted HRTF in direction d, k presents the frequency, f m i n = 3 kHz and f m a x = 15 kHz, with K being the total frequency points. The pinna usually affects the personalized HRTF in the range of 3∼15 kHz, and the magnitude of the low-frequency HRTF is generally flat, the SD value of the low-frequency should be discarded. Hence, this paper only calculates the average SD value in the frequency range 3∼15 kHz, that is, the frequency index is 9–44.
Then we cover the entire discrete space and use global SD to evaluate global performance.
S D ( H , H ^ ) = 1 D d = 1 D L S D ( d ) ( H , H ^ )
where D is the number of directions.

4.2. Ear Model Results

The state-of-the-art networks are compared with a 3-layer simple Convolutional Network (SimpleNet) to verify the effectiveness of transfer learning, while selecting the best performing network to extract ear features from images. Table 1 presents the comparison of these networks in terms of parameters and depths.
Figure 8 shows the Cumulative Match Characteristic (CMC) curves of the algorithms mentioned in Table 1 on the test set. The CMC curve [39] is a vital evaluation index for pattern recognition systems such as the face, fingerprint, etc. It can be seen from the figure that the Rank1 and Rank5 recognition rates of the VGG19 network are the highest, so the VGG-Ear model is established to extract ear features. Moreover, the recognition rates of the transfer learning models are higher than that of the direct convolutional network (SimpleNet).

4.3. SHT Reconstruction Results

To demonstrate the validity of SHT to represent full-space HRTF, this paper plots the result of SHT performed at approximately 5 kHz for subject003 HRTF magnitude pattern. At the same time, we compare the original HRTF, the reconstructed HRTF (obtained through SHT), and another subject (subject010) HRTF, and calculate the root mean square error (RMSE).
Figure 9a shows the magnitude comparison of the original HRTF and the reconstructed HRTF of subject003 in 1250 directions, with an RMSE value of 0.19868 dB. It can be seen that due to the truncation of SHT, the reconstructed HRTF is smoother than the original value. According to previous studies, these minor spectral distortions are perceptually indistinguishable. Figure 9b shows the magnitude comparison of subject003 and subject010, which has an RMSE value of 0.63139 dB. This means that the reconstructed HRTF still has personalized features, which can be used to study personalized HRTF in this paper. Figure 9c shows the RMSE values of the original HRTF and the reconstructed HRTF at different frequencies. It can be seen that the reconstruction error varies with frequency, but still preserves individualized information. Figure 9d shows the magnitude comparison of the original HRTF and the reconstructed HRTF of subject003 at order L = 7, with an RMSE value of 0.14383 dB. Compared with Figure 9a, the higher the truncation order, the closer the reconstructed HRTF is to the original HRTF.

4.4. HRTF Personalization Results

To choose an appropriate truncation order L, this paper compares the “Full-measurements HRTF" personalization results when L = 4 and L = 7. Figure 10 shows the results of ( L + 1 ) 2 = 25 and ( L + 1 ) 2 = 64 SH coefficients. When L = 4 is used, the global SD is 5.22 dB, and the global SD is 5.78 dB when L = 7.
When L = 4 is used, the reconstructed HRTF is better. It is possible that the reason is that the CIPIC dataset is small, and the network structure should not be too deep. Thus, the larger the L value, the more accurate the SH coefficient needs to be predicted by the model, and the small model is difficult to learn. Therefore, this paper chooses L = 4 as the order.
Section 4.3 shows the effectiveness of spherical harmonic decomposition in fitting the global personalized HRTF at a single frequency. In order to prove the effectiveness of the method for modeling in the frequency range of the human ear audible range, Figure 11 shows a magnitude comparison of the measured, smoothed and predicted HRTF when ( θ , ϕ ) = (0,0). Among them, “Measured HRTF” is the result of the measured HRIR after 256 Fourier transform, “Smoothed HRTF” is the HRTF after the inverse transformation of the true spherical harmonic coefficients, and “Predicted HRTF” is the HRTF after inverse transformation of the predicted spherical harmonic coefficients by the model. Due to the difference in the number of sampling points, it can be seen that “Measured HRTF” is more refined, and the HRTF generated by the model is similar to “Smoothed HRTF”, but both lost some details.
The global performance comparison of this method with other methods is given in Table 2. The HRTF obtained by the proposed method has an SD of 5.31 dB compared to the original HRTF, and an SD of 4.47 dB compared to the smoothed HRTF. In particular, SD only drops by 1.7% compared to the Full-measurements HRTF. Note that the Full-measurements HRTF is obtained using precise pinna measurements, which are practically difficult to obtain from the human ear. Compared with using the average HRTF, the SD of the HRTF estimated by both methods based on our model is greatly reduced. Compared to TFACE HRTF, which also uses pinna images, our model provides SD values with the same error level for each subject and provides a global personalized HRTF.
Figure 12 presents the global SD values of the proposed method on 32 subjects. It can be seen that the global SD value of the proposed method is 5.31 dB, the highest is 6.95 dB, and the lowest is 4.39 dB.

5. Summary

With the continuous development of mobile and wearable devices [40], the personalized HRTF will greatly enhance the human auditory perception of audio. This paper proposes a deep learning model for global HRTF personalization, using features extracted from ear images to replace pinna measurements, combining head and torso measurements and frequency index to predict SH coefficients, and finally using spherical harmonic transform as a compact representation of HRTF. With only one training, the HRTF in all directions can be obtained, which greatly reduces the parameters and training cost of the model.
The paper uses leave-one-out validation to evaluate the performance of the model and compares the proposed method with multiple methods. Our results show that predicted HRTFs can generate HRTFs with the same level of error for all subjects. Moreover, after using ear images instead of precise pinna parameters that are difficult to measure, the global SD value increased by only 1.7% (0.09 dB), which is still a good result compared to the average HRTF. In future work, the impact of HRTF database size on the performance of the proposed method will be further investigated.

Author Contributions

Writing—original draft, M.Z.; Writing—review & editing, Z.S. and Y.F. All authors have read and agreed to the published version of the manuscript.

Funding

This article is supported by Science and Technology Commission of Shanghai Municipality, the key technology research of spherical harmonic domain panoramic audio (16010500100).

Institutional Review Board Statement

Not applicable.

Informed Consent Statement

Not applicable.

Data Availability Statement

Not applicable.

Conflicts of Interest

The authors declare no conflict of interest.

References

  1. Wu, X.; Talagala, D.S.; Zhang, W.; Abhayapala, T.D. Individualized interaural feature learning and personalized binaural localization model. Appl. Sci. 2019, 9, 2682. [Google Scholar] [CrossRef]
  2. Blauert, J.; Hearing, S. The psychophysics of human sound localization. In Spatial Hearing; MIT Press: Cambridge, MA, USA, 1997. [Google Scholar]
  3. Xie, B. Head-Related Transfer Function and Virtual Auditory Display, 2nd ed.; J. Ross Publishing: Plantation, FL, USA, 2013. [Google Scholar]
  4. Howard, D.M.; Angus, J. Acoustics and Psychoacoustics, 4th ed.; J. Ross Publishing: Waltham, MA, USA, 2009. [Google Scholar]
  5. Møller, H.; Sørensen, M.F.; Jensen, C.B.; Hammershøi, D. Binaural technique: Do we need individual recordings? J. Audio Eng. Soc. 1996, 44, 451–469. [Google Scholar]
  6. Shu-Nung, Y.; Chen, L.J. HRTF adjustments with audio quality assessments. Arch. Acoust. 2013, 38, 55–62. [Google Scholar]
  7. Gardner, W.G.; Martin, K.D. HRTF measurements of a KEMAR. J. Acoust. Soc. Am. 1995, 97, 3907–3908. [Google Scholar] [CrossRef]
  8. Majdak, P.; Balazs, P.; Laback, B. Multiple exponential sweep method for fast measurement of head-related transfer functions. J. Audio Eng. Soc. 2007, 55, 623–637. [Google Scholar]
  9. Li, S.; Peissig, J. Measurement of head-related transfer functions: A review. Appl. Sci. 2020, 10, 5014. [Google Scholar] [CrossRef]
  10. Zotkin, D.N.; Duraiswami, R.; Davis, L.S.; Mohan, A.; Raykar, V. Virtual audio system customization using visual matching of ear parameters. Object recognition supported by user interaction for service robots. In Proceedings of the 2002 International Conference on Pattern Recognition, Quebec City, QC, Canada, 11–15 August 2002; IEEE: Piscataway, NJ, USA, 2002; Volume 3, pp. 1003–1006. [Google Scholar]
  11. Torres-Gallegos, E.A.; Orduna-Bustamante, F.; Arámbula-Cosío, F. Personalization of head-related transfer functions (HRTF) based on automatic photo-anthropometry and inference from a database. Appl. Acoust. 2015, 97, 84–95. [Google Scholar] [CrossRef]
  12. Kahana, Y.; Nelson, P.A.; Petyt, M.; Choi, S. Numerical modelling of the transfer functions of a dummy-head and of the external ear. In Proceedings of the Audio Engineering Society Conference: 16th International Conference: Spatial Sound Reproduction, Rovaniemi, Finland, 10–12 April 1999; Audio Engineering Society: New York, NY, USA, 1999. [Google Scholar]
  13. Katz, B.F. Boundary element method calculation of individual head-related transfer function. I. Rigid model calculation. J. Acoust. Soc. Am. 2001, 110, 2440–2448. [Google Scholar] [CrossRef]
  14. Otani, M.; Ise, S. Fast calculation system specialized for head-related transfer function based on boundary element method. J. Acoust. Soc. Am. 2006, 119, 2589–2598. [Google Scholar] [CrossRef] [PubMed]
  15. Lei, W.; Xiangyang, Z. New method for synthesizing personalized head-related transfer function. In Proceedings of the 2016 IEEE International Workshop on Acoustic Signal Enhancement (IWAENC), Xi’an, China, 13–16 September 2016; IEEE: Piscataway, NJ, USA, 2016; pp. 1–5. [Google Scholar]
  16. Grijalva, F.; Martini, L.; Florencio, D.; Goldenstein, S. Deep neural network based HRTF personalization using anthropometric measurements. IEEE/ACM Trans. Audio Speech Lang. Process. 2016, 24, 559–570. [Google Scholar] [CrossRef]
  17. Qi, W.; Su, H. A cybertwin based multimodal network for ecg patterns monitoring using deep learning. IEEE Trans. Ind. Inform. 2022, 18, 6663–6670. [Google Scholar] [CrossRef]
  18. Chun, C.J.; Moon, J.M.; Lee, G.W.; Kim, N.K.; Kim, H.K. Deep neural network based HRTF personalization using anthropometric measurements. In Proceedings of the Audio Engineering Society Convention 143, New York, NY, USA, 18–21 October 2017; Audio Engineering Society: New York, NY, USA, 2017. [Google Scholar]
  19. Lee, G.W.; Kim, H.K. Personalized HRTF modeling based on deep neural network using anthropometric measurements and images of the ear. Appl. Sci. 2018, 8, 2180. [Google Scholar] [CrossRef]
  20. Ben-Hur, Z.; Alon, D.L.; Mehra, R.; Rafaely, B. Binaural reproduction based on bilateral Ambisonics and ear-aligned HRTFs. IEEE/ACM Trans. Audio Speech Lang. Process. 2021, 29, 901–913. [Google Scholar] [CrossRef]
  21. Wang, Y.; Zhang, Y.; Duan, Z.; Bocko, M. Global HRTF Personalization Using Anthropometric Measures. In Proceedings of the Audio Engineering Society Convention 150, Online, 25–28 May 2021; Audio Engineering Society: New York, NY, USA, 2021. [Google Scholar]
  22. Kulkarni, A.; Colburn, H.S. Role of spectral detail in sound-source localization. Nature 1998, 396, 747–749. [Google Scholar] [CrossRef] [PubMed]
  23. Romigh, G.D.; Brungart, D.; Stern, R.M.; Simpson, B.D. The role of spatial detail in sound-source localization: Impact on HRTF modeling and personalization. In Proceedings of the Meetings on Acoustics ICA2013, Montreal, QC, Canada, 2–7 June 2013; Acoustical Society of America: Melville, NY, USA, 2013; Volume 19, p. 050170. [Google Scholar]
  24. Algazi, V.R.; Duda, R.O.; Thompson, D.M.; Avendano, C. The cipic hrtf database. In Proceedings of the 2001 IEEE Workshop on the Applications of Signal Processing to Audio and Acoustics (Cat. No. 01TH8575), New Platz, NY, USA, 21–24 October 2001; IEEE: Piscataway, NJ, USA, 2001; pp. 99–102. [Google Scholar]
  25. Emeršič, Ž.; Štruc, V.; Peer, P. Ear recognition: More than a survey. Neurocomputing 2017, 255, 26–39. [Google Scholar] [CrossRef]
  26. Emeršič, Ž.; Gabriel, L.L.; Štruc, V.; Peer, P. Convolutional encoder–decoder networks for pixel-wise ear detection and segmentation. IET Biom. 2018, 7, 175–184. [Google Scholar] [CrossRef]
  27. Emeršič, Ž.; Meden, B.; Peer, P.; Štruc, V. Evaluation and analysis of ear recognition models: Performance, complexity and resource requirements. Neural Comput. Appl. 2020, 32, 15785–15800. [Google Scholar] [CrossRef]
  28. Wen, Y.; Zhang, K.; Li, Z.; Qiao, Y. A discriminative feature learning approach for deep face recognition. In Proceedings of the European Conference on Computer Vision, Amsterdam, The Netherlands, 8–16 October 2016; Springer: Berlin, Germany, 2016; pp. 499–515. [Google Scholar]
  29. Redmon, J.; Divvala, S.; Girshick, R.; Farhadi, A. You only look once: Unified, real-time object detection. In Proceedings of the IEEE Conference on Computer Vision and Pattern Recognition, Las Vegas, NV, USA, 27–30 June 2016; pp. 779–788. [Google Scholar]
  30. Emeršič, Ž.; Playà, N.O.; Štruc, V.; Peer, P. Towards accessories-aware ear recognition. In Proceedings of the 2018 IEEE International Work Conference on Bioinspired Intelligence (IWOBI), San Carlos, Alajuela, Costa Rica, 18–20 July 2018; IEEE: Piscataway, NJ, USA, 2018; pp. 1–8. [Google Scholar]
  31. Alshazly, H.; Linse, C.; Barth, E.; Martinetz, T. Ensembles of deep learning models and transfer learning for ear recognition. Sensors 2019, 19, 4139. [Google Scholar] [CrossRef]
  32. Simonyan, K.; Zisserman, A. Very deep convolutional networks for large-scale image recognition. arXiv 2014, arXiv:1409.1556. [Google Scholar]
  33. He, K.; Zhang, X.; Ren, S.; Sun, J. Deep residual learning for image recognition. In Proceedings of the IEEE Conference on Computer Vision and Pattern Recognition, Las Vegas, NV, USA, 27–30 June 2016; pp. 770–778. [Google Scholar]
  34. Szegedy, C.; Liu, W.; Jia, Y.; Sermanet, P.; Reed, S.; Anguelov, D.; Erhan, D.; Vanhoucke, V.; Rabinovich, A. Going deeper with convolutions. In Proceedings of the IEEE Conference on Computer Vision and Pattern Recognition, Boston, MA, USA, 7–12 June 2015; pp. 1–9. [Google Scholar]
  35. Chollet, F. Xception: Deep learning with depthwise separable convolutions. In Proceedings of the IEEE Conference on Computer Vision and Pattern Recognition, Honolulu, HI, USA, 21–26 July 2017; pp. 1251–1258. [Google Scholar]
  36. Howard, A.G.; Zhu, M.; Chen, B.; Kalenichenko, D.; Wang, W.; Weyand, T.; Andreetto, M.; Adam, H. Mobilenets: Efficient convolutional neural networks for mobile vision applications. arXiv 2017, arXiv:1704.04861. [Google Scholar]
  37. Nair, V.; Hinton, G.E. Rectified linear units improve restricted boltzmann machines. In Proceedings of the ICML’10: 27th International Conference on Machine Learning, Haifa, Israel, 21–24 June 2010. [Google Scholar]
  38. Zhi, B.; Zotkin, D.N.; Duraiswami, R. Towards Fast And Convenient End-To-End HRTF Personalization. In Proceedings of the ICASSP 2022–2022 IEEE International Conference on Acoustics, Speech and Signal Processing (ICASSP), Singapore, 22–27 May 2022; IEEE: Piscataway, NJ, USA, 2022; pp. 441–445. [Google Scholar]
  39. Wang, M.; Deng, W. Deep Face Recognition: A Survey. arXiv 2018, arXiv:1804.06655. [Google Scholar] [CrossRef]
  40. Qi, W.; Aliverti, A. A multimodal wearable system for continuous and real-time breathing pattern monitoring during daily activity. IEEE J. Biomed. Health Inform. 2019, 24, 2199–2207. [Google Scholar] [CrossRef] [PubMed]
Figure 1. Location of sampling points: (a) front view and (b) side view [24].
Applsci 12 08155 g001
Figure 2. Anthropometric measurements: (a) head and torso measurements and (b) pinna measurements [24].
Applsci 12 08155 g002
Figure 3. An example of the AWE ear database [25].
Applsci 12 08155 g003
Figure 4. Augmentation example.
Applsci 12 08155 g004
Figure 5. The architecture diagram of the VGG-Ear.
Applsci 12 08155 g005
Figure 6. Block diagramof a deep learning network for predicting SH coefficients.
Applsci 12 08155 g006
Figure 7. Spherical harmonic bases up to L = 4.
Applsci 12 08155 g007
Figure 8. CMC curve.
Applsci 12 08155 g008
Figure 9. Magnitude comparison: (a) Original HRTF and reconstructed HRTF of subject003 at 5 kHz, (b) Original HRTF of subject003 and subject010 at 5 kHz, (c) RMSE of the original HRTF and reconstructed HRTF at different frequencies, and (d) Original HRTF and reconstructed HRTF at L = 7.
Applsci 12 08155 g009
Figure 10. Coefficients of the SH basis: (a) L = 4 and (b) L = 7.
Applsci 12 08155 g010
Figure 11. Magnitude comparison of measured, smoothed, and predicted at the frontal direction, where ( θ , ϕ ) = (0,0).
Applsci 12 08155 g011
Figure 12. Spectral distances for different subjects.
Applsci 12 08155 g012
Table 1. Comparison of state-of-the-art models in terms of parameters and depths.
ModelTrainable ParametersNon Trainable ParametersNo. of Layers
VGG1951,81320,024,38419
ResNet50206,94923,587,71250
InceptionV3206,94921,802,784159
Xception54,52820,861,480126
MobileNet103,5253,228,86428
SimpleNet19,39203
Table 2. Comparing Global SD of Different Methods.
MethodsGlobal SD
Average HRTF7.61 dB
Full-measurements HRTF5.22 dB
TFACE HRTF5.31 ± 3.154 dB
Proposed HRTF5.31 dB
Publisher’s Note: MDPI stays neutral with regard to jurisdictional claims in published maps and institutional affiliations.

