Abstract
Over the past few years, Internet applications have become more advanced and widely used. This has increased the need for Internet networks to be secured. Intrusion detection systems (IDSs), which employ artificial intelligence (AI) methods, are vital to ensuring network security. As a branch of AI, deep learning (DL) algorithms are now effectively applied in IDSs. Among deep learning neural networks, the convolutional neural network (CNN) is a well-known structure designed to process complex data. The CNN overcomes the typical limitations of conventional machine learning approaches and is mainly used in IDSs. Several CNN-based approaches are employed in IDSs to handle privacy issues and security threats. However, there are no comprehensive surveys of IDS schemes that have utilized CNN to the best of our knowledge. Hence, in this study, our primary focus is on CNN-based IDSs so as to increase our understanding of various uses of the CNN in detecting network intrusions, anomalies, and other types of attacks. This paper innovatively organizes the studied CNN-IDS approaches into multiple categories and describes their primary capabilities and contributions. The main features of these approaches, such as the dataset, architecture, input shape, evaluated metrics, performance, feature extraction, and classifier method, are compared. Because different datasets are used in CNN-IDS research, their experimental results are not comparable. Hence, this study also conducted an empirical experiment to compare different approaches based on standard datasets, and the comparative results are presented in detail.
1. Introduction
Worldwide economic and business progress is directly tied to the Internet and enterprise networks. Furthermore, cyber-attacks are becoming increasingly common, which is a significant security concern [1,2]. For this reason, technicians and network security specialists are paying increasing attention to identifying network attacks [3]. Governments and private organizations require solutions offering stable performance in protecting the information assets they hold from any unlawful or unwanted access and in preventing and detecting intrusions [4]. The term “intrusion detection system” (IDS) refers to a system that monitors and categorizes network flows to determine whether they are the typical (normal) activity that frequently occurs in a network or activity that could threaten the security of information systems.
Denning [5] proposed developing an IDS that would employ artificial intelligence (AI) methodologies to detect abnormal flows and potential intrusions. This approach founded a new branch of IDS, which was developed using learning algorithms. In the past 30 years, various research has employed machine learning methods to investigate the use of IDSs to automatically identify normal and abnormal flows in systems and networks. However, high false alarm and low detection rates still affect IDS solutions.
A branch of artificial intelligence known as deep learning (DL) has become broadly utilized in the fields of classification and pattern recognition [3,6,7]. In general, deep learning applies multiple information-processing layers within a hierarchical design. Furthermore, deep learning is a hot research topic, meaning that several deep neural network (DNN) architectures, such as convolutional neural networks (CNNs) [8]; recurrent neural networks (RNNs) [9]; deep belief nets (DBNs); and autoencoders, including sparse, denoising [10], contractive [11], and variational autoencoders, have been investigated and published. Among the different deep learning algorithms, CNN is effective in complex tasks, such as identifying faces and objects and operating self-driving cars. Therefore, many researchers have attempted to apply CNN to solve the puzzle of IDS.
Although CNN has been employed for intrusion detection systems in several papers, there is no comprehensive survey paper on CNN-based IDSs, according to the best of our knowledge. Therefore, our first motivation is to provide a complete survey of the literature that addresses original, enhanced, or hybrid CNNs. Secondly, to represent additional perceptions regarding the reviewed approaches, their most important properties, such as the dataset, architecture, input shape, evaluated metrics, performance, feature extraction method, and classifier, are presented and explained. The third motivation of this study is to compare the CNN schemes used in the research works. However, our challenge is that researchers used different datasets, and thus, such a comparison is not feasible. To overcome this challenge, we conducted an empirical experiment on famous CNN-based approaches by using standard datasets and applied these experimental results for comparison purposes in this research.
The present paper is structured in the following way: The background of the study is presented in Section 2. The performance metrics used to measure model performance in IDSs are discussed in Section 3. Subsequently, in Section 4, the IDS schemes that employed CNNs are investigated and compared. An analytical investigation is presented in Section 5, and an empirical experiment is shown in Section 6. Finally, the conclusion, research directions, and gaps are given in Section 7, in which ongoing challenges related to CNN-based intrusion detection are highlighted.
2. Research Method
To achieve the goals of this research, a systematic methodology was applied. First, we defined the research questions and search terms, and then we searched scientific libraries and performed quality assessments of the schemes. To identify search terms, we studied some survey papers [12,13,14] that reviewed deep learning-based IDSs, and we used the research methodology to conduct our research. The above survey papers answer many research questions on deep learning-based IDSs. However, CNN is one of the most important breakthroughs in deep learning; therefore, our decision is to focus on CNN-based IDSs.
Multiple research questions are posed on the topic of CNN-based intrusion detection schemes, which are covered in this study.
- How can the applied CNN-based IDS be categorized into multiple subcategories?
- How have CNNs been successfully applied to feature selection or feature extraction?
- What kinds of structures/networks/architectures have been applied to CNN methods?
- What methodologies have been used for classification and feature extraction?
- What ML/DL methods have been combined with CNN to create hybrid CNNs?
- What datasets are employed by IDS schemes?
- How can the CNN-based IDS be verified, and what evaluation metrics have been employed in IDS schemes?
- What are the current trends and accuracy results?
- What are the advantages and disadvantages of the CNN-based IDS approach?
Selecting the keywords was simple in our research, as we were looking for IDS schemes that used a CNN as the main contribution in their techniques. The main keywords that were chosen were IDS, intrusion detection, CNN, and convolutional neural networks, and we searched for four different possible combinations of these keywords.
After the search keywords were identified, multiple scientific libraries and platforms were used to search for the required papers, accessed on 1 June 2022: Web of Science (www.webofscience.com), Scopus (www.scopus.com), EBSCOhost (www.ebsco.com), IEEE Explorer (www.ieeexplore.ieee.org), and Science Direct (www.sciencedirect.com).
After searching the libraries and platforms using the defined keywords, several scientific publications were found. However, only journals or conference papers were selected. Accordingly, we chose a subset of relevant and valuable articles for our survey by conducting a quality assessment and skimming the abstracts. However, among the selected papers, some were unsuitable and removed from the survey. To perform the quality assessment, these criteria were considered:
- Is the paper focused on intrusion detection?
- Does the paper have any contribution to the CNN-based IDS context?
- Was a complete set of experiments applied to confirm the suggested method?
Figure 1 exhibits the taxonomy of the CNN-based IDSs established in the searched papers. As shown in this figure, we divided the methods based on environmental D at the first level. The applications include the Internet of Things (IoT), software-defined networking (SDN), in-vehicle networks, smart homes, cloud security, advanced metering infrastructure (AMI), Spark platform, wireless, industrial control system (ICS), and NIDS. Hybrid methods combine one or more machine learning, deep learning, or soft computing methods with a CNN. Then, the single or hybrid CNN can be applied for each environmental application. In contrast, other methods, such as dimensional reduction and feature selection, are categorized as single CNNs. For example, hybrid LSTM means that the authors used the hybrid CNN-LSTM, but single PCA means that the authors used a single CNN and PCA for dimensionality reduction. Each leaf in the taxonomy shows the selected papers for that category.
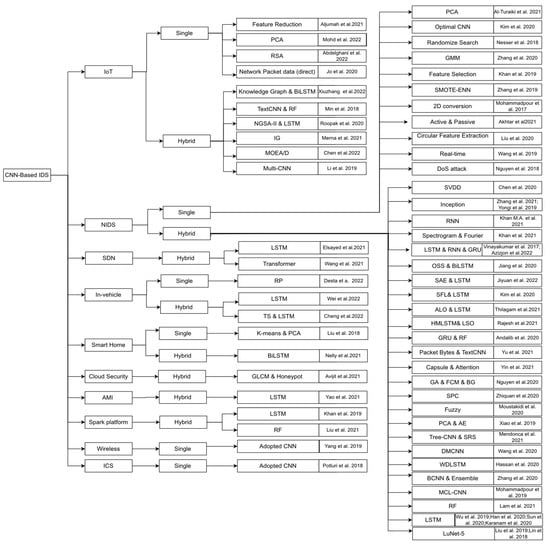
Figure 1.
Taxonomy of CNN-based IDSs [3,15,16,17,18,19,20,21,22,23,24,25,26,27,28,29,30,31,32,33,34,35,36,37,38,39,40,41,42,43,44,45,46,47,48,49,50,51,52,53,54,55,56,57,58,59,60,61,62,63,64,65,66,67,68,69,70,71,72,73,74,75,76,77,78].
3. Background of Study
In this section, firstly, a brief introduction to deep learning is presented; then, the CNN is extensively explained, the RNN is presented, and finally, popular datasets used in CNN-IDS schemes are discussed.
3.1. Deep Learning
Many definitions of deep learning have been put forward by different researchers. Nonetheless, they all have commonalities and common keywords, such as “complex architectural data model”, “unsupervised machine learning”, “learning multiple layers”, and “nonlinear data transformations.” These key terminologies are all closely associated with neural networks and pattern recognition [79]. In general, deep learning does not require pre-selected features, which overcomes the issue of feature selection because deep learning automatically extracts significant features from raw input to address the problem at hand [80,81]. Deep learning models usually involve various processing layers consisting of multiple abstraction levels, enabling the system to learn various data features. The inclusion of multiple levels allows the network to remember distinct features. Deep learning has been widely recognized as an approach that generates promising outcomes in various fields, including image recognition, speech recognition, face recognition, language translation, topic classification, sentiment analysis, signal processing, and natural language processing [82,83,84,85,86,87,88]. Moreover, many different deep learning architectures have been developed, such as DBNs, RNNs, and CNNs.
3.2. Convolutional Neural Network
A CNN is a deep learning model used to process data such as images, and it is based on the arrangement of the animal visual cortex [89]. It is primarily designed to automatically and adaptively learn the spatial hierarchies of features in low- to high-level patterns [90]. It has been proven to be effective in several tasks, including face identification, object identification, and traffic sign detection, most notably in robotics and self-driving cars [15,16]. Minimizing the number of parameters in an ANN is the most critical aspect of a CNN, which has motivated developers and researchers to focus on larger models that can be used to solve complicated tasks, which is impossible with traditional ANNs [91].
The key purpose of a CNN is to learn the relevant features of the input data. In this process, the initial layers are a set of convolutional feature extractors that are subjected to learnable filters. The applied filters serve as a sliding window that moves across every piece of input data. In this case, the overlapping distance is referred to as the stride, with the outputs being known as feature maps. Convolutional kernels make up each CNN layer, which is used to make different feature maps. Neighboring neuron areas are connected to a neuron in the next layer’s feature map. To create a feature map, the kernel must be shared across all spatial locations of the input. After the convolutional and pooling layers have been established, one or several fully connected layers are utilized to finish the classification [92,93,94,95]. As an example, Figure 2 illustrates the layers of the LeNet CNN architecture, in which each box represents a different feature map [17].
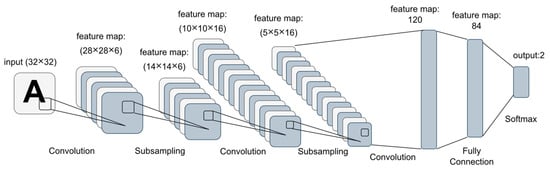
Figure 2.
The layer structure of the LeNet architecture (example of CNN-based model).
The following equation represents the convolutional operation across the input feature maps and convolutional layers in CNN architectures:
where represents a 2D convolution, and denotes the output of the feature map in the hidden layer. Meanwhile, denotes the channel of the hidden layer, represents the weights of the channel in the filter of the layer, and denotes the relevant bias term. Collecting multiple convolutional layers creates a vast number of feature maps, and to reduce the dimensionality of these properties, an additional layer is usually added to the convolutional layers. This is known as a pooling layer, and it helps to minimize the computational expense needed to train a network, as well as reduce the chances of overfitting.
To complete the training of a CNN, an iterative algorithm is applied that moves between feed-forward and backpropagation data motions. The convolutional filters and fully connected layers are modified during each iteration of the backpropagation process. The key purpose is to reduce the average loss for all of the true class labels and the network outputs. For example,
where represents the true label, and represents the network output of the input in the class. Moreover, denotes the training input, and denotes the neurons in the output layer. To reduce the average loss, several solutions have been proposed [96,97,98], with stochastic gradient descent (SGD) and adaptive moment estimation (Adam) [18,98] being two of the most widely applied. In the remainder of this section, the important components (layers) of the CNN are explained in more detail.
3.2.1. Convolutional Layers
The name CNN was developed from convolution operations. The convolutional layer plays a critical role in the CNN architecture because it is the component that carries out feature extraction. The layer usually contains both linear and nonlinear operations, i.e., a convolution operation and an activation function [90]. Additionally, convolution operations apply a filter (or kernel) to protect the spatial relationship between pixels by using learning features. The terms “activation map”, “convolved feature”, and “feature map” are used to describe the data produced during a convolution operation. When a CNN is training to learn the features of a new input more effectively, the values of the kernel are automatically modified. The dimensional values of depth (i.e., the number of filters applied), stride (i.e., the number of pixels by which the filter slides), and zero padding (i.e., padding data with zeros at the border) determine the size of the feature map.
It is assumed that the input of the neural network is a color image measuring 32 × 32 × 3 pixels in width, height, and depth; thus, to ensure that the input layer is only connected to one neuron, the weight connections must be 32 × 32 × 3. However, if the same values of height and width are used to connect the input image to the neurons in the subsequent layer, 3,145,728 weight connections are required because the input layer and the subsequent layer should have 32 × 32 × 3 = 3072 and 32 × 32 = 1024 neurons, respectively. Moreover, as the second layer is dense, the number of required weights is 3072 × 1024 = 3,145,728.
A more efficient method is thus needed, and identifying local regions in the image rather than the entire image may be more efficient than the previously described method. In terms of the convolutional layer, the hidden neurons in the next layer can only receive inputs from the corresponding (neighbor regions) section of the preceding layer. For instance, the layer can only be connected to 5 × 5 neurons. Therefore, referring back to the example dimensions presented above, the size of the connection decreases significantly from 3,145,728 to 76,800. In the convolutional layer, the weight of the filter is shared; therefore, the number of weights is 3072 × (5 × 5) = 76,800.
Another advantage of this approach is that fixing the weights for the local connections represents the actions of a sliding window measuring 5 × 3 in the input neurons and mapping the output in the corresponding location. This enables features to be recognized and identified wherever they are located in the input data [91].
The key purpose of using a convolutional layer to train a CNN model is to enable the most efficient and suitable kernels for a given task to be determined based on the training dataset provided. Kernels are the only parameters that are learned automatically in the convolutional layer during training. This process is demonstrated in Table 1, which outlines the kernel sizes, numbers, padding, and strides as the hyperparameters that must be established before training can be initiated [90]. In addition, a list of parameters and hyperparameters of a CNN is presented in Table 1.

Table 1.
List of parameters and hyperparameters in a CNN. (Data from Rikiya Yamashita et al. [90], Insights into Imaging, published by Springer Nature, 2018).
3.2.2. Pooling Layers
The downsampling operation implemented by the pooling layer usually decreases the feature maps’ in-plane dimensionality, which in turn introduces translation invariance to small movements and distortions. It also reduces the number of subsequent learnable parameters. Interestingly, there are no learnable parameters in any of the pooling layers. Nonetheless, just like the convolutional layer, filter size, stride, and padding serve as hyperparameters [90]. Many features still remain after the convolutional layer, which makes the network very complex. The pooling layer must thus be able to undersample the features to make the network less complex and to prevent overfitting. Max-Pooling and Average Pooling are the most widely applied pooling methods in CNN systems [99]. In Max-Pooling (Equation (3)), the maximum value of all neurons in a specific region (R) is taken to represent the output of the entire region [15]:
Typically, the pooling layer follows the convolutional layer. Its key purpose is to decrease the size of the feature matrix, enhance training speed, and minimize parameters to avoid overfitting issues. The input of the pooling layer is divided into different regions based on its size. In Max-Pooling, the maximum value in each region is chosen to represent the region, while in Average Pooling, the mean value of the region is taken to represent the entire region [17].
3.2.3. Fully Connected Layers
The term “fully connected” (FC) implies that each neuron in the preceding layer is linked to a neuron in the subsequent layer. Usually, the output feature map for the final convolutional or pooling layer is flattened, meaning it is presented as a one-dimensional set of numbers (or vectors), which are connected to one or multiple fully connected layers, sometimes referred to as dense layers. In these layers, each input is linked to an output based on a learnable weight. After the features have been extracted in the convolutional layers and, subsequently, downsampled in the pooling layer, they can be mapped using the fully connected layers. This enables the final outputs of the network (i.e., the probabilities for each class) to be determined. Usually, the fully connected layer tends to be followed by a SoftMax classifier (or another type of classifier), where a SoftMax classifier typically has a total of n neurons, with n denoting the number of classes [17,90].
3.3. Recurrent Neural Networks
Recurrent neural networks (RNNs) are enhanced versions of feed-forward neural networks that can memorize data at each step for subsequent outputs. In an RNN, the output of neurons is connected to the input of other neurons and themselves. Therefore, RNNs can model data sequences and time series using their internal memory [100]. In IDSs, RNNs are generally employed to extract temporal correlations between security attacks and malicious behaviors (temporal features), whereas CNNs extract spatial features.
RNNs are implemented in different architectures; among them, the long short-term memory (LSTM) model is well known and widely used in IDSs. In Figure 3, the original architecture of LSTM is depicted, where the input and output gates are indicated with dashed lines.
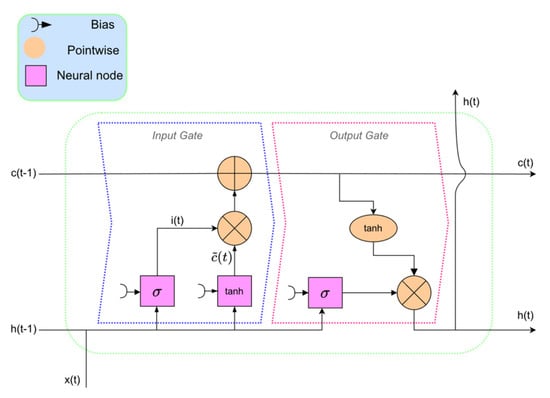
Figure 3.
The architecture of long short−term memory (LSTM).
3.4. IDS Datasets
In machine learning, a dataset is essentially a collection of data that a computer can manage as a single unit for analytic and prediction purposes. Thus, it is more effective if data can be made uniform so that machines can understand them similarly to humans. The present work discusses the most commonly employed datasets used by researchers when training and testing CNN-IDSs.
3.4.1. KDD Cup99
KDD Cup99 [101] is a standard dataset employed in IDSs. There are around 5 million records stored in the training set of the complete data and 2 million records in the testing set. However, it is important to note that only 10% of the KDD Cup99 dataset is used for training and testing purposes. Each record is labeled as being “normal” or an “attack.” Moreover, 10% of the dataset contains 38 types of attacks. Similar attacks are usually grouped into one category, which results in the formation of four primary attack categories: DoS, Probe, R2L, and U2R. Table 2 presents further information pertaining to the KDD Cup99 dataset [19].
Table 2.
KDD Cup99 dataset details.(Data from Liu and Jianbiao Zhang [19], Discrete Dynamics in Nature and Society, published by Hindawi, 2020).
3.4.2. NSL-KDD
NSL-KDD was developed to overcome the limitations of the KDD Cup99 dataset, and thus, it is nothing new. The KDD Cup99 dataset contains vast amounts of redundant records, with around 75 and 78% being duplicated in the testing and training datasets, respectively. Thus, this generates a bias in the learning algorithm. To address this issue, NSL-KDD was developed, which is a new version of the KDD Cup99 dataset. This new version is now widely used for anomaly detection. There are four files contained in this dataset, two of which are for training (“KDDTrain+” and “KDDTrain_20%”) and two of which are for testing (“KDDTest+” and “KDDTest-21”) [102,103,104]. The NSL-KSS training and testing datasets are shown in Table 3.
Table 3.
NSL-KDD training and testing dataset files [102].
3.4.3. UNSW-NB15
The UNSW-NB15 dataset, developed by the Australian Center for Cyber Security (ACCS), was initially introduced by Moustafa and Slay in 2015 [105,106] using the IXIA PerfectStorm tool. When using tcdump to create the dataset, a volume of 100 GB of raw network traffic was reached [16]. Altogether, 2.54 million network traffic samples are contained in this dataset, with nine categories dedicated to attacks. There are 49 features for each sample, with two being class label features. It is important to note that there are significant class imbalances in this dataset, where 87.35% of the entire dataset constitutes normal traffic, and 12.65% constitutes attack traffic [15].
3.4.4. CIC-IDS2017
On the other hand, the Canadian Institute for Cyber Security (CIC) assembled the CIC-IDS2017 dataset in 2017, aided by the B-Profile system [107,108]. Favorable and common attacks are contained in the dataset, which reflects true real-world data (PCAPs). The results relating to network traffic were analyzed using a CICFlowMeter, with flows being labeled according to their timestamps, destination ports, sources, destination IPs, protocols, and attacks (CSV files). The abstract behaviors of 25 users are contained in the CIC-IDS2017 benchmark dataset according to SSH, HTTP, FTP, and HTTPS. The data were collected between 9 a.m. on 3rd July 2017 and 5 p.m. on 7th July 2017; thus, the timeframe spanned five days. Normal activity was only reported on Monday, during which only benign traffic was circulated. However, several attempted attacks were carried out on other days, including brute force SSH, brute force FTP, Heartbleed, DoS, web attack, Botnet, infiltration, and DDoS. Of the 2,830,473 network traffic samples contained in the dataset, there are 1 benign and 14 attack categories. Benign traffic constitutes 80.30% of the data, while attack traffic constitutes 19.70%. The most common attacks are included (i.e., DoS, DDoS, Botnet, PortScan, and web attacks). The dataset extracted 84 features from the network traffic, with the final column being the multiclass category. Moreover, in comparison to publicly accessible datasets from 1998 to 2016, this dataset meets eleven performance assessment criteria.
3.4.5. CSE-CIC-DS2018
The Amazon Web Services platform developed the CSE-CIC-DS2018 [107] dataset, which displays network behavior in real time and includes multiple intrusion states. There are several intrusion profiles in the dataset that can be used for security purposes. These can be applied to a variety of topologies and network protocols. The dataset has 80 statistical properties, including volume, number of bytes, and packet length, all of which have been calculated in both forward and backward modes. Researchers can easily access the dataset online, with around 5 million records. It covers seven fundamental types of attacks, namely, Heartbleed, Infiltration, Brute-force DOS attacks, DDOS attacks, Brute-force SSH, Botnet, and web attacks [109,110].
4. Performance Metrics
It is impossible to visually interpret machine learning algorithms’ performance, meaning that quantitative metrics (e.g., PPV, TPR, F1, and confusion matrix) must be employed to perform assessments. As with other classification problems, the IDS task’s confusion matrix includes terminologies such as true positive (TP), false positive (FP), true negative (TN), and false negative (FN). In IDS tasks, TP, FP, TN, and FN typically refer to attack data that are correctly classified as an attack, normal data that are incorrectly classified as an attack, normal data that are correctly classified as normal, and attack data that are incorrectly classified as normal, respectively. Table 4 presents the terminologies and performance assessment measures employed in IDS studies. For additional clarification, all terminologies used for the same measurement are shown in the table.
Table 4.
The Equations and Explanations of Each Performance Measure.
The accuracy metric, which refers to the ratio of the total number of correct classifications, is widely utilized to measure performance. However, when we have an imbalanced dataset, accuracy is not a proper measurement technique. For example, assume that 99.9% of the dataset is labeled as “normal”, and accuracy is used to measure the model’s performance. If the model is biased to “0” and all testing samples (model output) are classified as normal, then the model accuracy will be 99.9%. In this example, the accuracy of 99.9% shows an excellent result, but obviously, this model is not delivering any valuable information. In this case, using other suitable evaluation metrics, such as Precision (specificity), Recall (sensitivity), or F1 Score (harmonic mean of Precision and Recall), can be helpful. Precision measures the number of correct classifications penalized by the number of incorrect classifications, Recall or sensitivity measures the number of correct classifications penalized by the number of missed entries, and the false alarm rate measures the proportion of benign events incorrectly classified as malicious. The F1 Score calculates the harmonic mean of Precision and Recall, which serves as a derived effectiveness measurement.
5. CNN-Based IDS Approaches
This section provides an in-depth look at the CNN-based IDS schemes proposed in the literature. The reviewed approaches are categorized into four groups, with the first involving approaches that employ only a CNN. Furthermore, group 2 contains IDS schemes that combine a CNN with an RNN. To do this, an RNN method such as long short-term memory (LSTM) or gated recurrent unit (GRU) must be employed. In this group, the temporal features are extracted through RNN algorithms. Meanwhile, group 3 contains IDS approaches that combine CNN and deep learning methods other than RNNs. Finally, group 4 includes IDS approaches that combine CNN with machine learning, fuzzy, Fourier transformation, clustering, or evolutionary algorithms.
The key features of CNN-based IDS approaches are outlined in Table 5, Table 6, Table 7, Table 8, Table 9, Table 10, Table 11 and Table 12. The tables present essential information, including “the year of publication”, “architecture”, “the simulators/environments (ENV)”, “input layer shape”, “datasets that are used for training and evaluation”, “performance (accuracy)”, “feature extraction method”, “classification method”, “performance metrics”, and “other methods used alongside the CNN.” In all of the tables below (Table 5, Table 7, Table 9, and Table 11), we use the notations in the ENV column, which are KT: Keras using the TensorFlow backend; KH: Keras using the Theano backend; T: TensorFlow; M: MATLAB; S: Scikit-learn; J: Java with Deeplearning4j; W: WEKA; and P: PyTorch.
Table 5.
Properties of group 1 (Single CNN-Based) IDS schemes.
Table 6.
Architectural properties of group 1 (Single CNN-Based) IDS schemes.
Table 7.
Properties of group 2 (Hybrid CNN and RNN) IDS schemes.
Table 8.
Architectural properties of group 2 (Hybrid CNN and RNN) IDS schemes.
Table 9.
Properties of group 3 (Hybrid CNN and Deep Learning) IDS schemes.
Table 10.
Architectural properties of group 3 (Hybrid CNN and Deep Learning) IDS schemes.
Table 11.
Properties of group 4 (Hybrid CNN and Machine Learning) IDS schemes.
Table 12.
Architectural properties of group 4 (Hybrid CNN and Machine Learning) IDS schemes.
5.1. Single CNN-Based Schemes
In this section, research that focuses on original and improved versions of CNNs without incorporating any other machine learning or deep learning algorithms is presented and discussed. Some researchers have investigated feature preprocessing, data reduction, feature fusion, and imbalanced data management; others have focused on enhancing the CNN algorithm.
A two-step preprocessing strategy was put forward by Al-Turaiki et al. [20], combining dimensionality reduction and feature engineering. Additionally, deep-feature synthesis was employed to create meaningful features. On the other hand, Lam et al. [21] employed statistical behaviors rather than typical anomalous attack behaviors because they are easier to compute and extract without jeopardizing efficiency.
According to Jo et al. [22], the input data of the CNN may perform better than other deep learning models in network IDSs if they can train the kernel to sufficiently reflect the network features. However, effective preprocessing is required for this; thus, the researchers recommended carrying out preprocessing using the “direct” method. This enables the network IDS to use the kernel’s features by employing the minimum protocol information, field size, and offset. They also recommend two other preprocessing methods: “weighted” and “compressed.” Additionally, network information is required to use these methods. The methods recommended by Jo et al. have been developed according to the field-to-pixel philosophy, which is beneficial to the CNN because it enables the convolutional characteristics of each pixel to be extracted. However, the direct method is the most intuitive technique for field-to-pixel conversion because it accurately reflects an image’s convolutional features in the CNN.
One specific DoS category was investigated in Kim et al.’s [20] work. They also examined how different attacks within the same category can be detected. To do this, they considered the hyperparameters for 18 scenarios, including the image type, kernel size, and several convolutional layers. They established binary and multiclass classifications for each scenario, after which they identified the best and highest-performing scenarios. Their findings indicated that the model with three convolutional layers and kernel sizes of 2 × 2 and 3 × 3 performed best. However, when the kernel size increased to 4 × 4, the model that involved two convolutional layers was the most accurate. Performance was generally high in multiclass classification when multiple convolutional layers were present. Nonetheless, kernel size did not appear to significantly affect binary or multiclass classifications.
A CNN architecture was proposed in the research performed by [18], which is called a means-convolutional layer (CNN-MCL). This layer functions by learning abnormal content features and detecting that specific anomaly in the future. The new CNN-MCL model enables a robust network intrusion detection system that involves a new type of convolutional layer that allows for low-level abnormal features to be learned. Table 5 compares the experimental information, including the authors, the year of publication, ENV, datasets that are used for training and evaluation performance (binary and multiclass accuracy results), and evaluation metrics for group 1 (Single CNN-Based IDS) schemes.
Table 6 compares architectural properties such as architecture, input layer shape, feature extraction method, other methods used alongside the CNN, and classification method for group 1 (Single CNN-Based IDS) schemes.
5.2. Hybrid CNN and RNN Schemes
RNNs rely on sequential data and can be used to extract temporal features. On the other hand, GRU and LSTM have been designed to overcome the disappearing gradient issue associated with RNNs. Some IDS systems have employed a mix of CNNs and RNNs to manage spatial and temporal features simultaneously. This is possible because the RNN, GRU, and LSTM can maintain temporal features while the CNN extracts the spatial and global components. However, this combination can heighten the complexity of the model, which means that more training data samples are required.
A hierarchical CNN+RNN system was developed by Wu et al. [38]. This system has a high detection capability and a significantly low false-positive alarm rate. Nonetheless, one fundamental weakness of their proposed model is that it cannot classify attacks when the training dataset samples are too small. Meanwhile, Yao et al. [39] developed an advanced metering infrastructure (AMI) intrusion detection model involving the cross-layer feature fusion of a CNN and LSTM. To learn global features, the CNN component identifies and recognizes regional features. On the other hand, the LSTM component extracts periodic features using a memory function. A comprehensive set of features with multi-domain characteristics can be obtained in this way. This enables intrusion information to be accurately detected in AMI.
On the other hand, Vinayakumar et al. [40] used millions of well-known good and bad network connections to model network traffic in the form of a time series, specifically TCP/IP packets within a predetermined time range. To do this, a multilayer perceptron must be used, in addition to CNN, CNN-RNN, CNN-long, CNN-LSTM, and CNN-GRU. A complete examination of multiple MLP, CNN, CNN-RNN, CNN-LSTM, and CNN-GRU topologies, network parameters, and network structures would enable the most suitable network design to be identified. The CNN and its different architectures have been found to perform better than traditional machine learning algorithms. This is primarily because CNNs can extract high-level features that reflect the abstract low-level feature sets in network traffic connections. Moreover, Han et al. [41] developed a Spatial and Temporal Aware Intrusion Detection Model (STIDM), in which a one-dimensional CNN is used to extract spatial features according to the nature of the flow and packet. Subsequently, a time- and length-sensitive LSTM algorithm is used to obtain richer temporal information from irregular flows. To achieve a global optimum, both sections must be trained at the same time. The process extracts spatial and temporal features simultaneously using the original flows rather than manually generated features. SplitCap divides full packet payloads in Pcap format into five tuples (source IP, source port, destination IP, destination port, and protocol). These are then sorted by timestamp to construct flows. During this process, packet features, length features, and time features are collected.
Meanwhile, Hassan et al. [42] developed a network that combines a CNN and weight-dropped LSTM (WDLSTM). They employ CNN to extract useful features from extensive IDS data and WDLSTM to preserve long-term dependencies between derived features to avoid overfitting from recurrent connections. Khan et al. [43] also presented a scalable and hybrid IDS based on Spark machine learning and the convolutional–LSTM (Conv-LSTM) network, a two-stage IDS. A Spark machine learning anomaly detection module is used in the first stage. The second stage, developed according to the Conv-LSTM network, serves as an abuse detection module. For binary classification, Liu et al. [44] use the k-means and random forest (RF) algorithms, with the distributed calculations of both algorithms being deployed on the Spark platform. This enables normal and attacks events to be classified quickly. Any abnormal events that are detected are further categorized based on the specific type of attack being attempted. A CNN is used to achieve this.
Moreover, the CNN-LSTM model developed by Kim et al. [45] requires normalized UTF-8 character encoding to facilitate spatial feature learning (SFL). In turn, this enables the characteristics of real-time HTTP traffic to be accurately extracted, with no need for encryption, entropy calculations, or compression. AI-IDS can identify sophisticated attacks by training payloads to identify true or false positives using a labeling tool. The model is flexible and scalable and can be used with Docker images. It uses independent images to separate user-defined functions. Additionally, it can help to create and enhance Snort rules for signature-based IDS when new patterns are identified. The model is continuously trained to compute malicious probabilities, while UTF-8 encoding is performed to normalize the deep learning model and train it to detect data with specific features. The model is quick and easy to use, requiring no compression, encryption, or unnecessary entropy calculations. The key benefit of UTF-8 is that it is impossible to confuse it with a single encoding method, meaning that several types of erroneous encoding are avoided (i.e., national language encoding methods such as UTF-16, EUC-KR (Korean), and GB2312 (Simplified Chinese)). UTF-8 is incorporated in both browsers and web servers, making it a highly efficient technique for preprocessing HTTP traffic. Table 7 compares the experimental information, including the authors, the year of publication, ENV, datasets that are used for training and evaluation performance (binary and multiclass accuracy results), and evaluation metrics for group 2 (Hybrid CNN and RNN) schemes.
Table 8 compares architectural properties such as architecture, input layer shape, feature extraction method, other methods used alongside the CNN, and classification method for group 2 (Hybrid CNN and RNN) schemes.
5.3. Hybrid CNN and Deep Learning Schemes
Two distinct types of models have been proposed in this specific group of reviewed papers. Firstly, multiple models have been inspired by well-known deep learning architectures (i.e., Inception and TextCNN). Secondly, models combine deep learning algorithms, such as autoencoder (AE) and denoising autoencoder (DAE), to denoise data, clean data, and extract features.
Min et al. [63] developed the TR-IDS method, which uses statistical and payload features. In this process, word embedding and Text-CNN are employed to extract relevant information from payloads. Additionally, it classifies bidirectional network flows (Biflow), which contain more temporal data than packet-level datasets. The process involves the extraction of statistical and payload features, as well as random forest classification.
In the research carried out by [64], a two-step network intrusion detection system was developed based on the GoogLeNet Inception and CNN models. In this system, the GoogLeNet Inception Model is applied to detect issues with the binaries of network packets. After this, features are selected from the raw data of the packet. Moreover, the CNN algorithm presented in [65] incorporates a batch normalization algorithm and inception model to train the system and enhance the model’s convergence speed. This makes the model more powerful, increasing the network’s depth and width. Ultimately, it enhances the network’s adaptability to the scale.
It is also important to note that network traffic has a hierarchical structure (byte–packet–flow). The researchers in [66] created a CNN based on hierarchical packet bytes. This is known as the PBCNN. This model automatically selects abstract features at the first level from bytes in a raw Pcap file packet. Subsequently, the packets in a flow or session are represented at the second level rather than using feature-ready CSV files. This ensures that all original data information is used efficiently. Several convolution-pooling modules are encompassed in byte-friendly filter sizes, and one-layer TextCNN can be used to acquire the representation of traffic flow. This is then fed into three layers of fully connected networks to classify attacks. PBCNN-based few-shot learning can be employed to enhance the reliability of network attack categories. Table 9 compares the experimental information, including the authors, the year of publication, ENV, datasets that are used for training and evaluation performance (binary and multiclass accuracy results), and evaluation metrics for group 3 (Hybrid CNN and Deep Learning) schemes.
The transformer network architecture is used in text classification, dialogue tasks, and other natural language processing (NLP) problems. This architecture is primarily formed by an encoder and decoder. Due to transformers’ computational efficiency and scalability, they have also been used in other classification domains, such as image classification and computer vision. Inspired by the transformer structure in NPL and image classification, a hybrid neural network called DDosTC that combines transformers and a CNN is proposed in [67] to detect DDoS attacks in software-defined networks (SDNs). Moreover, Yin et al. [68] proposed a deep capsule network-based IDS on an attention mechanism. Their model employs a capsule network to enhance the feature extraction, and the attention mechanism is used to make the model focus on features with high impacts.
Table 10 compares architectural properties such as architecture, input layer shape, feature extraction method, other methods used alongside the CNN, and classification method for group 3 (Hybrid CNN and Deep Learning) schemes.
5.4. Hybrid CNN and Other Machine Learning Method Schemes
Moustakidi et al. [70] focused on enhancing users’ trust in and understanding of data while simultaneously maintaining accuracy. They thus developed a system in which the data collected by the IDS are combined into a single actionable risk indicator. The following components are critical to the feature extraction pipeline: (i) a fuzzy allocation scheme that can convert raw data into fuzzy class memberships, (ii) a new transformation mechanism to convert feature vectors into images (Vec2im), and (iii) a dimensionality reduction module that employs Siamese convolutional neural networks to transform input data dimensionality into 1D feature space. The generated memberships are converted into a matrix format during the second processing stage, producing one grayscale image per example. To be more precise, 41 features j = 1 were converted into 41 fuzzy memberships, (), j = 1, …, 41. Finally, the insertion of fuzzy memberships into a matrix enables a 7 × 7 image to be produced for each sample. Additionally, zero values were also incorporated into random cells of the matrix to fill the eight gaps (the initial feature dimensionality was established at 41, with 49 cells in the matrix that needed to be sealed). Fuzzy memberships and zero values were subjected to random ordering once it had been concluded that the order had no significant effects on the final performance of the newly developed system.
Meanwhile, a feature subset selected by a genetic algorithm-based exhaustive search and fuzzy C-means clustering was proposed by Nguyen et al. [3]. The algorithm is designed to identify bagging (BG) classifiers, with the CNN model serving as an efficient extractor. The deep feature subset extracted by the selected CNN model is input into the BG classifier to validate the performance. Subsequently, combining a high-quality feature set acquired through the GA’s three-layered feature construction, the GA, FCM, CNN extractors, hybrid CNN, and BG learning methods resulted in substantially enhanced performance of the final detection system. This new model requires feature selection, model selection, and model validation.
In R. V Mendonca et al. [71], the researchers proposed a model employing the Tree-CNN hierarchical algorithm with a soft-root-sign (SRS) activation function. This model aims to reduce the time needed for the generated model to be trained and, thus, ultimately detect DDoS, infiltration, brute force, and web attacks. The performance results indicate that this model is simple and relatively uncomplex. Moreover, less process time and fewer calculation tools are required, which means that this model outperforms other existing IDSs that use machine learning algorithms. Table 11 compares the experimental information, including the authors, the year of publication, ENV, datasets that are used for training and evaluation performance (accuracy), and evaluation metrics for group 4 (Hybrid CNN and Machine Learning) schemes.
Table 12 compares architectural properties such as architecture, input layer shape, feature extraction method, other methods used alongside the CNN, and classification method for group 4 (Hybrid CNN and other Machine Learning) schemes.
6. Analytical Investigation
In this section, the issues surrounding the CNN-based IDS systems discussed previously in the paper are outlined. Thus, it is important to present some statistics to illustrate these issues, such as the following:
- 10.
- The annual percentage of CNN-IDS papers published.
- 11.
- The percentage of IDS approaches that have employed 1D and 2D input as the input dimension of the CNN.
- 12.
- The percentage of IDS solutions employed in various intrusion detection datasets to assess performance.
- 13.
- The percentage of the use of implementation frameworks that have been trialed for IDS schemes.
- 14.
- The number of convolutional layers added in CNN-based models, which indicates the depth of the models.
- 15.
- The percentage of each evaluation metric used to test the IDS schemes.
- 16.
- The accuracy of the studied IDS approaches when using specific datasets.
These statistics are provided for the 66 CNN-based IDS approaches investigated in the previous section of this paper.
Figure 4 shows that researchers have developed and tested many CNN-based approaches in order to find a solution to the IDS issue. Of all of the studies reviewed in this work, 3% were published in 2017, and 28.4% were published in 2021. It is also important to note that the papers selected for 2022 were all published before July 2022. This is a clear indication that research attention in this field is growing rapidly.
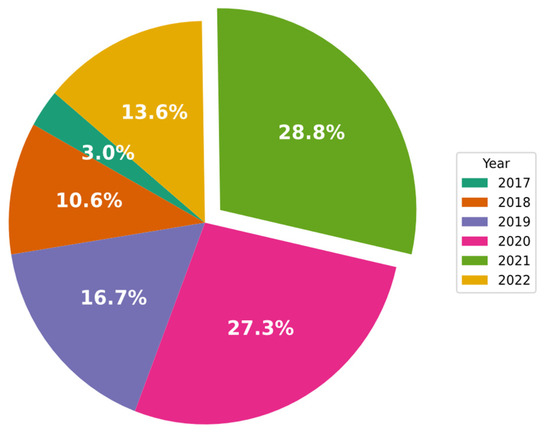
Figure 4.
Percentages of CNN-IDS papers published each year.
The CNN specializes in processing data with a grid-like architecture (e.g., images). Thus, numerous CNN-IDS studies have reshaped the input features into a matrix shape (2D). Furthermore, several studies have used 1D data features as the input for CNN models. The application of the image format has been found to lower the number of computed parameters required in a CNN model [112]. A one-dimensional array can be converted into a two-dimensional (2D) or three-dimensional (3D) image. The 49-feature vector has been converted into a 7 × 7 matrix in several studies. In instances where the number of features is not squared, zeros can be added to the feature vector. On the other hand, researchers [70] attempted to fill eight gaps in the matrix using zero values in random cells (this was possible because the initial feature set had a dimensionality of 41, with 49 cells to be filled in the matrix in total). Figure 5 shows the percentage of IDS methods that used 1D and 2D input shapes to achieve this. This figure demonstrates that 62.9% of the methods use 2D input, whereas only 37.1% apply 1D input.
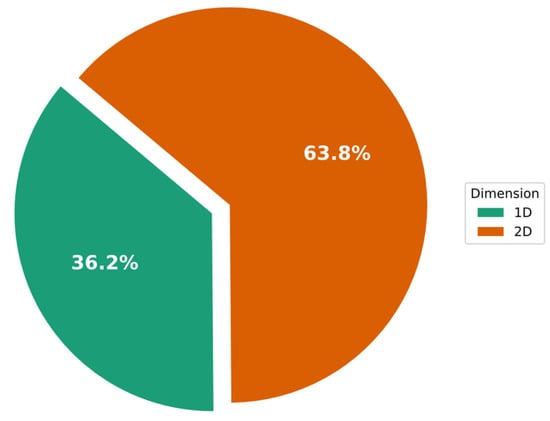
Figure 5.
Percentages of IDS schemes that have used 1D or 2D (image) input shapes.
In Figure 6, the datasets used in the CNN-based IDS approaches investigated in this study are presented. The figure shows that 35.2% of IDS approaches still use NSL-KDD, while 15.4% use the KDD Cup99 legacy dataset. Moreover, to carry out a more comprehensive assessment of the proposed approaches, multiple datasets were used in some instances. Altogether, 13.2% of the studies included in this review evaluated the CIC-IDS2017 dataset.

Figure 6.
Percentages of datasets applied in CNN-IDS solutions.
In Figure 7 below, the percentages of the implementation simulators/environments employed in the experiments and evaluation processes are outlined. As shown in the figure, 40.4% of IDS implementations were carried out using TensorFlow, 38.6% used Keras (with the TensorFlow backend), and 10.5% used MATLAB.
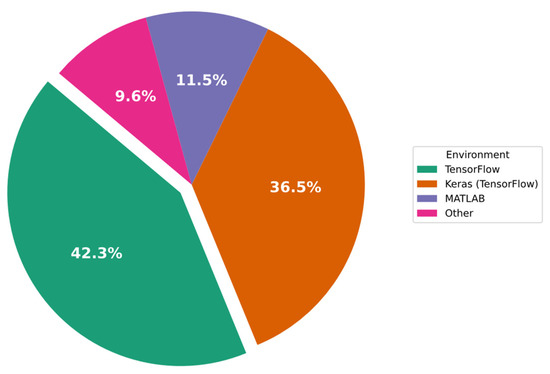
Figure 7.
Percentage of implementation simulators/environments employed in the experiments.
In Figure 8, the number of convolutional layers utilized by the IDS schemes can be seen. This figure shows that two convolutional layers are employed in 32 approaches. Moreover, ten IDS approaches seem to apply more than three convolutional layers.
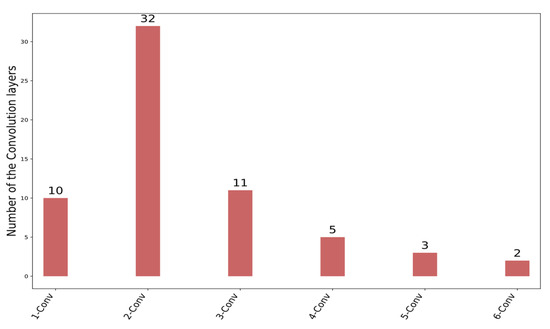
Figure 8.
Number of convolutional layers that have been used for IDS schemes.
In Figure 9, the number of IDS approaches employed in each evaluation metric is presented. Additionally, it can be seen in this figure that ACC (accuracy), TPR (Recall), PPV (Precision), FPR (false alarm rate), and F1 Score are the most commonly employed metrics in these studies. Few IDS researchers have incorporated evaluation metrics such as AUC, ROC, and TNR.

Figure 9.
The number of IDS schemes that have applied each evaluation metric.
Figure 10, Figure 11, Figure 12, Figure 13 and Figure 14 outline the accuracy of the CNN-based IDS schemes investigated in this study that employ the NSL-KDD, KDD Cup99, CIC-IDS2017, UNSW-NB15, and CSE-CIC-IDS2018 datasets, respectively. In these figures, the green and red colors show an accuracy higher and lower than 95%, respectively. To enable the findings to be compared, the results for each dataset are presented individually. Researchers can compare these findings with their own results. The maximum value between binary and multiclass classifications has been selected for the plot in all figures.
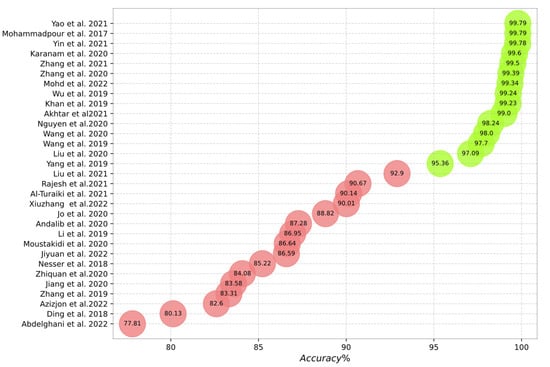
Figure 10.
Accuracy of the studied schemes on the NSL-KDD dataset [3,19,20,22,24,25,28,29,30,31,32,33,35,36,38,39,44,47,49,50,58,59,61,62,64,68,70,75,76,78,111].
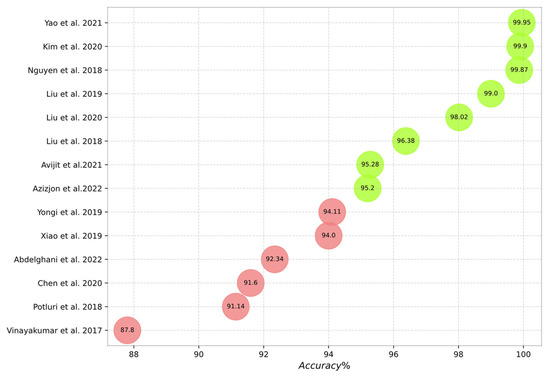
Figure 11.
Accuracy of the studied schemes on the KDD Cup99 dataset [16,17,19,23,26,39,40,62,65,69,72,74,76,77].
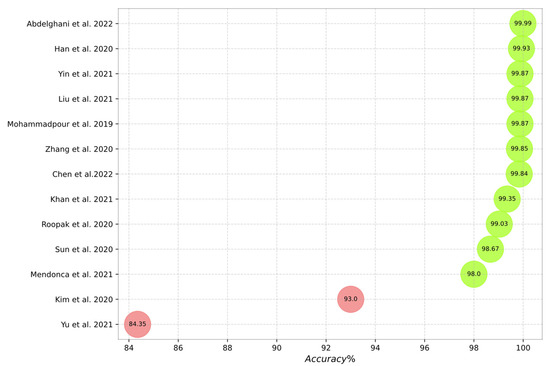
Figure 12.
Accuracy of the studied schemes on the CIC-IDS 2017 dataset [15,18,41,44,45,46,48,52,66,68,71,73,76].
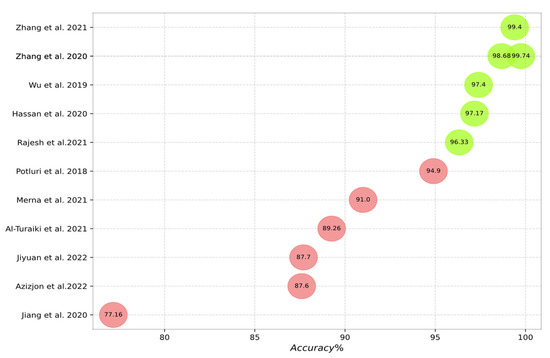
Figure 13.
Accuracy of the studied schemes on the UNSW-NB15 dataset [15,16,20,37,38,42,49,59,61,62,64,75].

Figure 14.
Accuracy of the studied schemes on the CSE-CIC-IDS2018 dataset [21,23,27,51,54,66].
Figure 15 outlines the comparison between the binary and multiclass accuracies of the CNN-based IDS schemes investigated. The green and red colors in these figures show multiclass and binary accuracies. It can be seen in this figure that the binary classification results are mostly higher than the multiclass classification results.

Figure 15.
Comparison between binary and multiclass classification of the CNN-based IDS [3,15,20,21,23,25,34,38,42,44,49,52,73,75,76,78].
Moreover, it can be seen from the literature that:
- 17.
- LSTM is the most frequently used deep learning algorithm to hybridize with CNN in the IDS domain; this hybrid method generates the highest accuracy.
- 18.
- CNNs produce better performance when trained by a larger dataset.
7. Other Factors of CNN-Based IDS Experiments
In the previous sections of this paper, we discuss the most important elements in the IDS-based CNN; however, there are other factors for training deep neural networks, such as preprocessing, setting hyperparameters, generalization, pretraining, initialization, normalization, and over/undersampling, which greatly affect the performance of the model, some of which are briefly discussed in this section.
Using too few neurons and layers may affect the model performance in detecting intrusion activities. However, increasing the number of neurons and depths may lead to overfitting, gradient vanishing, and increased training time and cost [52]. Furthermore, the covariance shift arises due to the dynamically shifting input value range from layer to layer in the training process within deep neural networks. Consequently, the learning outcome becomes volatile due to the learning efficacy of one layer being determined by other layers. Moreover, the learning speed is reduced, as the process of ensuring that data are effectively learned in distinct input ranges restricts the learning rate to a low value due to the covariance shift. This problem can be resolved via batch normalization [38]. The issue of vanishing gradients is addressed while the speed of the learning process is enhanced via skip connections, which connect within neural networks and serve as the input fed to the next layer [20].
Generally, the several stages outlined below are typically involved in experiments on a CNN-based IDS:
- 19.
- Data cleaning;
- 20.
- Numerical processing;
- 21.
- Min–max normalization;
- 22.
- Standardization (Gaussian normalization);
- 23.
- Feature reduction;
- 24.
- Dimension reduction;
- 25.
- Imbalanced dataset handling;
- 26.
- Hyperparameter setting;
- 27.
- Vector-to-matrix format conversion;
- 28.
- Cross-validation.
Data cleaning includes removing redundant data and filling in gaps. Moreover, numerical processing generates a digital feature vector by converting non-numeric features, such as categorical and symbolic features, into a numerical format. A general conversion technique is the one-hot encoding approach. For example, in the NSL-KDD dataset, binary encoding of the vectors (0, 0, 1), (0, 1, 0), and (1, 0, 0) represents the ICMP, UDP, and TCP, which are three attributes in “protocol_type” [39].
Substantial variances exist in the dataset’s continuous feature data value range. For example, the “num_shells” feature value range of [0, 5] contrasts with the “num_root” feature value range of [0, 7468] within the NSL-KDD dataset. The linear and uniform mapping of the value range of every feature within the [0, 1] interval is implemented via the min–max normalization technique to streamline the removal of dimensions and support arithmetic processing. The normalized calculation formula is presented below:
where the minimum and maximum values of the feature vector are denoted by and , respectively.
Learning efficiency can be impacted by various distributions with different means and standard deviations within input data. In line with the frequent adoption of multiple machine learning classifiers, standardization is implemented to scale the input data to possess a standard deviation of 1 and a mean of 0. Upon having a variance of 1 and an average of 0, the features can be normalized to a Gaussian distribution using the equation below:
where the standard deviation of the feature vector, the normalized feature, the mean of the feature vector, and the original feature are represented by , , , and , respectively.
7.1. Feature Reduction
Feature selection entails selecting a subset of features to reduce the false alarm and time costs of IDSs. The feature with the greatest impact on the model performance is chosen in the feature selection stage. Embedded, wrapper, and filter techniques constitute the overall feature selection methods [37]. The discrete cuttlefish algorithm (D-CFA), non-dominated sorting algorithm (NSGA), reptile search algorithm (RSA), and GA are examples of metaheuristic algorithms utilized in feature selection.
Fuzzy C-means clustering (FCM) and GA-based exhaustive search have been utilized for feature subset selection in academic work [3]. The most efficacious 1 × 100-dimension features were preserved via feature selection performed by the D-CFA in the work by Liu et al. (2018) [1]. The parameters for updating the population, computing the fitness value, generating the initial population X, determining the best solution, and converting xi to binary were all initialized via the RSA for feature selection in another academic work [76]. An equation put forward in a separate academic paper served to compute minimum redundancy, and features with the greatest relevancy in forecasting the output variable were chosen in the feature subset selection in another study [35].
Information Gain (IG) was utilized for feature selection in the work by Gamal et al. (2021) [37]. Discovering a subset of the original variables is attempted by IG, which indicates the most effective training set of feature vectors to discriminate between the classes to be learned. The mining time or the precision of the system is enhanced via the use of IG. The features that influence data classification are ranked, while communication is determined by entropy. The value of the relationship between every feature and the value of the information is regulated by entropy.
7.2. Dimension Reduction
In the dimension reduction process, the loss of information is minimized while interpretability is enhanced. In the work by Liu et al. [72], applying a principal component analysis (PCA) following the use of K-means to cluster the dataset enhanced the detection efficacy and decreased the intrusion rule base. However, one study put forward the approach of utilizing the cumulative explained variance ratio (CEVR) as a function of the total number of core components [78]; the estimation of the total number of core components plays a significant role in PCA, which is necessary for describing the data. Nonetheless, autoencoders (AEs) and Siamese convolutional neural networks (SCNNs) are deep learning networks also used for dimension reduction in academic works [103,104], respectively.
7.3. Imbalanced Dataset Handling
Utilizing an imbalanced dataset to train a model is one of the issues in machine learning-based IDSs. The issue of an imbalanced dataset is frequently resolved by implementing the general synthetic minority oversampling technique (SMOTE). First, from the minority class in the dataset, a data point, x, is randomly chosen. Then, novel points from the minority class are synthesized in this process. Usually, a value of 5 is set for k upon the k neighbors of x being identified. Simple oversampling, in comparison, demonstrates lower performance and robustness than the mentioned method. Additionally, overfitting is effectively decreased by SMOTE [20].
Another algorithm for addressing an imbalanced dataset is adaptive synthetic sampling (ADASYN). In line with the distribution of minority samples, ADASYN adaptively synthesizes minority samples [44].
In [29], the imbalance processing module was separated into two portions. The removal of noise samples is focused on by the undersampling technique named the edited nearest neighbor (ENN). The nearest neighbors to every synthetic sample are calculated on the basis of the Euclidean distance. When distinct classes are within the majority of the k-nearest neighbor samples to the synthetic samples, the synthetic samples are removed [29].
Minority samples were augmented via SMOTE, while the majority samples were diminished through one-side selection (OSS) in one study [49]. Undersampling of the surplus samples was enabled by utilizing a Gaussian mixture model-based (GMM-based) clustering algorithm within the majority class. The labeled sample set was expanded via the production of rare samples following the use of the GMM-based WGAN in the minority class [59].
7.4. Hyperparameter Setting
A model’s accuracy and learning capability are substantially affected by hyperparameters, embodying higher-level characteristics that cannot be learned from the training set in the procedure of deep learning. The number of training epochs, initial weight initializations, regularization, nonlinearity, mini-batch size, optimizer, choice of objective function, and the learning rate of the model are among the mentioned hyperparameters [24].
Furthermore, practical experience and professional knowledge are needed for the search for optimal topological architectures. Overall, the performance of the model is hypothetically enhanced by increasing the number of neurons and deepening the network depths of the fully connected layer. Nonetheless, the performance of the model diminishes after a certain level and depth are reached in the CNN [52].
Manual search (trial and error) and grid search are the commonly used strategies for setting hyperparameters. However, limited efficacy is associated with these techniques. Significant computing resources are needed in grid searches, which can incur exponential increases in trials among the set of trials established by formulating each potential combination of hyperparameter values. Meanwhile, reproducing results is challenging for the manual search technique [24]. Efficacious searches over large configuration spaces are enabled by the enhanced model parameters that the random-search strategy provides, thereby making the most of the limited computational budget in comparison to grid search. Manual search was utilized in multiple papers reviewed in this survey. Additionally, the implementation of the random-search strategy was also carried out for hyperparameter optimization [24].
The establishment of optimal topological architectures and hyperparameters is enabled by metaheuristic algorithms that belong to the larger class of evolutionary algorithms (EAs). The multi-objective evolutionary algorithm based on decomposition (MOEA/D), lion swarm optimization (LSO), genetic algorithm (GA), and ant lion optimizer (ALO) are examples of said algorithms utilized in CNN-based IDS.
Hyperparameter selection and the CNN structure are enabled via the utilization of the GA in academic work [3]. In another work, a high classification rate and minimum error rate were obtained via the use of ALO [54]. The tuning of hyperparameters was performed through the use of LSO in another study [61].
A CNN model was built automatically through the MOEA/D in another investigation. A chromosome of MOEAs is the outcome of the transformation of the parameters. The hyperparameter group, the fully connected group, and the convolution group are the three groups into which parameters are separated as per their distinct roles. The dropout rate, the total number of neurons in every fully connected layer, and the total number of fully connected layers are included within the fully connected group. The learning rate, the learning rule, and the batch size are included within the hyperparameter group. In this approach, the model complexity, which is the number of parameters of the CNN, is the first objective, and the detection error rate is the second objective [52].
7.5. Vector-to-Matrix Format Conversion
The matrix format is established by the dimensional transformation of every feature vector. For example, the reshaping of 49 feature vectors into a 7 × 7 matrix exemplifies the remolding of network data into the matrix to enable their input into the convolutional neural network. The elimination of a feature with a high correlation in 121 features is enabled by the ANOVA F-test, as demonstrated in a particular research paper [47]. This is implemented by converting the dimensional vector from 1 × 122 into 11 × 11.
Most CNN-based IDS research converted a feature vector into 2D matrices and filled the redundant parts with zeros. Imposing a correlation in the vicinity of the matrix elements is unavoidable in the transformed 2D matrix, which resembles a grayscale image. The implementation of data clustering serves to mitigate the influence of the imposed correlation. Discrete processing occurs for distinct portions of the data, where the data are separated into n parts, in line with previous knowledge of the data. For example, in one study [25], features were divided into primary, content, host-based, and time-based network traffic statistics. This data clustering approach facilitates learning high-level relationships between global features that other classification algorithms would ignore.
7.6. Cross-Validation
As is frequently utilized in machine learning, k-fold cross-validation (CV) is implemented to obtain large non-redundant datasets for validation and training. All samples in the dataset are divided into k groups, where k-1 groups are utilized for training while other groups are used for validation [3,38,51].
8. Empirical Experiment
As we mentioned above, various datasets are used by researchers to validate their proposed CNN-based IDS. Further, they may use different configurations and hyperparameters. Thus, the comparison of different CNN-based IDSs is not feasible based on their experimental results. To overcome this challenge, we innovatively set up a comprehensive experiment to investigate the use of different CNN schemes on well-known and standard datasets. According to the Analytical Investigation section, two types of datasets, KDD and CIC-IDS 2017, are mainly used in the literature. The KDD dataset consists of KDD Cup99 and NSL-KDD versions, with 14.9% usage and 33.0% usage, respectively, according to Figure 6. Thus, we selected NSL-KDD as the first standard benchmark. CIC-IDS also includes the CIC-IDS 2017 and CIC-IDS 2018 Versions, where Version 2017 is more frequently used than the other. Therefore, we considered CIC-IDS 2017 as the second standard benchmark.
By investigating the literature, we can conclude that effective CNN schemes for IDSs are mostly constructed from the combination of CNN and other neural network structures, such as dense, LSTM, and autoencoder. Thus, in this experiment, the original CNN and hybrid CNN schemes for IDSs were tested on the two standard benchmarks. Based on the type of layers and topology, five important configurations with nine variations were implemented as follows:
- 29.
- 1D-CNN: Using only 1D convolutional layers followed by dense layers is the basic configuration of the CNN-based IDS [54,62,65,66]. The number of CNN layers in this configuration is a hyperparameter. According to Figure 8, most IDS schemes use one, two, or three layers. Thus, in this experiment, we implemented three 1D-CNN models with one to three CNN layers.
- 30.
- 2D-CNN: Based on the research in [28,38,53,55,56,63,66], this configuration uses 2D convolutional layers followed by dense layers. Like the previous configuration, we implemented three models with one to three CNN layers.
- 31.
- LSTM-1DCNN: Based on the research in [72,74,75,77,79,82], in this scheme, the input is considered to be a time series and processed by LSTM layers; then, the LSTM outputs are delivered to the 1D-CNN layers, and finally, the dense layers are used as the last layers.
- 32.
- LSTM-2DCNN: Similar to the previous configuration, this one uses LSTM, CNN, and dense layers sequentially, but instead of 1D-CNN, 2D-CNN is used [73,76,78,80,83,85].
- 33.
- Autoencoder-CNN: In this configuration, first, an autoencoder network is trained, and then its trained encoder part is employed as a feature extractor. This model consists of an encoder network, CNN, and dense layers sequentially, as proposed in [27,103].
As shown in Figure 7, usually, the TensorFlow and Keras libraries are used for IDS implementation. Thus, to make our experiment closer to those in the literature, in this research, we used Keras with the TensorFlow backend in our implementation. Table 13 and Table 14 show the experimental results on the CIC-IDS 2017 and NSL-KDD datasets, respectively. In both tables, the best scores are highlighted.
Table 13.
The experimental results on the CIC-IDS 2017 dataset.
Table 14.
The experimental results on the NSL-KDD dataset.
It can be seen in Table 13 and Table 14 that the number of CNN layers and the hybrid method affect performance metrics such as accuracy and the false alarm rate. The experiment that used basic 1D-CNN on CIC-IDS 2017 had a maximum accuracy of 98.08% with two CNN layers. In the same experiment with NSL-KDD, the best result was found when using three CNN layers, with an accuracy of 88.87%. Moreover, in our experiments, the highest accuracy on the CIC-IDS 2017 dataset was found using basic 1D-CNN with two CNN layers, while on NSL-KDD, the highest accuracy was found using hybrid LSTM with two-layer 1D-CNN. In general, our experiment shows that the results on CIC-IDS 2017 are better (higher accuracy and lower false alarm rate) than those on NSL-KDD because deep learning approaches such as CNNs have higher performance when trained with a larger dataset.
9. Conclusions and Research Directions and Gaps
IDSs play a crucial role in securing networks and computer systems worldwide and employ several AI techniques, such as machine learning, to enhance performance against novel cyber-attack challenges. Deep learning has a significant benefit over other traditional machine learning methods because it can independently detect relevant features in high-dimensional data. Among deep learning algorithms, the CNN has been widely used by researchers to improve IDS solutions regarding privacy issues and security threats. Therefore, this study provides a comprehensive survey of CNN-based IDS schemes. It initially provides the background, in which deep learning is briefly discussed, and the CNN is explained in detail. In addition, popular primary datasets that have been employed by IDS schemes are illustrated in this paper. The overall techniques are categorized into four groups. The overall architectures of the learning methods, datasets, data input shapes, evaluated metrics, performance, feature extraction methods, and classifiers are discussed for each group. This survey illuminates the highly incorporated methods in the researched schemes. Although many researchers have investigated machine learning, deep learning, and CNNs in the IDS context, future researchers may address the following issues:
- 34.
- Setting the optimized hyperparameters (i.e., layer structure, learning rate, activation function, and kernel size). These are critical in deep learning approaches, and for this reason, they require further investigation.
- 35.
- Combining misuse detection and anomaly detection through the application of CNN algorithms. This can create hybrid schemes that can effectively manage known and unknown attacks.
- 36.
- Using a comprehensive dataset, including all known and unknown attacks. Big data can now be processed by deep learning, meaning that it is possible to acquire datasets large enough to support all types of known attacks.
- 37.
- Addressing overfitting and underfitting. When data are unbalanced, overfitting can occur, particularly when the SMOTE technique is used. It is essential to identify ways to manage unbalanced data.
- 38.
- Determining an efficient method to reshape 1D features into 2D features for the CNN and generalize the CNN-based IDS.
Funding
This research was supported in part by the Ministry of Higher Education Malaysia under Grant LRGS-LR002-2020, and part of the APC was funded by Shiraz International School (www.shirazschool.com) Shiraz, Iran.
Institutional Review Board Statement
Not applicable.
Informed Consent Statement
Not applicable.
Data Availability Statement
The CICD2017 and NSL-KDD can be downloaded from https://www.unb.ca/cic/datasets/ids-2017.html and https://www.unb.ca/cic/datasets/nsl.html, respectively.
Acknowledgments
The authors would like to thank the reviewers, the associate editor, and the Editor-in-Chief for their comments which improved this manuscript.
Conflicts of Interest
The authors declare no conflict of interest.
Nomenclature
| Acronyms | Definition |
| ACCS | Australian Center for Cyber Security |
| Adam | Adaptive Moment Estimation |
| ADASYN | Adaptive Synthetic Sampling |
| AE | Autoencoder |
| AI | Artificial Intelligence |
| ALO | Ant Lion Optimizer |
| AMI | Advanced Metering Infrastructure |
| ANN | Artificial Neural Network |
| AUC | Area Under the ROC Curve |
| BCNN | Bayesian CNN |
| BG | Bagging Classifier |
| CEVR | Cumulative Explained Variance Ratio |
| CIC | Canadian Institute for Cyber Security |
| CNN | Convolutional Neural Network |
| DAE | Denoising Autoencoder |
| DBN | Deep Belief Nets |
| D-CFA | Discrete Cuttlefish Algorithm |
| DDoS | Distributed Denial of Service |
| DFS | Deep Feature Synthesis |
| DL | Deep Learning |
| DMCNN | Deep Multi-Scale CNN |
| DNN | Deep Neural Networks |
| DoS | Denial of Service |
| FC | Fully Connected |
| FCM | Fuzzy C-Means |
| GA | Genetic Algorithm |
| GRU | Gated Recurrent Unit |
| HMLSTM | Hierarchical Multi-scale LSTM |
| ICS | Industrial Control System |
| IDS | Intrusion Detection Systems |
| IG | Information Gain |
| LSO | Lion Swarm Optimization |
| LSTM | Long Short-Term Memory |
| MCL | Means Convolutional Layer |
| ML | Machine Learning |
| MLP | Multilayer Perceptron |
| MOEA | Multi-Objective Evolutionary Algorithm |
| MOEA/D | MMOEA Based on Decomposition |
| MRR | Missing Report Rate |
| NLP | Natural Language Processing |
| NSGA | Non-Dominated Sorting Algorithm |
| OCNN | Optimized CNN |
| OSS | One-Side Selection |
| PBCNN | Packet Bytes CNN |
| PCA | Principal Component Analysis |
| R2L | Remote to Local |
| RF | Random Forest |
| RNN | Recurrent Neural Network |
| ROC | Receiver Operating Characteristic Curve |
| RP | Recurrence Plots |
| RSA | Reptile Search Algorithm |
| SCNN | Siamese Convolutional Neural Networks |
| SDN | Software-Defined Networks |
| SFL | Spatial Feature Learning |
| SGD | Stochastic Gradient Descent |
| SMOTE | Synthetic Minority Oversampling Technique |
| SMOTE-NC | SMOTE-Nominal Continuous |
| SPC | Split-based Plug and Play Convolution |
| SRS | Soft-Root-Sign |
| STIDM | Spatial and Temporal Intrusion Detection Model |
| SVDD | Support Vector Data Description |
| Text-CNN | Text-Convolutional Neural Network |
| U2R | User to Root |
| Vec2im | Vectors to Images |
| WDLSTM | Weight-Dropped LSTM |
| WGAN | Wasserstein Generative Adversarial Network |
References
- Bul’ajoul, W.; James, A.; Shaikh, S. A new architecture for network intrusion detection and prevention. IEEE Access 2018, 7, 18558–18573. [Google Scholar] [CrossRef]
- Zhang, X.; Chen, J.; Zhou, Y.; Han, L.; Lin, J. A Multiple-Layer Representation Learning Model for Network-Based Attack Detection. IEEE Access 2019, 7, 91992–92008. [Google Scholar] [CrossRef]
- Nguyen, M.T.; Kim, K. Genetic convolutional neural network for intrusion detection systems. Future Gener. Comput. Syst. 2020, 113, 418–427. [Google Scholar] [CrossRef]
- Naseer, S.; Saleem, Y.; Khalid, S.; Bashir, M.K.; Han, J.; Iqbal, M.M.; Han, K. Enhanced network anomaly detection based on deep neural networks. IEEE Access 2018, 6, 48231–48246. [Google Scholar] [CrossRef]
- Denning, D.E. An intrusion-detection model. IEEE Trans. Softw. Eng. 1987, 222–232. [Google Scholar] [CrossRef]
- Najafabadi, M.M.; Villanustre, F.; Khoshgoftaar, T.M.; Seliya, N.; Wald, R.; Muharemagic, E. Deep learning applications and challenges in big data analytics. J. Big Data 2015, 2, 1–21. [Google Scholar] [CrossRef]
- Kwon, D.; Kim, H.; Kim, J.; Suh, S.C.; Kim, I.; Kim, K.J. A survey of deep learning-based network anomaly detection. Cluster Comput. 2019, 22, 949–961. [Google Scholar] [CrossRef]
- LeCun, Y.; Bottou, L.; Bengio, Y.; Haffner, P. Gradient-based learning applied to document recognition. Proc. IEEE 1998, 86, 2278–2323. [Google Scholar] [CrossRef]
- Hochreiter, S.; Schmidhuber, J. Long short-term memory. Neural Comput. 1997, 9, 1735–1780. [Google Scholar] [CrossRef]
- Vincent, P.; Larochelle, H.; Lajoie, I.; Bengio, Y.; Manzagol, P.A. Stacked denoising autoencoders: Learning Useful Representations in a Deep Network with a Local Denoising Criterion. J. Mach. Learn. Res. 2010, 11, 3371–3408. [Google Scholar]
- Rifai, S.; Vincent, P.; Muller, X.; Glorot, X.; Bengio, Y. Contractive auto-encoders: Explicit invariance during feature extraction. In Proceedings of the 28th International Conference on Machine Learning, ICML 2011, Bellevue, WA, USA, 28 June–2 July 2011; pp. 833–840. [Google Scholar]
- Aldweesh, A.; Derhab, A.; Emam, A.Z. Deep learning approaches for anomaly-based intrusion detection systems: A survey, taxonomy, and open issues. Knowl. Based Syst. 2020, 189, 105124. [Google Scholar] [CrossRef]
- Chalapathy, R.; Chawla, S. Deep learning for anomaly detection: A survey. arXiv 2019, arXiv:1901.03407. [Google Scholar]
- Lee, S.-W.; Mohammadi, M.; Rashidi, S.; Rahmani, A.M.; Masdari, M.; Hosseinzadeh, M. Towards secure intrusion detection systems using deep learning techniques: Comprehensive analysis and review. J. Netw. Comput. Appl. 2021, 187, 103111. [Google Scholar] [CrossRef]
- Zhang, H.; Huang, L.; Wu, C.Q.; Li, Z. An effective convolutional neural network based on SMOTE and Gaussian mixture model for intrusion detection in imbalanced dataset. Comput. Netw. 2020, 177, 107315. [Google Scholar] [CrossRef]
- Potluri, S.; Ahmed, S.; Diedrich, C. Convolutional neural networks for multi-class intrusion detection system. In Proceedings of the International Conference on Mining Intelligence and Knowledge Exploration 2018, Cluj-Napoca, Romania, 20–22 December 2018; pp. 225–238. [Google Scholar]
- Liu, P. An intrusion detection system based on convolutional neural network. In Proceedings of the 2019 11th International Conference on Computer and Automation Engineering, Perth, Australia, 23–25 February 2019; pp. 62–67. [Google Scholar]
- Mohammadpour, L.; Ling, T.C.; Liew, C.S.; Aryanfar, A. A Mean Convolutional Layer for Intrusion Detection System. Secur. Commun. Netw. 2020, 2020, 8891185. [Google Scholar] [CrossRef]
- Liu, G.; Zhang, J. CNID: Research of network intrusion detection based on convolutional neural network. Discret. Dyn. Nat. Soc. 2020, 2020, 4705982. [Google Scholar] [CrossRef]
- Al-Turaiki, I.; Altwaijry, N. A Convolutional Neural Network for Improved Anomaly-Based Network Intrusion Detection. Big Data 2021, 9, 233–252. [Google Scholar] [CrossRef]
- Lam, N.T. Detecting Unauthorized Network Intrusion based on Network Traffic using Behavior Analysis Techniques. Int. J. Adv. Comput. Sci. Appl. 2021, 12, 407. [Google Scholar] [CrossRef]
- Jo, W.; Kim, S.; Lee, C.; Shon, T. Packet Preprocessing in CNN-Based Network Intrusion Detection System. Electronics 2020, 9, 1151. [Google Scholar] [CrossRef]
- Kim, J.; Kim, J.; Kim, H.; Shim, M.; Choi, E. CNN-Based Network Intrusion Detection against Denial-of-Service Attacks. Electronics 2020, 9, 916. [Google Scholar] [CrossRef]
- Naseer, S.; Saleem, Y. Enhanced network intrusion detection using deep convolutional neural networks. KSII Trans. Internet Inf. Syst. 2018, 12, 5159–5178. [Google Scholar] [CrossRef]
- Li, Y.; Xu, Y.; Liu, Z.; Hou, H.; Zheng, Y.; Xin, Y.; Zhao, Y.; Cui, L. Robust detection for network intrusion of industrial IoT based on multi-CNN fusion. Measurement 2020, 154, 107450. [Google Scholar] [CrossRef]
- Nguyen, S.-N.; Nguyen, V.-Q.; Choi, J.; Kim, K. Design and Implementation of Intrusion Detection System using Convolutional Neural Network for DoS Detection. In Proceedings of the 2nd International Conference on Machine Learning and Soft Computing (ICMLSC 2018), Phu Quoc Island, Vietnam, 2–4 February 2018; pp. 34–38. [Google Scholar] [CrossRef]
- Lin, W.-H.H.; Lin, H.-C.C.; Wang, P.; Wu, B.-H.H.; Tsai, J.-Y.Y. Using convolutional neural networks to network intrusion detection for cyber threats. In Proceedings of the 4th IEEE International Conference on Applied System Innovation 2018, ICASI 2018, Tokyo, Japan, 13–17 April 2018; pp. 1107–1110. [Google Scholar] [CrossRef]
- Wang, X.; Yin, S.; Li, H.; Wang, J.; Teng, L. A Network Intrusion Detection Method Based on Deep Multi-scale Convolutional Neural Network. Int. J. Wirel. Inf. Netw. 2020, 27, 503–517. [Google Scholar] [CrossRef]
- Zhang, X.; Ran, J.; Mi, J. An intrusion detection system based on convolutional neural network for imbalanced network traffic. In Proceedings of the 2019 IEEE 7th International Conference on Computer Science and Network Technology (ICCSNT), Dalian, China, 9–20 October 2019; pp. 456–460. [Google Scholar]
- Wang, H.; Cao, Z.; Hong, B. A network intrusion detection system based on convolutional neural network. J. Intell. Fuzzy Syst. 2020, 38, 7623–7637. [Google Scholar] [CrossRef]
- Yang, H.; Wang, F. Wireless network intrusion detection based on improved convolutional neural network. IEEE Access 2019, 7, 64366–64374. [Google Scholar] [CrossRef]
- Khan, R.U.; Zhang, X.; Alazab, M.; Kumar, R. An improved convolutional neural network model for intrusion detection in networks. In Proceedings of the 2019 Cybersecurity and Cyberforensics Conference, Melbourne, Australia, 8–9 May 2019; pp. 74–77. [Google Scholar] [CrossRef]
- Mohammadpour, L.; Ling, T.C.; Liew, C.S.; Chong, C.Y. A Convolutional Neural Network for Network Intrusion Detection System. Proc. Asia Pacific Adv. Netw. 2018, 46, 50–55. [Google Scholar]
- Aljumah, A. IoT-based intrusion detection system using convolution neural networks. PeerJ Comput. Sci. 2021, 7, e721. [Google Scholar] [CrossRef]
- Akhtar, M.S.; Feng, T. Deep Learning-Based Framework for the Detection of Cyberattack Using Feature Engineering. Secur. Commun. Netw. 2021, 2021, 6129210. [Google Scholar] [CrossRef]
- Hu, Z.; Wang, L.; Qi, L.; Li, Y.; Yang, W. A Novel Wireless Network Intrusion Detection Method Based on Adaptive Synthetic Sampling and an Improved Convolutional Neural Network. IEEE Access 2020, 8, 195741–195751. [Google Scholar] [CrossRef]
- Gamal, M.; Abbas, H.M.; Moustafa, N.; Sitnikova, E.; Sadek, R.A. Few-shot learning for discovering anomalous behaviors in edge networks. Comput. Mater. Contin. 2021, 69, 1823–1837. [Google Scholar] [CrossRef]
- Wu, P.; Guo, H. LuNET: A deep neural network for network intrusion detection. In Proceedings of the 2019 IEEE Symposium Series on Computational Intelligence (SSCI), Xiamen, China, 6–9 December 2019; pp. 617–624. [Google Scholar]
- Yao, R.; Wang, N.; Liu, Z.; Chen, P.; Sheng, X. Intrusion Detection System in the Advanced Metering Infrastructure: A Cross-Layer Feature-Fusion CNN-LSTM-Based Approach. Sensors 2021, 21, 626. [Google Scholar] [CrossRef]
- Vinayakumar, R.; Soman, K.P.; Poornachandrany, P. Applying convolutional neural network for network intrusion detection. In Proceedings of the 2017 International Conference on Advances in Computing, Communications and Informatics, ICACCI 2017, Udupi, India, 13–16 September 2017; Volume 2017, pp. 1222–1228. [Google Scholar] [CrossRef]
- Han, X.; Yin, R.; Lu, Z.; Jiang, B.; Liu, Y.; Liu, S.; Wang, C.; Li, N. STIDM: A Spatial and Temporal Aware Intrusion Detection Model. In Proceedings of the 2020 IEEE 19th International Conference on Trust, Security and Privacy in Computing and Communications (TRUSTCOM 2020), Guangzhou, China, 29 December 2020–1 January 2021; pp. 370–377. [Google Scholar] [CrossRef]
- Hassan, M.M.; Gumaei, A.; Alsanad, A.; Alrubaian, M.; Fortino, G. A hybrid deep learning model for efficient intrusion detection in big data environment. Inf. Sci. 2020, 513, 386–396. [Google Scholar] [CrossRef]
- Khan, M.A.; Karim, M.R.; Kim, Y. A scalable and hybrid intrusion detection system based on the convolutional-LSTM network. Symmetry 2019, 11, 583. [Google Scholar] [CrossRef]
- Liu, C.; Gu, Z.; Wang, J. A Hybrid Intrusion Detection System Based on Scalable K-Means plus Random Forest and Deep Learning. IEEE Access 2021, 9, 75729–75740. [Google Scholar] [CrossRef]
- Kim, A.; Park, M.; Lee, D.H. AI-IDS: Application of Deep Learning to Real-Time Web Intrusion Detection. IEEE Access 2020, 8, 70245–70261. [Google Scholar] [CrossRef]
- Sun, P.; Liu, P.; Li, Q.; Liu, C.; Lu, X.; Hao, R.; Chen, J. DL-IDS: Extracting Features Using CNN-LSTM Hybrid Network for Intrusion Detection System. Secur. Commun. Netw. 2020, 2020, 8890306. [Google Scholar] [CrossRef]
- Karanam, L.; Pattanaik, K.K.; Aldmour, R. Intrusion Detection Mechanism for Large Scale Networks using CNN-LSTM. In Proceedings of the 2020 13th International Conference on Developments in Esystems Engineering (DESE 2020), Liverpool, UK, 4–17 December 2020; pp. 323–328. [Google Scholar] [CrossRef]
- Roopak, M.; Tian, G.Y.; Chambers, J. An Intrusion Detection System Against DDoS Attacks in IoT Networks. In Proceedings of the 2020 10th Annual Computing and Communication Workshop and Conference (CCWC), Las Vegas, NV, USA, 6–8 January 2020; pp. 562–567. [Google Scholar]
- Jiang, K.; Wang, W.; Wang, A.; Wu, H. Network intrusion detection combined hybrid sampling with deep hierarchical network. IEEE Access 2020, 8, 32464–32476. [Google Scholar] [CrossRef]
- Andalib, A.; Vakili, V.T. An Autonomous Intrusion Detection System Using an Ensemble of Advanced Learners. In Proceedings of the 2020 28th Iranian Conference on Electrical Engineering (ICEE), Tabriz, Iran, 4–6 August 2020; pp. 828–832. [Google Scholar]
- Khan, M.A. HCRNNIDS: Hybrid Convolutional Recurrent Neural Network-Based Network Intrusion Detection System. Processes 2021, 9, 834. [Google Scholar] [CrossRef]
- Chen, Y.; Lin, Q.; Wei, W.; Ji, J.; Wong, K.-C.; Coello, C.A.C. Intrusion detection using multi-objective evolutionary convolutional neural network for Internet of Things in Fog computing. Knowl. Based Syst. 2022, 244, 108505. [Google Scholar] [CrossRef]
- Cheng, P.; Xu, K.; Li, S.; Han, M. TCAN-IDS: Intrusion Detection System for Internet of Vehicle Using Temporal Convolutional Attention Network. Symmetry 2022, 14, 310. [Google Scholar] [CrossRef]
- Thilagam, T.; Aruna, R. Intrusion detection for network based cloud computing by custom RC-NN and optimization. ICT Express 2021, 7, 512–520. [Google Scholar] [CrossRef]
- Desta, A.K.; Ohira, S.; Arai, I.; Fujikawa, K. Rec-CNN: In-vehicle networks intrusion detection using convolutional neural networks trained on recurrence plots. Veh. Commun. 2022, 35, 100470. [Google Scholar] [CrossRef]
- Elsayed, M.S.; Le-Khac, N.-A.; Jahromi, H.Z.; Jurcut, A.D. A Hybrid CNN-LSTM Based Approach for Anomaly Detection Systems in SDNs. In Proceedings of the 16th International Conference on Availability, Reliability and Security, Vienna, Austria, 17–20 August 2021. [Google Scholar]
- Lo, W.; Alqahtani, H.; Thakur, K.; Almadhor, A.; Chander, S.; Kumar, G. A hybrid deep learning based intrusion detection system using spatial-temporal representation of in-vehicle network traffic. Veh. Commun. 2022, 35, 100471. [Google Scholar] [CrossRef]
- Yang, X.; Peng, G.; Zhang, D.; Lv, Y. An Enhanced Intrusion Detection System for IoT Networks Based on Deep Learning and Knowledge Graph. Secur. Commun. Netw. 2022, 2022, 4748528. [Google Scholar] [CrossRef]
- Cui, J.; Zong, L.; Xie, J.; Tang, M. A novel multi-module integrated intrusion detection system for high-dimensional imbalanced data. Appl. Intell. 2022, 1–17. [Google Scholar] [CrossRef]
- Elsayed, N.; Zaghloul, Z.S.; Azumah, S.W.; Li, C. Intrusion Detection System in Smart Home Network Using Bidirectional LSTM and Convolutional Neural Networks Hybrid Model. In Proceedings of the 2021 IEEE International Midwest Symposium on Circuits and Systems (MWSCAS), Lansing, MI, USA, 9–11 August 2021; pp. 55–58. [Google Scholar]
- Kanna, P.R.; Santhi, P. Unified deep learning approach for efficient intrusion detection system using integrated spatial–temporal features. Knowl. Based Syst. 2021, 226, 107132. [Google Scholar] [CrossRef]
- Meliboev, A.; Alikhanov, J.; Kim, W. Performance Evaluation of Deep Learning Based Network Intrusion Detection System across Multiple Balanced and Imbalanced Datasets. Electronics 2022, 11, 515. [Google Scholar] [CrossRef]
- Min, E.; Long, J.; Liu, Q.; Cui, J.; Chen, W. TR-IDS: Anomaly-based intrusion detection through text-convolutional neural network and random forest. Secur. Commun. Netw. 2018, 2018, 4943509. [Google Scholar] [CrossRef]
- Zhang, Y.; Ran, X. A Step-Based Deep Learning Approach for Network Intrusion Detection. C. Model. Eng. Sci. 2021, 128, 1231–1245. [Google Scholar] [CrossRef]
- Yong, L.; Bo, Z. An Intrusion Detection Model Based on Multi-scale CNN. In Proceedings of the 2019 IEEE 3rd Information Technology, Networking, Electronic and Automation Control Conference (ITNEC 2019), Chengdu, China, 15–17 March 2019; pp. 214–218. [Google Scholar]
- Yu, L.; Dong, J.; Chen, L.; Li, M.; Xu, B.; Li, Z.; Qiao, L.; Liu, L.; Zhao, B.; Zhang, C. PBCNN: Packet Bytes-based Convolutional Neural Network for Network Intrusion Detection. Comput. Netw. 2021, 194, 108117. [Google Scholar] [CrossRef]
- Wang, H.; Li, W. DDosTC: A transformer-based network attack detection hybrid mechanism in SDN. Sensors 2021, 21, 5047. [Google Scholar] [CrossRef]
- Yin, S.; Zhang, X.; Liu, S. Intrusion detection for capsule networks based on dual routing mechanism. Comput. Netw. 2021, 197, 108328. [Google Scholar] [CrossRef]
- Xiao, Y.; Xing, C.; Zhang, T.; Zhao, Z. An Intrusion Detection Model Based on Feature Reduction and Convolutional Neural Networks. IEEE Access 2019, 7, 42210–42219. [Google Scholar] [CrossRef]
- Moustakidis, S.; Karlsson, P. A novel feature extraction methodology using Siamese convolutional neural networks for intrusion detection. Cybersecurity 2020, 3, 1–13. [Google Scholar] [CrossRef]
- Mendonca, R.V.; Teodoro, A.A.; Rosa, R.L.; Saadi, M.; Melgarejo, D.C.; Nardelli, P.H.; Rodríguez, D.Z. Intrusion Detection System Based on Fast Hierarchical Deep Convolutional Neural Network. IEEE Access 2021, 9, 61024–61034. [Google Scholar] [CrossRef]
- Liu, K.; Fan, Z.; Liu, M.; Zhang, S. Hybrid Intrusion Detection Method Based on K-means and CNN for Smart Home. In Proceedings of the 2018 IEEE 8th Annual International Conference on Cyber Technology in Automation, Control, and Intelligent Systems (IEEE-Cyber), Tianjin, China, 19–23 July 2018; pp. 312–317. [Google Scholar]
- Khan, A.S.; Ahmad, Z.; Abdullah, J.; Ahmad, F. A Spectrogram Image-Based Network Anomaly Detection System Using Deep Convolutional Neural Network. IEEE Access 2021, 9, 87079–87093. [Google Scholar] [CrossRef]
- Chen, X.; Cao, C.; Mai, J. Network Anomaly Detection Based on Deep Support Vector Data Description. In Proceedings of the 2020 5th IEEE International Conference on Big Data Analytics (IEEE ICBDA 2020), Xiamen, China, 8–11 May 2020; pp. 251–255. [Google Scholar]
- Zhang, J.; Li, F.; Ye, F. An Ensemble-based Network Intrusion Detection Scheme with Bayesian Deep Learning. In Proceedings of the ICC 2020-2020 IEEE International Conference on Communications (ICC), Dublin, Ireland, 7–11 June 2020. [Google Scholar]
- Dahou, A.; Abd Elaziz, M.; Chelloug, S.A.; Awadallah, M.A.; Al-Betar, M.A.; Al-qaness, M.A.; Forestiero, A. Intrusion Detection System for IoT Based on Deep Learning and Modified Reptile Search Algorithm. Comput. Intell. Neurosci. 2022, 2022, 6473507. [Google Scholar] [CrossRef]
- Mondal, A.; Goswami, R.T. Enhanced Honeypot cryptographic scheme and privacy preservation for an effective prediction in cloud security. Microprocess. Microsyst. 2021, 81, 103719. [Google Scholar] [CrossRef]
- Haq, M.A.; Khan, M.A.R.; Talal, A.-H. Development of PCCNN-Based Network Intrusion Detection System for EDGE Computing. C. Mater. Contin. 2022, 71, 1769–1788. [Google Scholar]
- Deng, L.; Yu, D. Deep learning: Methods and applications. Found. Trends® Signal Process. 2014, 7, 197–387. [Google Scholar] [CrossRef]
- Chouhan, N.; Khan, A. Network anomaly detection using channel boosted and residual learning based deep convolutional neural network. Appl. Soft Comput. 2019, 83, 105612. [Google Scholar] [CrossRef]
- Mrazova, I.; Kukacka, M. Can deep neural networks discover meaningful pattern features? Procedia Comput. Sci. 2012, 12, 194–199. [Google Scholar] [CrossRef]
- Tian, C.; Fei, L.; Zheng, W.; Xu, Y.; Zuo, W.; Lin, C.-W. Deep learning on image denoising: An overview. Neural Netw. 2020, 131, 251–275. [Google Scholar] [CrossRef]
- Song, Z. English speech recognition based on deep learning with multiple features. Computing 2020, 102, 663–682. [Google Scholar] [CrossRef]
- Yadav, A.; Vishwakarma, D.K. Sentiment analysis using deep learning architectures: A review. Artif. Intell. Rev. 2020, 53, 4335–4385. [Google Scholar] [CrossRef]
- LeCun, Y.; Bengio, Y.; Hinton, G. Deep learning. Nature 2015, 521, 436–444. [Google Scholar] [CrossRef]
- Bjornson, E.; Giselsson, P. Two applications of deep learning in the physical layer of communication systems [lecture notes]. IEEE Signal Process. Mag. 2020, 37, 134–140. [Google Scholar] [CrossRef]
- Guo, G.; Zhang, N. A survey on deep learning based face recognition. Comput. Vis. Image Underst. 2019, 189, 102805. [Google Scholar] [CrossRef]
- Wallach, I.; Dzamba, M.; Heifets, A. AtomNet: A deep convolutional neural network for bioactivity prediction in structure-based drug discovery. arXiv 2015, arXiv:1510.02855. [Google Scholar]
- Hubel, D.H.; Wiesel, T.N. Receptive fields and functional architecture of monkey striate cortex. J. Physiol. 1968, 195, 215–243. [Google Scholar] [CrossRef]
- Yamashita, R.; Nishio, M.; Do, R.K.G.; Togashi, K. Convolutional neural networks: An overview and application in radiology. Insights Imaging 2018, 9, 611–629. [Google Scholar] [CrossRef] [PubMed]
- Albawi, S.T.; Mohammed, A.; Al-Zawi, S. Understanding of a convolutional neural network. In Proceedings of the 2017 International Conference on Engineering and Technology (ICET), Antalya, Turkey, 21–23 August 2017; pp. 1–6. [Google Scholar] [CrossRef]
- Zhang, Q.; Zhang, M.; Chen, T.; Sun, Z.; Ma, Y.; Yu, B. Recent advances in convolutional neural network acceleration. Neurocomputing 2019, 323, 37–51. [Google Scholar] [CrossRef]
- Hinton, G.E.; Srivastava, N.; Krizhevsky, A.; Sutskever; Salakhutdinov, R.R. Improving neural networks by preventing co-adaptation of feature detectors. arXiv 2012, arXiv:1207.0580. [Google Scholar]
- Zeiler, M.D.; Fergus, R. Visualizing and understanding convolutional networks. In Lecture Notes in Computer Science (Including Subseries Lecture Notes in Artificial Intelligence and Lecture Notes in Bioinformatics, Proceedings of the 13th European Conference 2014, Zurich, Switzerland, 6–12 September 2014; Springer: Berlin/Heidelberg, Germany, 2014; Volume 8689, pp. 818–833. [Google Scholar] [CrossRef]
- Simonyan, K.; Zisserman, A. Very deep convolutional networks for large-scale image recognition. In Proceedings of the 3rd International Conference on Learning Representations, Conference Track Proceedings, ICLR 2015, San Diego, CA, USA, 7–9 May 2015. [Google Scholar]
- Duchi, J.; Hazan, E.; Singer, Y. Adaptive subgradient methods for online learning and stochastic optimization. In Proceedings of the 23rd Annual Conference on Learning Theory (COLT 2010), Haifa, Israel, 27–29 June 2010; Volume 12, pp. 257–269. [Google Scholar]
- Zeiler, M.D. ADADELTA: An Adaptive Learning Rate Method. 2012. Available online: http://arxiv.org/abs/1212.5701 (accessed on 1 February 2022).
- Kingma, D.P.; Ba, J. Adam: A Method for Stochastic Optimization. arXiv 2014, arXiv:1412.6980. [Google Scholar]
- Gulshan, V.; Peng, L.; Coram, M.; Stumpe, M.C.; Wu, D.; Narayanaswamy, A.; Venugopalan, S.; Widner, K.; Madams, T.; Cuadros, J.; et al. Development and validation of a deep learning algorithm for detection of diabetic retinopathy in retinal fundus photographs. JAMA 2016, 316, 2402–2410. [Google Scholar] [CrossRef]
- Yu, Y.; Si, X.; Hu, C.; Zhang, J. A review of recurrent neural networks: LSTM cells and network architectures. Neural Comput. 2019, 31, 1235–1270. [Google Scholar] [CrossRef]
- KDD Cup; UCI KDD Archiv: Irvine, CA, USA, 28 October 1999. Available online: https://kdd.ics.uci.edu/databases/kddcup99/kddcup99.html (accessed on 1 February 2022).
- Tavallaee, M.; Bagheri, E.; Lu, W.; Ghorbani, A.A. A detailed analysis of the KDD CUP 99 data set. In Proceedings of the IEEE Symposium on Computational Intelligence for Security and Defense Applications, CISDA 2009, Ottawa, ON, Canada, 8–10 July 2009; pp. 1–6. [Google Scholar] [CrossRef]
- Revathi, D.a.M.S.; Revathi, S.; Malathi, A. A detailed analysis on NSL-KDD dataset using various machine learning techniques for intrusion detection. Int. J. Eng. Res. Technol. 2013, 2, 1848–1853. Available online: http://citeseerx.ist.psu.edu/viewdoc/download?doi=10.1.1.680.6760&rep=rep1&type=pdf (accessed on 1 February 2022).
- Kayacik, H.G.; Zincir-Heywood, A.N.; Heywood, I.M. Selecting features for intrusion detection: A feature relevance analysis on KDD 99 intrusion detection datasets. In Proceedings of the Third Annual Conference on Privacy, Security and Trust, San Francisco, CA, USA, 20–22 October 2010; Volume 94, pp. 1722–1723. [Google Scholar]
- Moustafa, N.; Jill, S. UNSW-NB15: A comprehensive data set for network intrusion detection systems (UNSW-NB15 network data set). In Proceedings of the Military Communications and Information Systems Conference (MilCIS), Canberra, ACT, Australia, 10–12 November 2015; IEEE: Manhattan, NY, USA; pp. 1–6. [Google Scholar] [CrossRef]
- Moustafa, N.; Slay, J. The evaluation of Network Anomaly Detection Systems: Statistical analysis of the UNSW-NB15 data set and the comparison with the KDD99 data set. Inf. Secur. J. 2016, 25, 18–31. [Google Scholar] [CrossRef]
- Sharafaldin, I.; Lashkari, A.H.; Ghorbani, A.A. Toward generating a new intrusion detection dataset and intrusion traffic characterization. In Proceedings of the ICISSP 2018–Proceedings of the 4th International Conference on Information Systems Security and Privacy, Funchal, Portugal, 22–24 January 2018; Volume 2018, pp. 108–116. [Google Scholar] [CrossRef]
- Sharafaldin, I.; Gharib, A.; Lashkari, A.H.; Ghorbani, A.A. Towards a reliable intrusion detection benchmark dataset. Softw. Netw. 2018, 2018, 177–200. [Google Scholar] [CrossRef]
- D’hooge, L.; Wauters, T.; Volckaert, B.; De Turck, F. Classification hardness for supervised learners on 20 years of intrusion detection data. IEEE Access 2019, 7, 167455–167469. [Google Scholar] [CrossRef]
- Jaganathan, V.; Cherurveettil, P.; Sivashanmugam, P.M. Using a prediction model to manage cyber security threats. Sci. World J. 2015, 2015, 703713. [Google Scholar] [CrossRef] [PubMed]
- Ding, Y.; Zhai, Y. Intrusion detection system for NSL-KDD dataset using convolutional neural networks. In Proceedings of the 2018 2nd International Conference on Computer Science and Artificial Intelligence, Shenzhen, China, 8–10 December 2018; pp. 81–85. [Google Scholar]
- Wu, K.; Chen, Z.; Li, W. A novel intrusion detection model for a massive network using convolutional neural networks. IEEE Access 2018, 6, 50850–50859. [Google Scholar] [CrossRef]
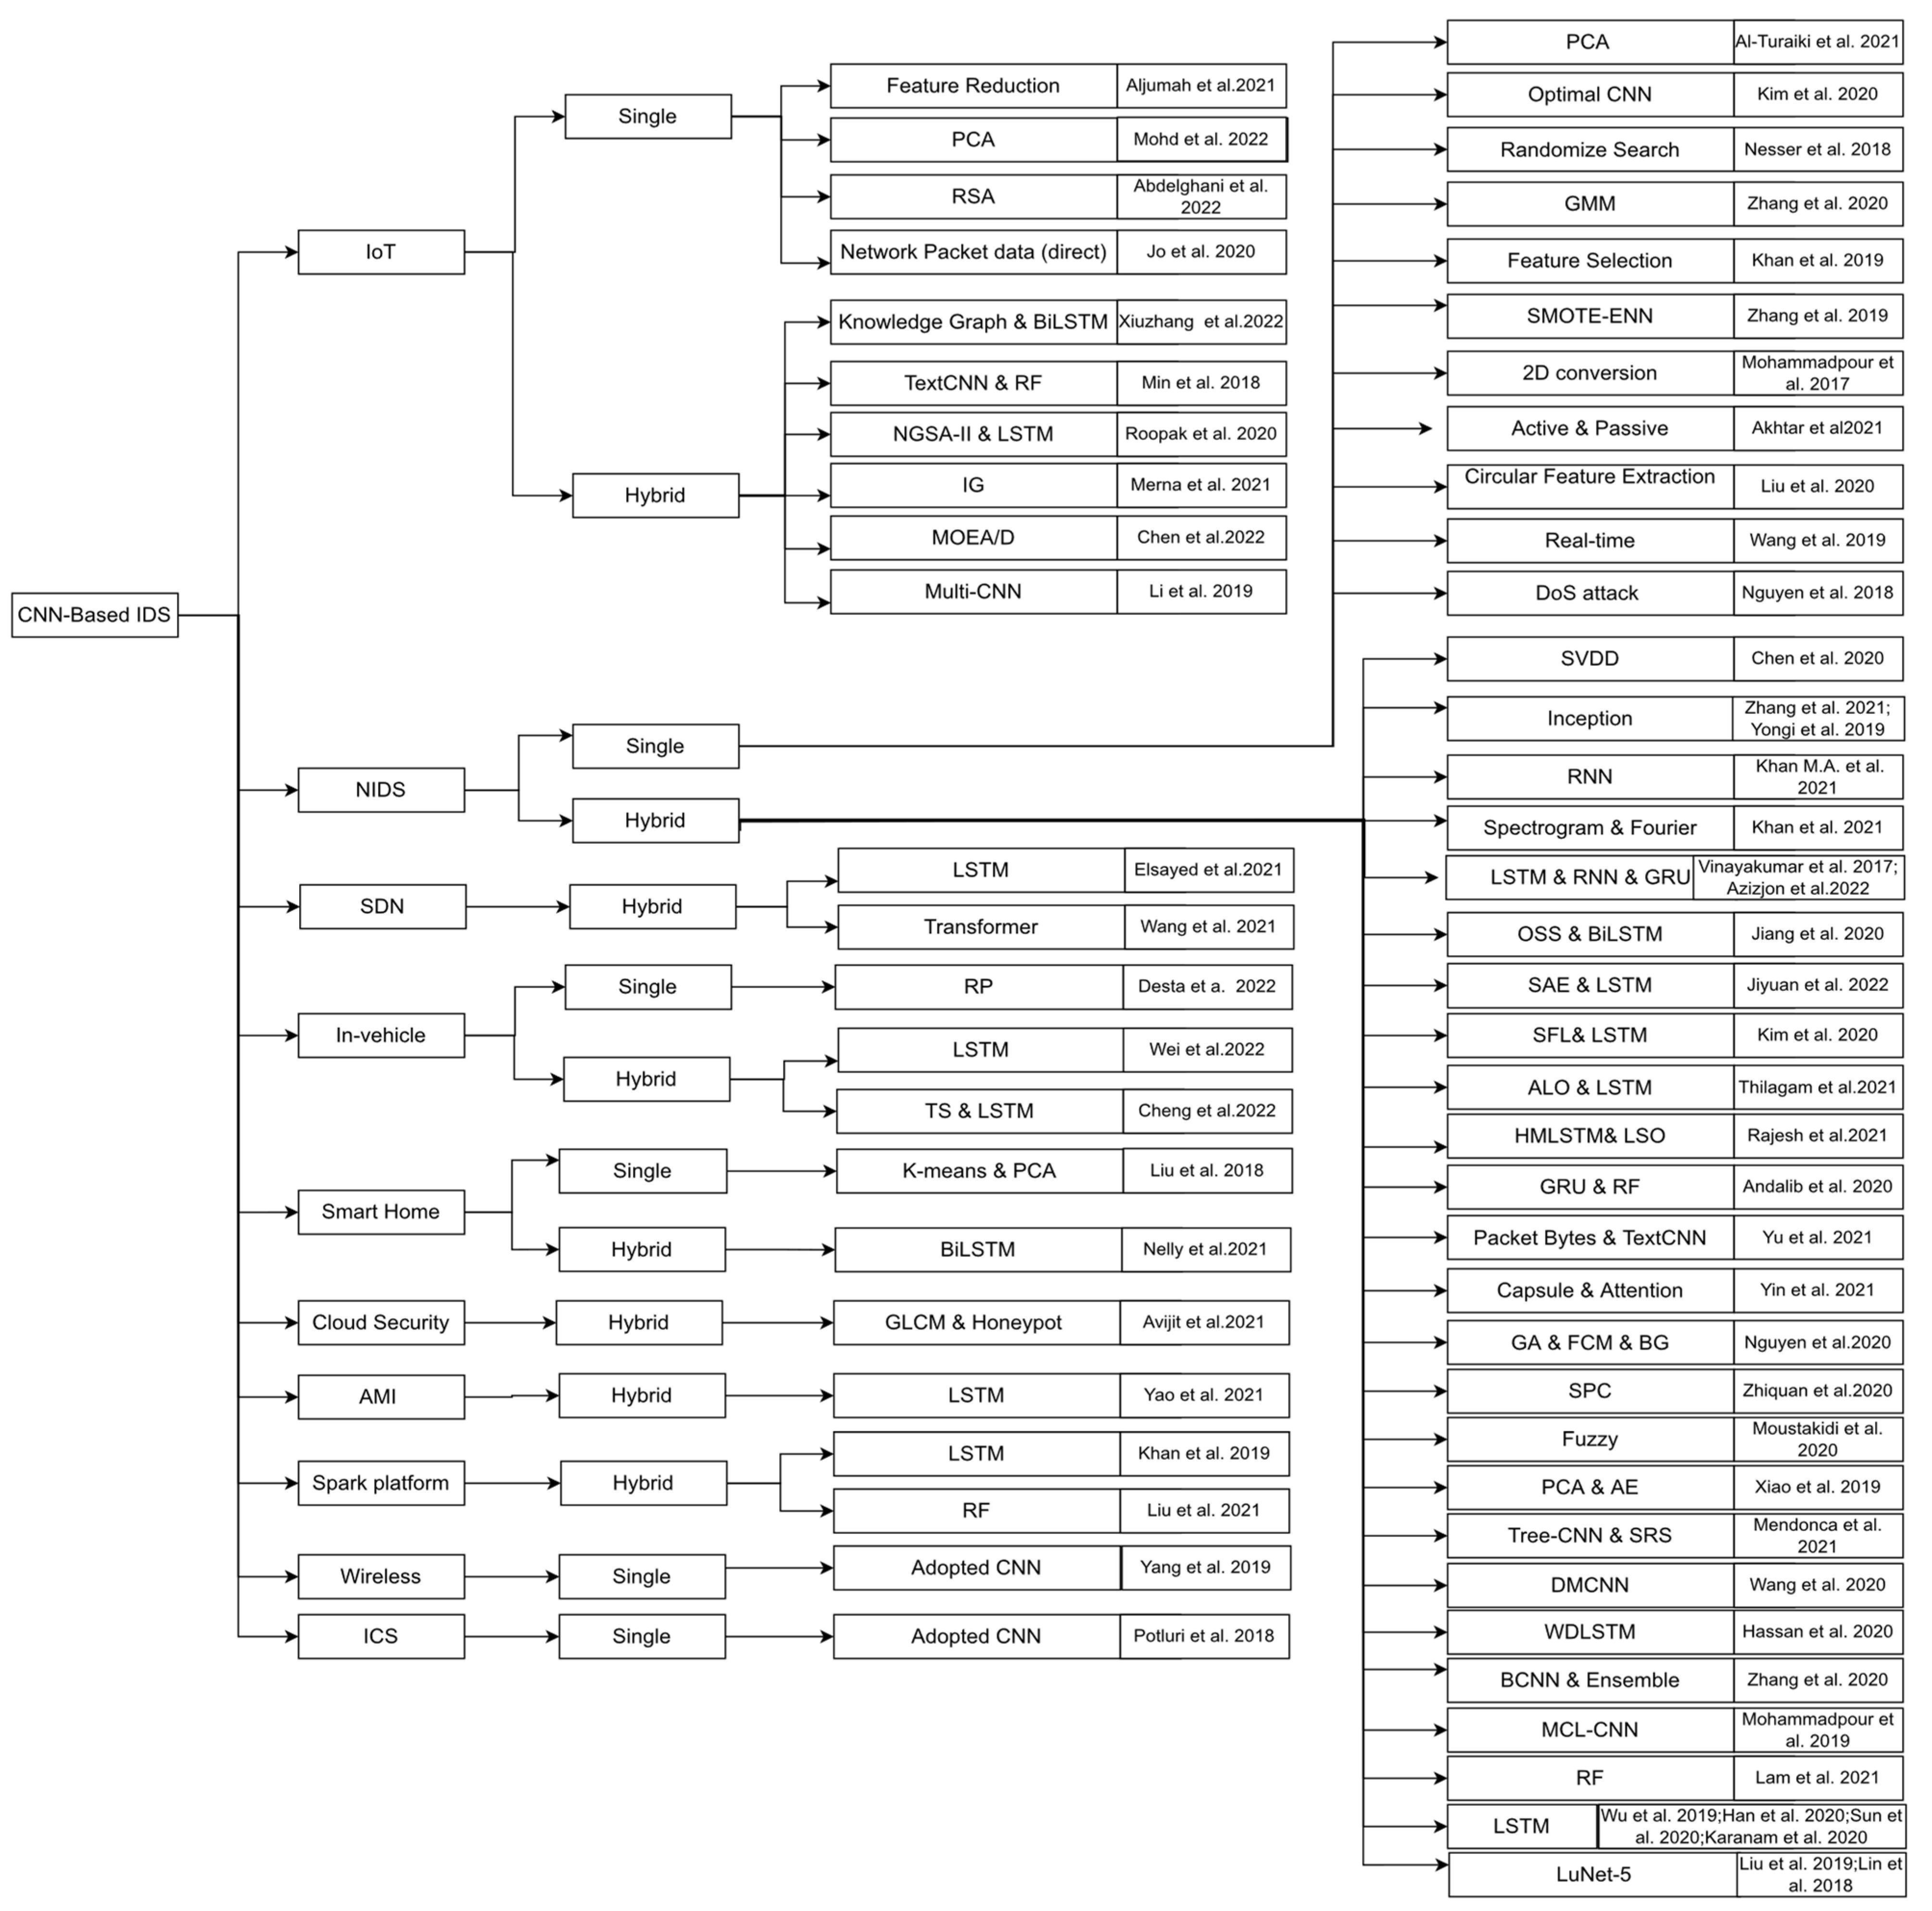
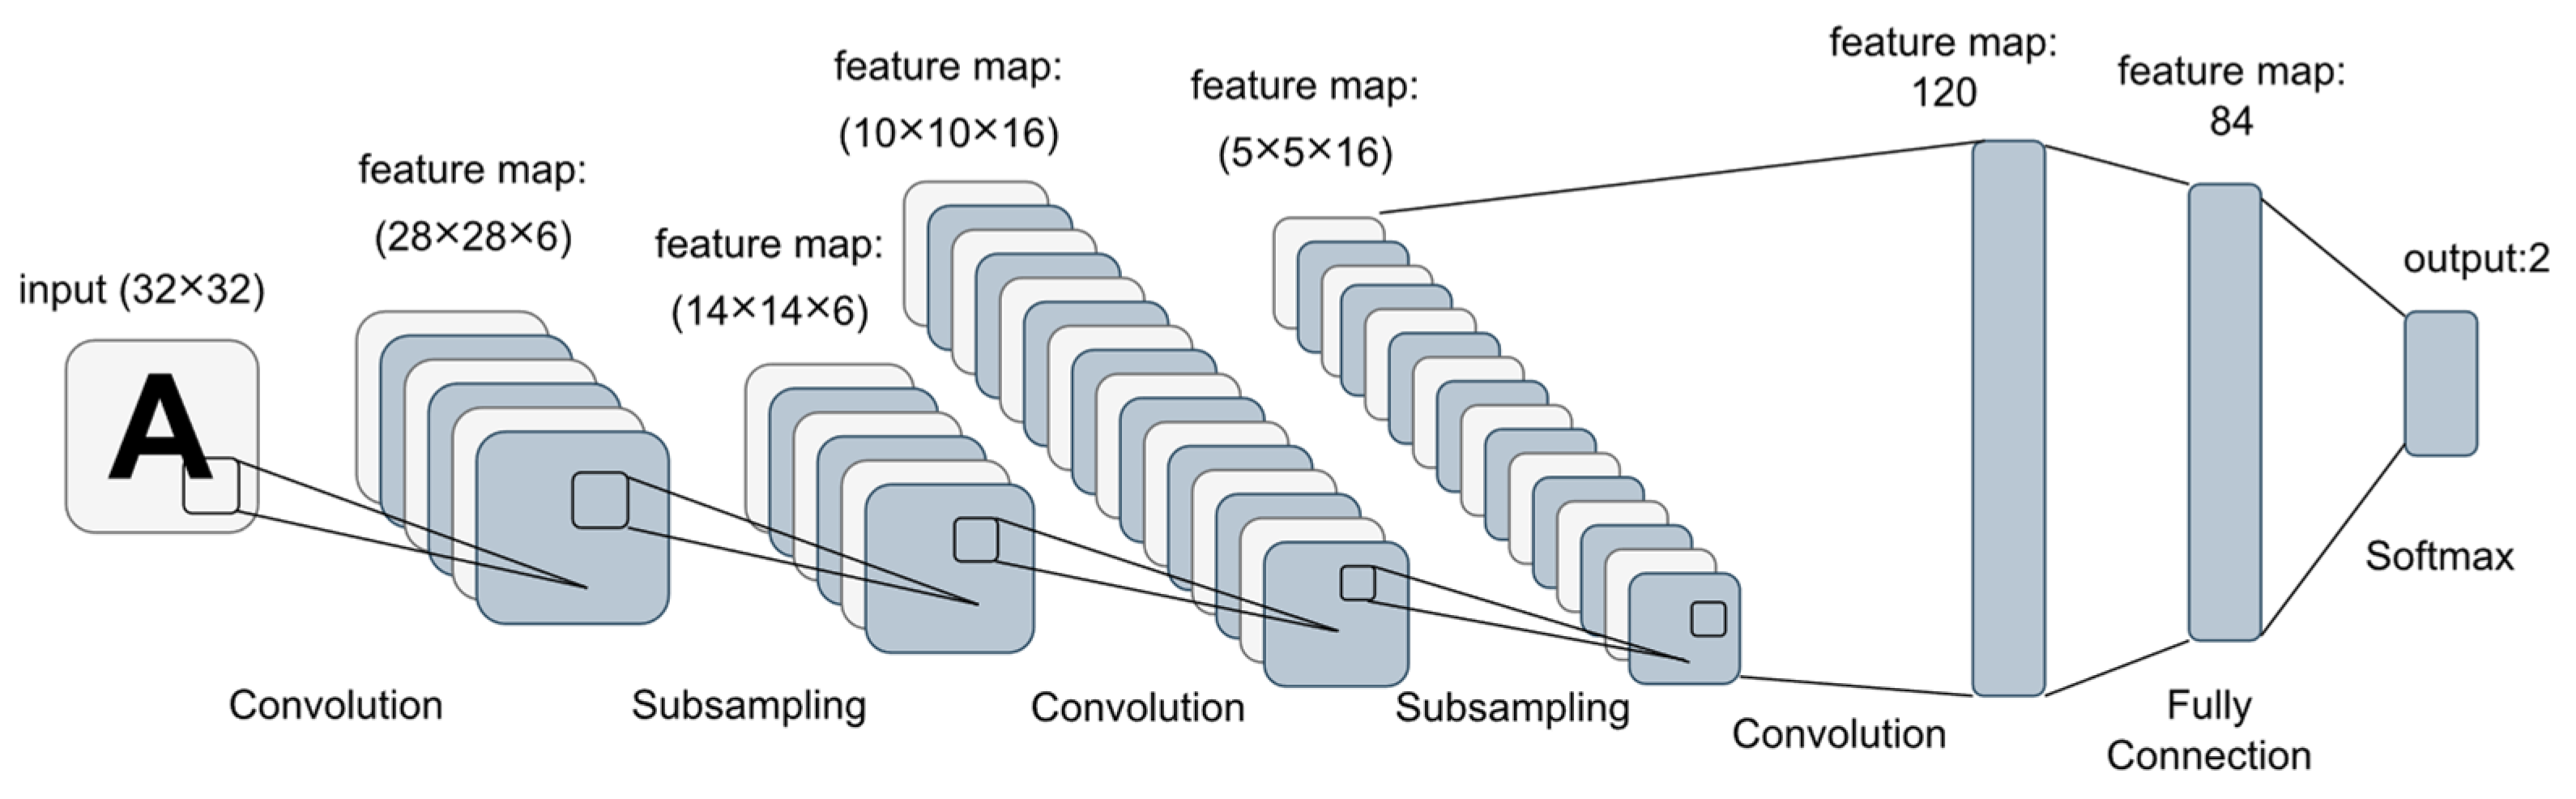
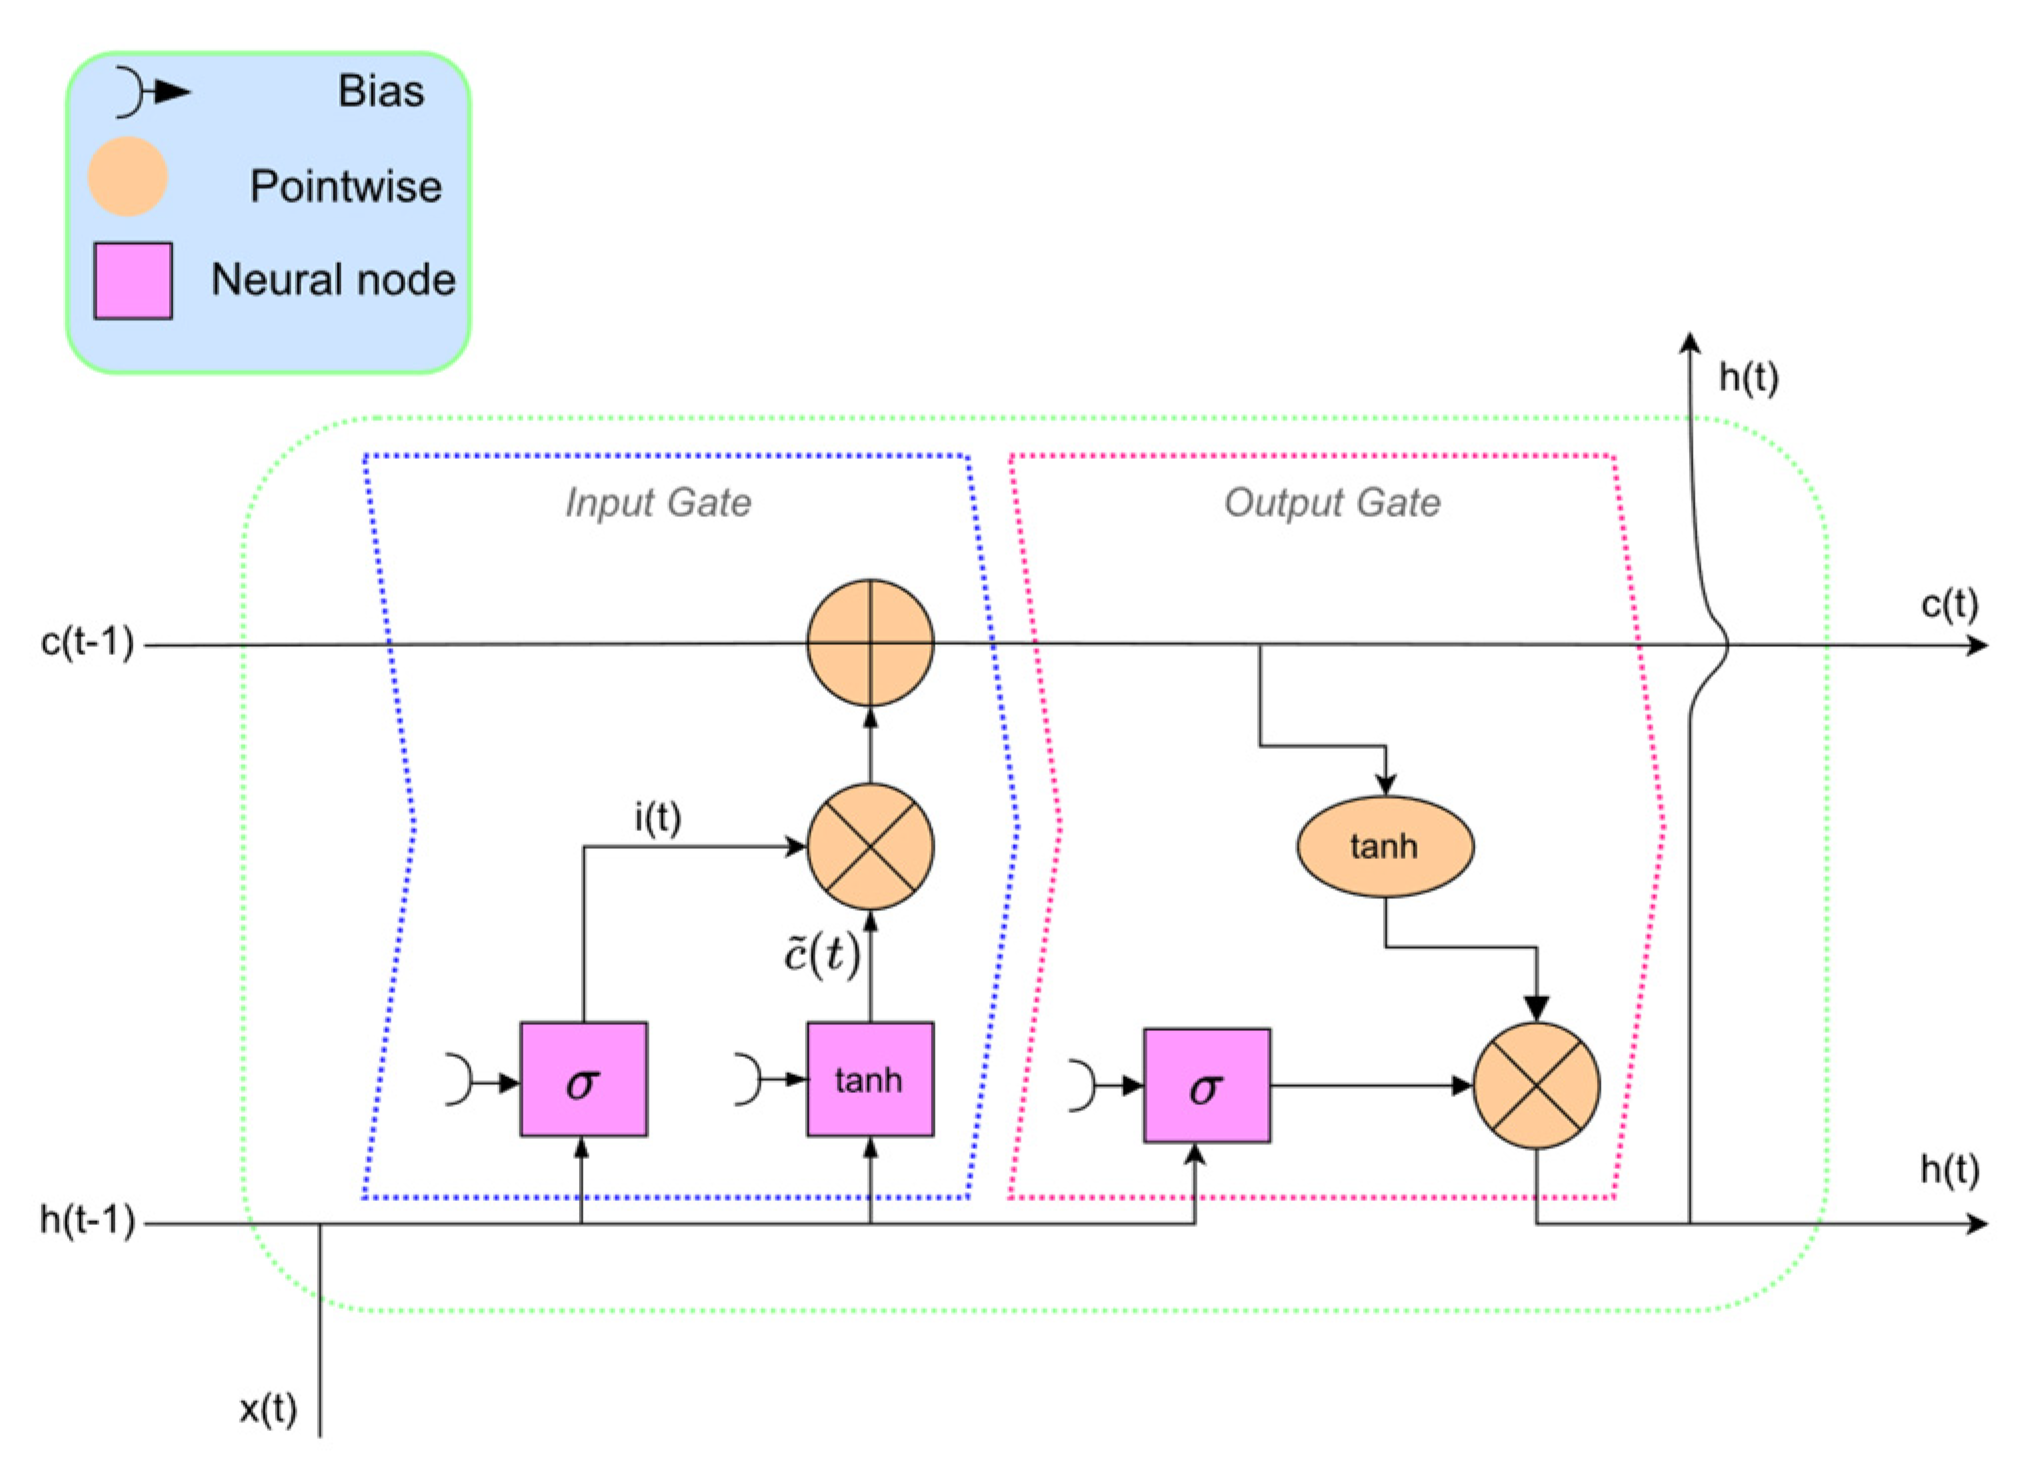


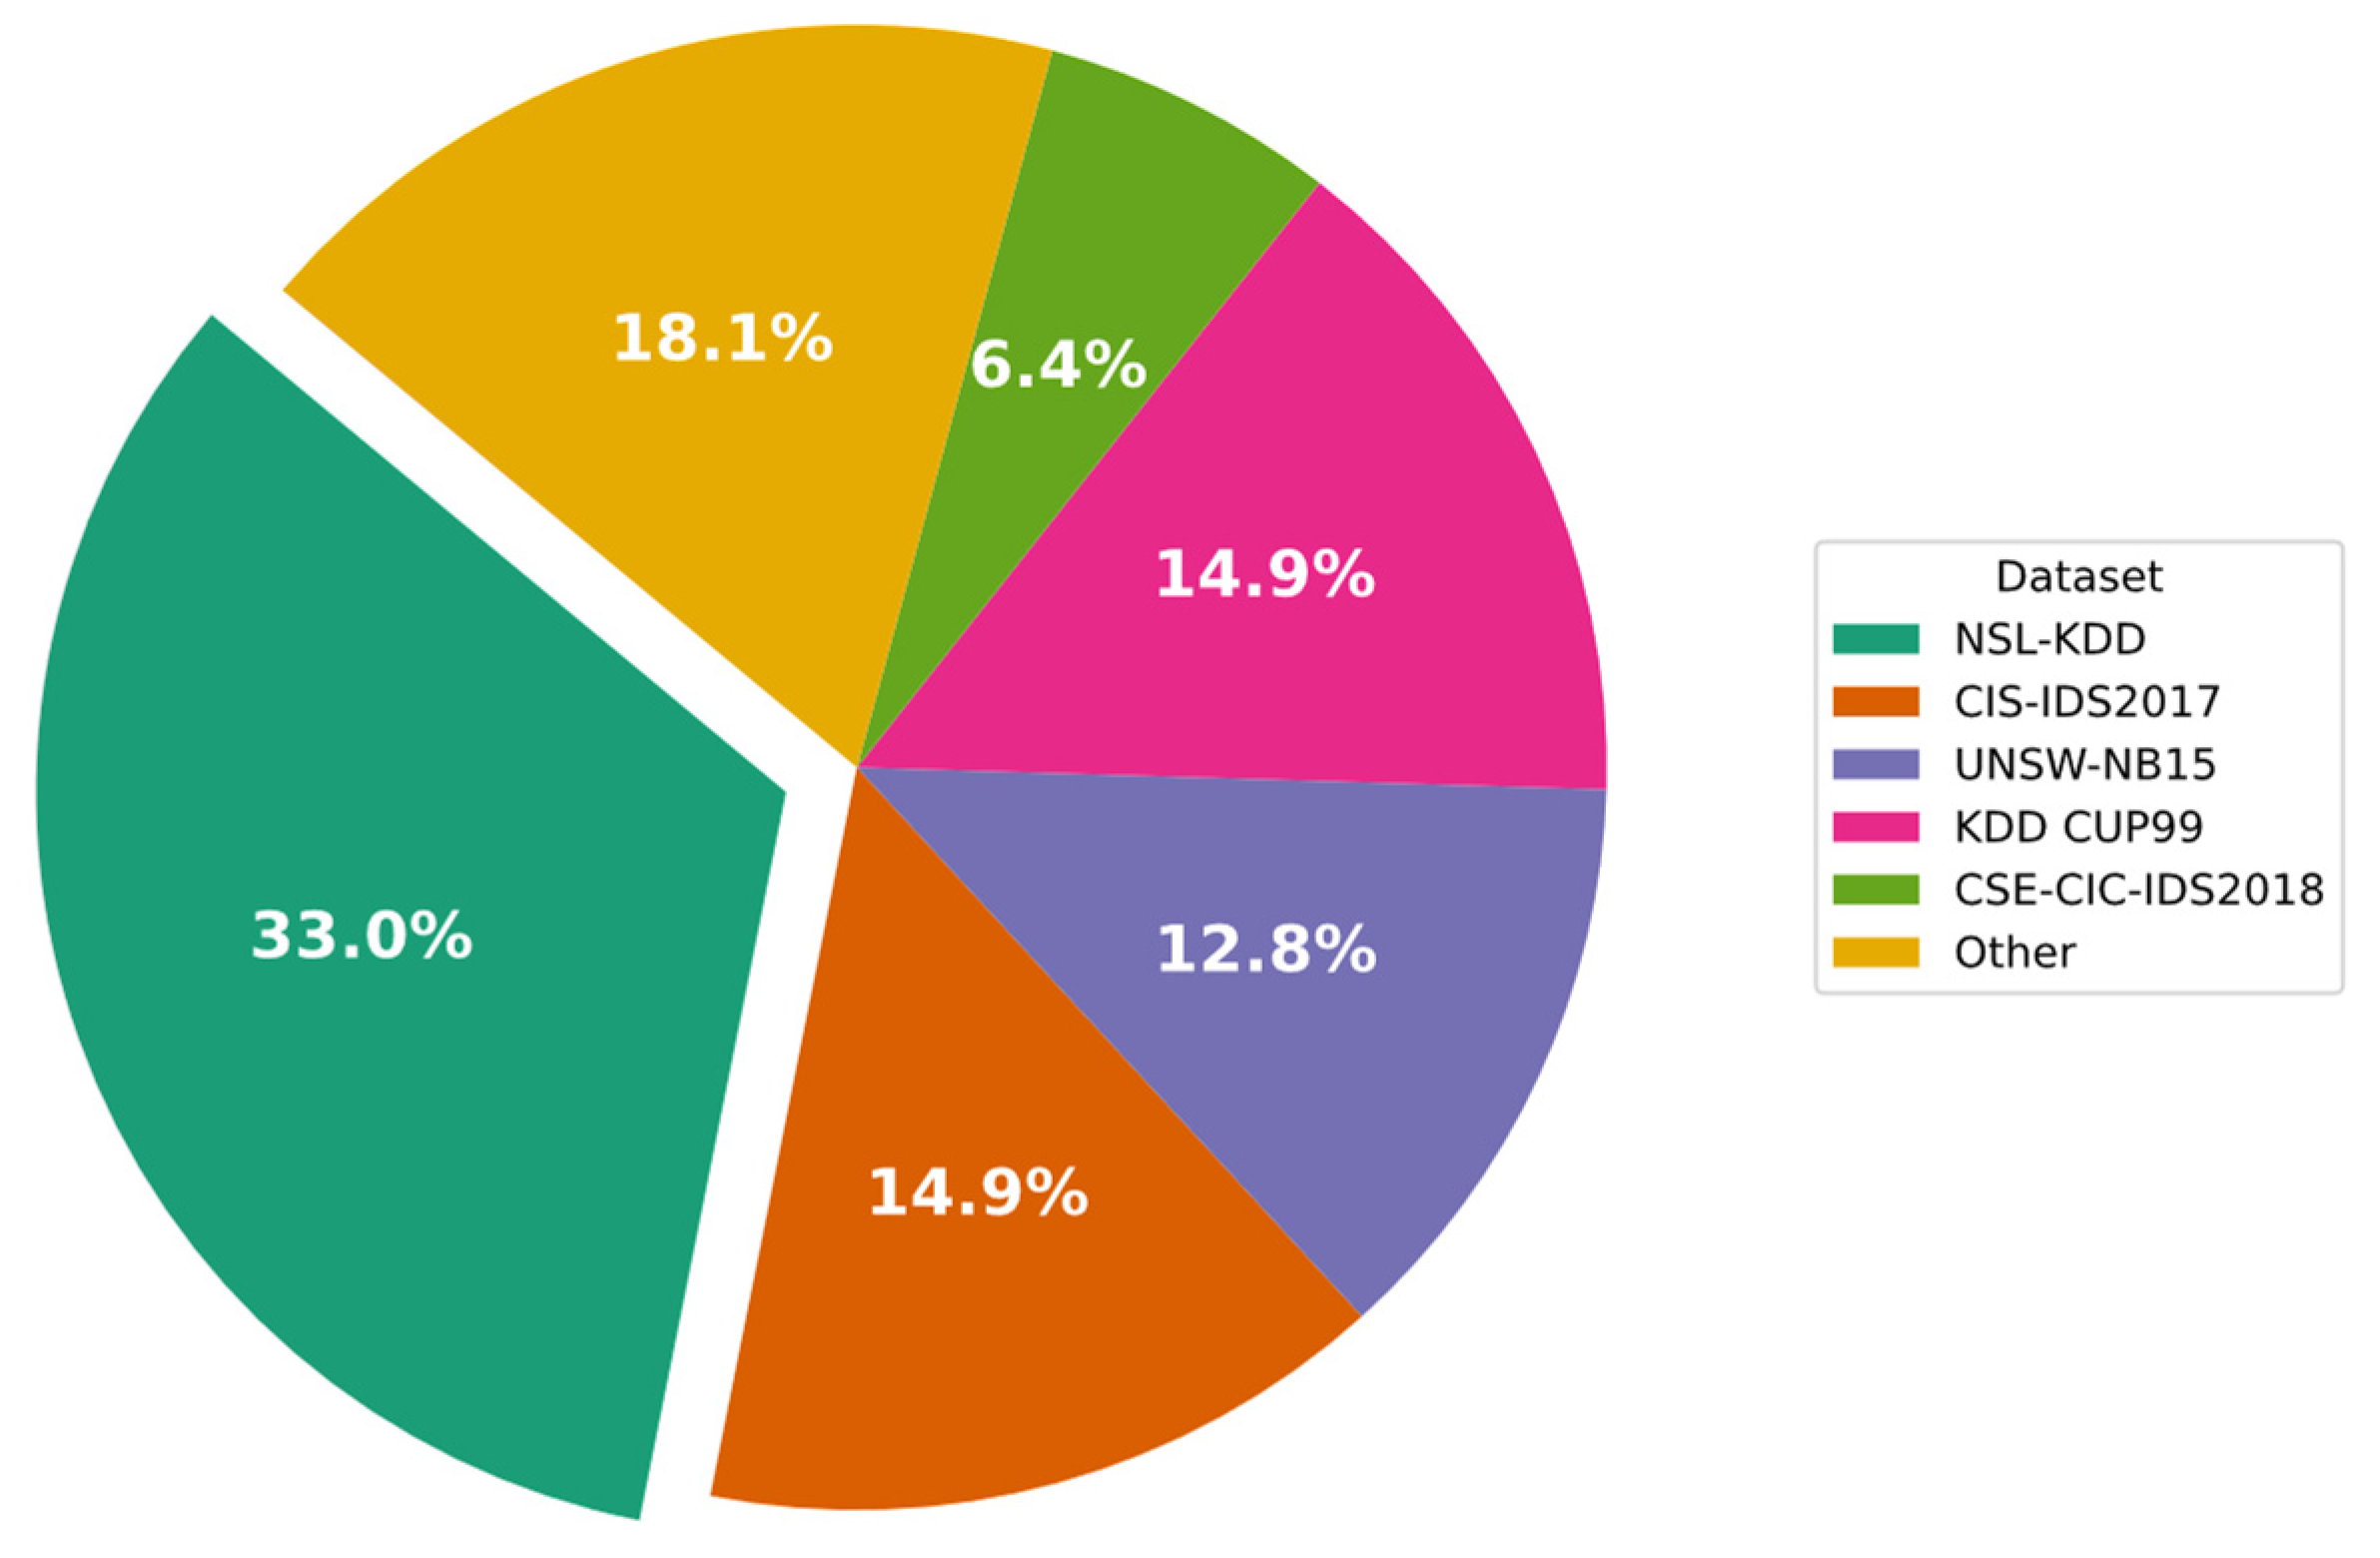
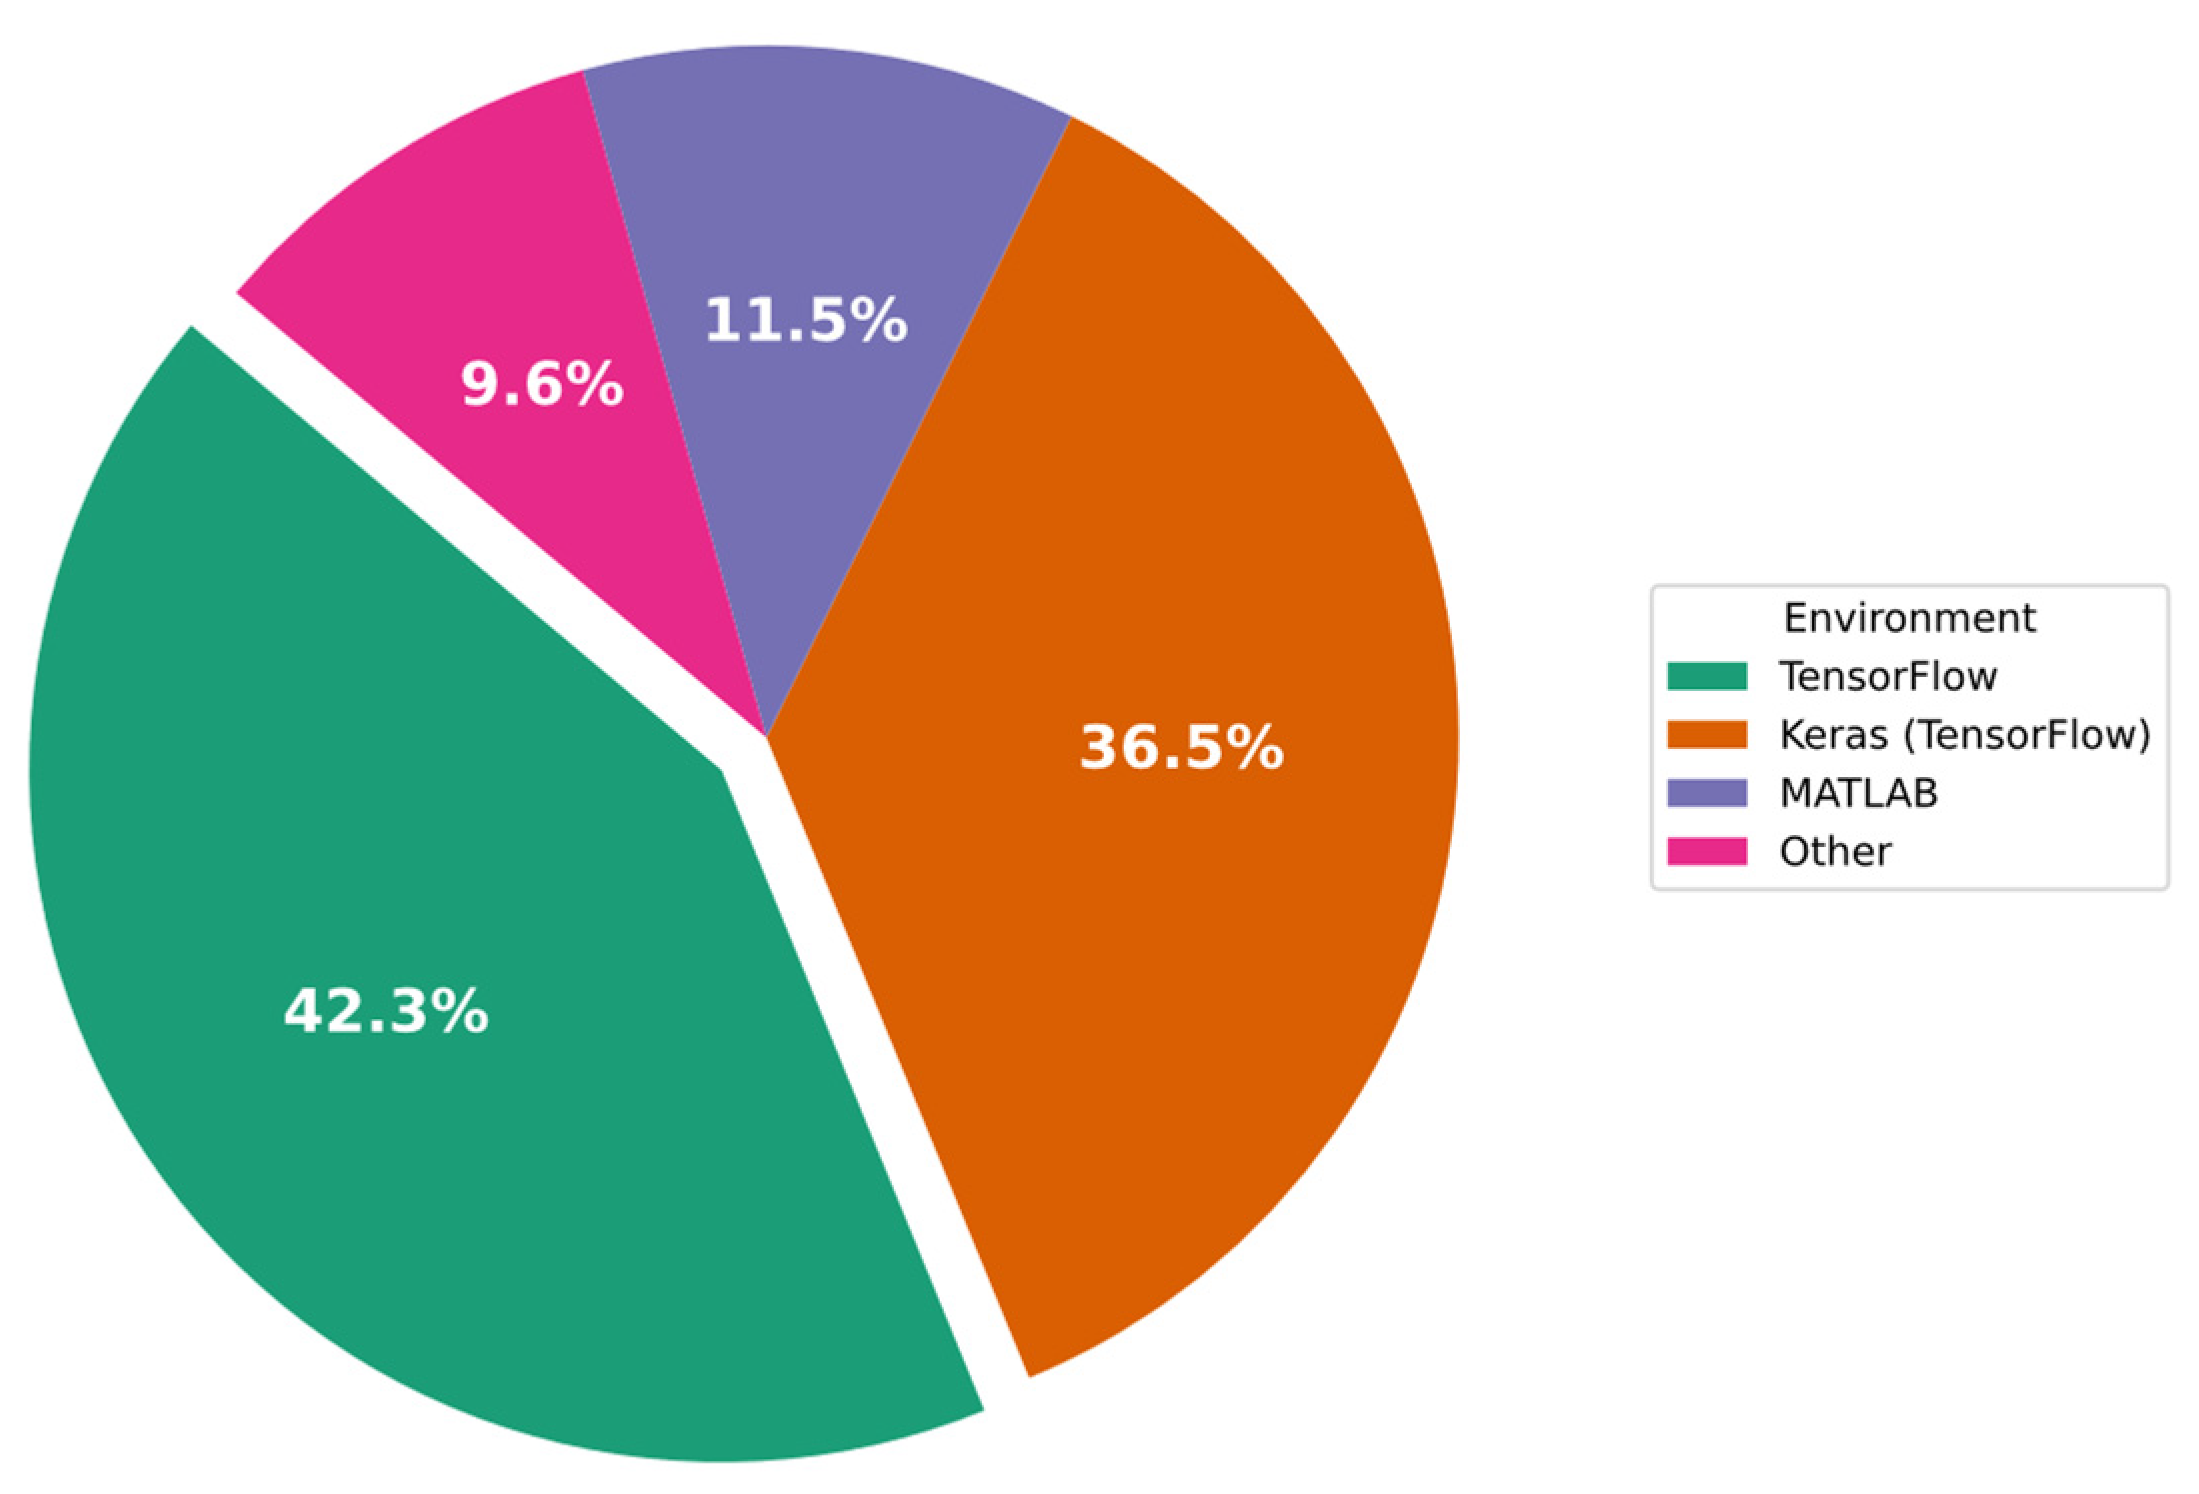

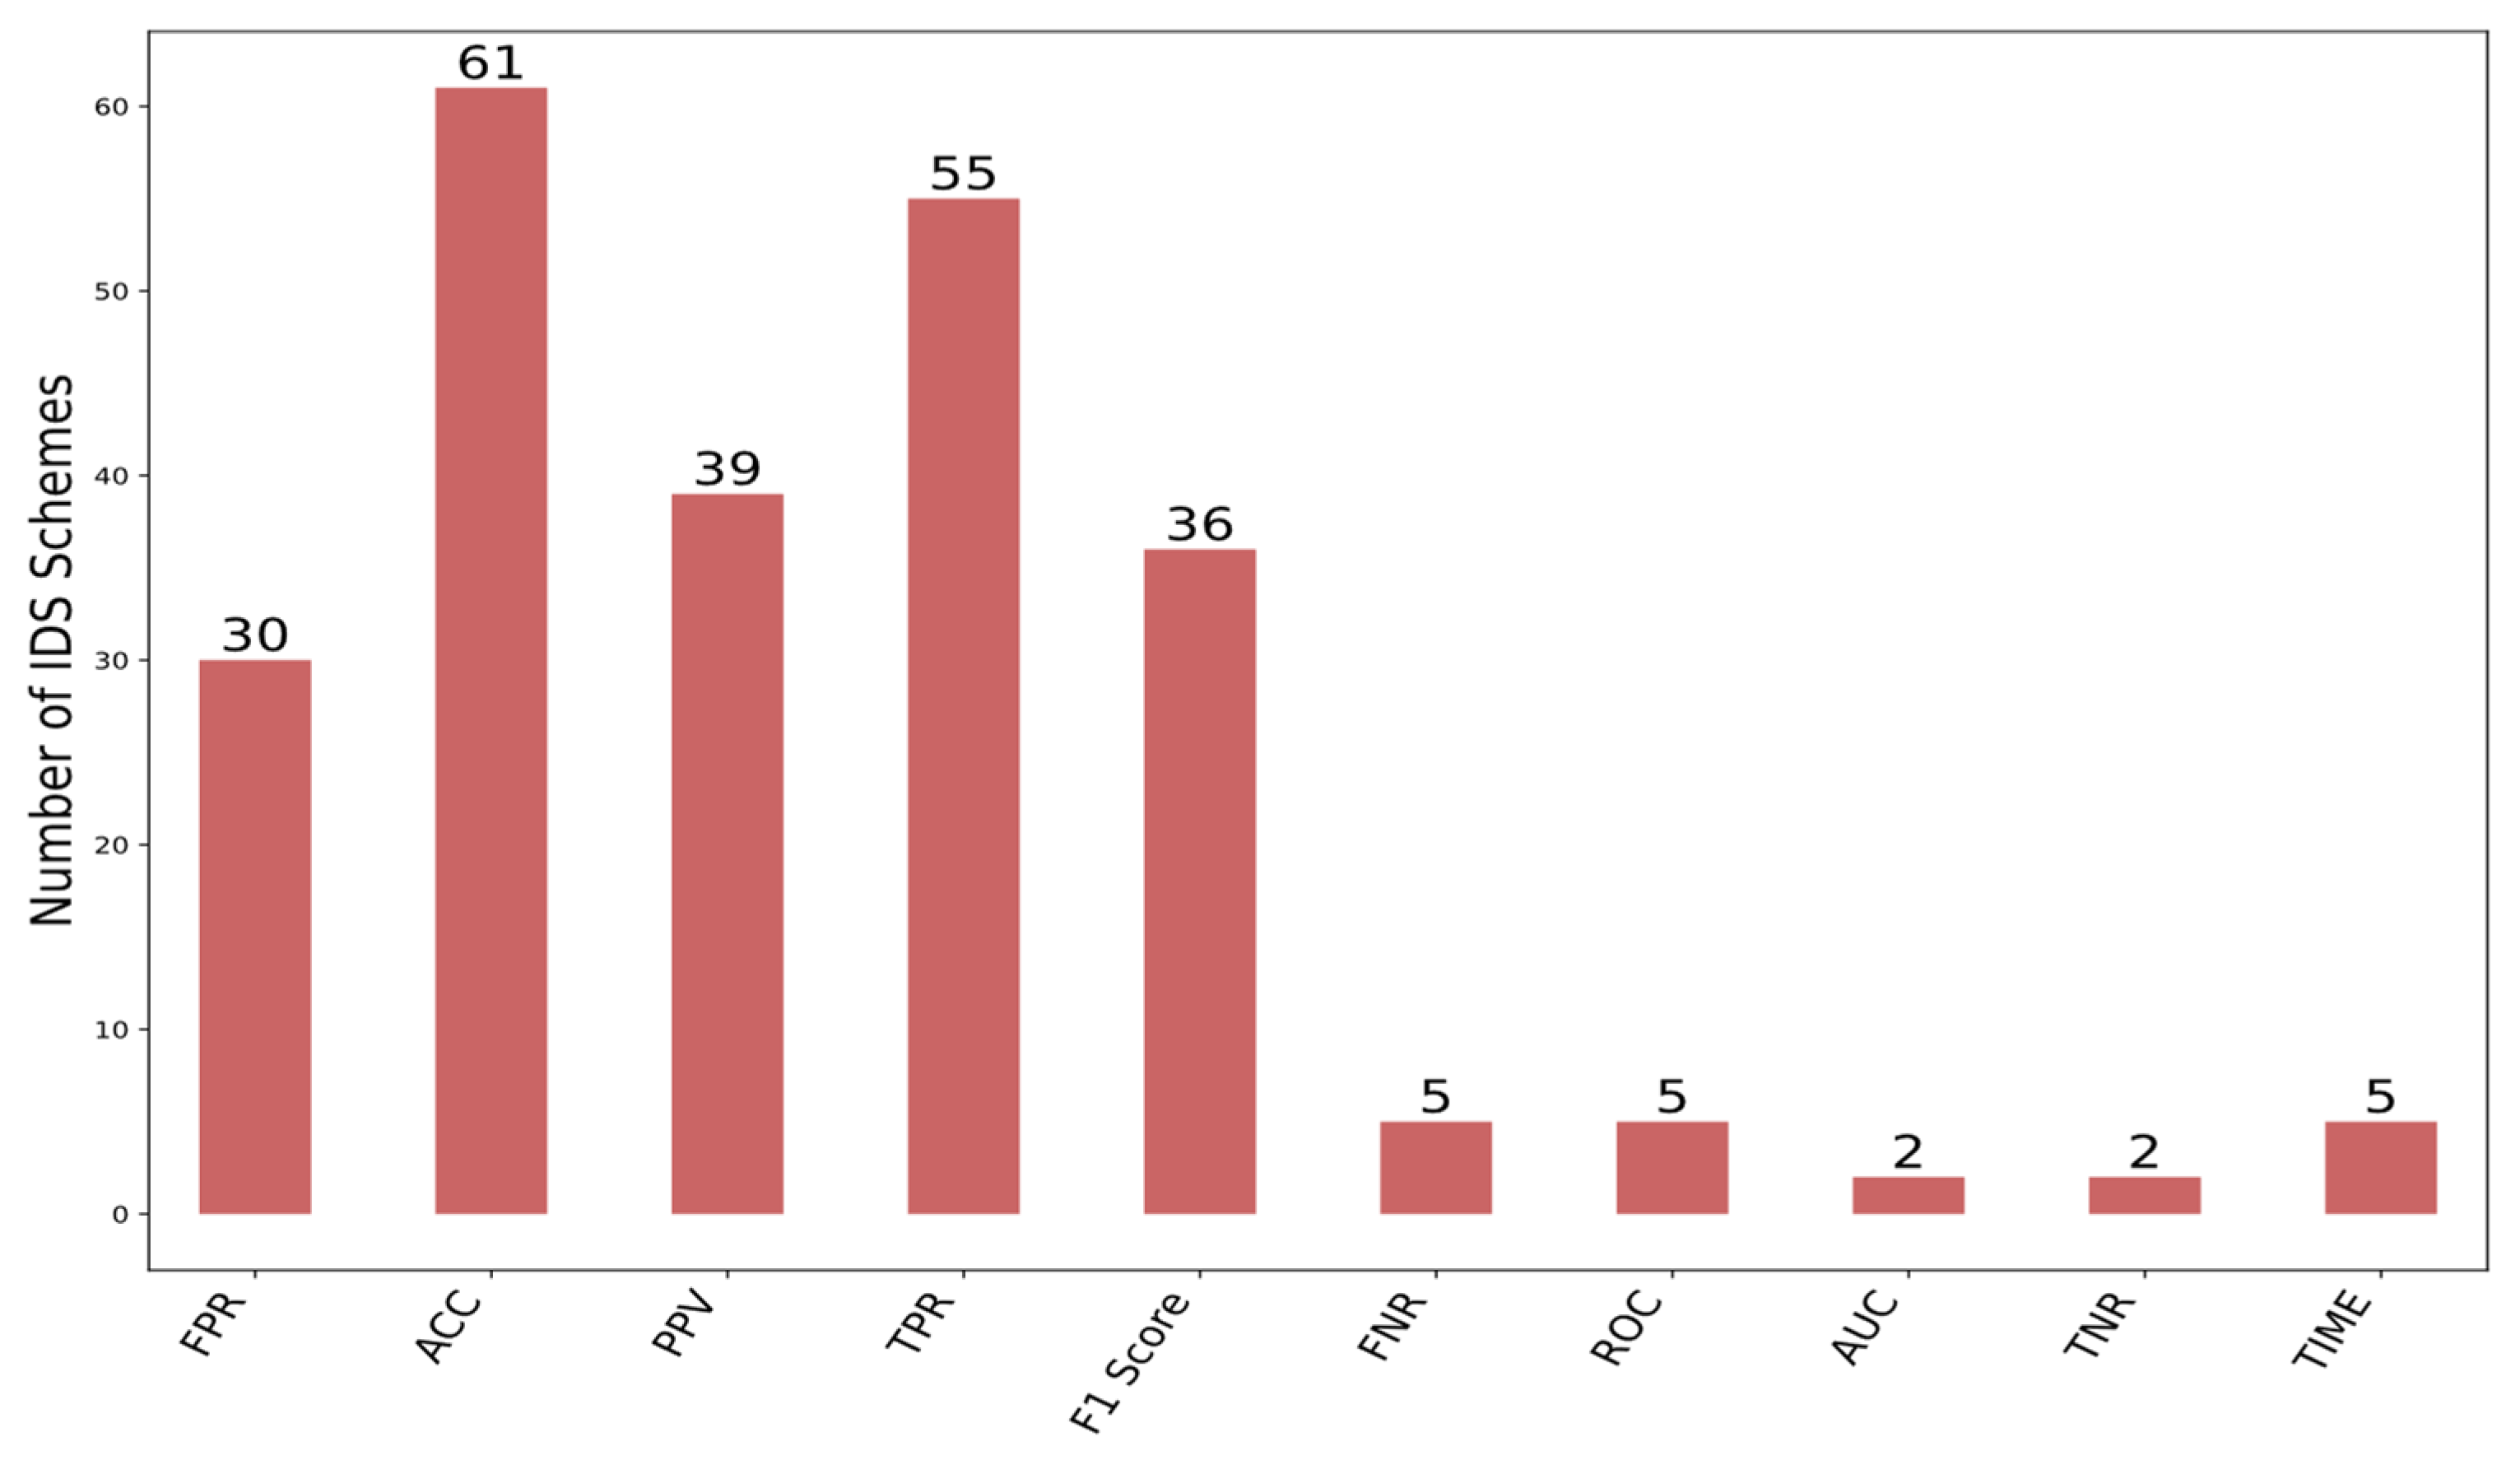

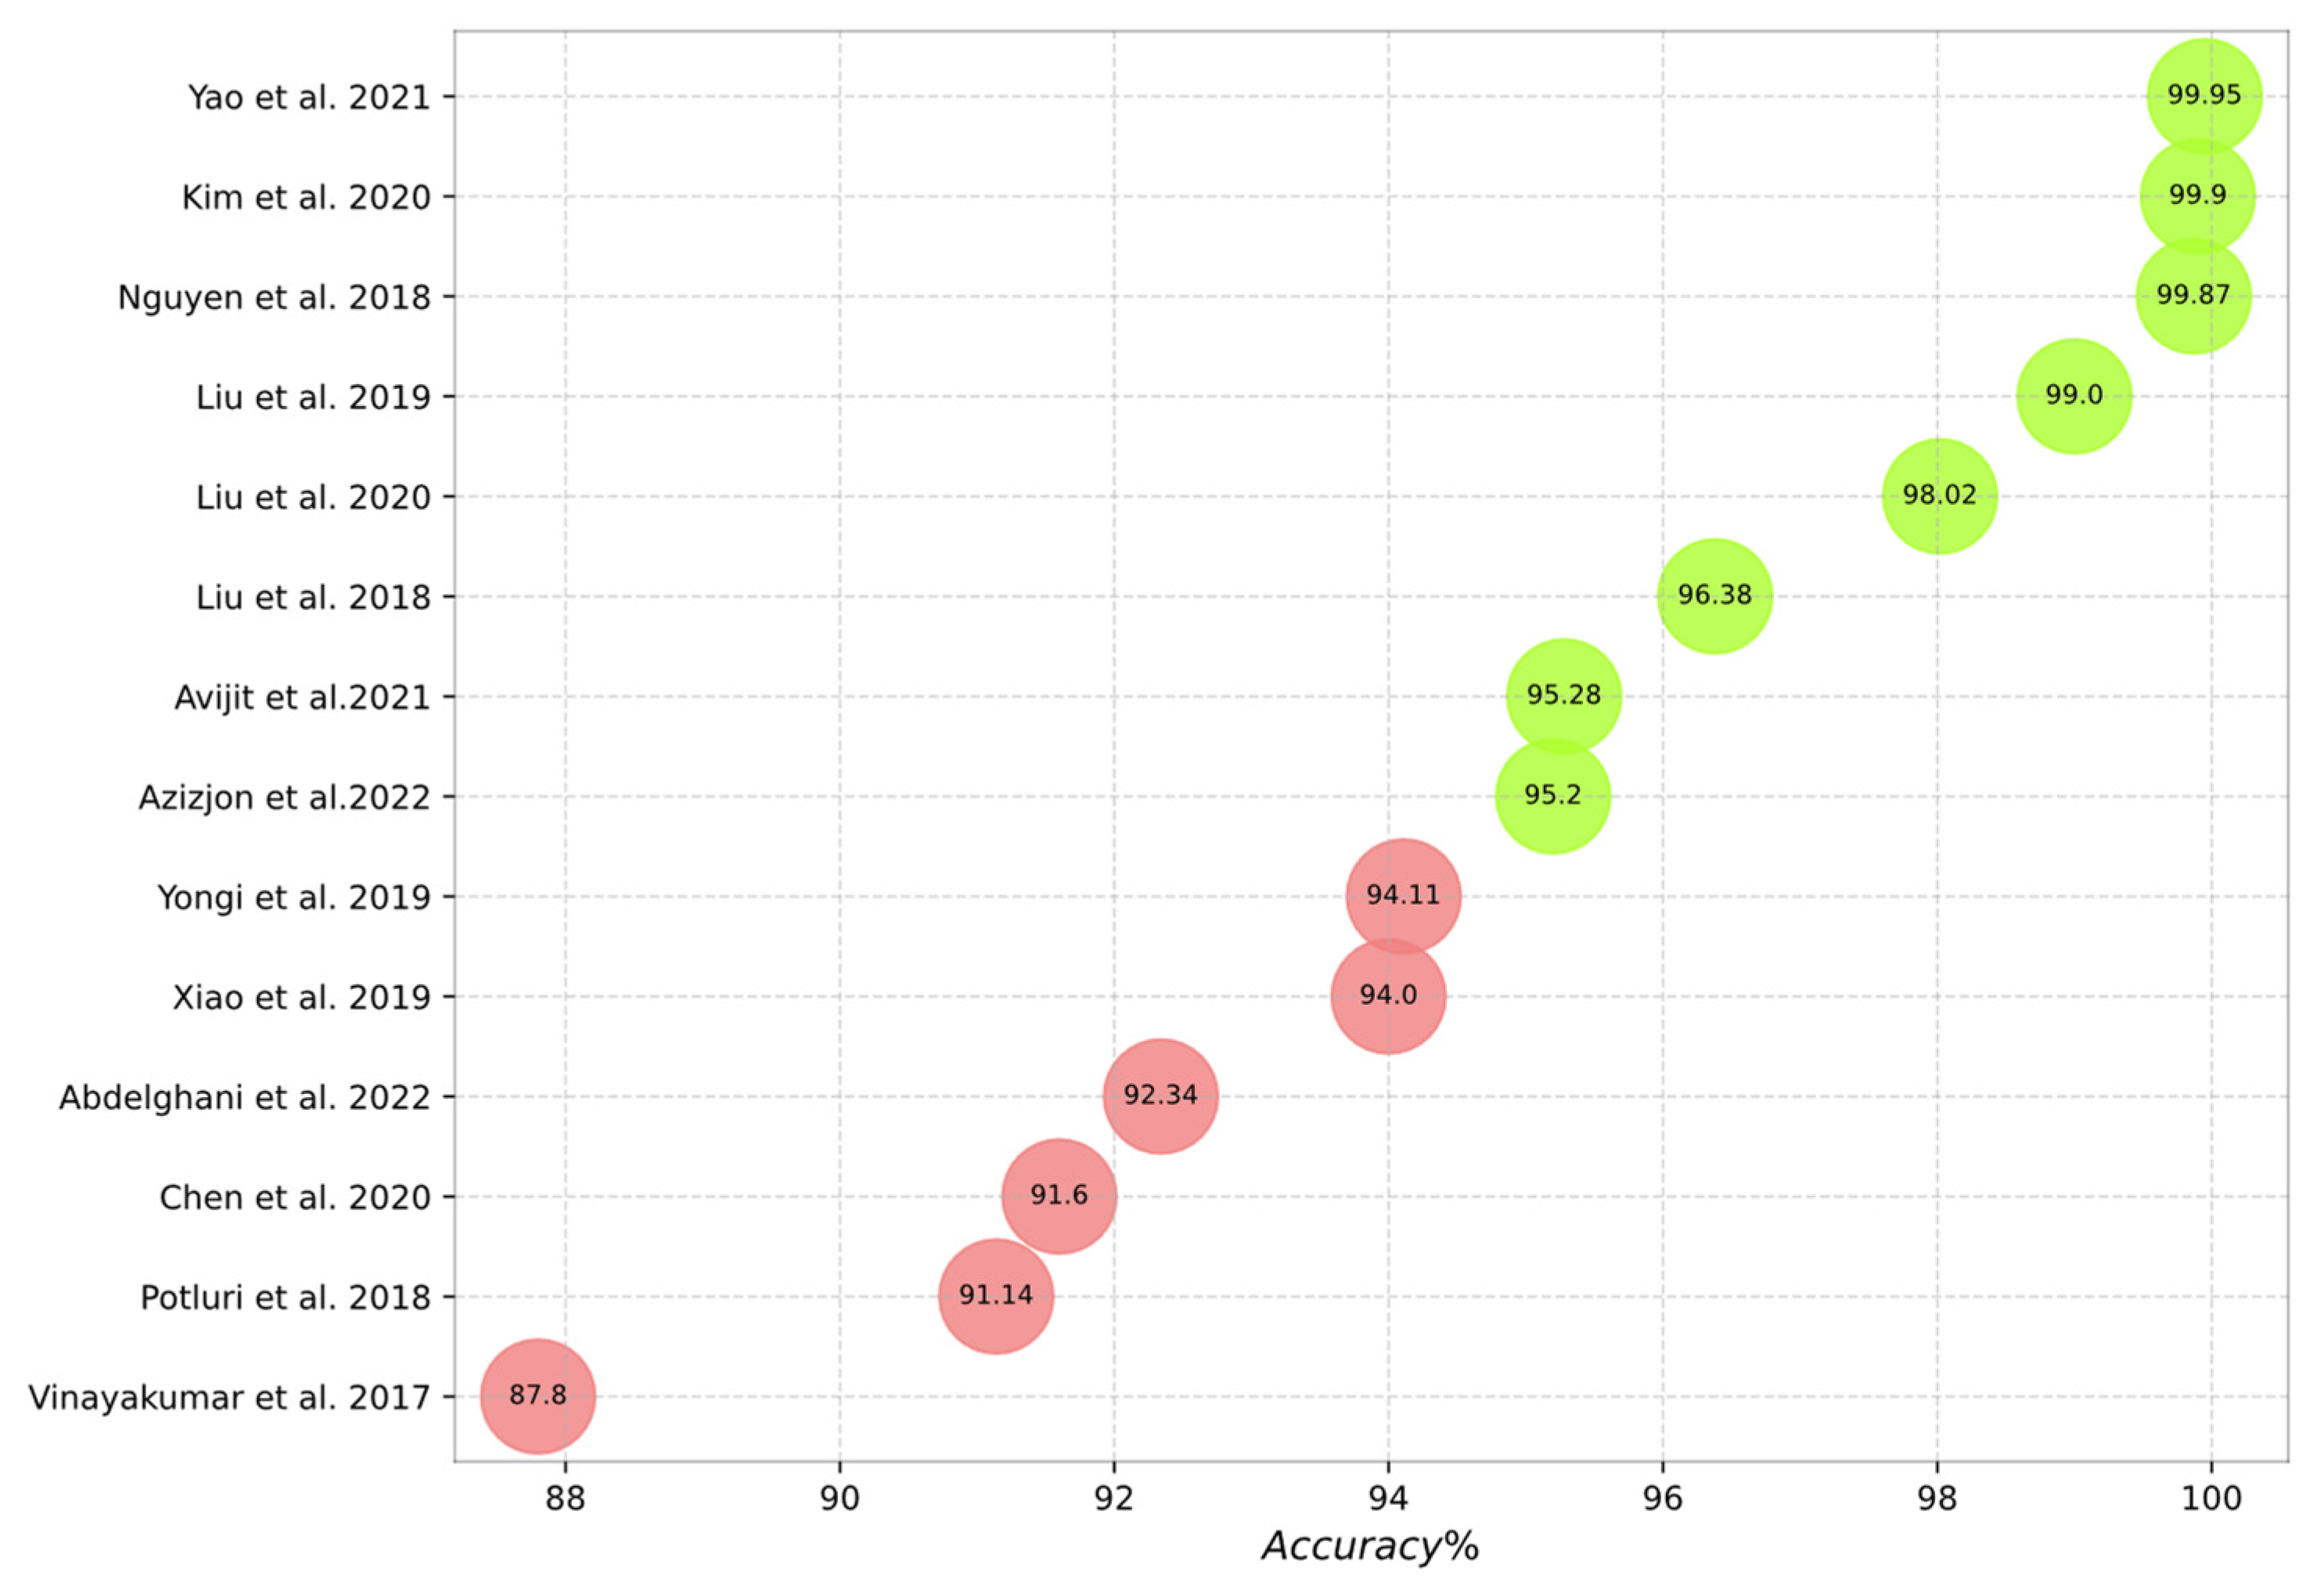
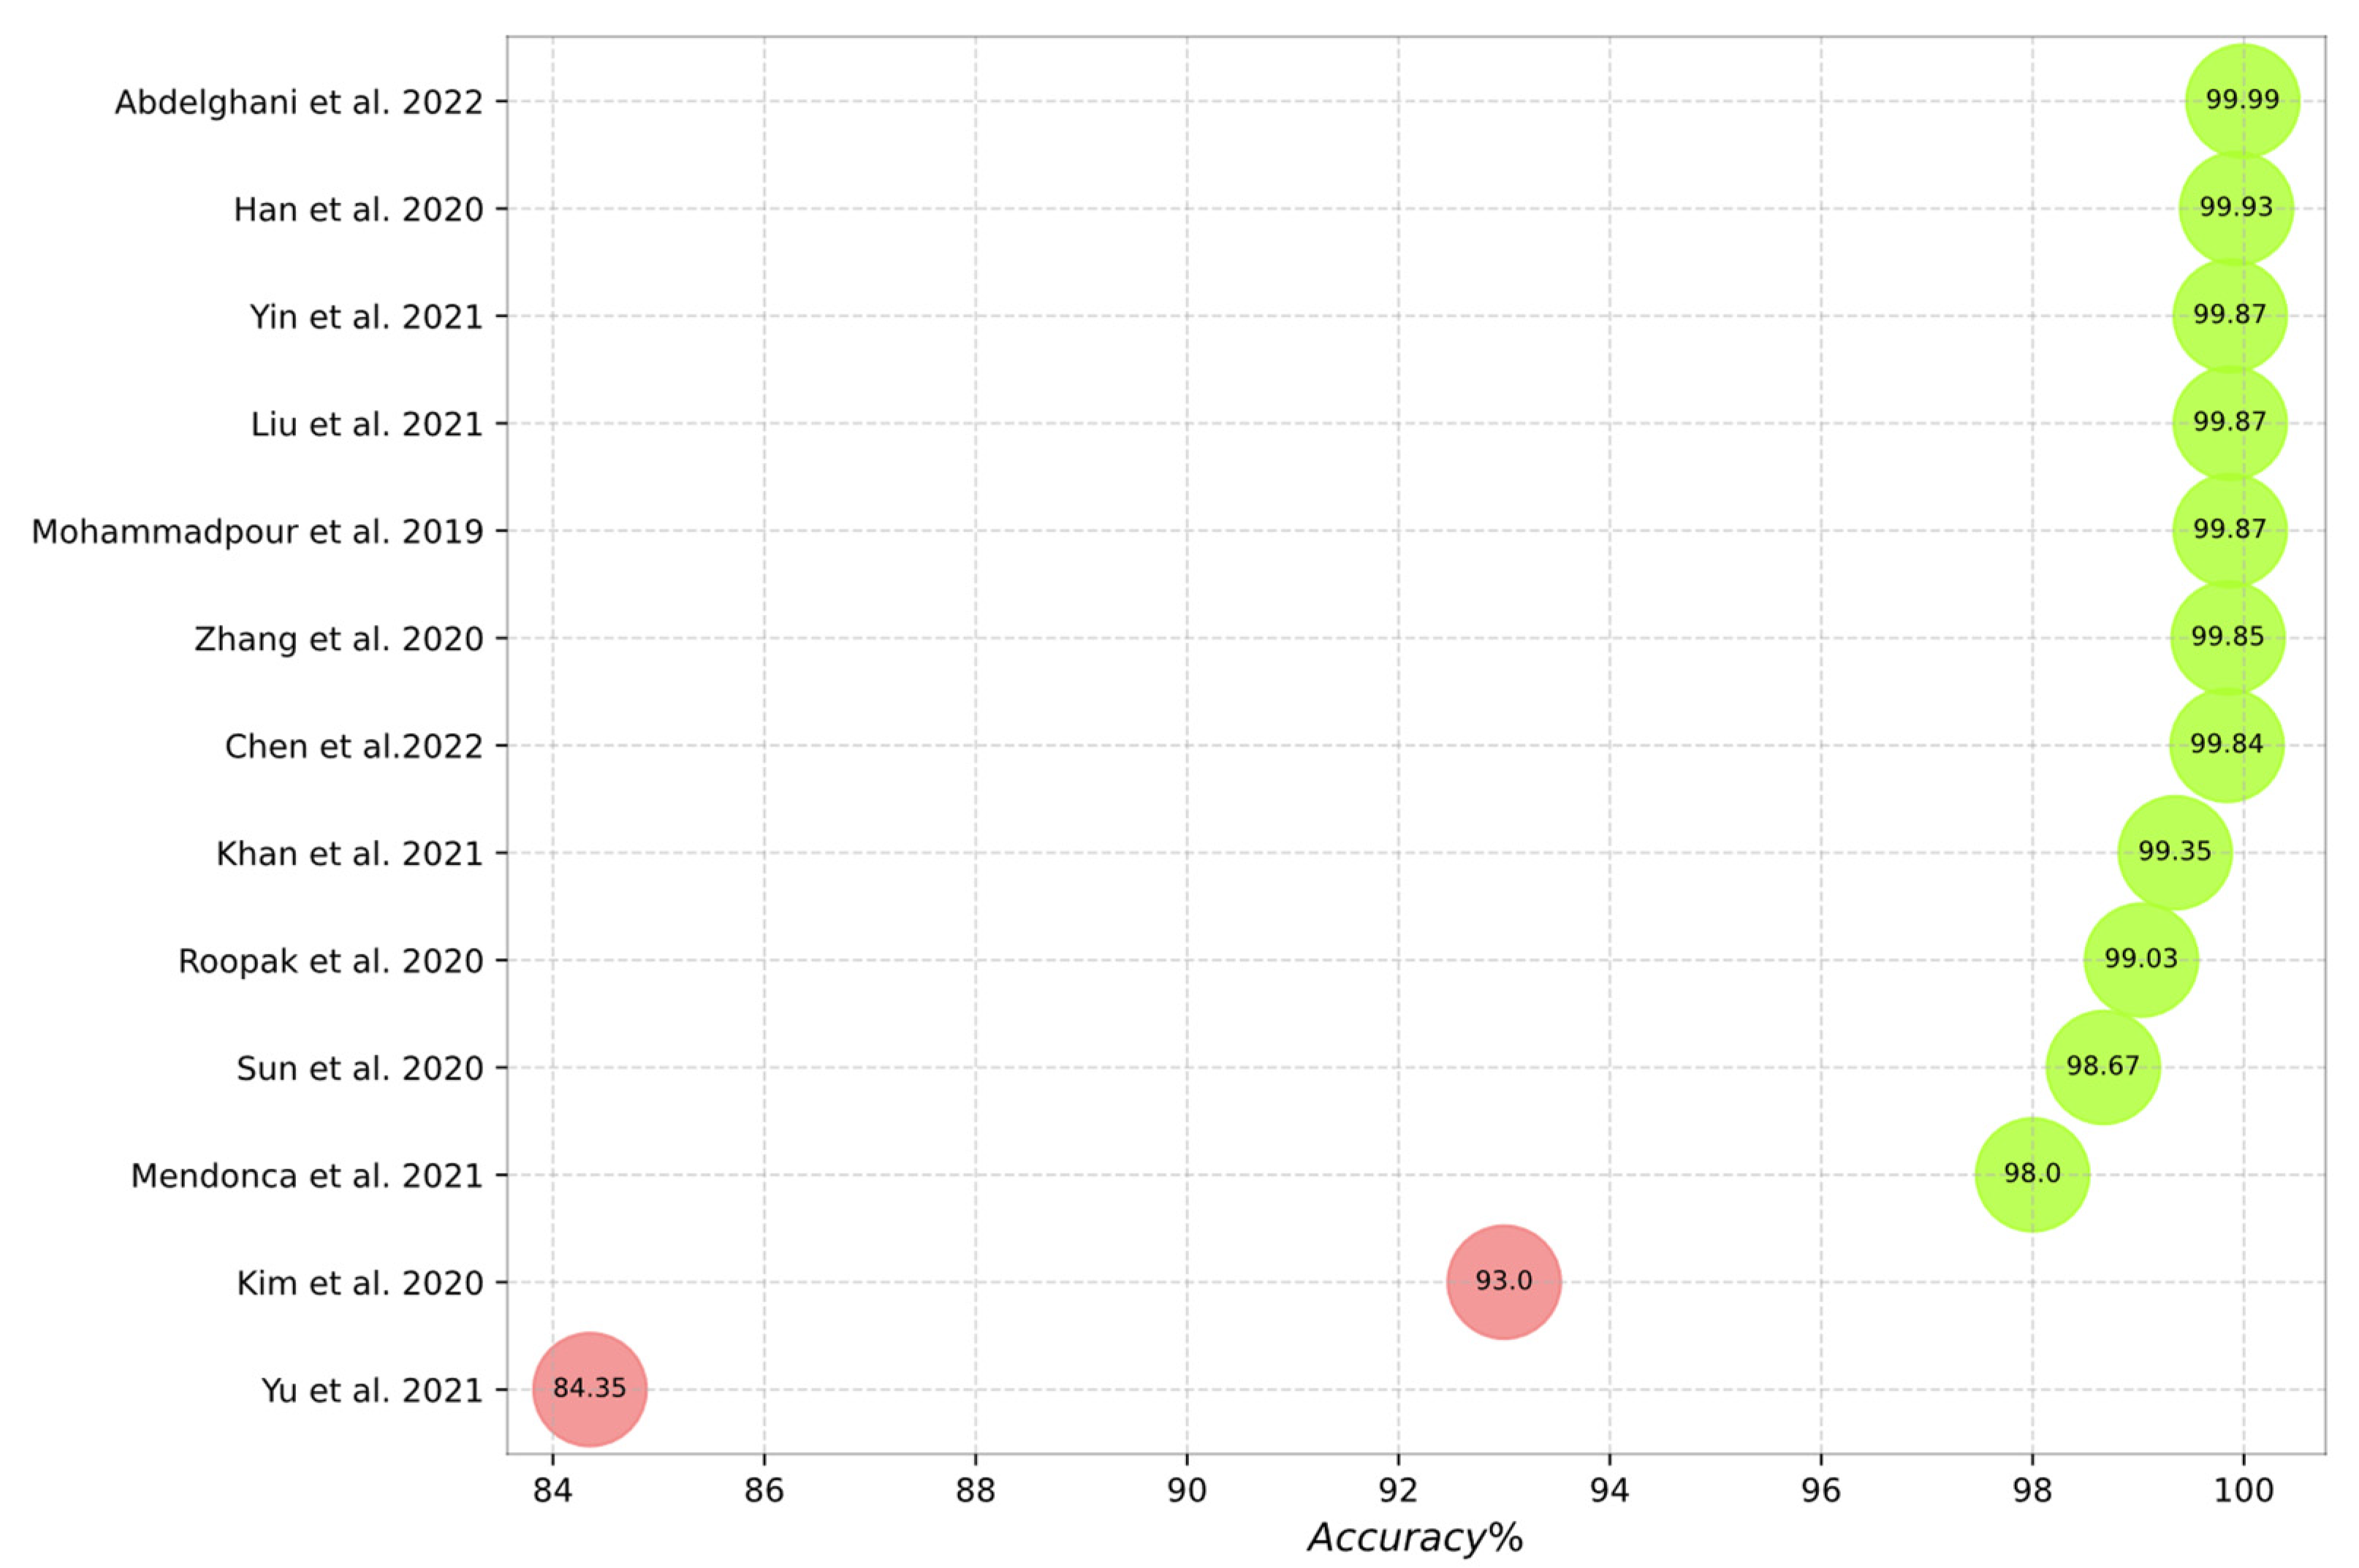

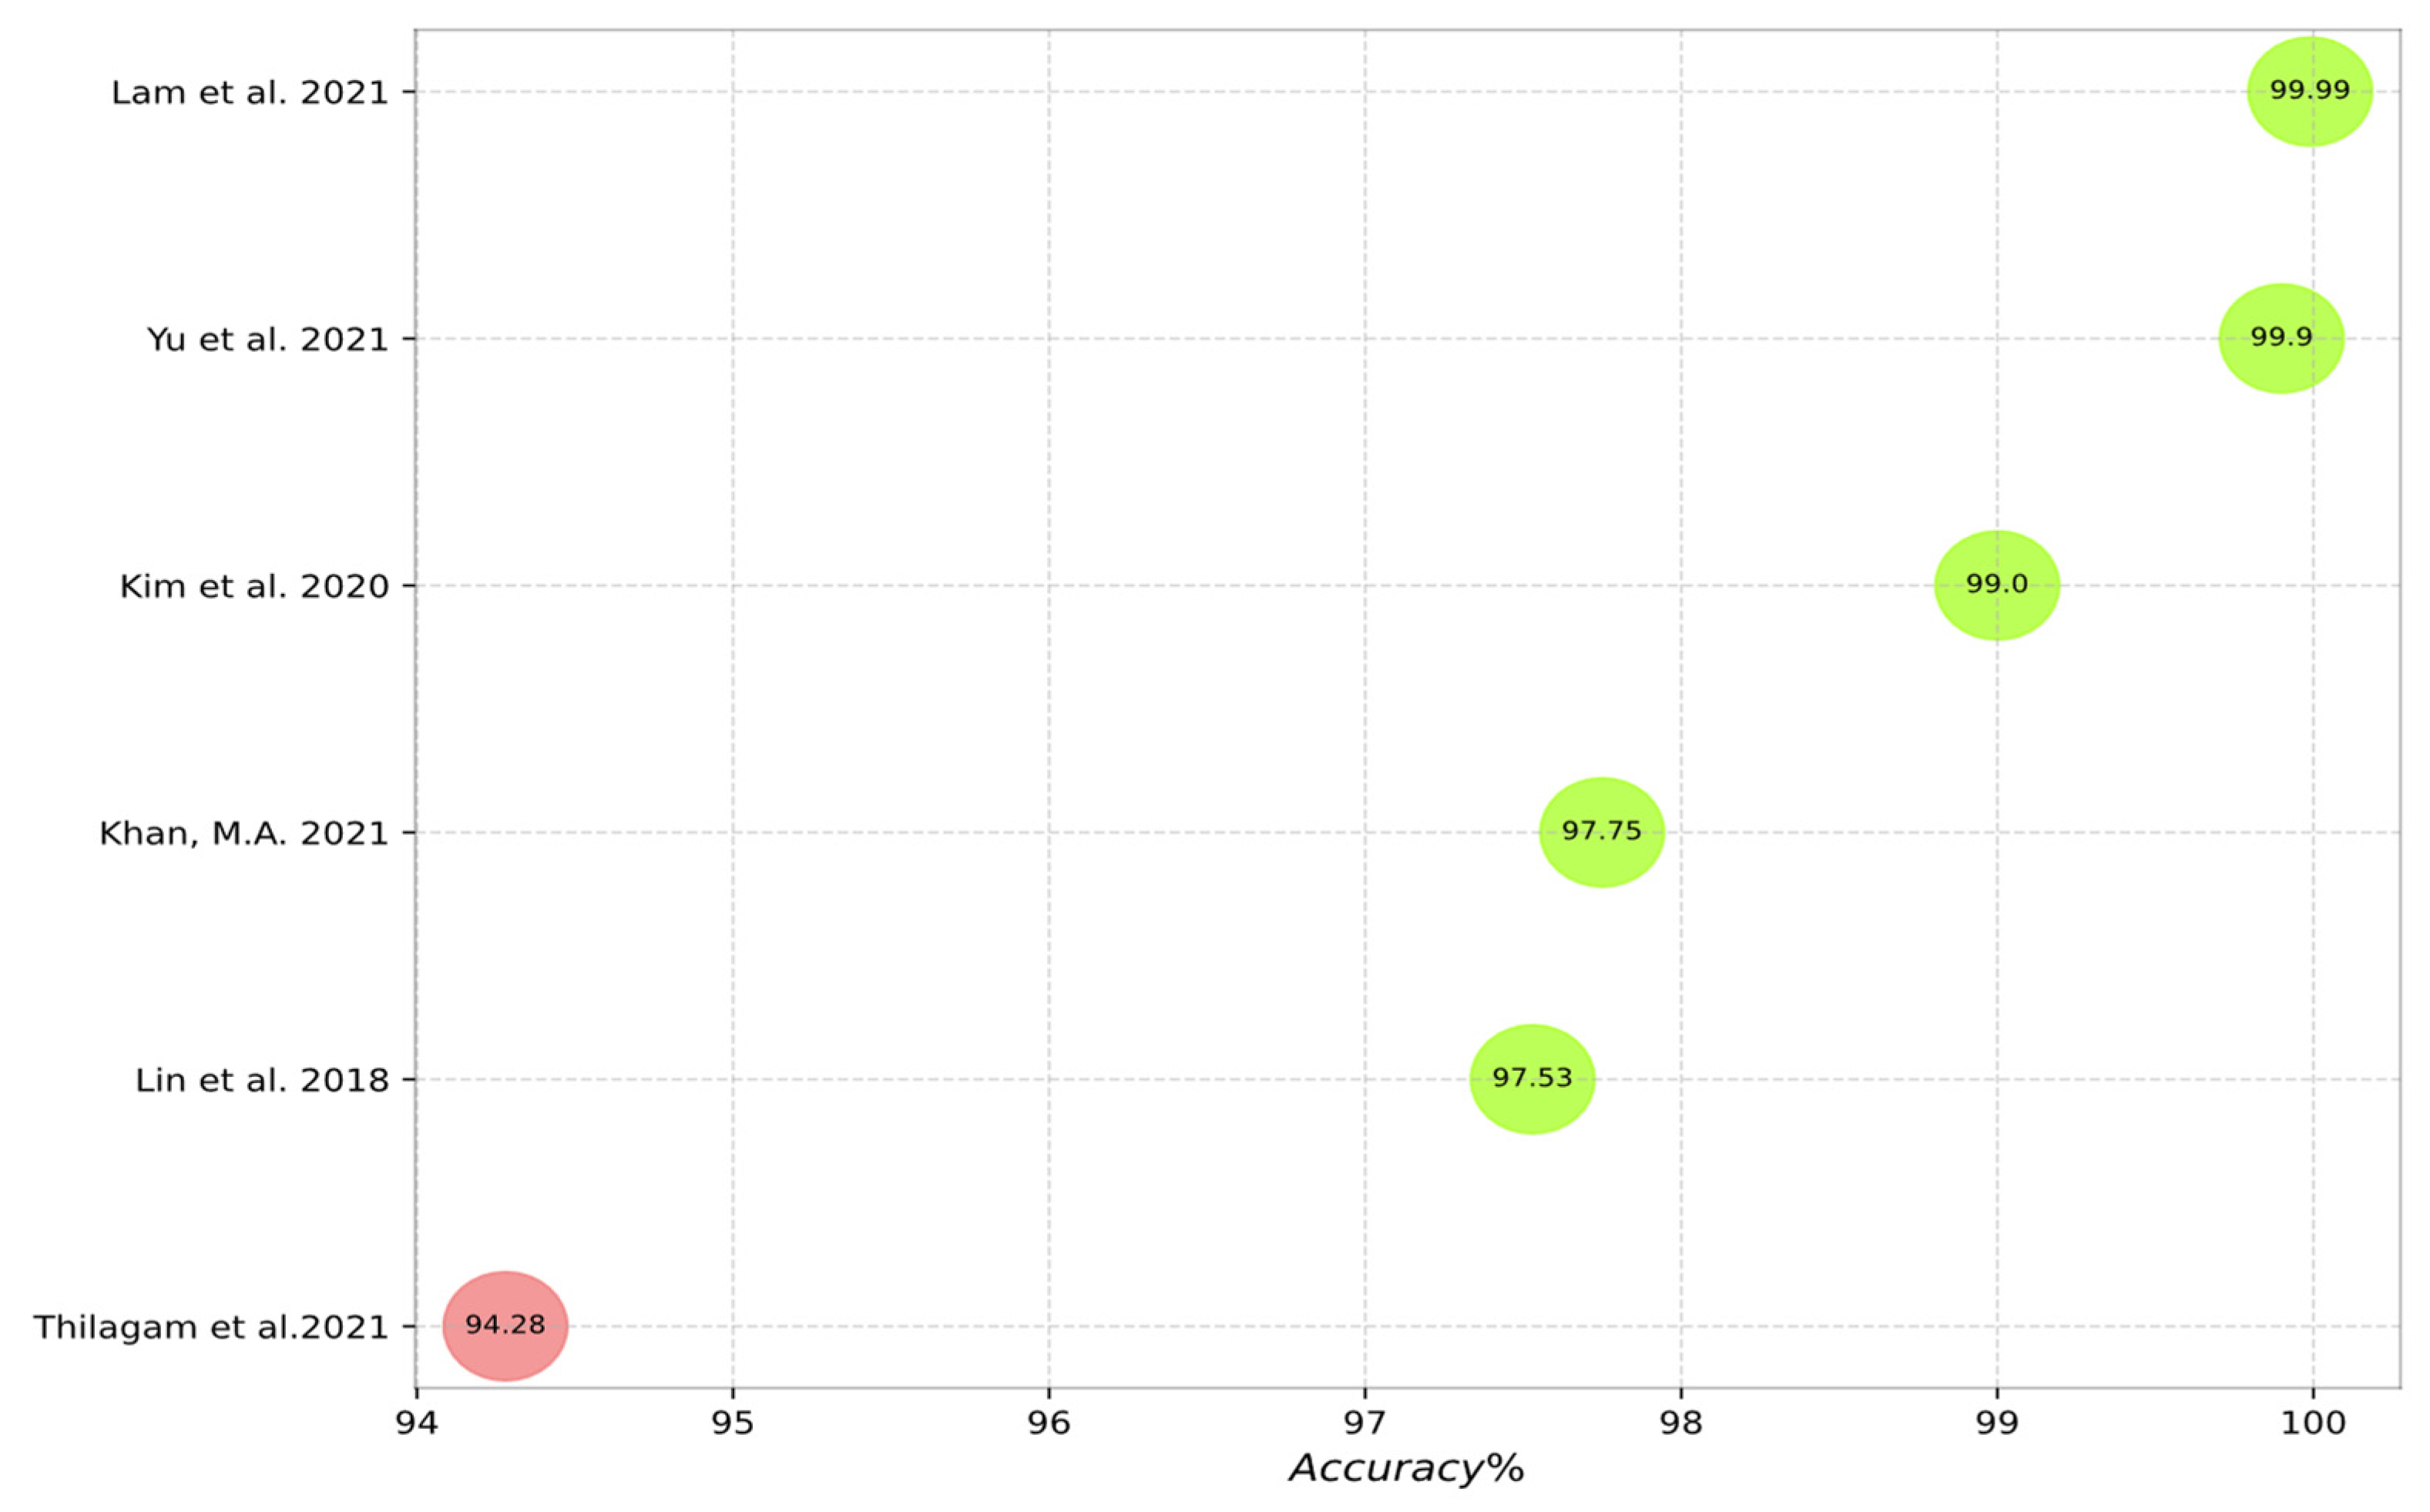
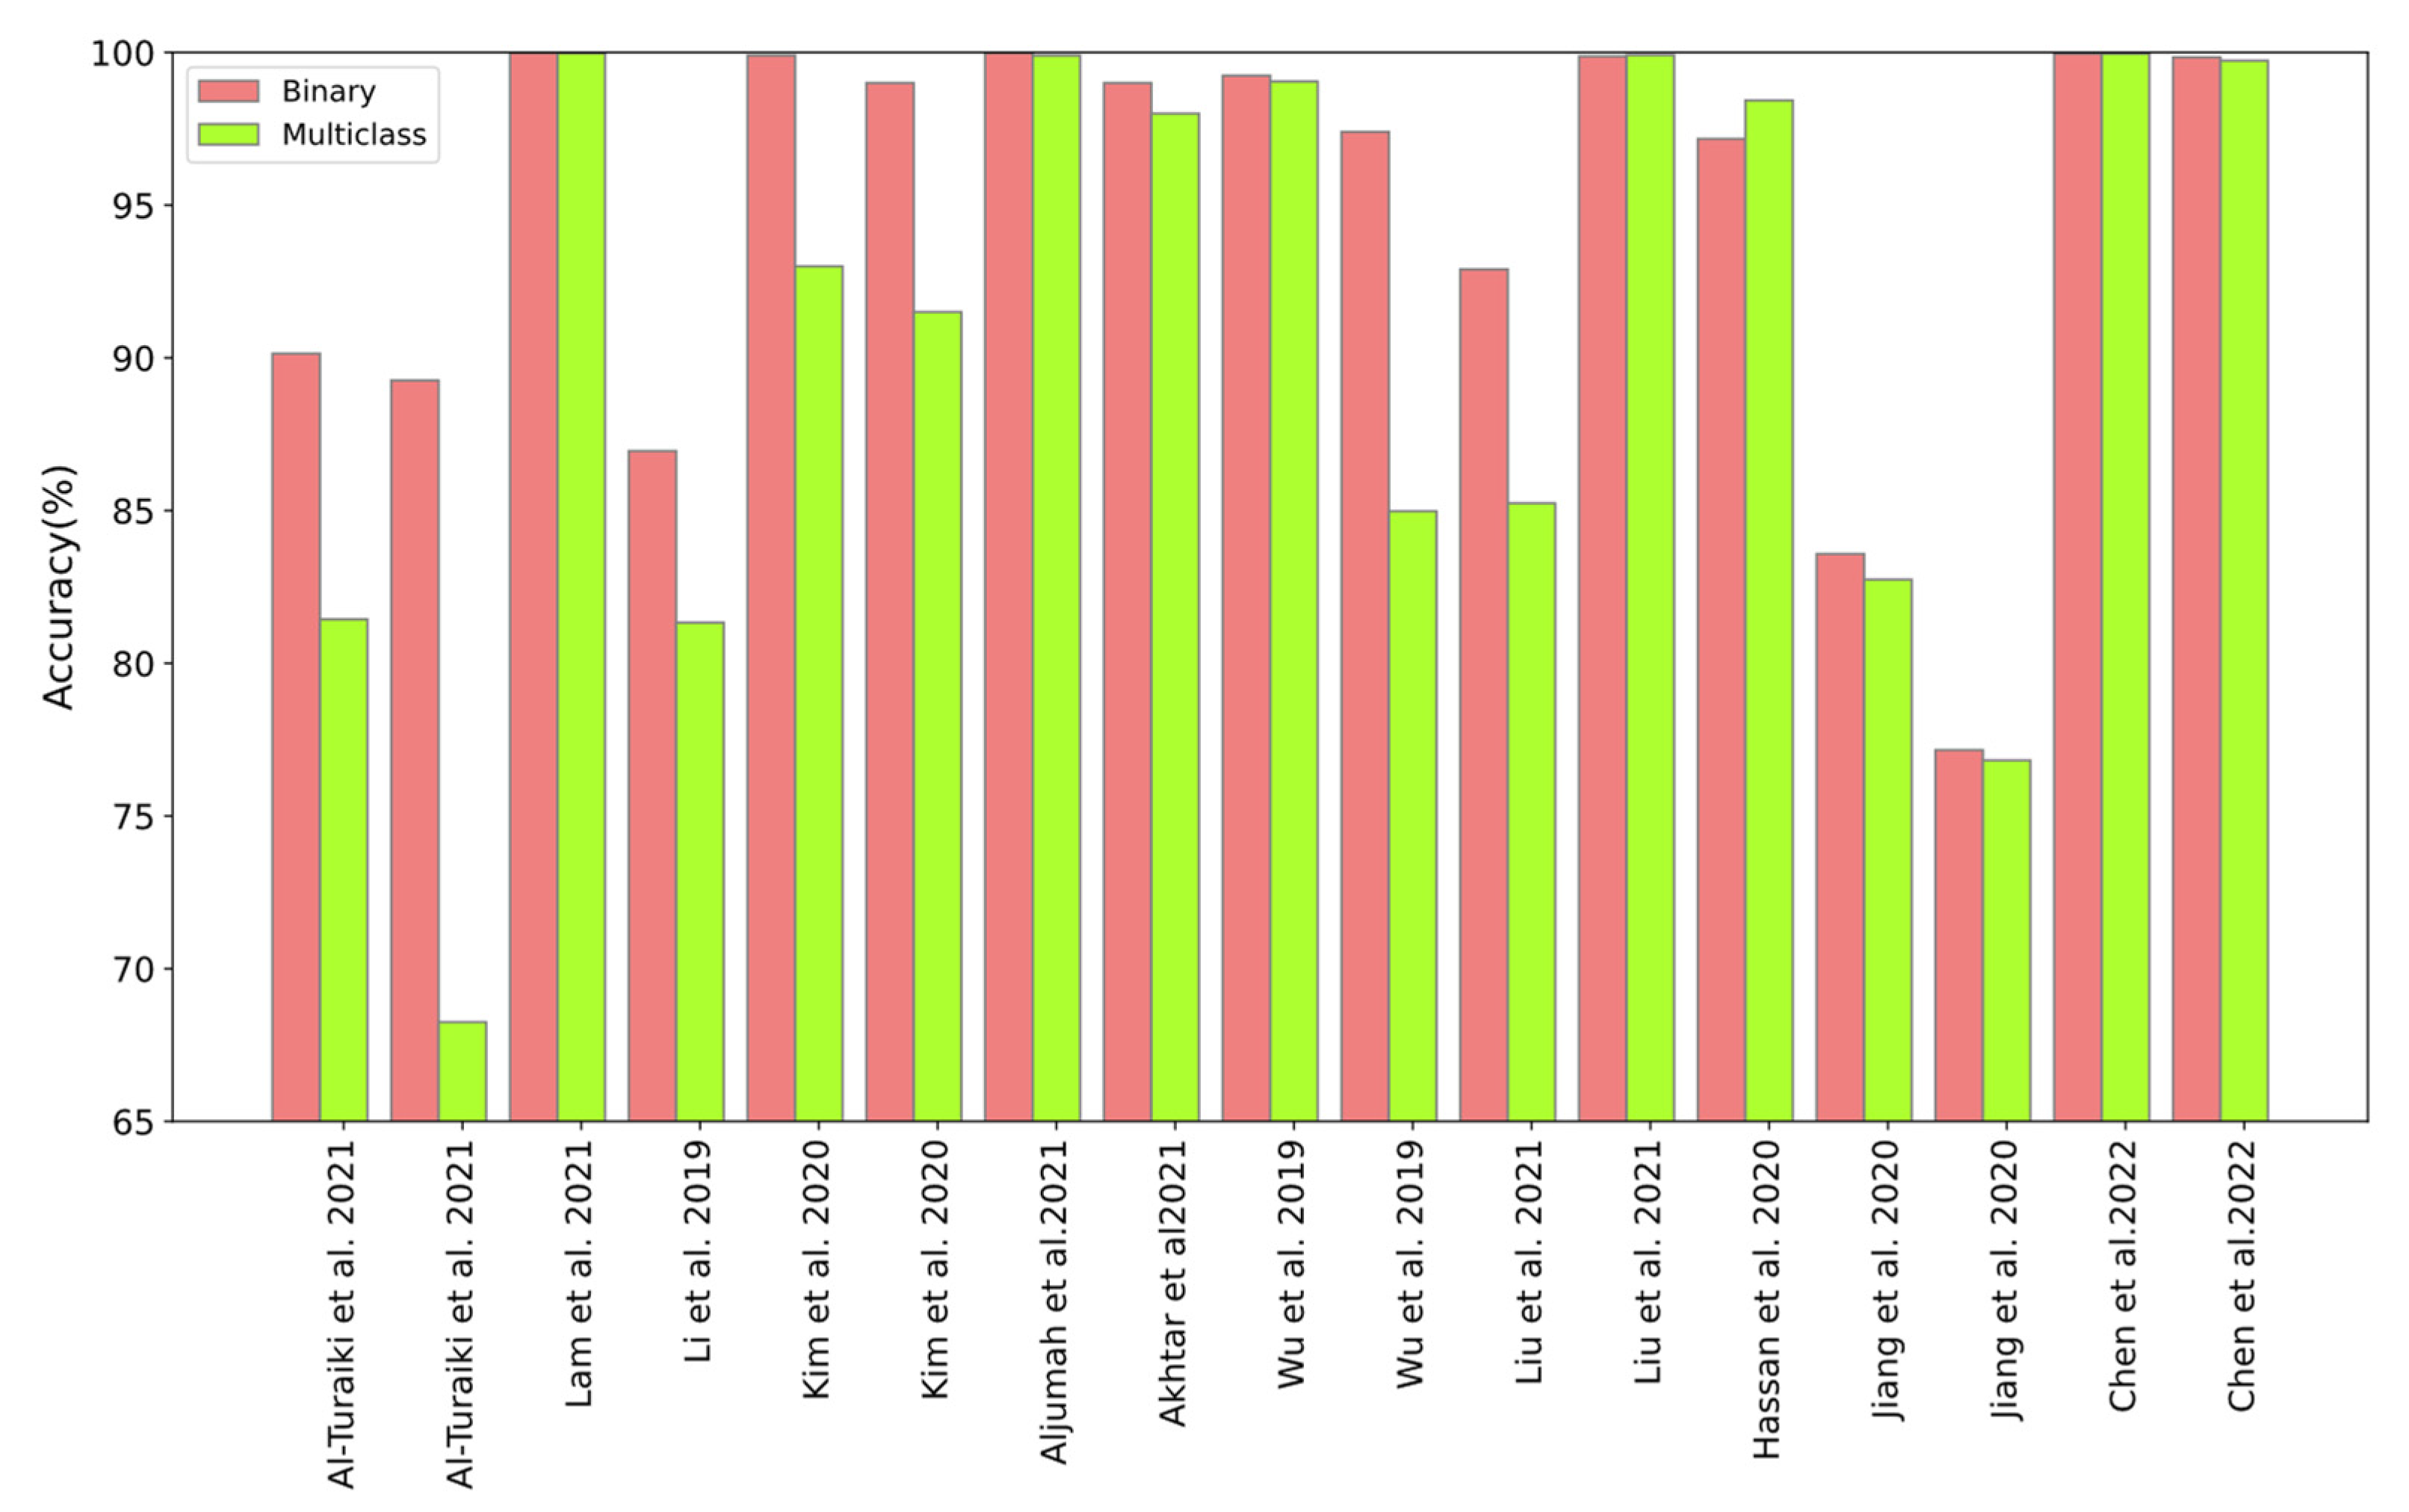
Publisher’s Note: MDPI stays neutral with regard to jurisdictional claims in published maps and institutional affiliations. |
© 2022 by the authors. Licensee MDPI, Basel, Switzerland. This article is an open access article distributed under the terms and conditions of the Creative Commons Attribution (CC BY) license (https://creativecommons.org/licenses/by/4.0/).