Article

Experimental and Theoretical Study of One-Way Cyclic Lateral Responses of Piles in Sloping Ground

1
College of Civil Engineering, Hunan University, Changsha 410082, China
2
Key Laboratory of Building Safety and Energy Efficiency, Ministry of Education, Hunan University, Changsha 410082, China
*
Author to whom correspondence should be addressed.
Appl. Sci. 2022, 12(16), 8169; https://doi.org/10.3390/app12168169
Submission received: 25 July 2022 / Revised: 9 August 2022 / Accepted: 11 August 2022 / Published: 16 August 2022

Abstract

:
This study aims to investigate the one-way cyclic lateral responses of piles in sloping ground by means of experimental and theoretical analyses. For this purpose, a series of laboratory model experiments were performed for different cases of cycle number, load amplitude, and slope angle, and lateral static loading tests on both level ground and sloping ground were conducted for comparison. Based on these experimental observations, the effects of cycle number, load amplitude, and slope angle on the pile head deflection and the profiles of bending moment and subgrade reaction are discussed. The pile deflection profile is difficult to measure directly owing to the restriction of experimental conditions, and thus a supplementary finite beam element method (FBEM) is provided to compensate for this deficiency. The comparisons between experimental and theoretical results demonstrate that the FBEM can well predict the pile responses in sloping ground, either under one-way cyclic lateral loading or lateral static loading.

1. Introduction

Many highway bridges, transmission towers, wind turbines, and high-rise buildings in hilly areas are supported on pile foundations that resist lateral loads arising from traffic, wind, waves, and seismic activities [1,2]. The lateral responses of these piles are difficult to predict for the following two reasons. To begin with, the lateral load is often a one-way cyclic load, so the pile responses are more complicated than those under lateral static loading [3,4,5]. Then, there is a considerable reduction of subgrade reactions on the side close to the slope, leading to greater pile deflections and bending moments than those in level ground [6,7,8]. However, most studies have focused on either the cyclic lateral responses of piles in level ground or the lateral static responses of piles in sloping ground, and hence their conclusions cannot be directly used in the design of piles in hilly areas for a more complicated scenario.
On the one hand, efforts regarding the cyclic lateral responses of piles have been devoted to cases in level ground, mainly focusing on the effects of cycle number on pile responses [9] and failure mechanisms [10]. Prior experiments indicated that the subgrade reaction would reduce as the cycle number increases [11], resulting in greater pile responses and lower pile bearing capacities than those under lateral static loading [12,13,14]. Recent field tests demonstrated that the accumulated residual pile deflection under one-way cyclic lateral loading was generally greater than that under two-way cyclic lateral loading [4]. In addition, the numerical predictions for the cyclic lateral responses relied on the adopted constitutive models [15,16], that is, the stress–strain relationship of soil obtained from cyclic triaxial tests [17,18]. In comparison with the former two methods, the theoretical analysis of cyclic lateral responses of piles has been seldom reported [19,20,21], owing to the complicated nonlinear characteristic of soil and the damping effect on energy dissipation [22]. Only a few simplified methods have been presented to assess the accumulated pile deflection by developing degraded p-y curves [23] or adopting the strain superposition [24] during different loading cycles. In addition, the slope effect exacerbates the complexity of the problem.
On the other hand, the slope effect is usually quantified by reducing subgrade reaction and lateral bearing capacity based on experimental investigations, numerical simulations, and theoretical analyses. Owing to the great persuasiveness and directness, the experiments have been commonly conducted to suggest a series of reduction coefficients for p-y curves under different slope angles, pile-slope distances, and material properties [25,26,27]. In addition, several recent model experiments were performed to directly investigate the slope effect by comparing the lateral bearing capacities of piles in sloping ground with those in level ground [28,29]. Note that the full development of stress and strain in the experimental region is not easily obtained, and the experiments are commonly complicated, expensive, and time-consuming, and hence numerical simulation can be employed as an alternative method. For instance, the shear load transfer mechanism [30] and deformation mechanism [31] of piles in sloping ground were explained by the stress and strain developments from three-dimensional (3D) finite-difference and finite-element analyses; the slope-induced degraded p-y curves with analytical formulas were constructed for a wide range of cases based on large amounts of data from 3D finite-element analyses [32,33]. Compared with the experimental and numerical investigations, the theoretical analyses may appear to be simpler and more convenient in the preliminary design of piles. A limit equilibrium-based theoretical model for the lateral bearing capacity of rigid piles in sloping ground indicated that the reduction of pile bearing capacity depends on the slope angle and material properties [34]. Subsequently, the design charts relating the lateral bearing capacity of piles to the slope angle were developed based on the analytical solutions for the undrained lateral bearing capacity of rigid piles [35]. The theoretical study of the slope effect on the subgrade reaction and lateral bearing capacity has continued [36,37]; however, these studies are still within the scope of static loading.
This study aims to investigate the one-way cyclic lateral responses of piles in sloping ground by means of experimental and theoretical analyses. The model experiments include static and dynamic loading cases, where the static cases in the level and sloping ground provide basic experimental parameters and serve as a benchmark, and the dynamic cases focus on the effects of cycle number, load amplitude, and slope angle on the pile responses. However, the pile deflection profiles are difficult to directly measure due to the restrictions of experimental conditions, and thus an alternative theoretical method, the finite beam element method (FBEM), is employed as a supplementary analysis.

2. Experimental Setup and Procedure

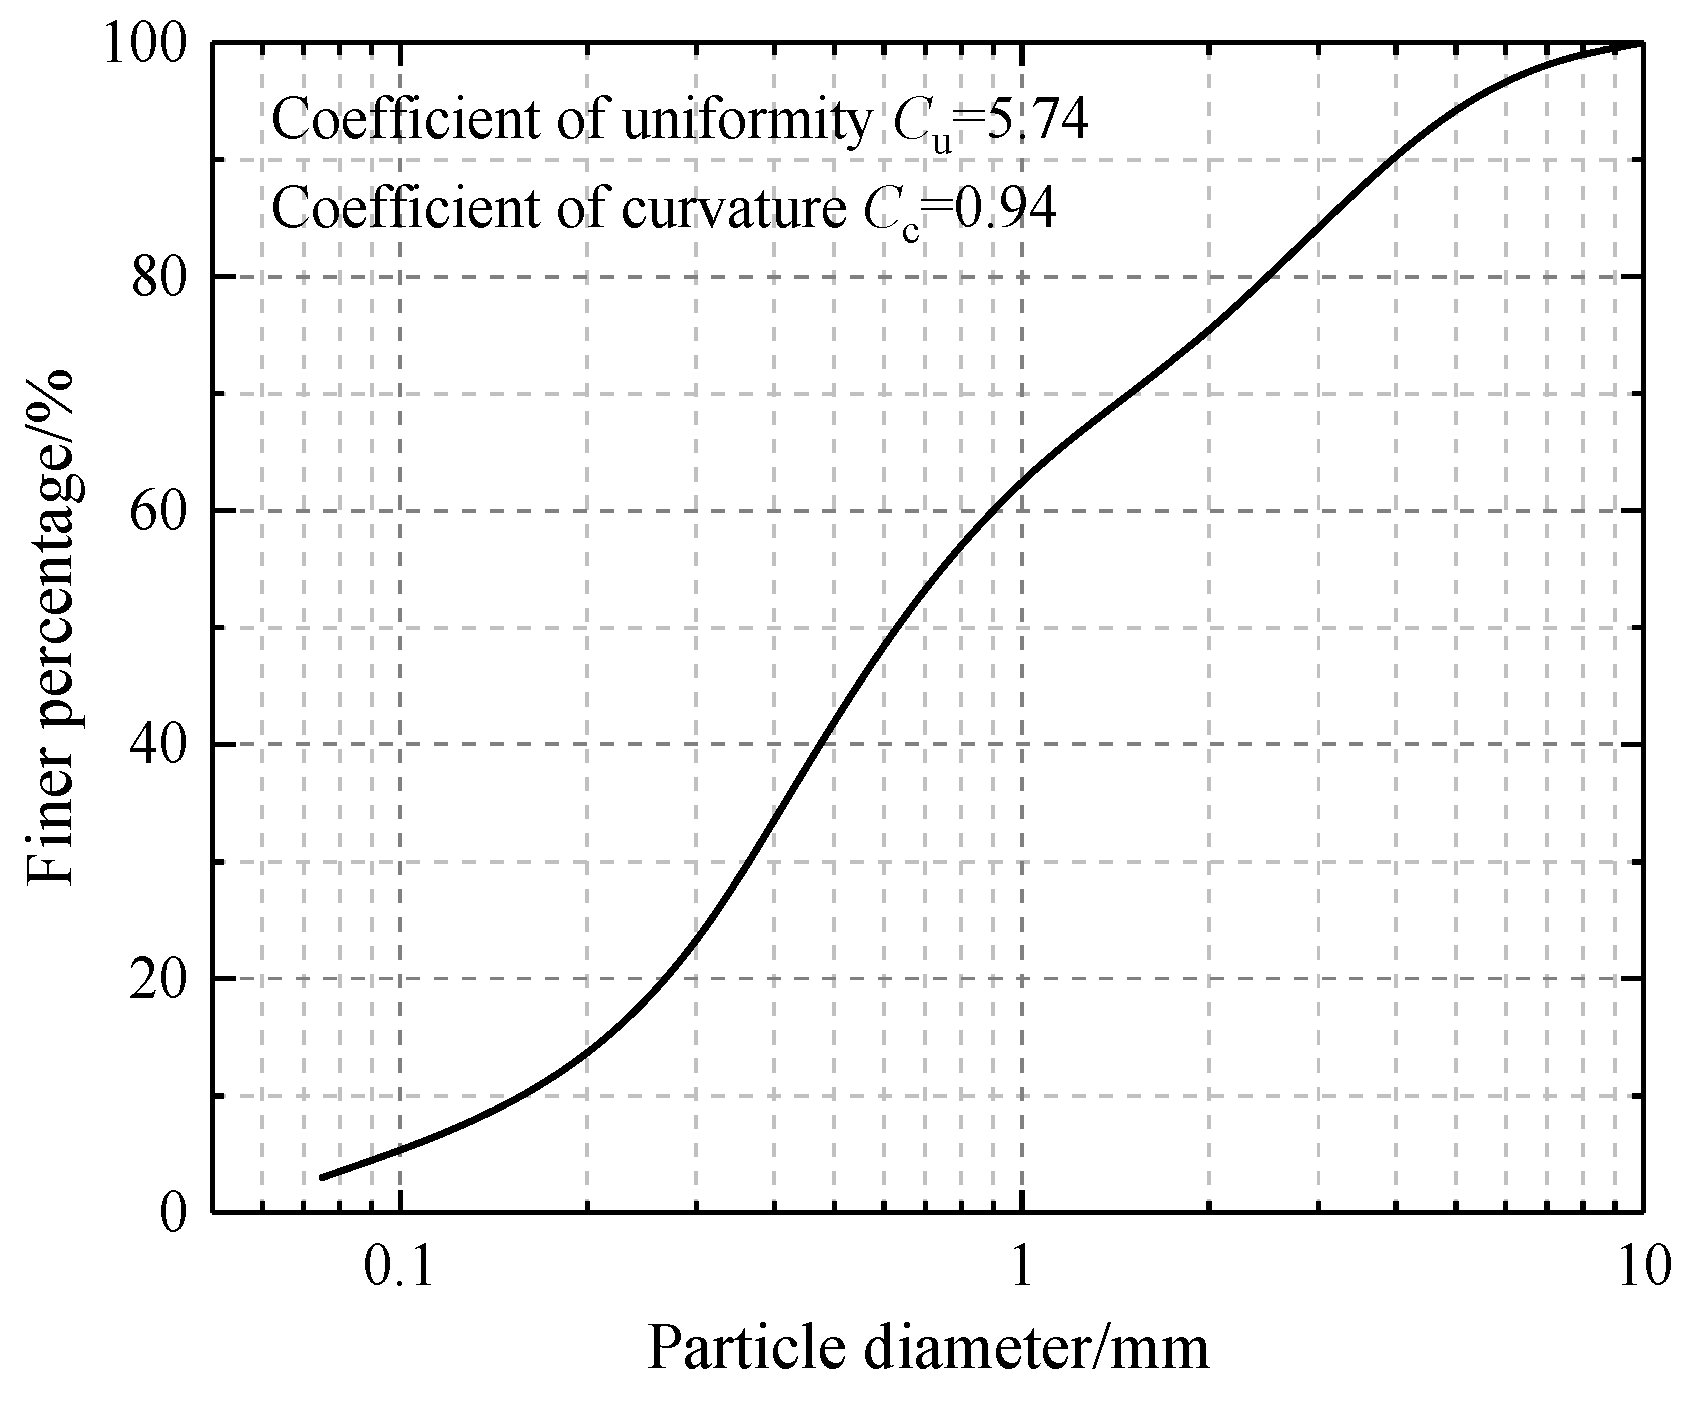
2.1. Similarity Criterion and Similarity Constant

The engineering prototype of the model experiments is a bridge pile foundation at the First Si Xi River Bridge on the Zhangjiajie-Huayuan Highway in Hunan Province in China [6,7]. The prototype pile (25 m in length and 2 m in diameter) is made of C25 concrete and steel reinforcement and installed in the sloping ground with a slope angle of 40° to 60°.
The similarity criterion of model experiments and similarity constants of pile and soil parameters are given as follows:
The governing differential equations of pile deflection under inclined loading can be expressed as Equations (1) and (2) for the prototype and model pile, respectively. The subscripts ‘p’ and ‘m’ of physicomechanical parameters (i.e., pile flexural rigidity EI, pile deflection y, depth z, axial load P, pile calculation width b, proportional coefficient of subgrade reaction coefficient m) correspond to the prototype and model experiments, respectively.
E p I p d 4 y p d z p 4 + P p d 2 y p d z p 2 + b p m p z p y p = 0
E m I m d 4 y m d z m 4 + P m d 2 y m d z m 2 + b m m m z m y m = 0
Substituting the similarity constants of the aforementioned physicomechanical parameters (i.e., λb = bp/bm, λz = zp/zm, λEI = EpIp/EmIm, λm = mp/mm, and λP = Pp/Pm) into Equation (1), Equation (1) can thus be rewritten as Equation (3).
λ E I λ y λ z 4 E m I m d 4 y m d z m 4 + λ P λ y λ z 2 d 2 y m d z m 2 + λ b λ m λ z λ y b m z y = 0
The similarity criterion, Equation (4), can be obtained by comparing Equation (2) with Equation (3).
λ E I λ y λ z 4 = λ P λ y λ z 2 = λ b λ m λ z λ y
By rearranging Equation (4), the similarity index κ1 and κ2 are given as Equation (5) and Equation (6), respectively.
κ 1 = λ b λ m λ z 5 λ E I
κ 2 = λ b λ m λ z 3 λ P
Following the similarity criterion, the physicomechanical parameters of the prototype and model experiments are summarized in Table 1, and the similarity index is given as κ1 = 0.97, proving that these parameters satisfy the similarity criterion.

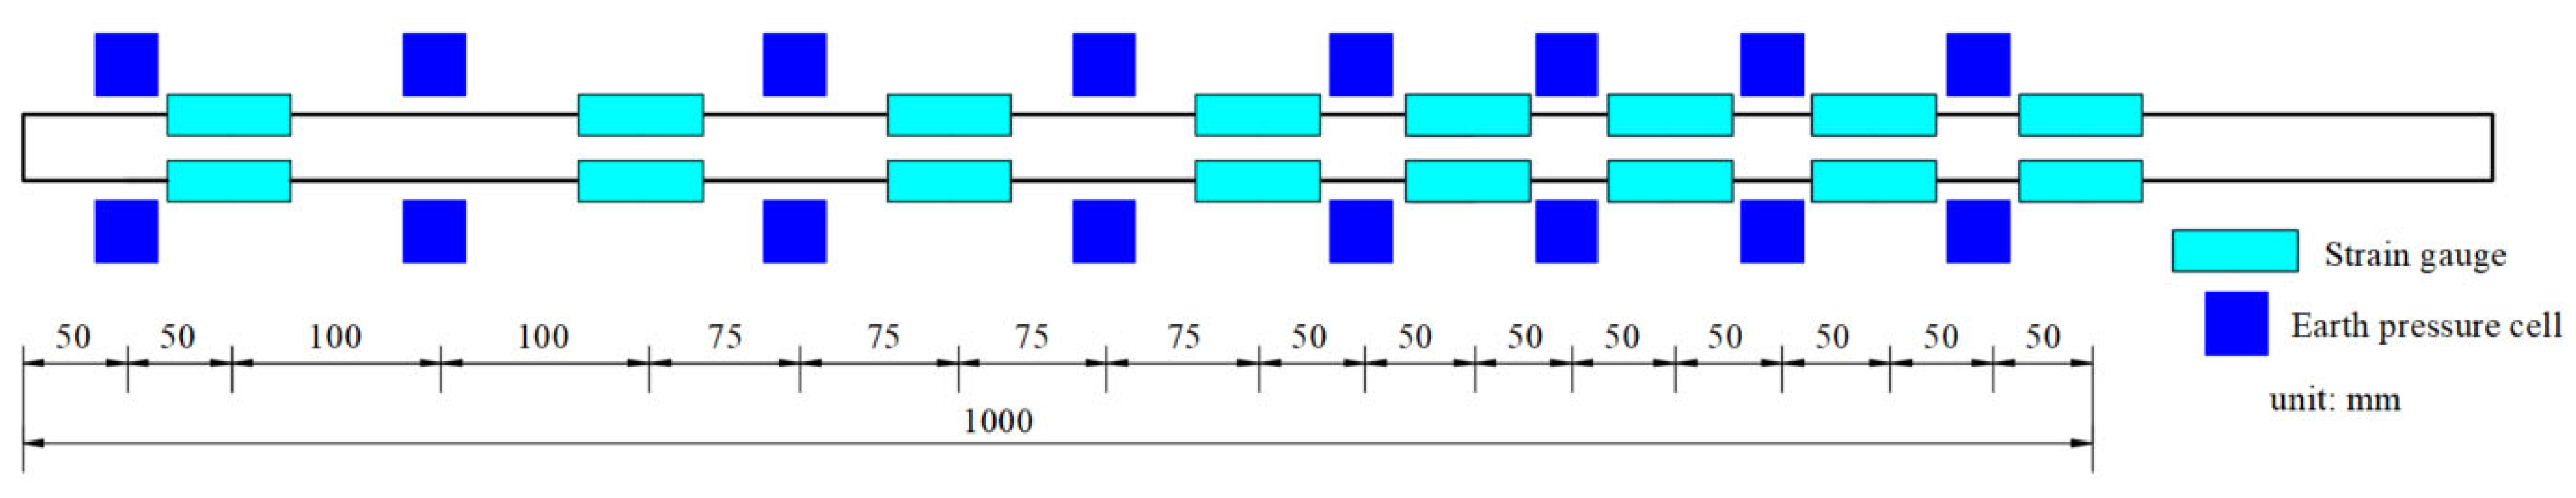
2.2. Experimental Setup
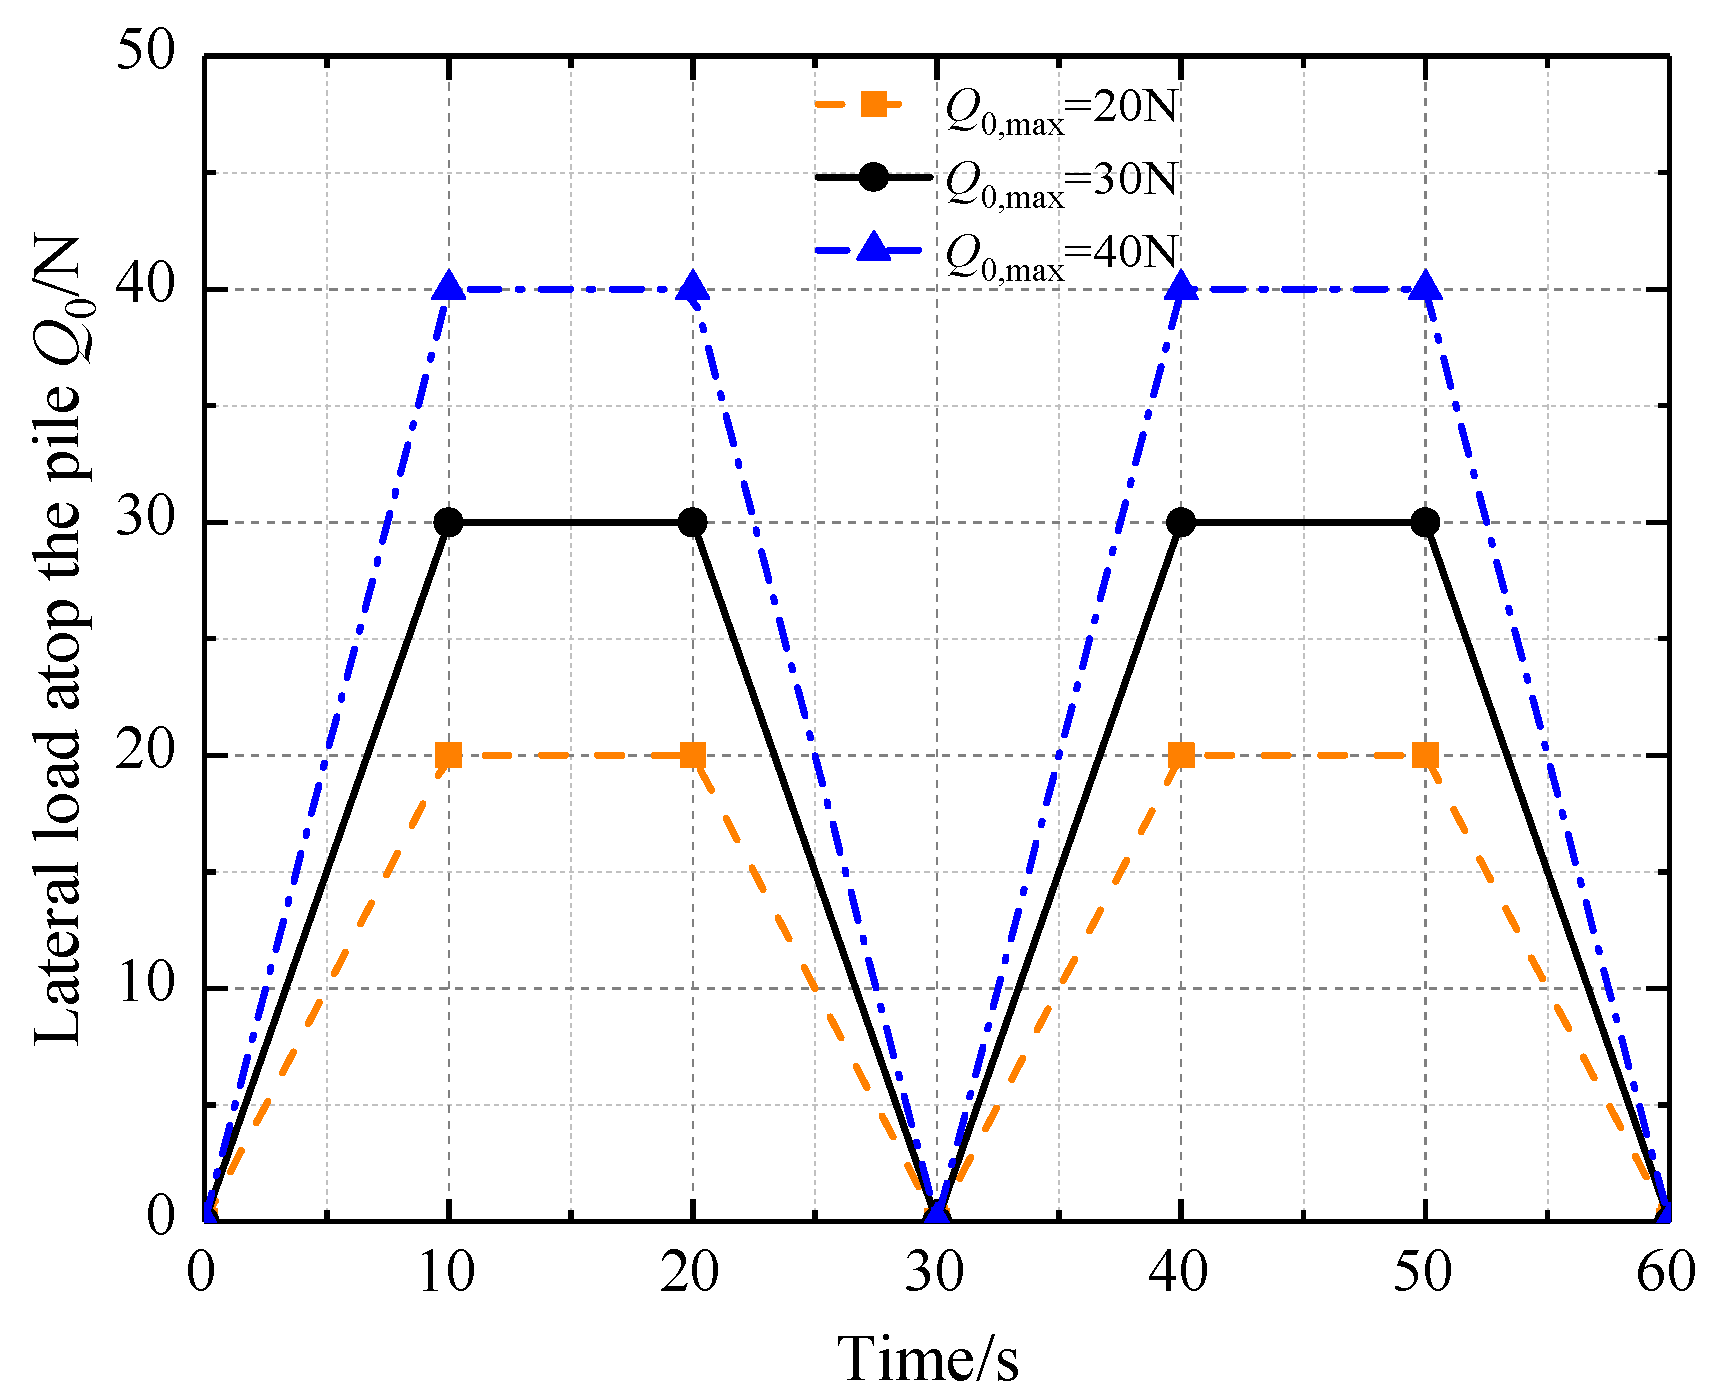
The model experiments were performed in a custom-made steel test tank (1.6 × 1 × 1.2 m), one side of which was made of strengthened glass for observing the deformations of pile and slope (Figure 1). To eliminate the boundary effect, the minimum distance between the model pile and four sides of the test tank was designed to be about 15 times the pile diameter, much greater than the pile influence zone [28,29,39].
The model pile was made of a polypropylene random pipe (PPR pipe) with an outer diameter and wall thickness of 32 mm and 4.4 mm, respectively, and the pile was pre-installed with an embedded length of 1 m. PPR pipe was used mainly because of its toughness and creep resistance, high strength, machinability, and economic efficiency, allowing a greater selection of the other geometry parameters in the model experiment design. The model pile can be classified as a flexible pile as per the pile deformation coefficient α [38], derived by Equation (7). In addition, a steel cylinder was welded at the bottom of the test tank to enclose and fix the pile tip, whereas a cylindrical iron mass (80 N) near the pile head was used to model the self-weight of superstructures and consider the second-order effect (P-Δ effect).
α = m b E I 5
As illustrated in Figure 2, several pairs of strain gauges (BFH120-5AA-D150, electrical resistance type) and earth pressure cells (DMTY, vibrating wire type, range of 100 kPa) were symmetrically placed along the pile [11,13]. These sensors were further protected by the thin and low-strength tape [15] to avoid the possible damage resulting from the soil around the pile and infiltrated water [10]. The displacement gauges (DMWY-100, range of 100 mm) were also installed to measure the pile head deflections y0.
The model slope was first constructed in lifts with unsaturated river sand (containing clay components and hydrophilic minerals) at a uniform density (constructed in lifts with six sand layers; each layer is 0.2 m thick with a prescribed mass of 480 kg) and then graded for cases of different slopes. The internal friction angle (φ = 13.26°) and apparent cohesion (c = 10.66 kPa) were determined by direct shear tests; apparent cohesion can guarantee sufficient slope stability even for a slope of 60°. Some laboratory geotechnical tests were also carried out to obtain the physicomechanical parameters, such as moisture content ω = 3.84%, modulus of compression Es = 4.43 MPa, void ratio e = 0.42, unit weight γ = 18.83 kN/m3, specific gravity Gs = 2.62, and proportion coefficient of subgrade reaction m = 26.24 MN/m4. The relative density was not given because the maximum and minimum void ratios are easy to access only in the absence of clay components and hydrophilic minerals. As demonstrated in Figure 3, the coefficient of uniformity Cu and coefficient of curvature Cc were 5.74 (<6.0) and 0.94 (<6.0), respectively, and thus the soil classification is given as SP. The ratio of pile diameter to grain diameter d50 is approximately 100, comfortably greater than the minimum requirement of 40 [25].

2.3. Test Procedure

To investigate the effects of slope and one-way cyclic lateral loading on the pile responses, a series of one-way cyclic lateral loading tests were performed on the model pile in different cases of cycle number, load amplitude, and slope angle, as listed in Table 2. For comparison, the lateral static loading tests in both level ground and sloping ground were conducted as well. All the lateral loads were controlled by the computer system (load-controlled) and applied by an electric servo cylinder (YJ-DG-500-300, load range 0~50 kN, frequency 0~1 HZ), connecting to the pile head with a steel strand.
In the one-way cyclic lateral loading tests, the loading was controlled by the self-coded spectrum, following the loading paths of trapezoidal waves [11] illustrated in Figure 4. The loading period and loading frequency were constant in all the one-way cyclic lateral loading tests, that is, T = 30 s and f = 0.03 Hz, and the experimental data were gathered once a second. The loading was terminated when the cycle number n reached 2500. As to the lateral static loading tests, the loading was applied as per the slow maintenance loading method [38] with a load increment of 1/8 to 1/10 of the estimated ultimate bearing capacity, and it was terminated when the pile head deflection y0 was greater than 30 mm. The loading of the next stage was applied while the increasing rate of successively measured pile head deflection in a minute was less than 0.1 mm/h.
The pile head deflections and subgrade reactions can be directly measured by the displacement gauges and earth pressure cells, respectively, whereas the bending moments M can be indirectly inferred by the measured strains from strain gauges [11,16,28], as presented in Equation (8). Note that although the measured pile head deflections cannot be directly used to predict the prototype pile response, their variations with cycle number, load amplitude, and slope angle would be applicable for the prototype pile. Furthermore, the measured pile head deflections can also be used to validate the subsequent theoretical study on predicting one-way cyclic lateral responses of piles in sloping ground.
M = E I ε t + ε c D
where εt and εc symbolize the tension strain (+) and compression strain (−), respectively.

3. Results and Discussion

To generalize the results and conclusions, the depth, deflection, bending moment, and subgrade reaction are nondimensional as zα, yα, Mα, and pα, respectively, given by Equations (9)–(12).
z α = α z
y α = y b 0
M α = M α E I
p α = p α 3 E I

3.1. Consistency of Measurements

To ensure that the measurements are realistic, the subgrade reaction profiles indirectly inferred from bending moment profiles, expressed as Equation (13), are compared with those directly measured by earth pressure cells in C2, C4, and C5 (n = 100), as illustrated in Figure 5. The comparisons reveal that the subgrade reactions inferred from measured bending moments generally coincide with those measured by earth pressure cells. Although some difference exists, they can be tolerated considering the inherent defect caused by the fitting for limited discrete points.
p z = d 2 M d z 2

3.2. Lateral Static Loading Tests

The developments of the pile head deflection y0 and bending moment at the ground surface M0 with the lateral load atop the pile Q0 in lateral static loading tests are illustrated in Figure 6. The pile head deflections y0 in either level ground or sloping ground increase with increasing lateral load at a decreasing rate, which is similar to the experimental observations by Mezazigh and Levacher [25]. The Q0-y0 curves for the case in level ground and the case of θ = 45° can be approximately fitted by power functions Q0 = 19.45 y00.63 and Q0 = 14.82 y00.59, respectively. The M0-Q0 curves for the case in level and sloping ground (θ = 45°) can be approximately fitted by elementary functions M0 = 0.01 Q0 + 0.0044 Q01.54 and M0 = 0.01 Q0 + 0.1832 Q00.70, respectively; they are composed of two terms, 0.01 Q0 and 0.0044 Q01.54 (0.1832 Q00.70), and the former is induced by lateral load eccentricity (e = 0.01 m), whereas the latter is caused by the second-order effect. As in published studies [28,40,41], the lateral load producing a pile head deflection of 0.2 times the pile diameter (6.4 mm) has been frequently taken as the allowable bearing capacity of piles (62 N and 43 N for cases of level and sloping ground, respectively). In this regard, the load amplitudes in the one-way cyclic lateral loading tests should be less than the pile bearing capacity (43 N) in the sloping ground and tentatively chosen as 20, 30, and 40 N, respectively.
Compared to the pile head deflection and bending moment profile, the pile deflection profile is more difficult to measure directly due to the restriction of experimental conditions, and thus a supplementary theoretical analysis is required. Consequently, the finite beam element method (FBEM) is introduced and detailed in Appendix A [6,7,8]. To validate the FBEM (Figure 7 and Figure 8), the pile responses (pile head deflections and bending moment profiles) predicted by FBEM are compared with observations and those from the power series method (PSM) detailed in Appendix B [38]. Note that the coefficients for the case of sloping ground required by PSM are unavailable from the specification JTG 3363-2019 [38], that is, the slope effect cannot be considered by PSM in the specification. The slope effect, however, can be considered in FBEM by halving the proportional coefficient of subgrade reaction coefficient m when z = 0 to 3b [6,38]. These comparisons demonstrate that the pile head deflections predicted by FBEM are consistent with measured results and particularly close to those estimated by PSM. However, there are some errors between the predictions (FBEM and PSM) and observations in terms of the profile of dimensionless bending moment. This is mainly because the moment at the ground surface used in the theoretical methods only includes the component induced by lateral load eccentricity (0.01 Q0) while neglecting the one induced by the second-order effect (0.0044 Q01.54). The second-order effect cannot be ignored and thus would be considered in the subsequent analysis for cyclic lateral loading tests when using the FBEM.
For further validation in terms of p-y curves, the pile deflection profiles predicted by FBEM and measured subgrade reaction profiles are shown in Figure 9 and Figure 10, respectively. Note that the subgrade reaction opposite to the lateral load is denoted as positive. On this basis, the p-y curves at different depths can be constructed reflecting the subgrade reaction modulus by the gradient (Figure 11), but the constructed p-y curves need further validation because the pile deflection is predicted rather than measured. The validation can be performed by comparing the subgrade reaction moduli indicated by p-y curves with those by the m-method in FBEM (dash-dot lines) because the agreement would occur only when the predicted pile deflection approaches the real one, allowing it to rightly accommodate measured subgrade reaction. The good agreement at small deflections proves that the FBEM can well predict the lateral static responses of piles both in level ground and sloping ground.
In addition to FBEM and PSM, an alternative method was adopted to predict the pile deflection and subgrade reaction profiles by double integrating and double differentiating the bending moment profiles, respectively. Owing to the discreteness of measured bending moments, the profiles were commonly fitted by functions such as the local quintic spline function [25], cubic polynomial function [42], and mixed function [30]. This method can give an approximate assessment of the pile deflection and subgrade reaction profiles; however, these obtained profiles may not coincide well with the actual pile responses. For example, the subgrade reaction profile predicted by double differentiating the cubic polynomial function is a linear function [42], which is completely different from the real one. In comparison, the FBEM can make up the deficiency and is more realistic as previously confirmed.

3.3. Cyclic Lateral Loading Tests

To generalize the trends of measured pile head deflection, it is fairly common to develop the relationships between the dimensionless pile head deflection y0,α = y0/b0 and cycle number n, as illustrated in Figure 12. As anticipated, the measured dimensionless pile head deflection increases with cycle number at a decreasing rate and is positively related to both the load amplitude and slope angle. In addition, the dimensionless pile head deflection in the case of n = 100 accounts for almost 60% of that in the case of n = 2500, indicating the fundamental role of the first 100 loading cycles for the one-way cyclic lateral responses of piles. Interestingly, the dimensionless pile head deflection versus cycle number curves can be well fitted by power functions [10] y0,α = An0.11, and the fitting coefficient A is related to the load amplitude Q0 and slope angle θ as in Figure 12.
Figure 13 demonstrates the dimensionless bending moment and subgrade reaction profiles under different cycle numbers in test C2 (Q0 = 30 N and θ = 45°). Both the dimensionless bending moment and subgrade reaction increase with cycle number as expected, indicating that the soil at the shallow depth is progressively softened; however, the increase slows down when n > 100. The locations of the inflection point (M = 0) and critical point (p = 0) move downward with increasing cycles, indicating that the increase in cycle number promotes the mobilization of subgrade reaction at the deeper depth to maintain the lateral equilibrium of piles. The dimensionless bending moment is observed to increase with cycle number when zα < 4.58 but remains almost zero when zα > 4.58, which is consistent with the suggestion that the pile deflections and bending moments below zα = 4 are almost zero and can even be neglected [38]. In reality, the soil near the ground surface would yield when the subgrade reaction reaches the lateral limiting force; hence, the subgrade reaction close to the ground surface would be small. Obviously, the continuous distributions of measured subgrade reactions are reasonable, similar to the typical distribution of subgrade reactions [30].
To further investigate the effects of slope angle and load amplitude on the cyclic lateral responses of piles, the dimensionless bending moment and subgrade reaction profiles (n = 100) in different cases of load amplitude and slope angle are compared in Figure 14. The negative bending moments and obvious inflection points occur at the lower parts of these bending moment profiles, proving that the model pile can be classified as a long flexible pile. The pattern of these bending moment profiles with inflection points is similar to the observations for long flexible piles in level ground [9,11,16] and sloping ground [25,28]. As the load amplitude varies from Q0 = 20 to 30 to 40 N, the maximum of Mα increases from 0.010 to 0.019 to 0.029 and the maximum of pα increases from 0.094 to 0.290 to 0.441; however, the locations of maximums of Mα and pα remain unchanged at zα = 1.7 and 2, respectively. In addition, as the slope angle ranges from θ = 30° to 45° to 60°, the maximum of Mα varies from 0.011 to 0.019 to 0.025 and appears approximately at zα = 1, 1.7, and 2.5, respectively; as the slope angle ranges from θ = 30° to 45° to 60°, the dimensionless maximum subgrade reactions above the critical point vary from 0.246 to 0.290 to 0.322 and appear approximately at the depth zα = 1.25, 2 and 2.91, respectively. In conclusion, both the increase of load amplitude and slope angle can increase the maximums of Mα and pα, with greater pile deflections; however, only the increase in slope angle w leads to the increased depth of these maximums.
Similarly, the FBEM is also employed to predict the pile responses in cyclic lateral loading tests including the dimensionless pile deflection profiles. For simplicity, only the predicted dimensionless pile deflection and bending moment profiles under different cycle numbers in test C2 are demonstrated in Figure 15. The pile deflections evidently demonstrate a characteristic of flexible piles; in addition, they gradually increase with the increasing cycle number when the number of cycles n is greater than 100 but are insensitive to the cycle number when it is greater than 100 and especially greater than 600. Excellent agreement was observed between the FBEM predictions and measured results, proving that the FBEM can well predict the one-way cyclic lateral responses of piles in sloping ground (Figure 16). Explanations for two points are necessary. The first point is the discrepancy in terms of the locations of the maximum bending moment of piles; the measured maximum bending moment seems to occur at about zα = 1.75 in Figure 13a, whereas the locations of the predicted ones are varied in Figure 15b (at zα = 1.25 when n = 1 and at zα = 2 when n > 100). This is mainly because the curves directly connecting the scattered points of measurement are inherently discontinuous and thus probably fail to capture the real extreme points of interest, although they can also provide a possible pattern reflecting the development of the bending moment to some extent. To make up for shortcomings of the scattered measurement and obtain a full picture of relatively real bending moment profiles, FBEM can work as a supplementary analysis means, as previously testified. The second is the unfavorable prerequisite for the use of FBEM; although FBEM is effective in solving the aforementioned problem, it requires the measurement of the bending moment at the ground surface for each case when the subgrade reaction modulus is uncertain, thus preventing a generalized application. To summarize, FBEM in this paper is only used as a supplementary analysis method for the experimental method. In a follow-up study, a more systematic theoretical method including the assessment method of subgrade reaction modulus under cyclic load will be proposed by comparative analysis of more in-depth tests and numerical studies.

4. Conclusions

This study investigated the effects of cycle number, load amplitude, and slope angle on the one-way cyclic lateral responses of piles in sloping ground by model experiments and the finite beam element method. Based on these experimental and theoretical observations, conclusions can be drawn as follows:
(i)
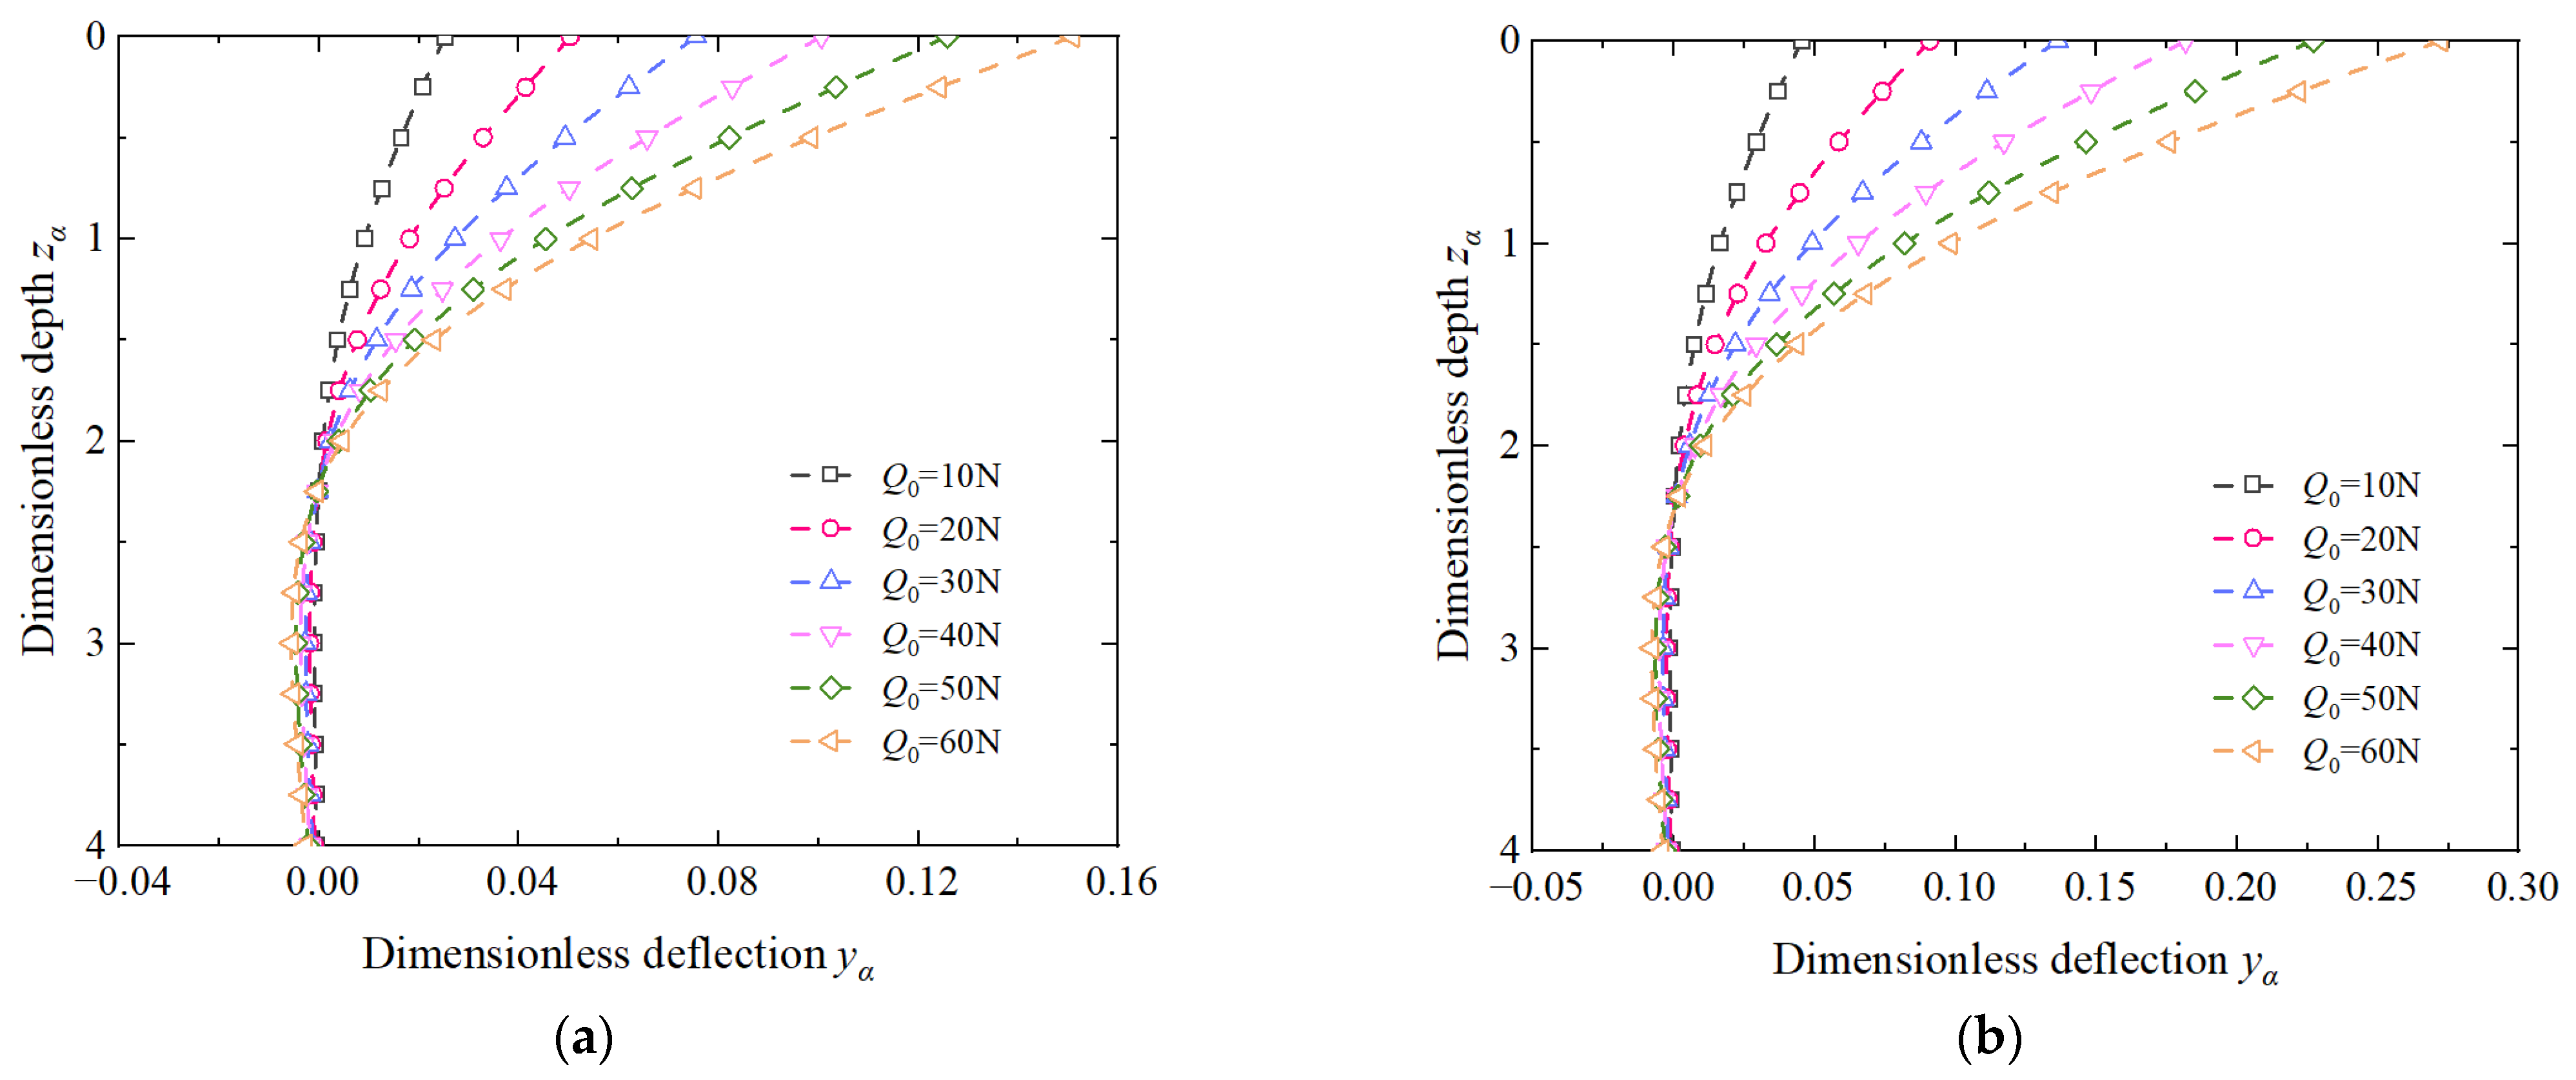
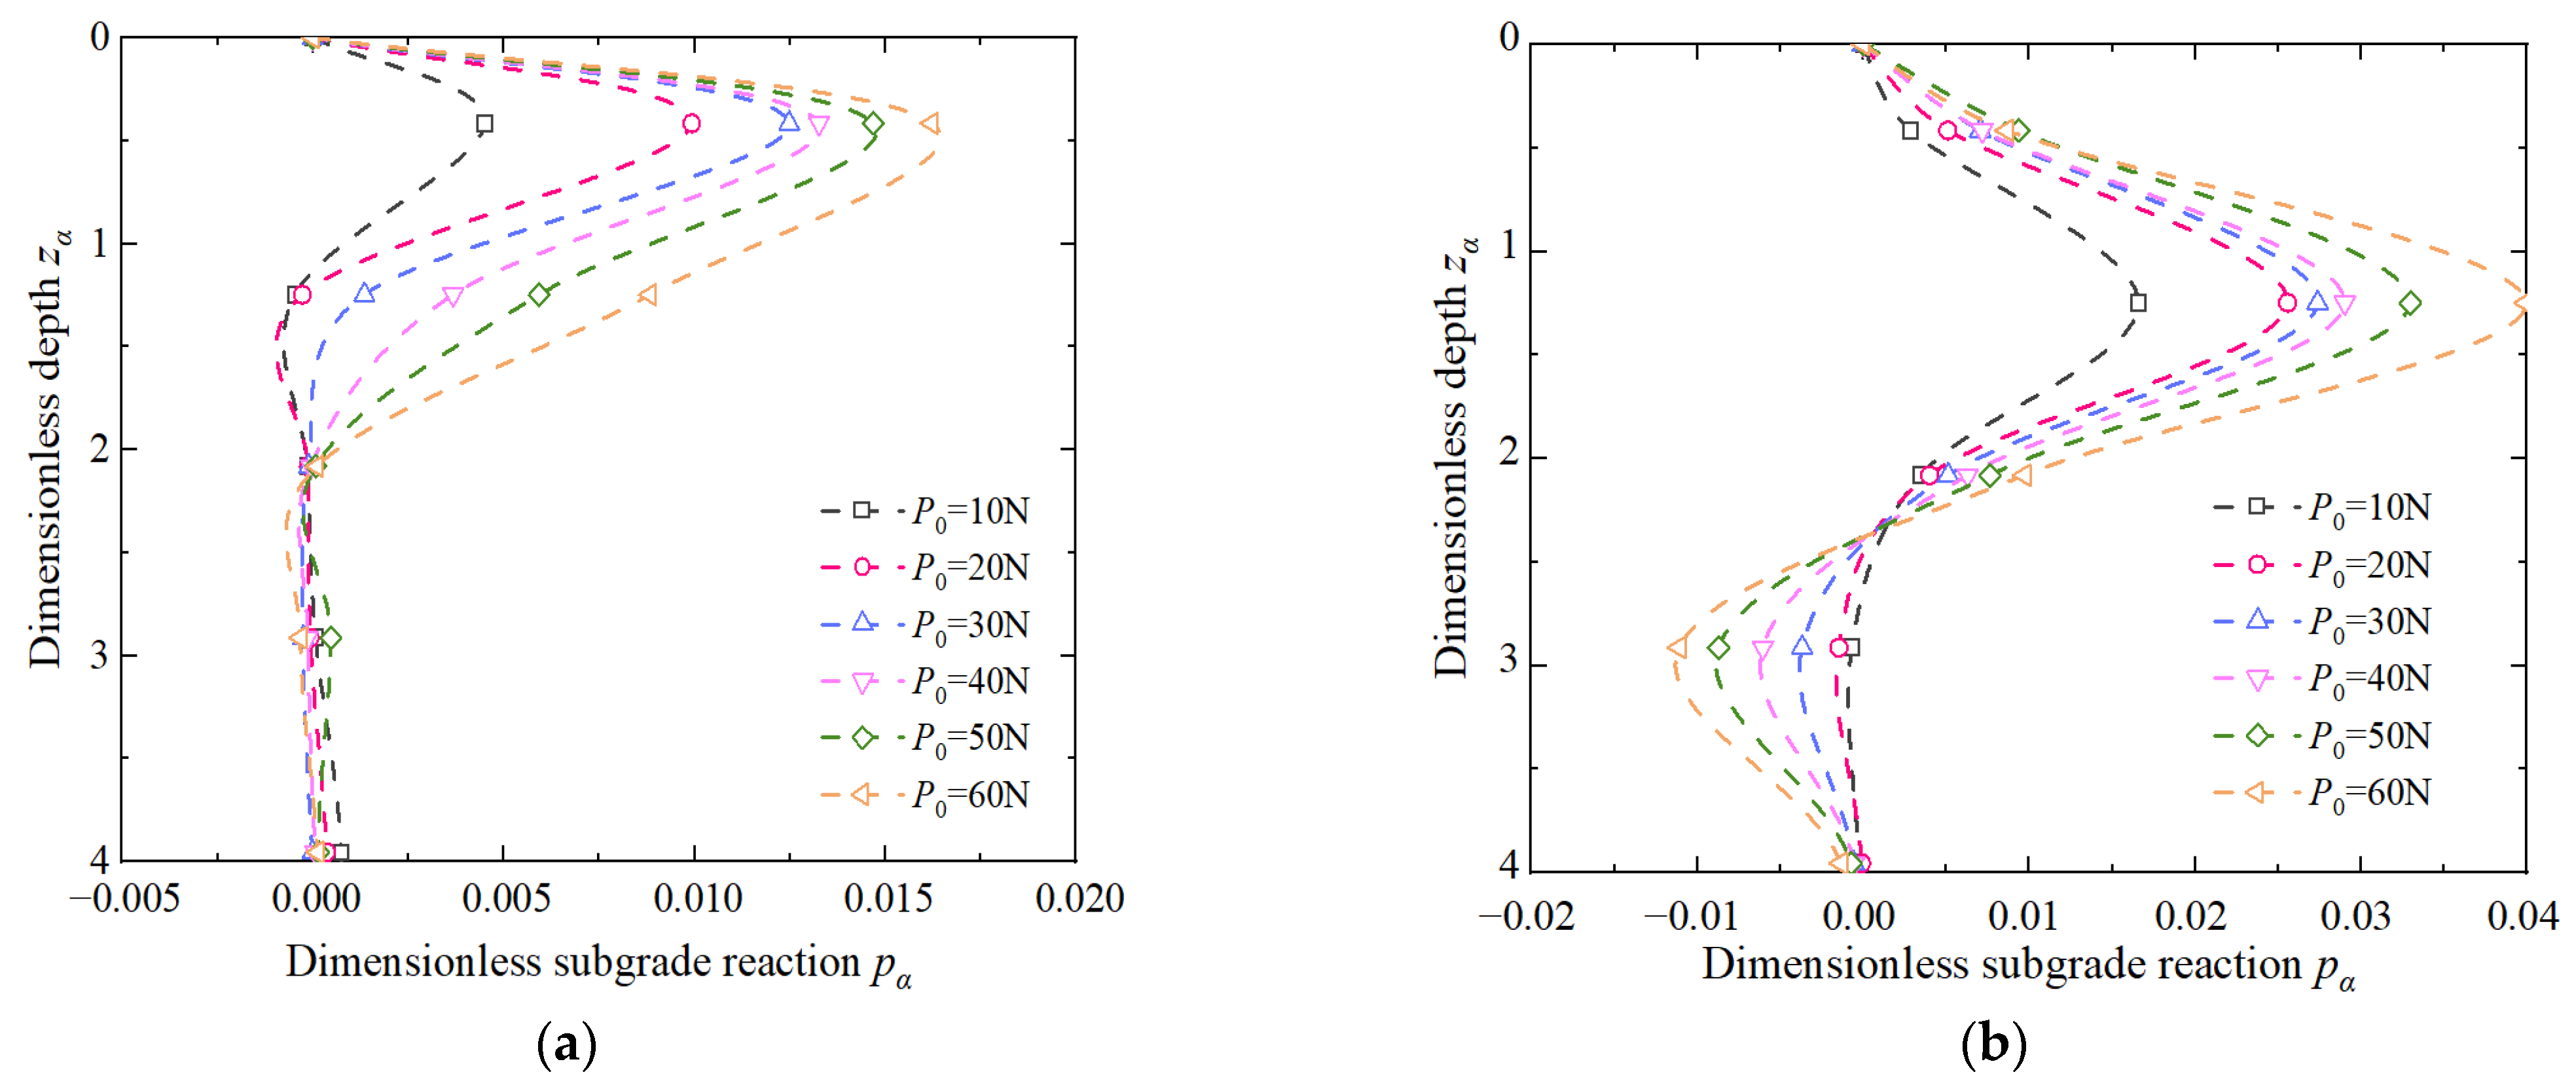
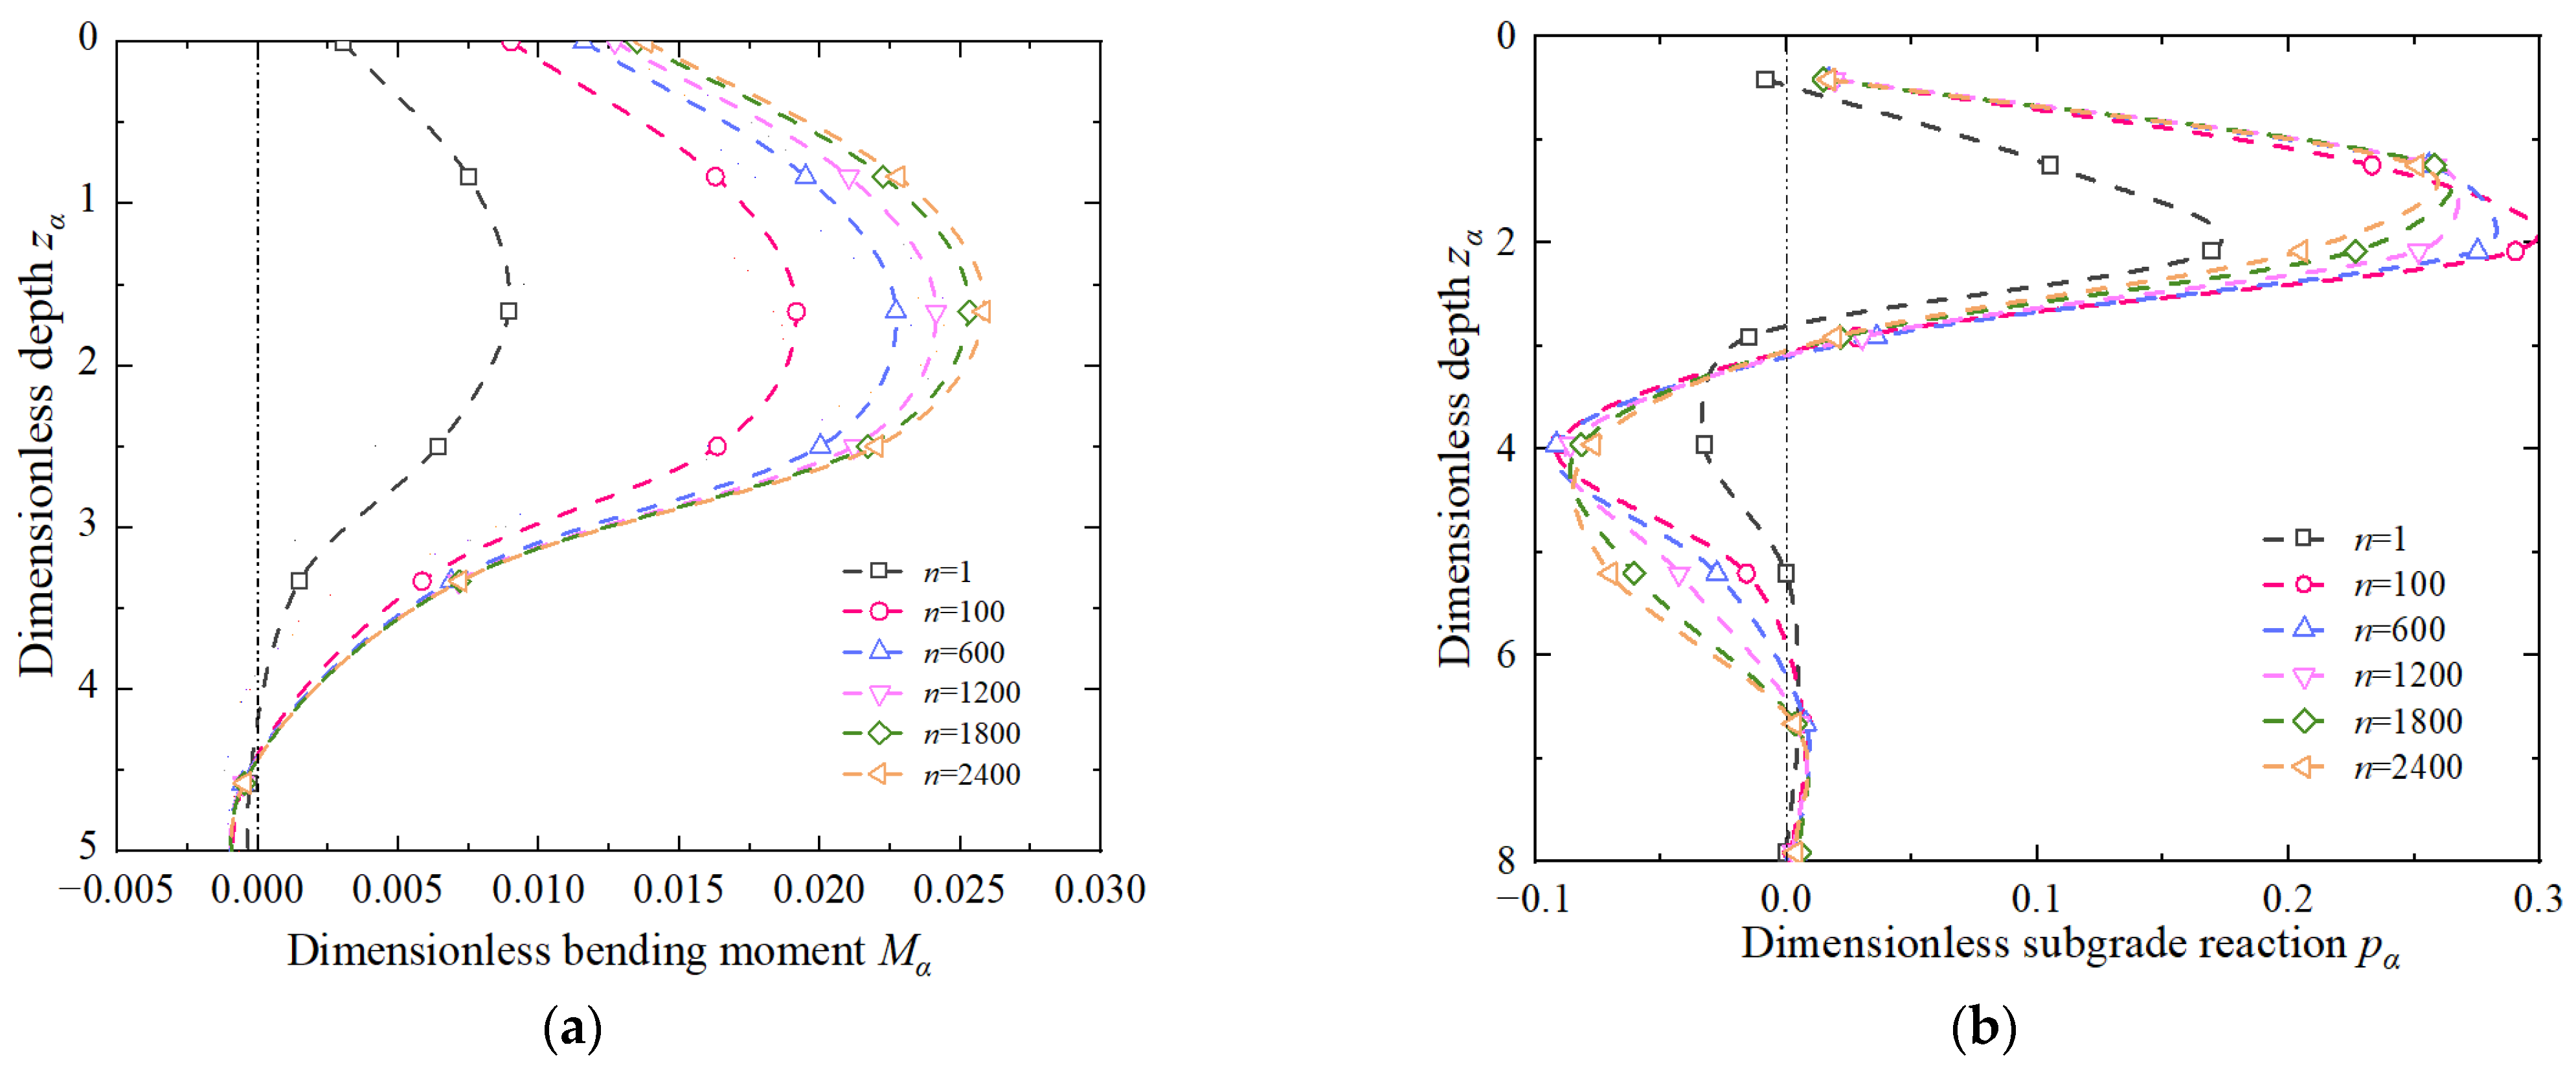
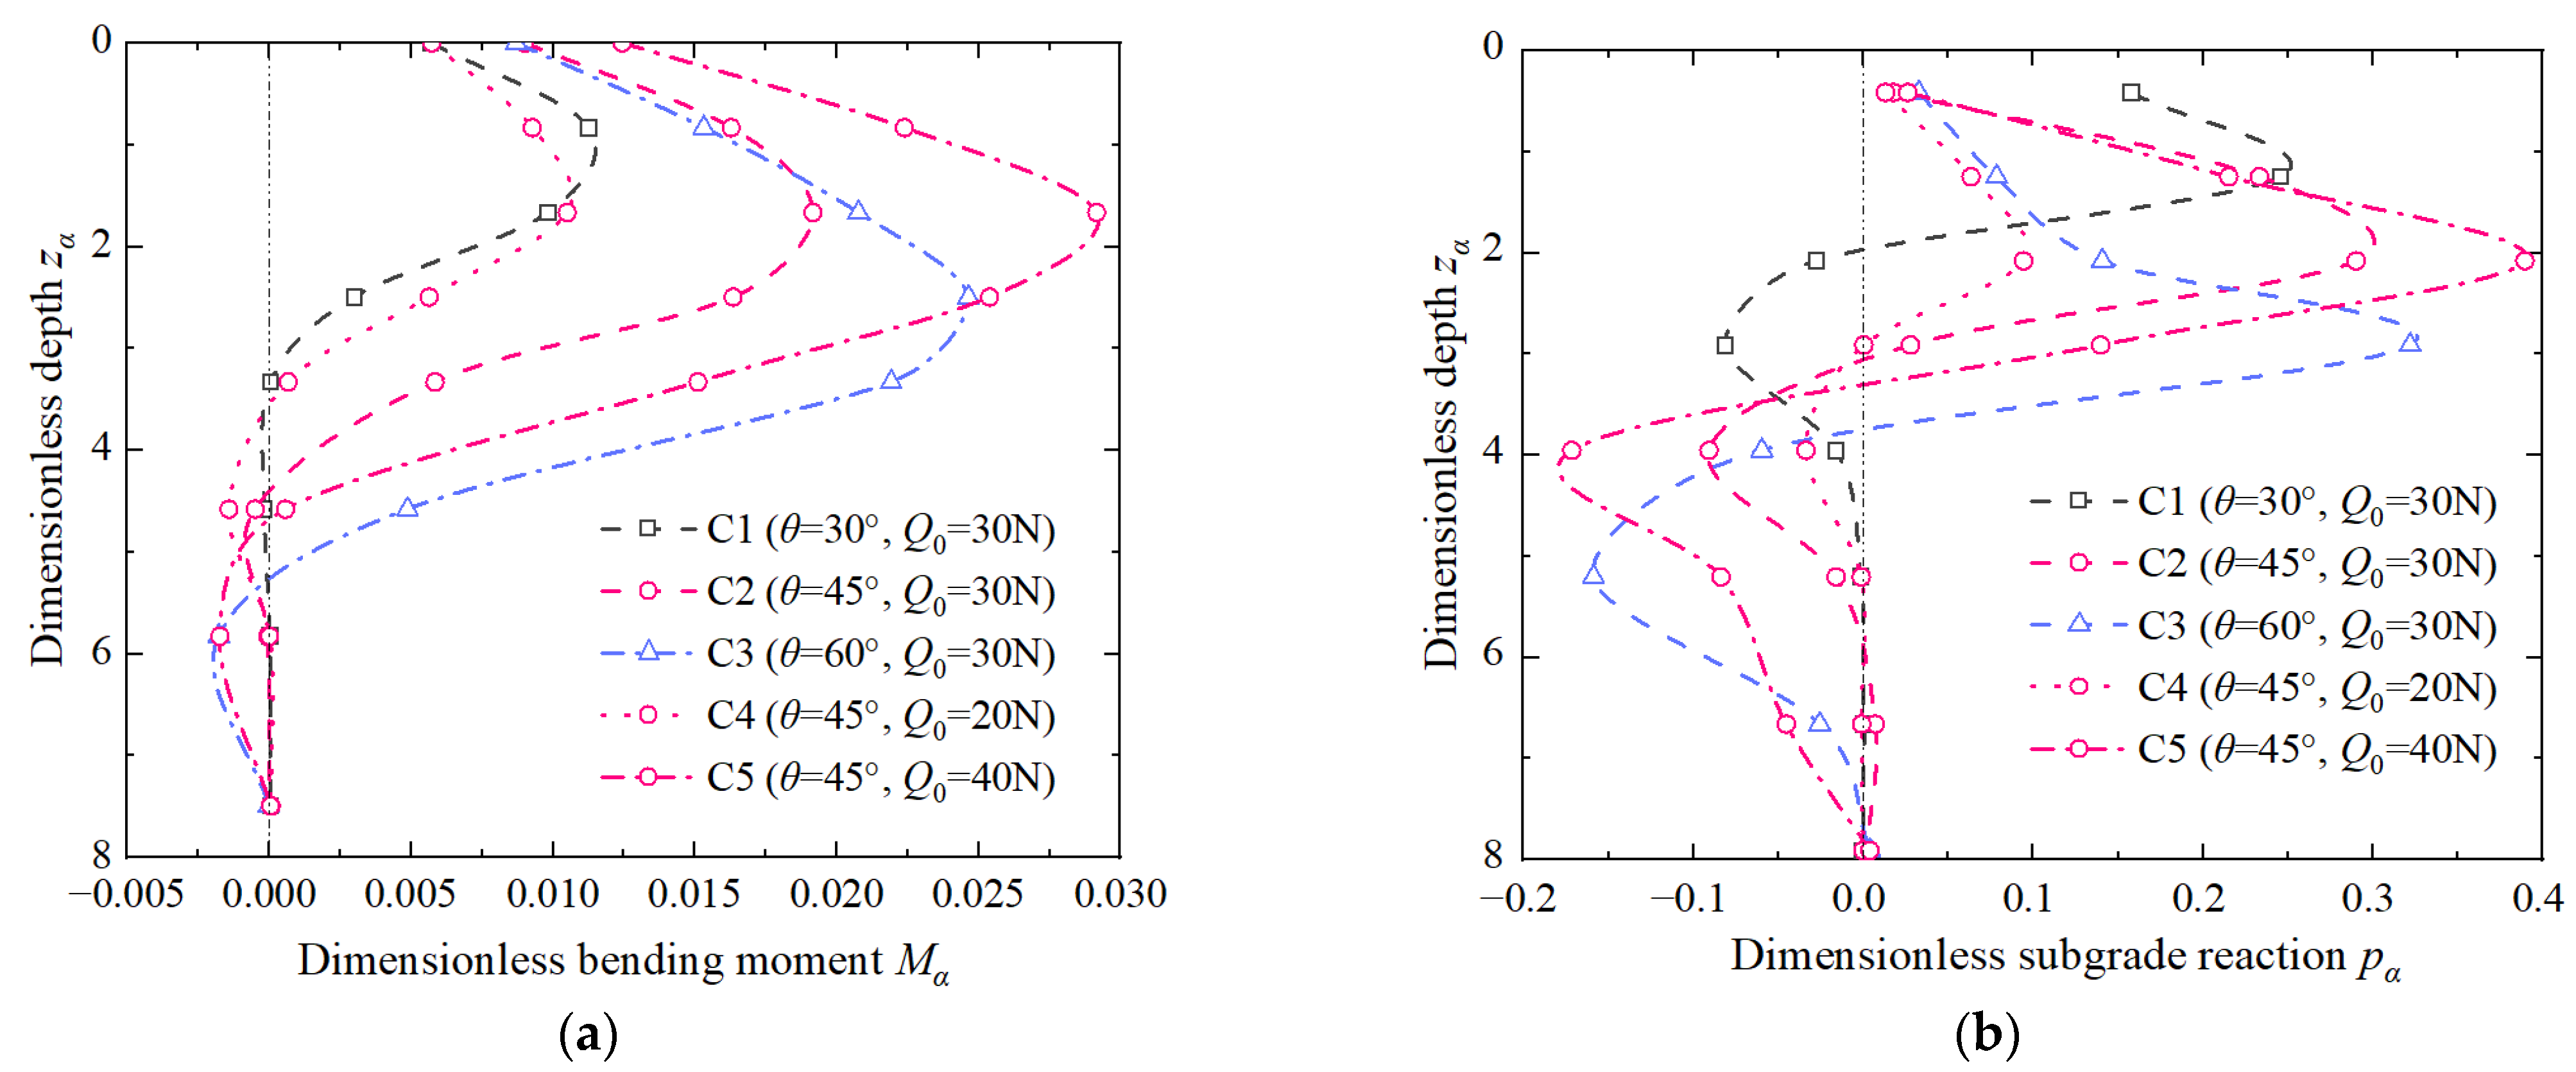
The increase of cycle number, load amplitude, and slope angle can increase pile responses, including the maximums of bending moment and subgrade reaction, and pile head deflections. However, only the increases in cycle number and slope angle lead to the increased depth of inflection point and critical point, indicating that the increases promote the mobilization of subgrade reaction at the deeper depth to maintain the lateral equilibrium of piles.
(ii)
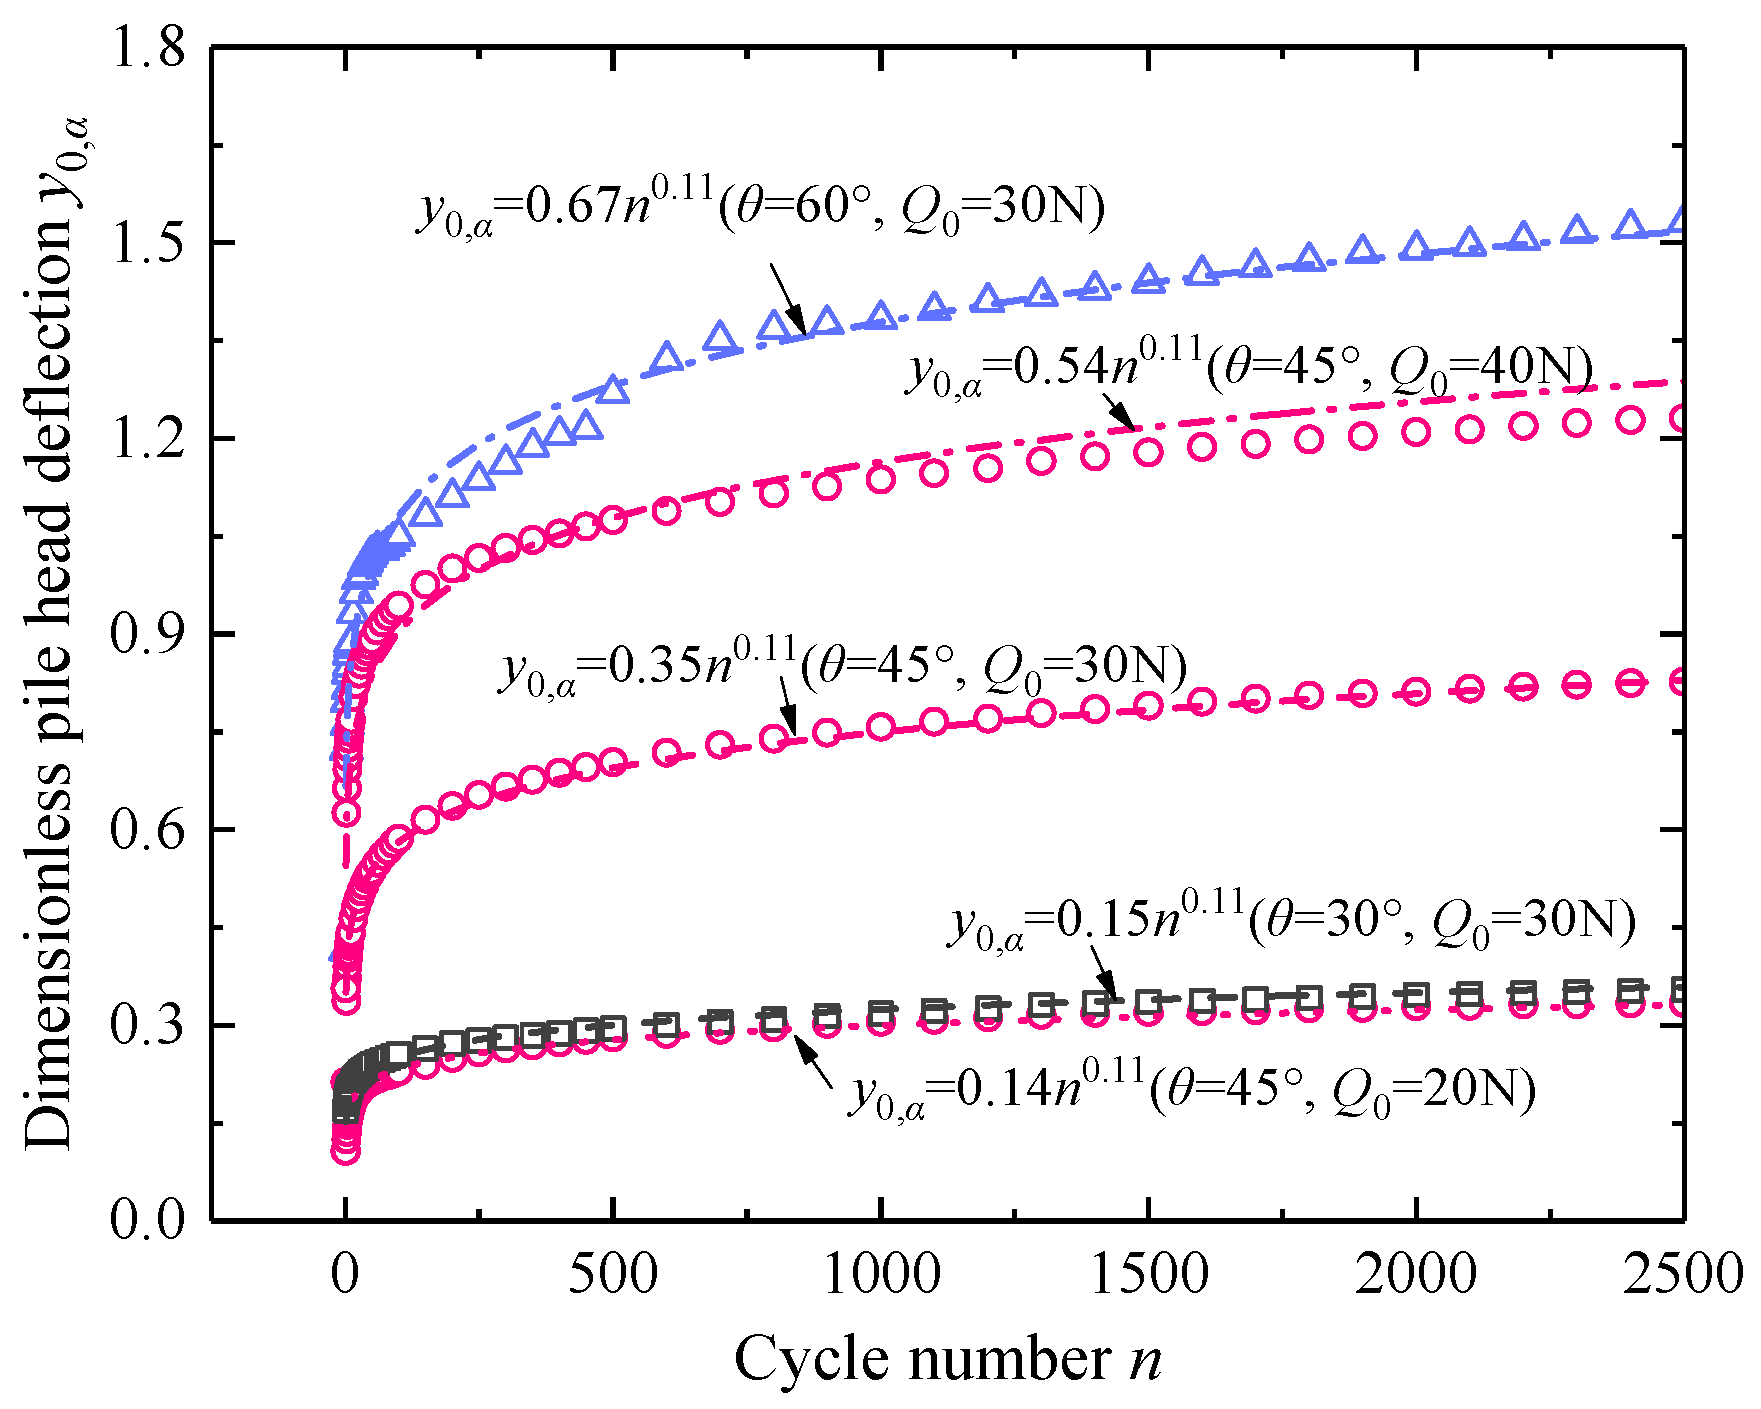
The increase of these pile responses slows down when n > 100, indicating that the first 100 loading cycles are fundamental for the one-way cyclic lateral responses of piles. Interestingly, the variations of dimensionless pile head deflection with cycle number can be well fitted by power functions y0,α = An0.11.
(iii)
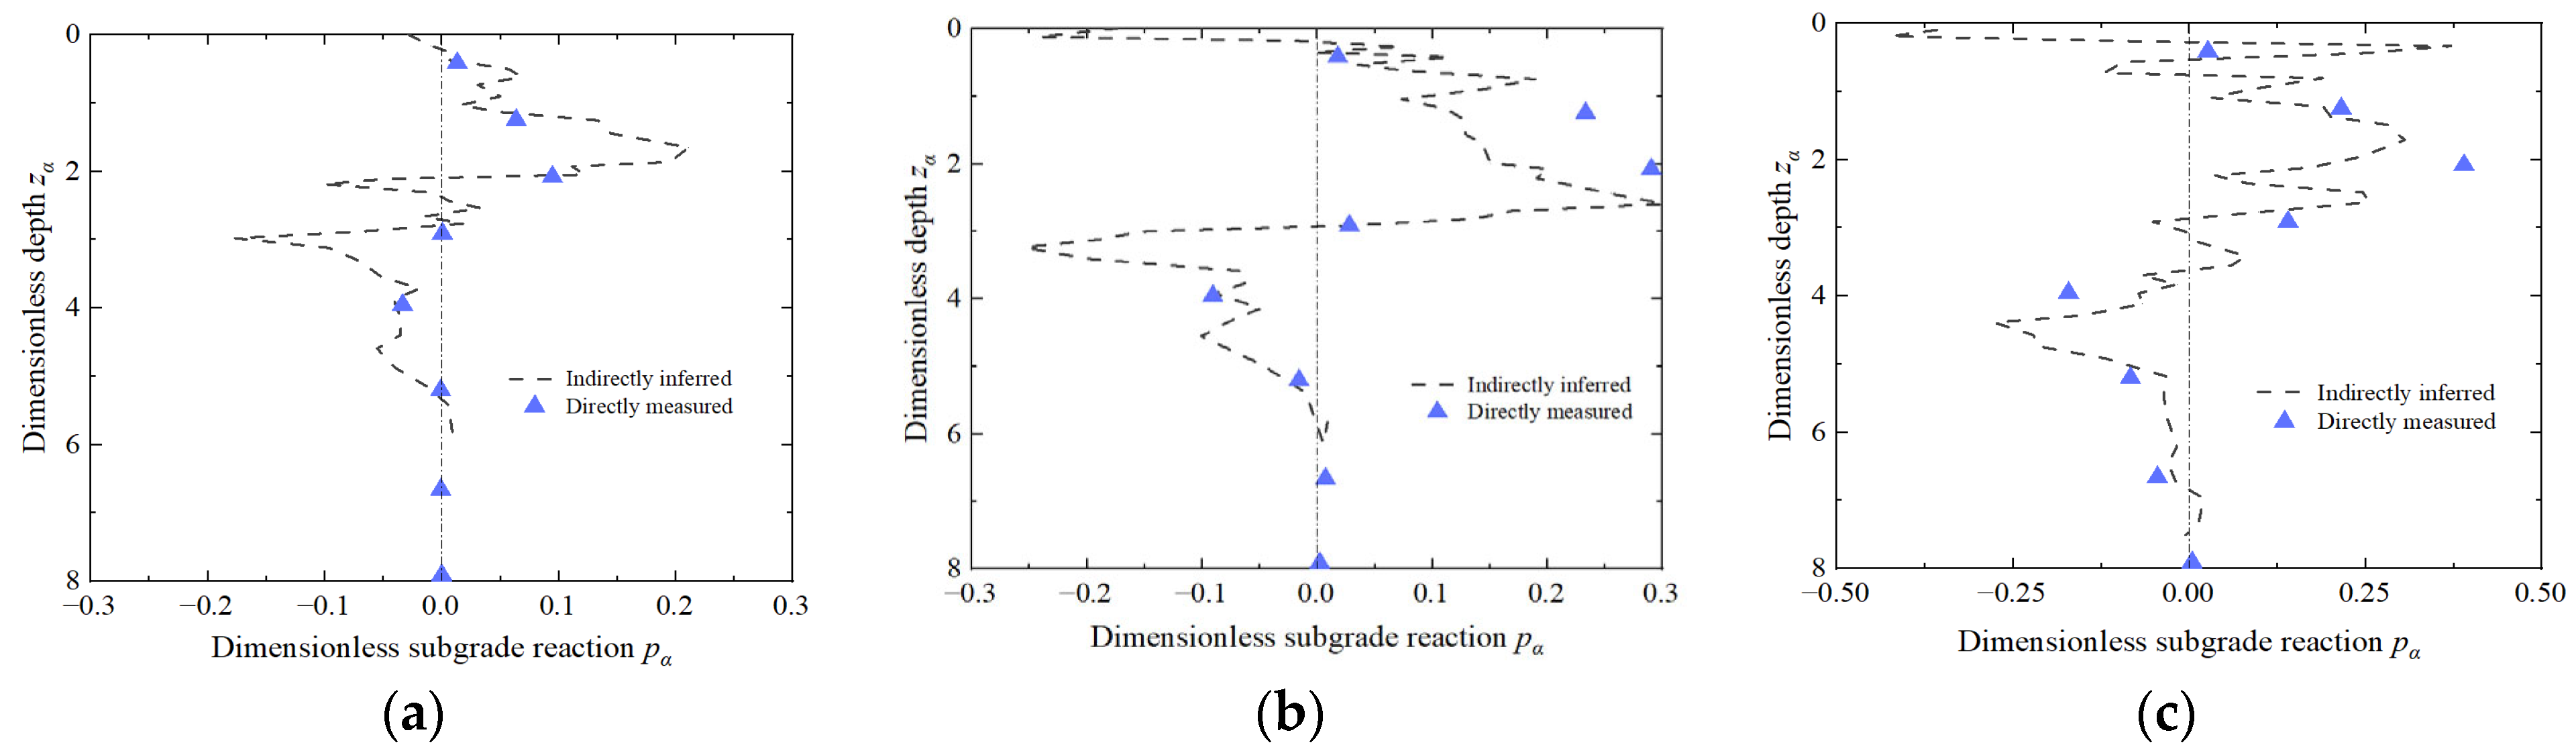
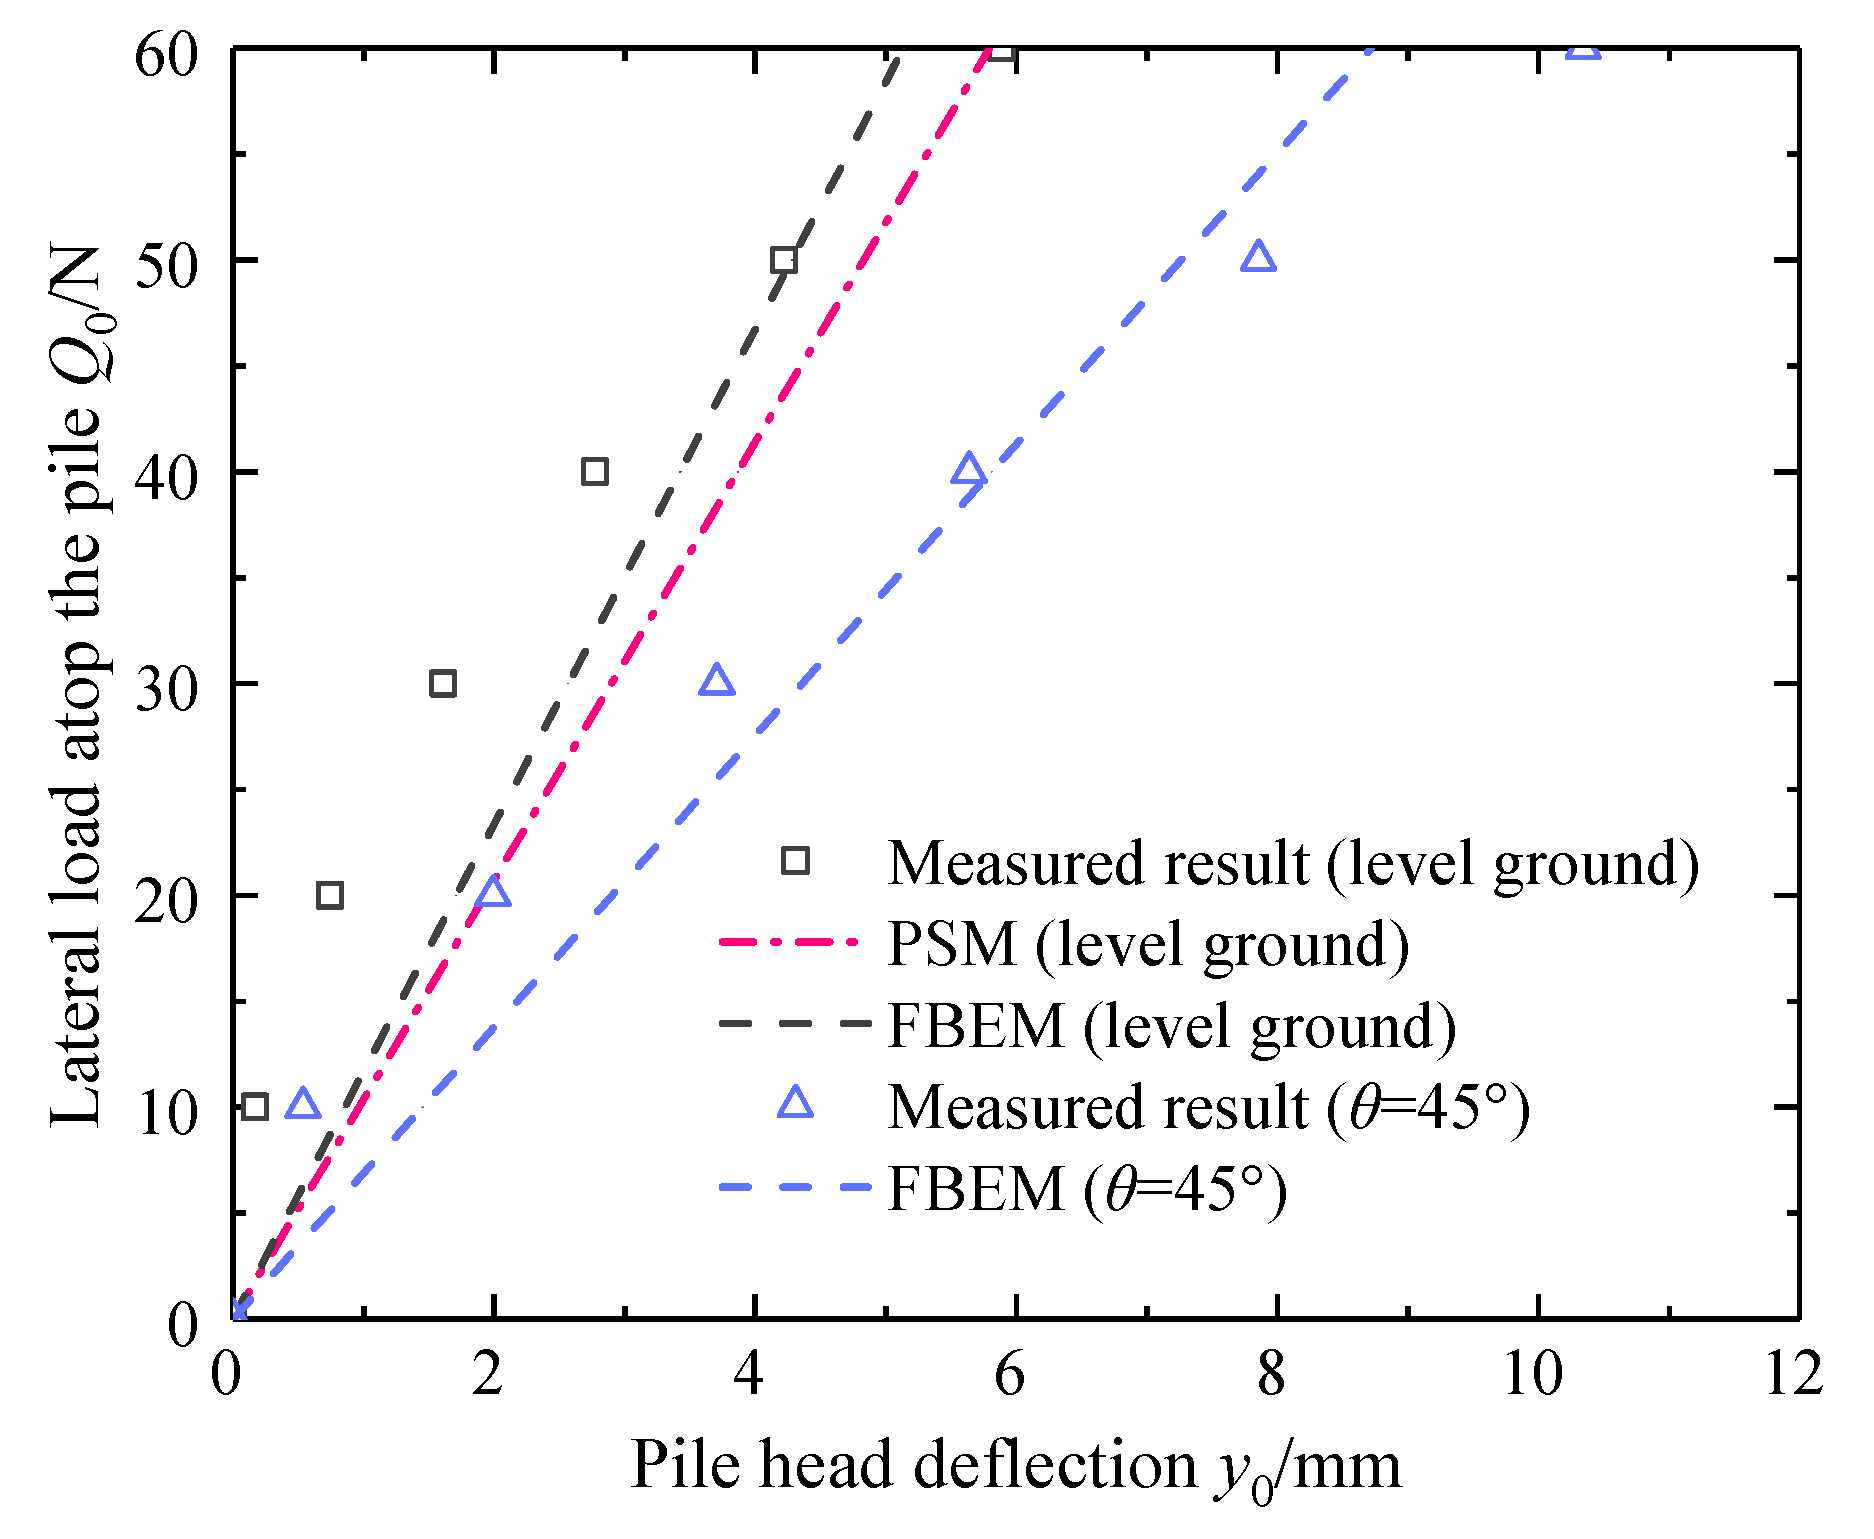
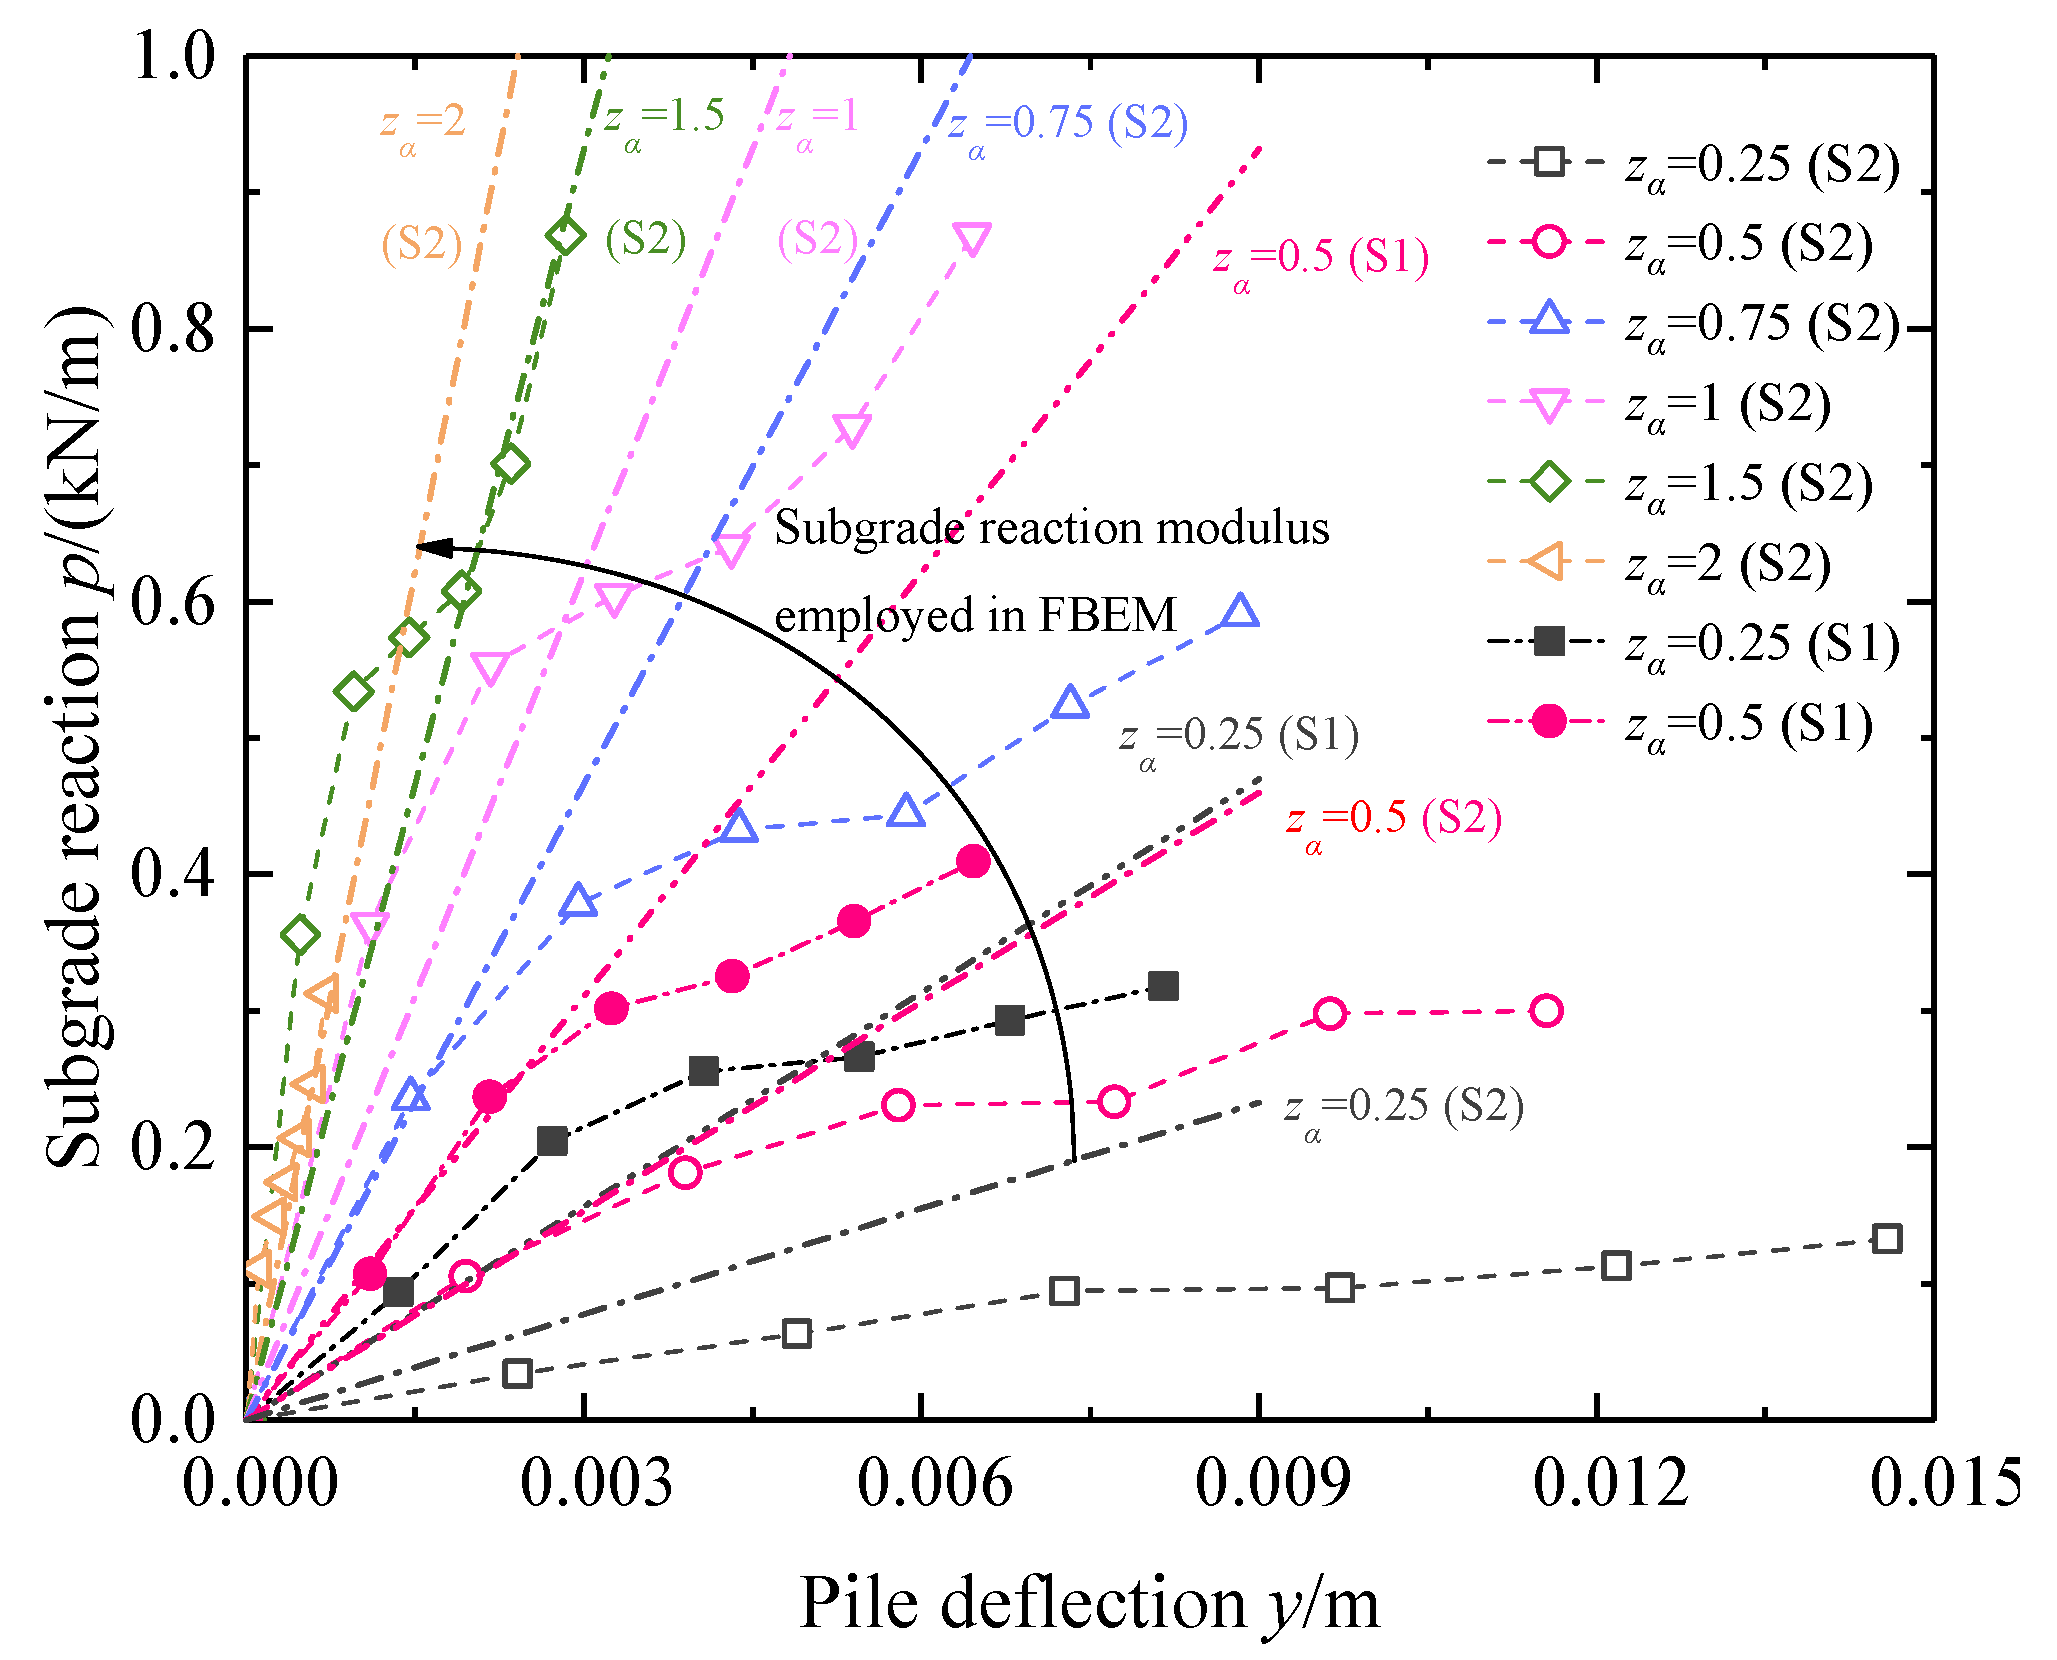
The finite beam element method (FBEM) is compared with experimental observations and other theoretical methods, and it is more realistic than other theoretical methods. The missing points of the pile deflection caused by incompetence of direct measurement can be alternatively obtained by FBEM in a supplementary analysis. On this basis, a full picture of the bending moment profile can be obtained and better characterize the maximum pile response and its location, compared to the one outlined by connecting the scattered points of the measured bending moment. This proves that the FBEM can well predict the one-way cyclic lateral responses and lateral static responses of piles in sloping ground, and the slope effect and second-order effect should be considered in the analysis for cyclic lateral loading tests when using the FBEM.
(iv)
Although the FBEM is verified and demonstrates the above advantages, its use relies on the known condition of bending moment at the ground by observation when the subgrade reaction modulus is unknown. This prerequisite restrains its general application to a certain extent, and the FBEM is thus only used as a supplementary analysis method for experimental means in this paper. A more systematic theoretical method including the assessment method of subgrade reaction modulus under cyclic load will be proposed by comparative analysis of more in-depth tests and numerical studies in the future.

Author Contributions

Conceptualization, W.P.; Data curation, M.Z.; Formal analysis, W.P.; Funding acquisition, C.Y.; Investigation, C.Y.; Project administration, M.Z.; Resources, M.Z. and C.Y.; Software, S.Z.; Validation, W.P. and S.Z.; Writing—original draft, W.P.; Writing—review & editing, S.Z. All authors have read and agreed to the published version of the manuscript.

Funding

This research was funded by the National Natural Science Foundation of China (Grant Nos. 52108317 and 51908208) and the Natural Science Foundation of Hunan Province of China (Grant No. 2022JJ40074).

Institutional Review Board Statement

Not applicable.

Informed Consent Statement

Not applicable.

Data Availability Statement

Some or all data, models, or codes that support the findings of this study are available from the corresponding author upon reasonable request (the data in the graph and the code of calculation, etc.).

Conflicts of Interest

No conflict of interest exists in the submission of this manuscript, and the manuscript is approved by all authors for publication.

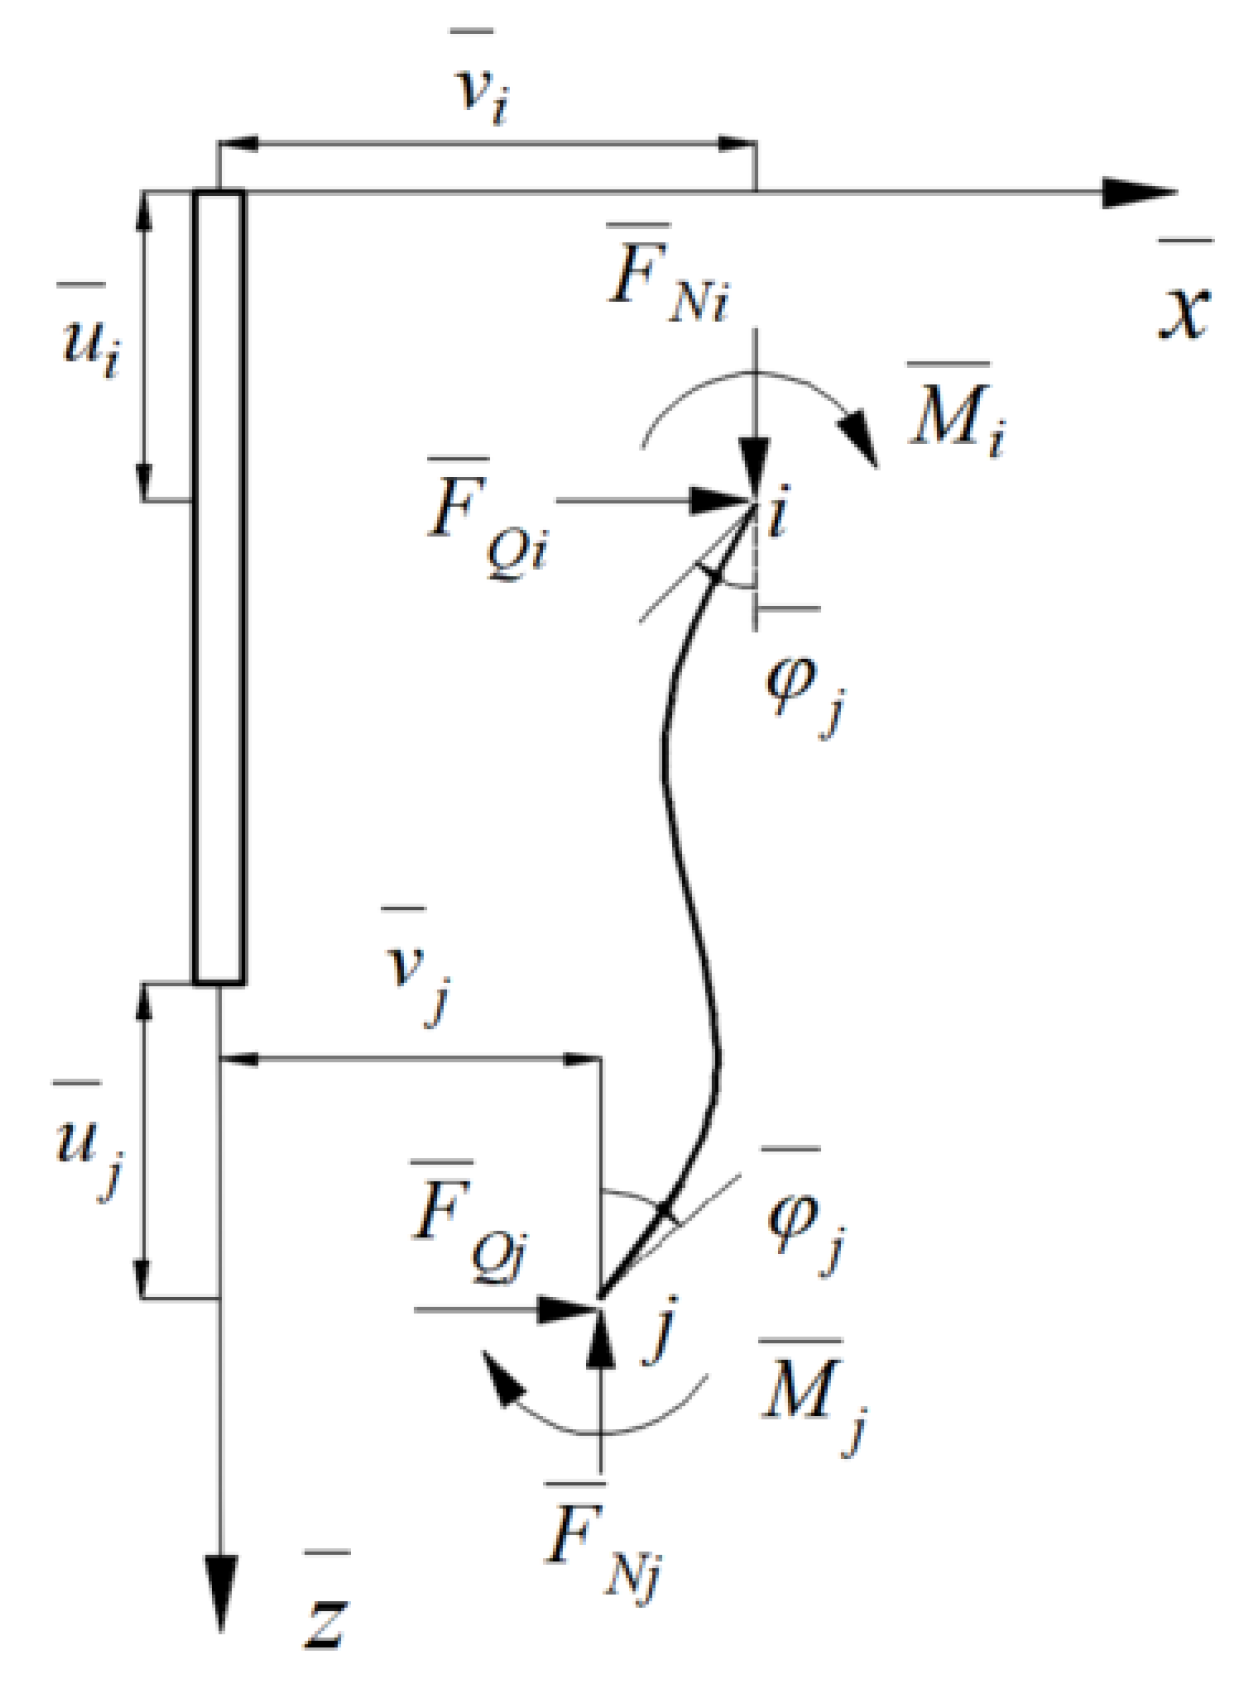
Appendix A. Finite Beam Element Method

Figure A1 illustrates a pile element with the length li, flexural rigidity EI, and axial rigidity EA, and the element ends are noted as the node i and node j. Six element end forces ( F ¯ N i , F ¯ Q i , M ¯ i , F ¯ N j , F ¯ Q j , and M ¯ j ) and six element-end displacements ( u ¯ i , v ¯ i , φ ¯ i , u ¯ j , v ¯ j , and φ ¯ j ) can be written in the vector form:
F ¯ e = F ¯ N i F ¯ Q i M ¯ i F ¯ N j F ¯ Q j M ¯ j T
δ ¯ e = u ¯ i v ¯ i φ ¯ i u ¯ j v ¯ j φ ¯ j T
The relationship between these two vectors can be obtained by the principle of virtual work, Equation (A3).
F ¯ e = k δ ¯ e
where k is the element stiffness matrix, k = k0 +kP + kI + kG, k0 is the basis element stiffness matrix in Equation (A4), kP, kI, and kG are the modified element stiffness matrixes considering the second-order effect, the strengthening effect of surrounding soils on the pile stiffness, and the shear resistance induced by the Pasternak model, expressed as Equations (A5)–(A7), respectively.
k 0 = [ E A l i 0 0 E A l i 0 0 0 12 E I l i 3 6 E I l i 2 0 12 E I l i 3 6 E I l i 2 0 6 E I l i 2 4 E I l i 0 6 E I l i 2 2 E I l i E A l i 0 0 E A l i 0 0 0 12 E I l i 3 6 E I l i 2 0 12 E I l i 3 6 E I l i 2 0 6 E I l i 2 2 E I l i 0 6 E I l i 2 4 E I l i ]
k P = 0 0 0 0 0 0 0 p i j l i 0 0 p i j l i 0 0 0 0 0 0 0 0 0 0 0 0 0 0 p i j l i 0 0 p i j l i 0 0 0 0 0 0 0
k I = m ( h i + l i 2 ) b 0 0 0 0 0 0 0 0 13 35 l i 11 210 l i 0 9 70 l i 13 420 l i 2 0 11 210 l i 1 105 l i 3 0 19 140 l i 2 1 140 l i 3 0 0 0 0 0 0 0 9 70 l i 19 140 l i 2 0 13 35 l i 11 210 l i 2 0 13 420 l i 2 1 140 l i 3 0 1 140 l i 3 1 105 l i 3
k G = G p b 0 0 0 0 0 0 0 0 6 5 l i 1 10 0 6 5 l i 1 10 0 1 10 2 15 l i 0 1 10 l i 30 0 0 0 0 0 0 0 6 5 l i 1 10 0 6 5 l i 1 10 0 1 10 l i 30 0 1 10 2 15 l i
where pij is the axial force at the middle of an element; hi represents the depth of an element top; Gp is the shear modulus of soils.
Figure A1. Element end forces and displacements.
Applsci 12 08169 g0a1
Furthermore, the element stiffness matrix k can be written in symmetry matrix form, Equation (A8) for simplification, with the double-subscript notation employed to represent the force and displacement, respectively. Hence, the global stiffness matrix of piles can be given by assembling the element stiffness matrixes as shown in Figure A2, the dimensions of which are (3N + 3) × (3N + 3), while the element numbers are N.
k = k 11 k 12 k 21 k 22
Figure A2. Global stiffness matrix of the pile.
Applsci 12 08169 g0a2

Appendix B. Power Series Method

The pile deflection δHH(0) and rotation δMH(0) at the ground surface under unit lateral load (P0 = 1) can be expressed as Equations (A9) and (A10), respectively. The rotation δHM(0) and pile deflection δMM(0) at the ground surface under a unit moment (M0 = 1) can be expressed as Equations (A11) and (A12), respectively. Hence, the pile deflection and rotation at the ground surface can be obtained by Equations (A13) and (A14), respectively. Furthermore, the bending moment and subgrade reaction profile can be derived by Equations (A15) and (A16).
δ HH 0 = 1 α 3 E I B 2 D 1 B 1 D 2 A 2 B 1 A 1 B 2
δ MH 0 = 1 α 2 E I A 2 D 1 A 1 D 2 A 2 B 1 A 1 B 2
δ HM 0 = δ MH 0 = 1 α 2 E I B 2 C 1 B 1 C 2 A 2 B 1 A 1 B 2
δ MM 0 = 1 α E I A 2 C 1 A 1 C 2 A 2 B 1 A 1 B 2
y 0 = P 0 δ HH 0 + M 0 δ HM 0
φ 0 = P 0 δ MH 0 + M 0 δ MM 0
M z = α 2 E I y 0 A 3 + φ 0 α B 3 + M 0 α 2 E I C 3 + P 0 α 3 E I D 3
Q z = α 3 E I y 0 A 4 + φ 0 α B 4 + M 0 α 2 E I C 4 + P 0 α 3 E I D 4
where Ai, Bi, Ci, and Di (i = 1, 2, 3, and 4) are dimensionless coefficients of pile responses, given in Table A1, Table A2, Table A3 and Table A4.
Table A1. Dimensionless coefficient of pile responses (A1, B1, C1, and D1).
zα = αzA1B1C1D1
0.01.000000.000000.000000.00000
0.11.000000.100000.005000.00017
0.21.000000.200000.020000.00133
0.30.999980.300000.045000.00450
0.40.999910.399990.080000.01067
0.50.999740.499960.125000.02083
0.60.999350.599870.179980.03600
0.70.998600.699670.244950.05716
0.80.997270.799270.319880.08532
0.90.995080.898520.404720.12146
1.00.991670.997220.499410.16657
1.10.986581.095080.603840.22163
1.20.979271.191710.717870.28758
1.30.969081.286600.841270.36536
1.40.955231.379100.973730.45588
1.50.936811.468391.114840.55997
1.60.912801.553461.264030.67842
1.70.882011.633071.420610.81193
1.80.843131.705751.583620.96109
1.90.794671.769721.751901.12637
2.00.735021.822941.924021.30801
2.20.574911.887092.272171.72042
2.40.346911.874502.608822.19535
2.60.0331461.754732.906702.72365
2.8−0.385481.490373.128433.28769
3.0−0.928091.036793.224713.85838
3.5−2.92799−1.271722.463044.97982
4.0−5.85333−5.94097−0.926774.54780
Table A2. Dimensionless coefficient of pile responses (A2, B2, C2, and D2).
zα = αzA2B2C2D2
0.00.000001.000000.000000.00000
0.10.000001.000000.100000.00500
0.2−0.000071.000000.200000.02000
0.3−0.000340.999960.300000.04500
0.4−0.001070.999830.399980.08000
0.5−0.002600.999480.499940.12499
0.6−0.005400.998700.599810.17998
0.7−0.010000.997200.699510.24494
0.8−0.017070.994540.798910.31983
0.9−0.027330.990160.897790.40462
1.0−0.041670.983330.995830.49921
1.1−0.060960.973171.092620.60346
1.2−0.086320.958551.187560.71716
1.3−0.118830.938171.279900.84002
1.4−0.159730.910471.368650.97163
1.5−0.210300.873651.452591.11145
1.6−0.271940.825651.530201.25872
1.7−0.346040.764131.599631.41247
1.8−0.434120.686451.658671.57150
1.9−0.537680.589671.704681.73422
2.0−0.658220.470611.734571.89872
2.2−0.956160.151271.731102.22299
2.4−1.33889−0.302731.612862.51874
2.6−1.81479−0.926021.334852.74972
2.8−2.38756−1.754830.841772.86653
3.0−3.05319−2.824100.068372.80406
3.5−4.98062−6.70806−3.586471.27018
4.0−6.53316−12.15810−10.60840−3.76647
Table A3. Dimensionless coefficient of pile responses (A3, B3, C3, and D3).
zα = αzA3B3C3D3
0.00.000000.000001.000000.00000
0.1−0.00017−0.000011.000000.10000
0.2−0.00133−0.000130.999990.20000
0.3−0.00450−0.000670.999940.30000
0.4−0.01067−0.002130.999740.39998
0.5−0.02083−0.005210.999220.49991
0.6−0.03600−0.010800.998060.59974
0.7−0.05716−0.020010.995800.69935
0.8−0.08532−0.034120.991810.79854
0.9−0.12144−0.054660.985240.89705
1.0−0.16652−0.083290.975010.99445
1.1−0.22152−0.121920.959751.09016
1.2−0.28737−0.172600.937831.18342
1.3−0.36496−0.237600.907271.27320
1.4−0.45515−0.319330.865731.35821
1.5−0.55870−0.420390.810541.43680
1.6−0.67629−0.543480.738591.50695
1.7−0.80848−0.691440.646371.56621
1.8−0.95564−0.867150.529971.61162
1.9−1.11796−1.073570.385031.63969
2.0−1.29535−1.313610.206761.64628
2.2−1.69334−1.90567−0.270871.57538
2.4−2.14117−2.66329−0.948851.35201
2.6−2.62126−3.59987−1.877340.91679
2.8−3.10341−4.71748−3.107910.19729
3.0−3.54058−5.99979−4.68788−0.89126
3.5−3.91921−9.54367−10.34040−5.85402
4.0−1.61428−11.73066−17.91860−15.07550
Table A4. Dimensionless coefficient of pile responses (A4, B4, C4, and D4).
zα = αzA4B4C4D4
0.00.000000.000000.000001.00000
0.1−0.00500−0.00033−0.000011.00000
0.2−0.02000−0.00267−0.000200.99999
0.3−0.04500−0.00900−0.001010.99992
0.4−0.08000−0.02133−0.003200.99966
0.5−0.12499−0.04167−0.007810.99896
0.6−0.17997−0.07199−0.016200.99741
0.7−0.24490−0.11433−0.030010.99440
0.8−0.31975−0.17060−0.051200.98908
0.9−0.40443−0.24284−0.081980.98032
1.0−0.49881−0.33298−0.124930.96667
1.1−0.60268−0.44292−0.182850.94634
1.2−0.71573−0.57450−0.258860.91712
1.3−0.83753−0.72950−0.356310.87638
1.4−0.96746−0.90754−0.478830.82102
1.5−1.10468−1.11609−0.630270.74745
1.6−1.24808−1.35042−0.814660.65156
1.7−1.39623−1.61340−1.036160.52871
1.8−1.54728−1.90577−1.299090.37368
1.9−1.69889−2.22745−1.607700.18071
2.0−1.84818−2.57798−1.96620−0.05652
2.2−2.12481−3.35952−2.84858−0.69158
2.4−2.33901−4.22811−3.97323−1.59151
2.6−2.43695−5.14023−5.35541−2.82106
2.8−2.34558−6.02299−6.99007−4.44491
3.0−1.96928−6.76460−8.84029−6.51972
3.51.07408−6.78895−13.69240−13.82610
4.09.24368−0.35762−15.61050−23.14040

References

  1. Zou, Z.Y.; Lei, D.; Jiang, G.L.; Luo, B.; Chang, S.Z.; Hou, C.P. Experimental study of bridge foundation reinforced with front and back rows of anti-slide piles on gravel soil slope under El Centro waves. Appl. Sci. 2020, 10, 3108. [Google Scholar] [CrossRef]
  2. Zhang, J.W.; Wang, X.J.; Wang, H.; Qin, H.Y. Model test and numerical simulation of single pile response under combined loading in slope. Appl. Sci. 2020, 10, 6140. [Google Scholar] [CrossRef]
  3. Achmus, M.; Kuo, Y.S.; Abdel-Rahman, K. Behavior of monopile foundations under cyclic lateral load. Comput. Geotech. 2009, 36, 725–735. [Google Scholar] [CrossRef]
  4. He, B.; Wang, L.Z.; Hong, Y. Field testing of one-way and two-way cyclic lateral responses of single and jet-grouting reinforced piles in soft clay. Acta Geotech. 2017, 12, 1021–1034. [Google Scholar] [CrossRef]
  5. Cheng, X.L.; Wang, T.; Zhang, J.; Liu, Z.; Cheng, W. Finite element analysis of cyclic lateral responses for large diameter monopiles in clays under different loading patterns. Comput. Geotech. 2021, 134, 104104. [Google Scholar] [CrossRef]
  6. Peng, W.Z.; Zhao, M.H.; Xiao, Y.; Yang, C.W.; Zhao, H. Analysis of laterally loaded piles in sloping ground using a modified strain wedge model. Comput. Geotech. 2019, 107, 163–175. [Google Scholar] [CrossRef]
  7. Peng, W.Z.; Zhao, M.H.; Zhao, H.; Yang, C.W. A two-pile foundation model in sloping ground by finite beam element method. Comput. Geotech. 2020, 122, 103503. [Google Scholar] [CrossRef]
  8. Peng, W.Z.; Zhao, M.H.; Zhao, H.; Yang, C.W. Behaviors of a laterally loaded pile located in a mountainside. Int. J. Geomech. 2020, 20, 04020123. [Google Scholar] [CrossRef]
  9. Singh, A.; Prakash, S. Model pile group subjected to cyclic lateral load. Soils Found. 1971, 11, 51–60. [Google Scholar] [CrossRef]
  10. Hong, Y.; He, B.; Wang, L.; Wang, Z.; Ng, C.; Mašín, D. Cyclic lateral response and failure mechanisms of semi-rigid pile in soft clay: Centrifuge tests and numerical modelling. Can. Geotech. J. 2017, 54, 806–824. [Google Scholar] [CrossRef]
  11. Rosquoët, F.; Thorel, L.; Garnier, J.; Canepa, Y. Lateral cyclic loading of sand-installed piles. Soils Found. 2007, 47, 821–832. [Google Scholar] [CrossRef]
  12. Tuladhar, R.; Maki, T.; Mutsuyoshi, H. Cyclic behavior of laterally loaded concrete piles embedded into cohesive soil. Earthq. Eng. Struct. Dyn. 2008, 37, 43–59. [Google Scholar] [CrossRef]
  13. Gerolymos, N.; Escoffier, S.; Gazetas, G.; Garnier, J. Numerical modeling of centrifuge cyclic lateral pile load experiments. Earthq. Eng. Eng. Vib. 2009, 8, 61–76. [Google Scholar] [CrossRef]
  14. Zhang, C.; White, D.; Randolph, M. Centrifuge modeling of the cyclic lateral response of a rigid pile in soft clay. J. Geotech. Geoenviron. Eng. 2011, 137, 717–729. [Google Scholar] [CrossRef]
  15. Bourgeois, E.; Rakotonindriana, M.; Kouby, A.L.; Mestat, P.; Serratrice, J.F. Three-dimensional numerical modelling of the behaviour of a pile subjected to cyclic lateral loading. Comput. Geotech. 2010, 37, 999–1007. [Google Scholar] [CrossRef]
  16. Giannakos, S.; Gerolymos, N.; Gazetas, G. Cyclic lateral response of piles in dry sand: Finite element modeling and validation. Comput. Geotech. 2012, 44, 116–131. [Google Scholar] [CrossRef]
  17. Zhang, F.; Kimura, M.; Nakai, T.; Hoshikawa, T. Mechanical behavior of pile foundations subjected to cyclic lateral loading up to the ultimate state. Soils Found. 2000, 40, 1–17. [Google Scholar] [CrossRef]
  18. Hutchinson, T.C.; Chai, Y.H.; Boulanger, R.W. Simulation of full-scale cyclic lateral load tests on piles. J. Geotech. Geoenviron. Eng. 2005, 131, 1172–1175. [Google Scholar] [CrossRef]
  19. Dawson, T.H. Simplified analysis of offshore piles under cyclic lateral loads. Ocean. Eng. 1980, 7, 553–562. [Google Scholar] [CrossRef]
  20. Grashuis, A.J.; Dietermann, H.A.; Zorn, N.F. Calculation of cyclic response of laterally loaded piles. Comput. Geotech. 1990, 10, 287–305. [Google Scholar] [CrossRef]
  21. Zhang, C.; Yu, F.; Huang, M.; Zhu, Z. Calculation of monopile foundation in sand to long-term lateral cyclic load. Mar. Georesources Geotechnol. 2020, 39, 1071–1082. [Google Scholar] [CrossRef]
  22. EI Naggar, M.H.; Novak, M. Nonlinear analysis for dynamic lateral pile response. Soil Dyn. Earthq. Eng. 1996, 15, 233–244. [Google Scholar] [CrossRef]
  23. Rajashree, S.S.; Sundaravadivelu, R. Degradation model for one-way cyclic lateral load on piles in soft clay. Comput. Geotech. 1996, 19, 289–300. [Google Scholar] [CrossRef]
  24. Lin, S.S.; Liao, J.C. Permanent strains of piles in sand due to cyclic lateral loads. J. Geotech. Geoenviron. Eng. 1999, 125, 798–802. [Google Scholar] [CrossRef]
  25. Mezazigh, S.; Levacher, D. Laterally loaded piles in sand: Slope effect on p-y reaction curves. Can. Geotech. J. 1998, 35, 433–441. [Google Scholar] [CrossRef]
  26. Muthukkumaran, K. Effect of slope and loading direction on laterally loaded piles in cohesionless soil. Int. J. Geomech. 2014, 14, 1–7. [Google Scholar] [CrossRef]
  27. Nimityongskul, N.; Kawamata, Y.; Rayamajhi, D.; Ashford, S.A. Full-scale tests on effects of slope on lateral capacity of piles installed in cohesive soils. J. Geotech. Geoenviron. Eng. 2018, 144, 04017103. [Google Scholar] [CrossRef]
  28. Rathod, D.; Muthukkumaran, K.; Thallak, S.G. Experimental investigation on behavior of a laterally loaded single pile located on sloping ground. Int. J. Geomech. 2019, 19, 04019021. [Google Scholar] [CrossRef]
  29. Raja, N.; Muthukkumaran, K. Effect of rock-socketing on laterally loaded piles installed in the proximity of sloping ground. Int. J. Geomech. 2021, 21, 04020252. [Google Scholar] [CrossRef]
  30. Ng, C.W.W.; Zhang, L.M. Three-dimensional analysis of performance of laterally loaded sleeved piles in sloping ground. J. Geotech. Geoenviron. Eng. 2001, 127, 499–509. [Google Scholar] [CrossRef]
  31. Chae, K.S.; Ugai, K.; Wakai, A. Lateral resistance of short single piles and pile groups located near slopes. Int. J. Geomech. 2004, 4, 93–103. [Google Scholar] [CrossRef]
  32. Georgiadis, K.; Georgiadis, M. Undrained lateral pile response in sloping ground. J. Geotech. Geoenviron. Eng. 2010, 136, 1489–1500. [Google Scholar] [CrossRef]
  33. Georgiadis, K.; Georgiadis, M. Development of p-y curves for undrained response of piles near slopes. Comput. Geotech. 2012, 40, 53–61. [Google Scholar] [CrossRef]
  34. Gabr, M.A.; Borden, R.H. Lateral analysis of piers constructed on slopes. J. Geotech. Eng. 1990, 116, 1831–1850. [Google Scholar] [CrossRef]
  35. Georgiadis, K.; Georgiadis, M.; Anagnostopoulos, C. Lateral bearing capacity of rigid piles near clay slopes. Soils Found. 2013, 53, 144–154. [Google Scholar] [CrossRef]
  36. Jiang, C.; Zhang, Z.C.; He, J.L. Nonlinear analysis of combined loaded rigids in cohesionless soil slope. Comput. Geotech. 2020, 117, 103225. [Google Scholar] [CrossRef]
  37. Liu, P.; Jiang, C.; Lin, M.; Chen, L.; He, J. Nonlinear analysis of laterally loaded rigid piles at the crest of clay slopes. Comput. Geotech. 2020, 126, 103715. [Google Scholar] [CrossRef]
  38. JTG 3363—2019; Specifications for Design of Foundation of Highway Bridges and Culverts. China Communications Press: Beijing, China, 2020. (In Chinese)
  39. Poulos, H.G.; Davis, E.H. Pile Foundation Analysis and Design; Wiley: New York, NY, USA, 1980. [Google Scholar]
  40. Rao, S.N.; Ramakrishna, V.G.S.T.; Rao, M.B. Influence of rigidity on laterally loaded pile groups in marine clay. J. Geotech. Geoenviron. Eng. 1998, 124, 542–549. [Google Scholar] [CrossRef]
  41. Chandrasekaran, S.S.; Boominathan, A.; Dodagoudar, G.R. Group interaction effects on laterally loaded piles in clay. J. Geotech. Geoenviron. Eng. 2010, 136, 573–582. [Google Scholar] [CrossRef]
  42. Muthukkumaran, K.; Sundaravadivelu, R.; Gandhi, S.R. Effect of slope on p-y curves due to surcharge load. Soils Found. 2008, 48, 353–361. [Google Scholar] [CrossRef]
Figure 1. Experimental setup. (a) model pile and slope; (b) geometric dimension.
Applsci 12 08169 g001
Figure 2. Installations of strain gauges and earth pressure cells.
Applsci 12 08169 g002
Figure 3. Gradation curve of unsaturated river sand.
Applsci 12 08169 g003
Figure 4. One-way cyclic lateral loading path.
Applsci 12 08169 g004
Figure 5. Comparisons between subgrade reaction profiles indirectly inferred from bending moment profiles and those directly measured by earth pressure cells. (a) Q0 = 20 N; (b) Q0 = 30 N; (c) Q0 = 40 N.
Applsci 12 08169 g005
Figure 6. Developments of pile responses with lateral load in lateral static loading tests. (a) Q0 versus y0; (b) M0 versus Q0.
Applsci 12 08169 g006
Figure 7. Comparisons of lateral load versus pile head deflection curves in lateral static loading tests.
Applsci 12 08169 g007
Figure 8. Comparisons of dimensionless bending moment profiles in lateral static loading tests. (a) in sloping ground; (b) in sloping ground.
Applsci 12 08169 g008
Figure 9. Predicted dimensionless deflections in lateral static loading tests. (a) in level ground; (b) in sloping ground.
Applsci 12 08169 g009
Figure 10. Measured dimensionless subgrade reaction profiles in lateral static loading tests. (a) in level ground; (b) in sloping ground.
Applsci 12 08169 g010
Figure 11. Comparisons of subgrade reaction modulus.
Applsci 12 08169 g011
Figure 12. Developments of dimensionless pile head deflection with cycle number in cyclic lateral loading tests.
Applsci 12 08169 g012
Figure 13. Dimensionless bending moment and subgrade reaction profiles under different cycle numbers. (a) bending moment profiles; (b) subgrade reaction profiles.
Applsci 12 08169 g013
Figure 14. Dimensionless bending moment and subgrade reaction profiles under different slope angles and load amplitudes. (a) bending moment profiles; (b) subgrade reaction profiles.
Applsci 12 08169 g014
Figure 15. Predicted dimensionless pile deflection and bending moment profiles under different cycle numbers in test C2. (a) pile deflection profile; (b) bending moment profile.
Applsci 12 08169 g015
Figure 16. Comparisons of cyclic lateral responses predicted by FBEM and those measured by experiments in test C2. (a) pile head deflection versus cycle number; (b) bending moment profile.
Applsci 12 08169 g016
Table 1. Physicomechanical parameters of prototype and model tests.
ParametersPrototypeModelSimilarity
Constant
Calculative width of piles (m) [38]2.700.065741.10
Pile embedded length (m)25.001.0025.00
Flexural rigidity (kN·m2)2.43 × 1074.31 × 10−25.56 × 10⁸
Proportional coefficient of subgrade reaction coefficient (MN/m4) [38]35.4226.241.35
Table 2. Test program.
ClassificationTestLoading RegimeLoad Amplitude/NSlope Angle/°
One-way cyclic lateral loading testsC1Trapezoidal wave loading (cycle number n = 2500)3030
C23045
C33060
C42045
C54045
Lateral static loading testsS1Slow maintenance loading0
S245
Publisher’s Note: MDPI stays neutral with regard to jurisdictional claims in published maps and institutional affiliations.

