Article

A Novel Approach to Edge Detection for a Gravity Anomaly Based on Fractal Surface Variance Statistics of Fractal Geometry

1
College of Geo-Exploration Science and Technology, Jilin University, Changchun 130000, China
2
Ningxia Geophysical and Geochemical Exploration Institute, Yinchuan 750001, China
3
Chinese Academy of Geological Sciences, Beijing 100037, China
4
Ningxia Center for Research on Earthquake Protection and Disaster Mitigation in Civil Engineering, Yinchuan 750001, China
*
Author to whom correspondence should be addressed.
Appl. Sci. 2022, 12(16), 8172; https://doi.org/10.3390/app12168172
Submission received: 8 July 2022 / Revised: 9 August 2022 / Accepted: 10 August 2022 / Published: 16 August 2022

Abstract

:
Fractal geometry has developed rapidly, and is widely used in various disciplines. However, only a few fractal dimension methods and techniques have been applied to the processing of gravity data, especially in the detection of geological edges and interfaces. In this paper, the definition, properties and characteristics of fractal dimensions are used to improve the edge detection of gravity anomalies, and a theoretical gravity model is established. At the same time, a new method of fractal surface variance statistics is applied and compared with traditional methods. The fractal gravity anomaly processing methods in different directions are analyzed, and the results show that the maximum value of the fractal surface variance statistical method on a fixed window can be used to delineate the geological edge of the ore body. When the method in this paper is applied to the Luobusha chromite deposit in Tibet, China, the fractal dimension corresponds well with the structural development zones of various faults, and it is also helpful to delineate the boundary of the chromite deposit and identify the interface with an obvious difference in gravity anomaly density.

1. Introduction

Fractal geometry was first put forward to describe the self-similarity of natural phenomena by Mandelbrot in the 1960s, and gradually became an important approach to the quantitative characterize spatial distribution and anomalies in geoscience over the past several decades [1,2,3,4,5,6,7]. Various calculated approaches for fractal dimensions—including the Hausdorff dimension [8], the box-counting dimension [9], the information dimension [10], and the correlation dimension [11], etc.—have been proposed and applied to describe the self-similarity [12] and self-affinity [13] of fractals for irregular shapes or complex objects in geology [14]. Multi-fractal theory, including spectrum-area (S-A) models and singularity analysis, is used to detect the true anomalies caused by mineralization [15,16] in geochemical [17,18,19,20], geophysical exploration [21,22] and signal detectors in seismology [23].
Various studies of fractals for the calculation of magnetism and gravity have been proposed; for example, the fractal dimension of the fractional Brownian surface model was used to describe the statistical self-similarity in topographic surfaces [24]. Bouguer and free air gravity anomalies were analyzed under fractal geometry and fractal dimension analysis for the optimal design of a 2-D gravity survey network, which was conducted to obtain an optimum scale for gridding intervals for the generation of bouguer anomaly maps [25]. The matched filtering method from a fractal model was performed to identify volcanic magnetic anomalies from an oilfield [26]. The fractal-based wavelet filtering technique was developed to separate satellite gravity anomalies from the background in the Nanling district of China [27].
The edge detection method from the gravity anomalies showed an important role in the delineation of multi-scale concealed faults or different lithological contacts, and various methods from fractal geometry were used. However, few methods of fractal dimensions were applied to detect the edge of potential gravity anomalies, and many techniques—including kinds of horizontal and vertical derivatives [28], total horizontal derivatives [29], gravity gradient tensor eigenvalues [15], tilt angles and Theta maps [30]—were widely used to locate anomalous source boundaries in tectonic identification and division.
This study attempts to use the surface variance statistics of the fractal dimension to delineate the boundaries of geological bodies and structures. The gravity anomaly of a theoretical density model is established, and a comparison with the conventional methods is made. The method was applied to the Robusha chromite deposit [31], and the results of the maximum, minimum, average and four directions of the fractal dimension of the gravity data in this area were obtained. Combined with magnetic anomalies and geological conditions, the boundaries of chromite deposits are delineated.

2. Method

2.1. Mathematical Method

2.1.1. Fractal Surface Variance Statistics Method

The calculation method of the fractal dimension was first proposed for topographic surfaces [24]. In this study, the method is improved, modified and introduced in the field of gravity. The gravity anomaly (abbreviated to Δg) of the study area is treated as the self-similar topographic surface. This property is inherited from the fractal nature of geology itself. Therefore, the gravity anomaly Δg(i, j) is defined as a function with distance, and its expected variance between the point (i, j) and the other point (p, q) is presented by Equation (1):
E   { [ Δ g ( i , j ) Δ g ( p , q ) ] 2 } = k r 2 H ,
where r is the horizontal distance between points ( i , j ) and ( p , q ) , and H equals 3-D. D is the fractal dimension, and k is the constant related with the square deviation. This is a power law model for the variogram in two dimensions. The natural logarithm is taken on both sides of Equation (1), then
ln   E { [ Δ g ( i , j ) Δ g ( p , q ) ] 2 } = ln k + 2 H ln r
Equation (2) is further simplified to
ln   E { [ Δ g ( i , j ) Δ g ( p , q ) ] 2 } = ln k + ( 3 D ) ln { [ Δ x ( i p ) ] 2 [ Δ y ( j q ) ] 2 } ,
where Δ x and Δ y are the grid interval of the x-axis and y-axis, respectively. Based on Equation (2) and the log-log coordinate, there is a linear region in the unscaled range when fractal analysis is performed. This property illustrates that the linear region for a gravity anomaly contains self-similarity and develops a 1-, 2- and 3-dimensional predictive model of correlated random data. Therefore, the gradient b of the linear region could be obtained by the calculation of the fractal dimension, such that we have
D = 3 b / 2   and   2   <   D <   3 ,
The gradient of the fractal surface variance statistics filter is a vector quantity.

2.1.2. Conventional Method of the Directional Gradient Filter and the Second Order Derivate Filters of Laplacian 1 and 2

The gradient of function Δ g ( x , y ) is the vector, and its module is defined as
G [ Δ g ( x , y ) ] = ( Δ g y ) 2 + ( Δ g x ) 2 ,
where G [ Δ g ( x , y ) ] is the module of the gradient, and it is called the gradient in this study.
The sliding window of the 3 × 3 matrix is characterized with directions, which include east, southeast, south and southwest (Figure 1). They are the first-order derivatives. xx and yy second-order derivatives of Laplacian 1 and 2 are introduced to discern the whole boundaries of the gravity model and to make the comparison. The eastwest gradient filter follows Equation (6) and Figure 1b:
G e a s t [ Δ g ( x , y ) ]   =   | Δ g ( i 1 , j 1 ) + Δ g ( i 1 , j ) + Δ g ( i 1 , j + 1 ) Δ g ( i , j 1 ) 2 Δ g ( i , j ) + Δ g ( i , j + 1 ) + Δ g ( i + 1 , j 1 ) + Δ g ( i + 1 , j ) Δ g ( i + 1 , j + 1 ) |
The southeast gradient filter follows Equation (7) and Figure 1c:
G s o u t h e a s t [ Δ g ( x , y ) ]   =   | Δ g ( i 1 , j 1 ) Δ g ( i 1 , j ) Δ g ( i 1 , j + 1 ) Δ g ( i , j 1 ) 2 Δ g ( i , j ) + Δ g ( i , j + 1 ) + Δ g ( i + 1 , j 1 ) + Δ g ( i + 1 , j ) + Δ g ( i + 1 , j + 1 ) |
The southnorth gradient filter follows Equation (8) and Figure 1d:
G s o u t h [ Δ g ( x , y ) ] = | Δ g ( i 1 , j 1 ) Δ g ( i 1 , j ) Δ g ( i 1 , j + 1 ) + Δ g ( i , j 1 ) 2 Δ g ( i , j ) + Δ g ( i , j + 1 ) + Δ g ( i + 1 , j 1 ) + Δ g ( i + 1 , j ) + Δ g ( i + 1 , j + 1 ) |
The southwest gradient filter follows Equation (9) and Figure 1e:
G s o u t h w e s t [ Δ g ( x , y ) ]   =   | Δ g ( i 1 , j 1 ) Δ g ( i 1 , j ) Δ g ( i 1 , j + 1 ) Δ g ( i , j 1 ) 2 Δ g ( i , j ) Δ g ( i , j + 1 ) + Δ g ( i + 1 , j 1 ) + Δ g ( i + 1 , j ) + Δ g ( i + 1 , j + 1 ) |
The second-order derivate filter of Laplacian 1 follows Equation (10) and Figure 1f:
G Laplacian 1 [ Δ g ( x , y ) ]   =   | Δ g ( i 1 , j ) Δ g ( i , j 1 ) + 4 Δ g ( i , j ) + Δ g ( i , j + 1 ) + Δ g ( i + 1 , j ) | ,
The second-order derivate filter of Laplacian 2 follows Equation (11) and Figure 1g:
G Laplacian   2 [ Δ g ( x , y ) ] = | Δ g ( i 1 , j 1 ) Δ g ( i 1 , j ) Δ g ( i 1 , j + 1 ) Δ g ( i , j 1 ) + 8 Δ g ( i , j ) Δ g ( i , j + 1 ) Δ g ( i + 1 , j 1 ) Δ g ( i + 1 , j ) Δ g ( i + 1 , j + 1 ) |

2.2. Calculation Steps of the Fractal Dimension

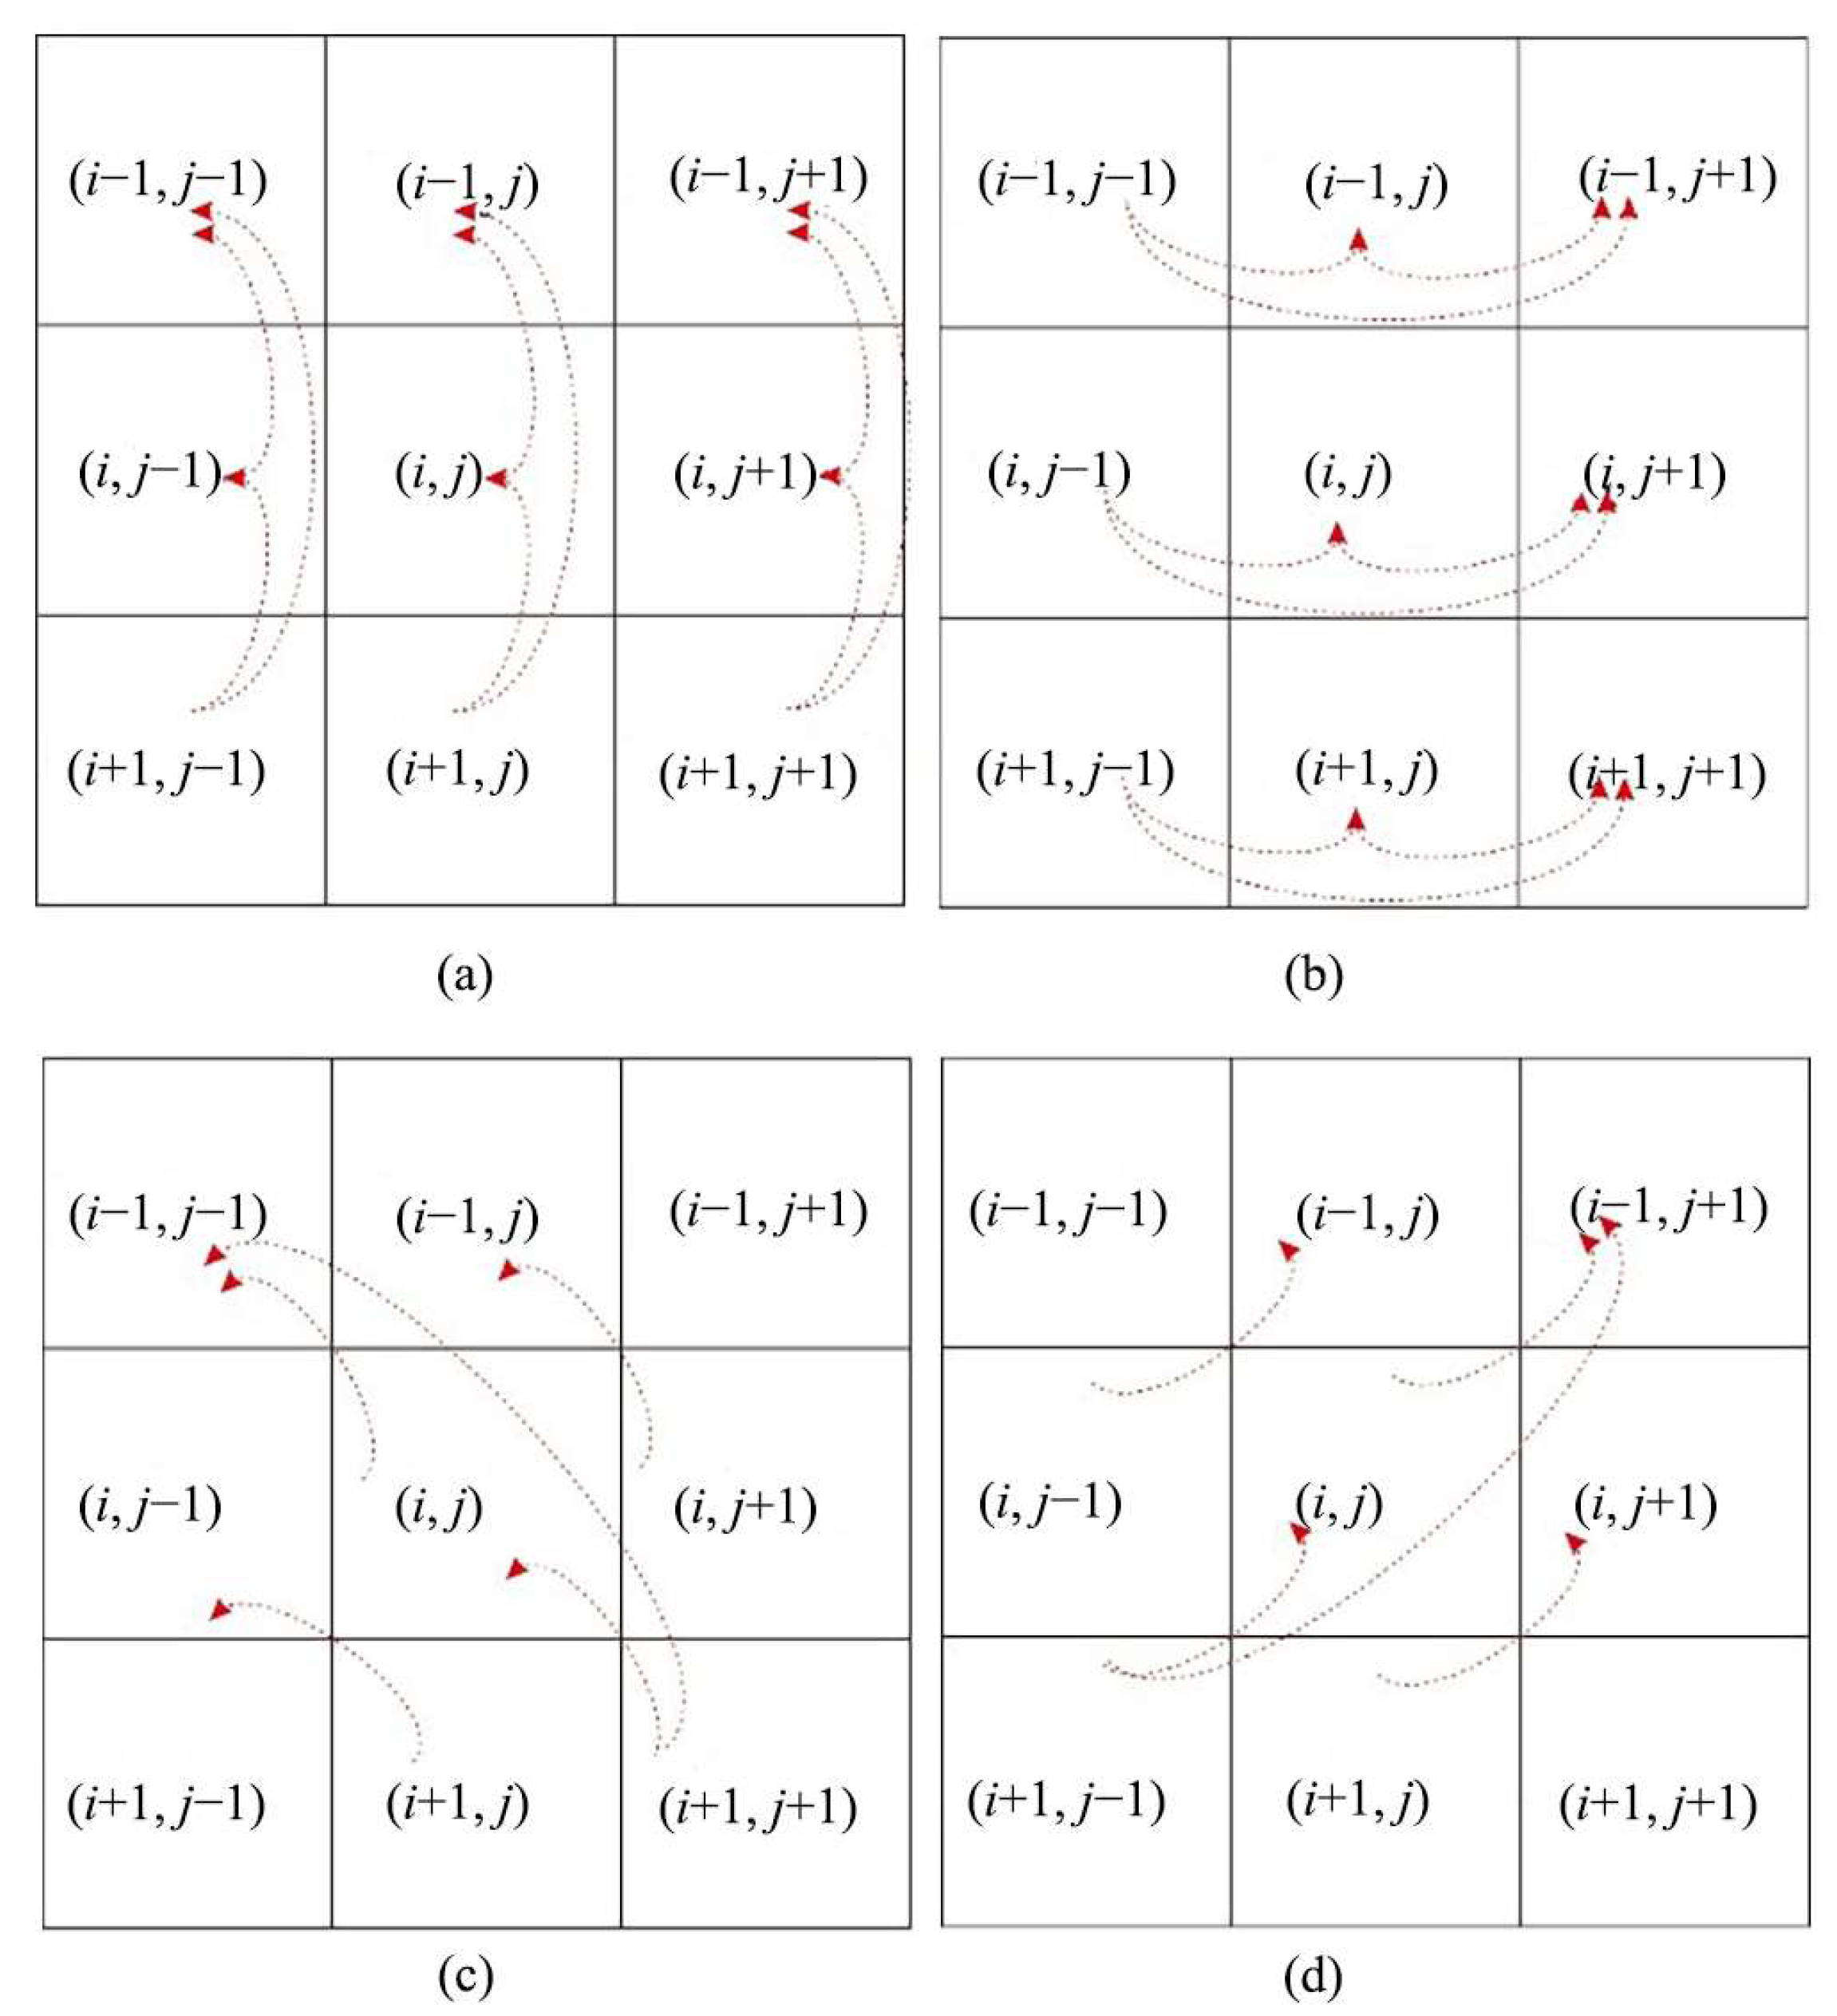
The original gravity anomaly data are discretized and meshed into matrix grids with the size of 100 × 50 by the method of Kriging before processing. The regional variable, variogram and semivariance are analyzed by the Kriging interpolation algorithm, which is the best and most unbiased estimation after the comparison with Nearest Neighbors and Inverse Distance to a Power methods. As such, the contour map of the gravity anomaly and the surface location of the geological body are shown in Figure 2. The vertical profile of a geological body is also presented. Based on the above assumption, the anomaly value Δg(i, j) is the functional value at the point (i, j) created from the difference of density in three-dimensional space. In order to calculate the values of the grids, a sliding window with fixed size of 3 × 3 is created, as seen in Figure 1a and Figure 2. Then, the method of surface variance statistics for the processing of those data in the window is applied to obtain the fractal dimensions from the south–north direction, the east–west direction, the southeast–northwest direction, and the northeast–southwest direction, respectively. Two of the adjacent points and the first and third points in the same direction will be calculated in order to acquire their variances and distances, which are all projected into the log-log coordinate system. After the curve fitting operation, assign the target to point (i, j) as the slope of this fitted line. The final fractal dimension D is achieved by Equation (4). In order to eliminate the directional influence of the calculation, the average, maximum and minimum are captured as the target value of the point (i, j). Then, the sliding window will be moved in proper sequence to make sure that all of the matrix grids participate in the calculation. An equal row or column is added when the sliding window locates the boundary of the matrix grid, that is to say, the size of matrix is changed to 102 × 52. All of the calculated fractal dimensions are formulated into a matrix, and are shown in the contour maps.

2.3. Model Test

2.3.1. Analysis of the Theoretical Model

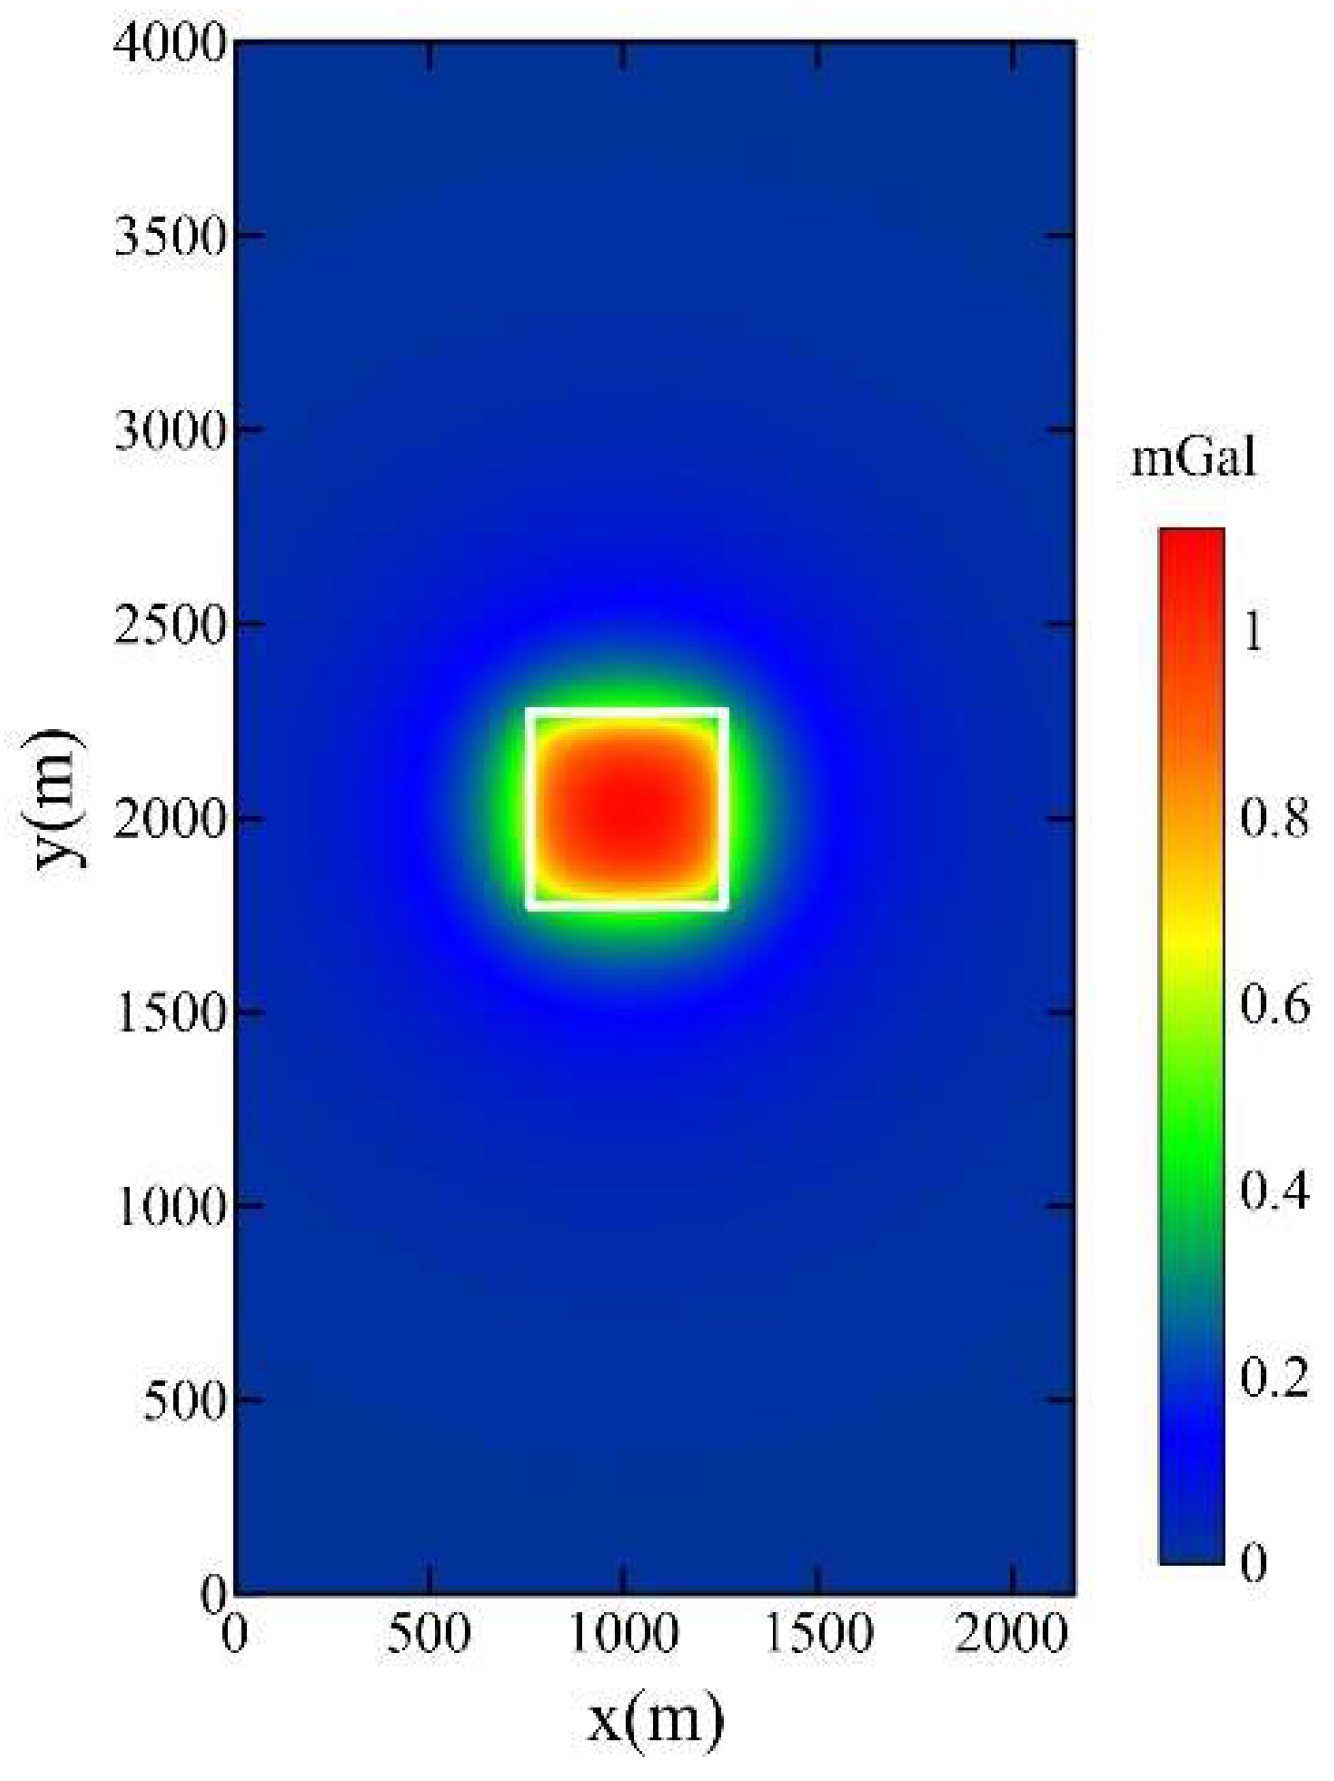
A theoretical model is established to demonstrate the effect of the method proposed in this paper. The size of a single cubic geological volume model is 500 m × 500 m × 500 m, and the top surface of the model is located on the surface. The density of the geological body is set at 2.80 g/cm3, and the density of the surrounding rock is 2.67 g/cm3. Figure 3 shows the gravity anomaly contour map of the model, where the white line indicates the location of the model.
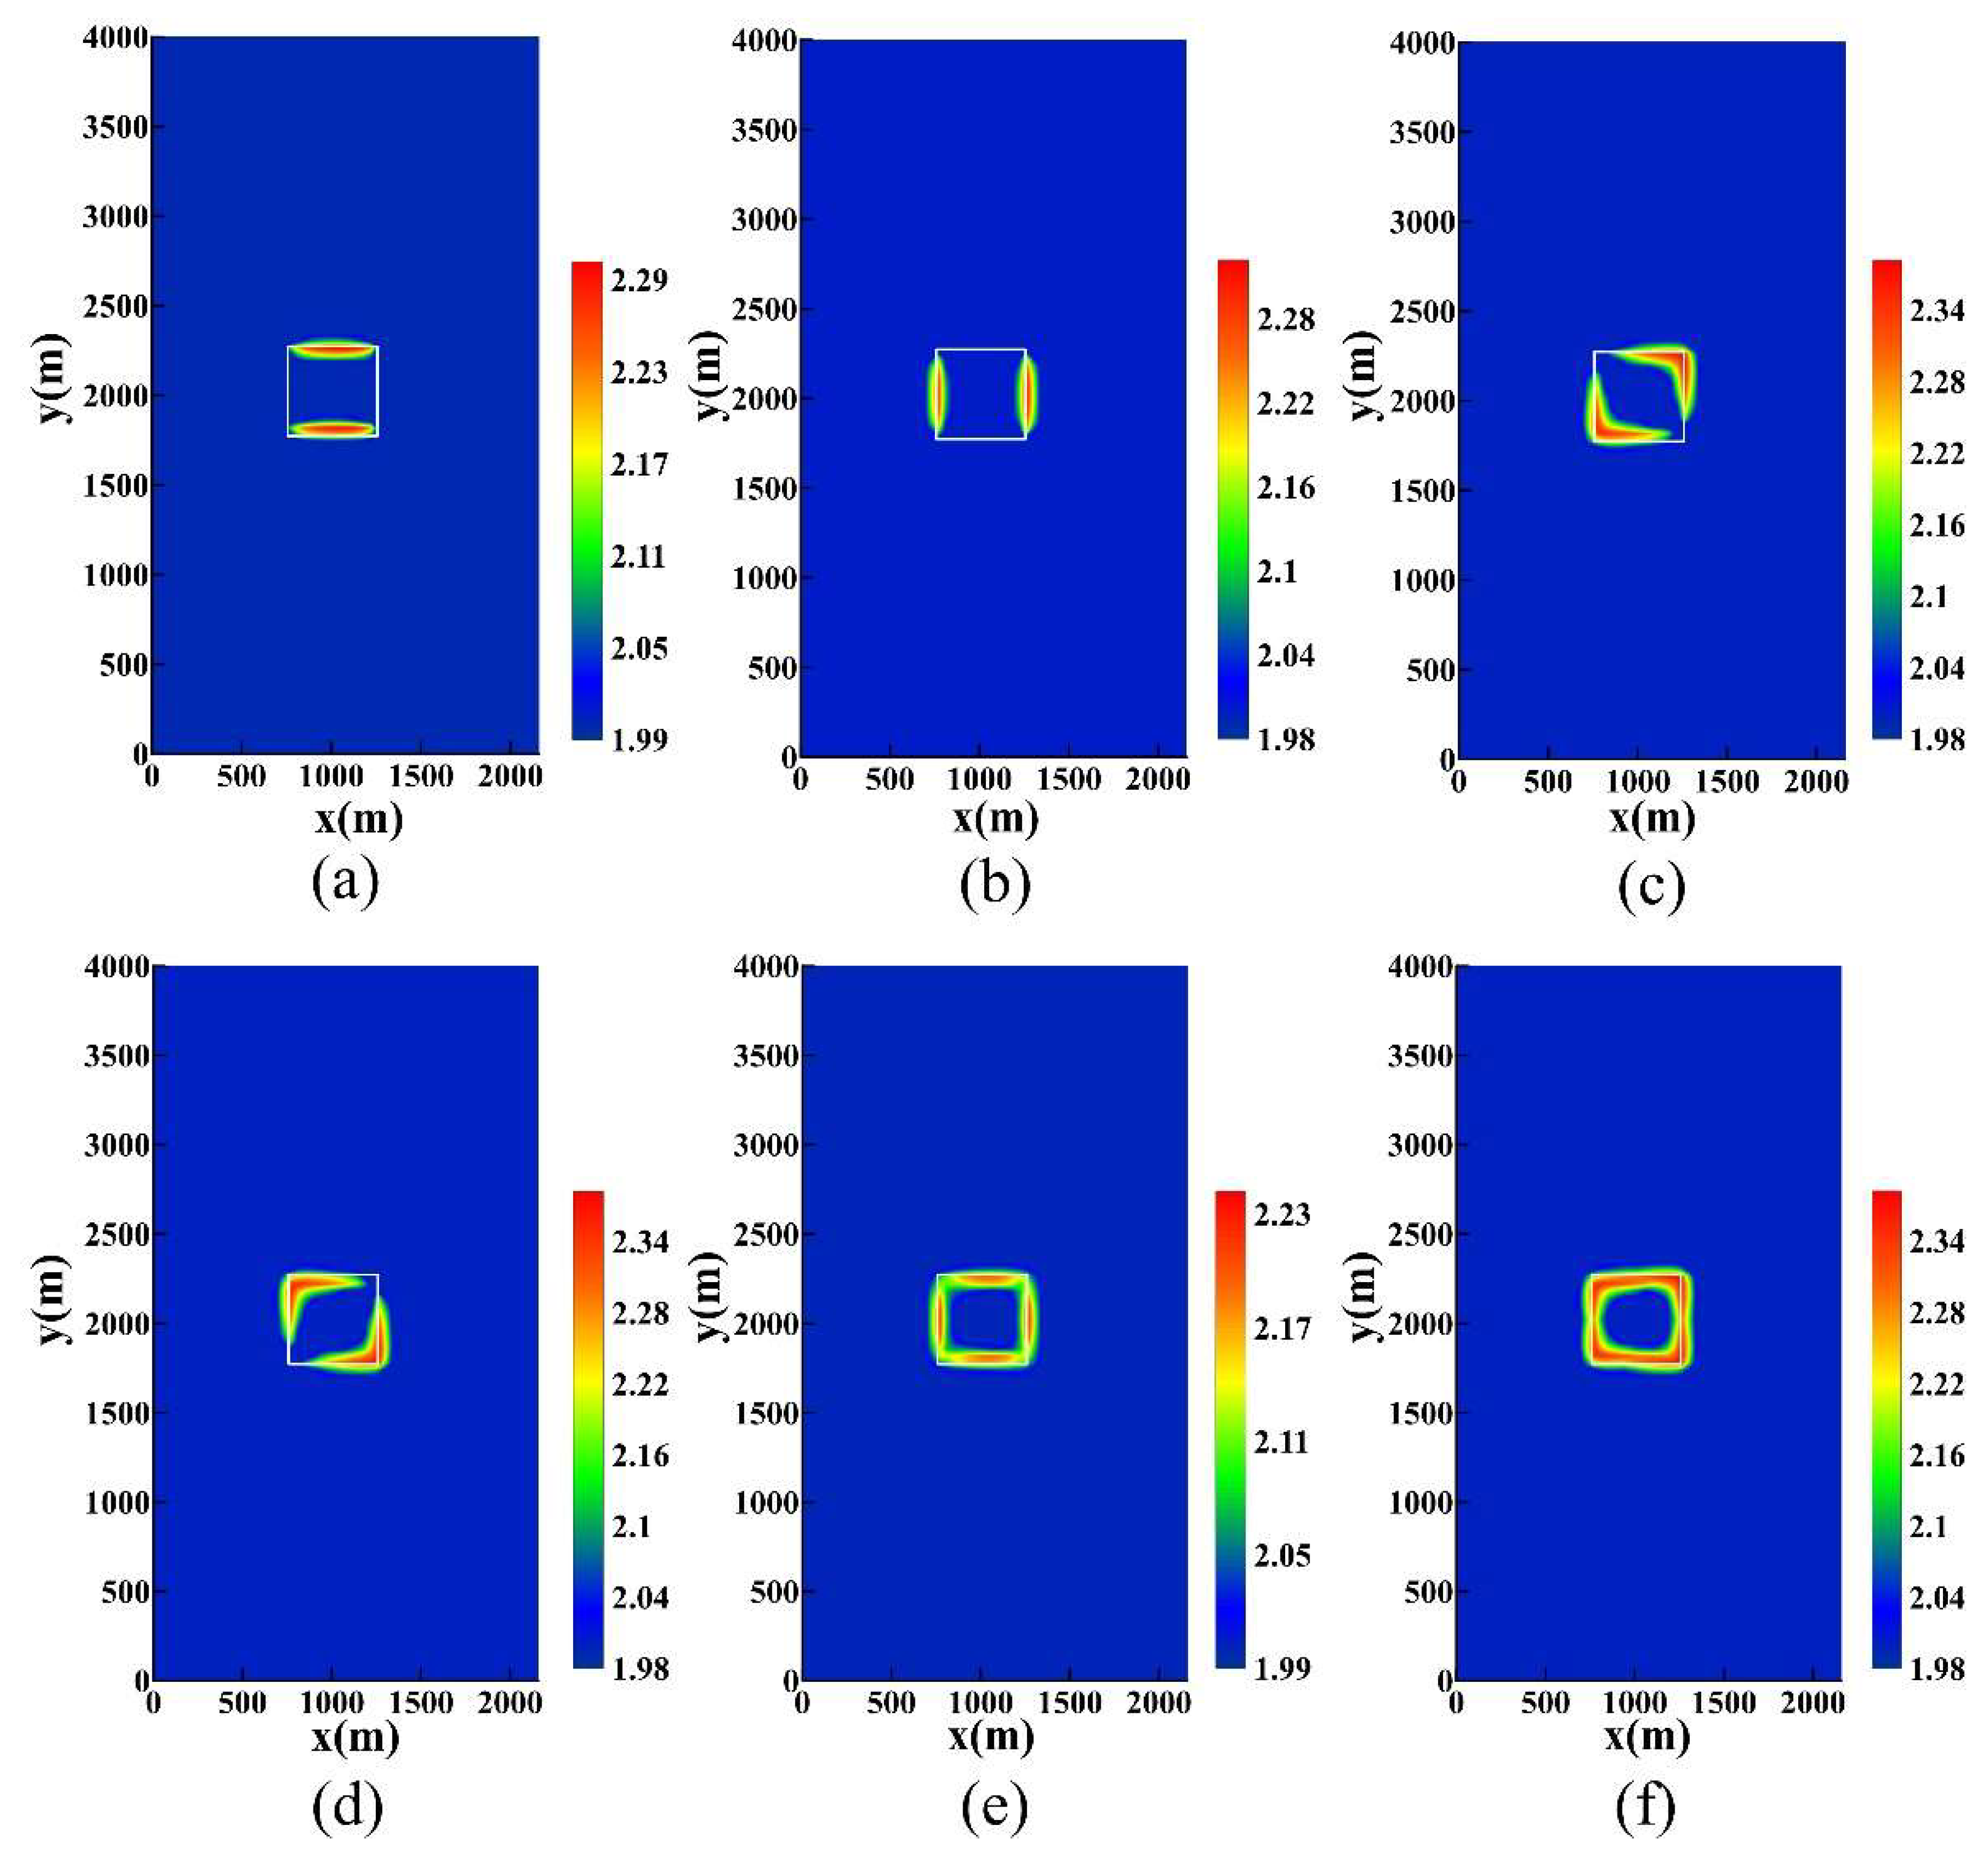
Using the method proposed in this paper to perform edge detection on the model data, the results are shown in Figure 4. According to the analysis of fractal dimensions from different calculated directions, it can be seen that the geological boundaries are able to be detected with high values over 2.0, such as the south and north geological boundaries from the S-N direction (Figure 4a) and the west and east boundaries from W-E direction (Figure 4b). These signal detectors discriminate between a random “noise” and a “signal”. To a certain extent, the vertical (S-N direction) and horizontal (W-E direction) calculations are sensitive to these geological boundaries in the same directions but with vertical trends. This demonstrates the effectiveness of the method in delineating vertical boundaries. In order to identify the inclined edges of complex and flexible geological deposits and faults, fractal dimensions from the WN-SE and NE-SW directions (Figure 4c,d) are adopted; it can be shown that all of the edges can be confirmed, and are clearer than those of the S-N and W-E directions. However, these signal detectors are not sensitive to the edge corners in the parallel or similar directions, which are repressed severely. The edges of a geological body are easily separated into two parts. The useful signal is misjudged as noise.
To strengthen the signal and suppress the noise, the maximum, average and minimum of the fractal dimension are introduced and compared in order to weaken their directional disadvantages and eliminate the spurious numerical oscillation. Due to the minimum value being less than 2.0, the fractal dimension of its geological edges is not able to be detected and will be not mentioned in this study. The maximum fractal dimension (Figure 4e) is the more optimal one to show the gravity anomaly of geologic edges than the interior of the geological body. As such, the fractal dimension indicator “lightsup” is situated at the largest gradients in the map. The average fractal dimension (Figure 4f) is weak in the determination to the corner of edges, but is more regular than the maximum. What these two have in common is that the homogeneous object makes both of them sensitive to the geologic edges and fail to recognize the interior; therefore, it may be different in the heterogeneous density bodies, and the zone of high values may indicate the occurrence location of the deposit.
The edge detector usually is considered as a 2D signal detector, which is able to discriminate between a random noise and a signal. The fractal dimension needs to reflect the change of the correlation in this theoretical model data, and to discern the signal. For the different signal characteristics of various anomalies, comprehensive analysis is taken into consideration.

2.3.2. Comparison with the Conventional Methods of Edge Detection

In order to verify the validity and accuracy of edge detection, the conventional methods of edge detection are introduced, including four directional filters of the gradient (Figure 5a–d) and the second-order derivate filters of Laplacian 1 (Figure 5e) and Laplacian 2 (Figure 5f). According to the comparison between Figure 4a–d and Figure 5a–d, it can be expounded that the fractal surface variance statistics method possesses the same directional sensitivity to the geological edges as four directional filters of gradient, but the difference is that the fractal dimensions of the edges are the positive values, and these ones of the edges from gradient directional filters are both positive and negative, with a symmetric distribution of the calculated direction. The results show that the directional fractal surface variance statistics method is to some extent superior to the gradient directional method. The maximum and average (Figure 4e,f) fractal dimensions are the synthesis method with the optimization of the directional influence; the analysis with the second-order derivate filters of Laplacian (Figure 5e,f) reveals that the edges are able to be detected, but the difference is that fractal dimensions of edges superbly correspond to the geological boundaries; the later one is located in the gradient zone, and is hard to confirm in complicated and changeable conditions. Based on the comparison with the conventional methods of the gradient and the second-order derivate filters, we consider that the fractal surface variance statistics method has a certain superiority, and the results show that it can be used in the geological boundary division and detection, and can be used more clearly to detect the edge.

3. Results and Discussion

3.1. Geological Conditions of the Study Area

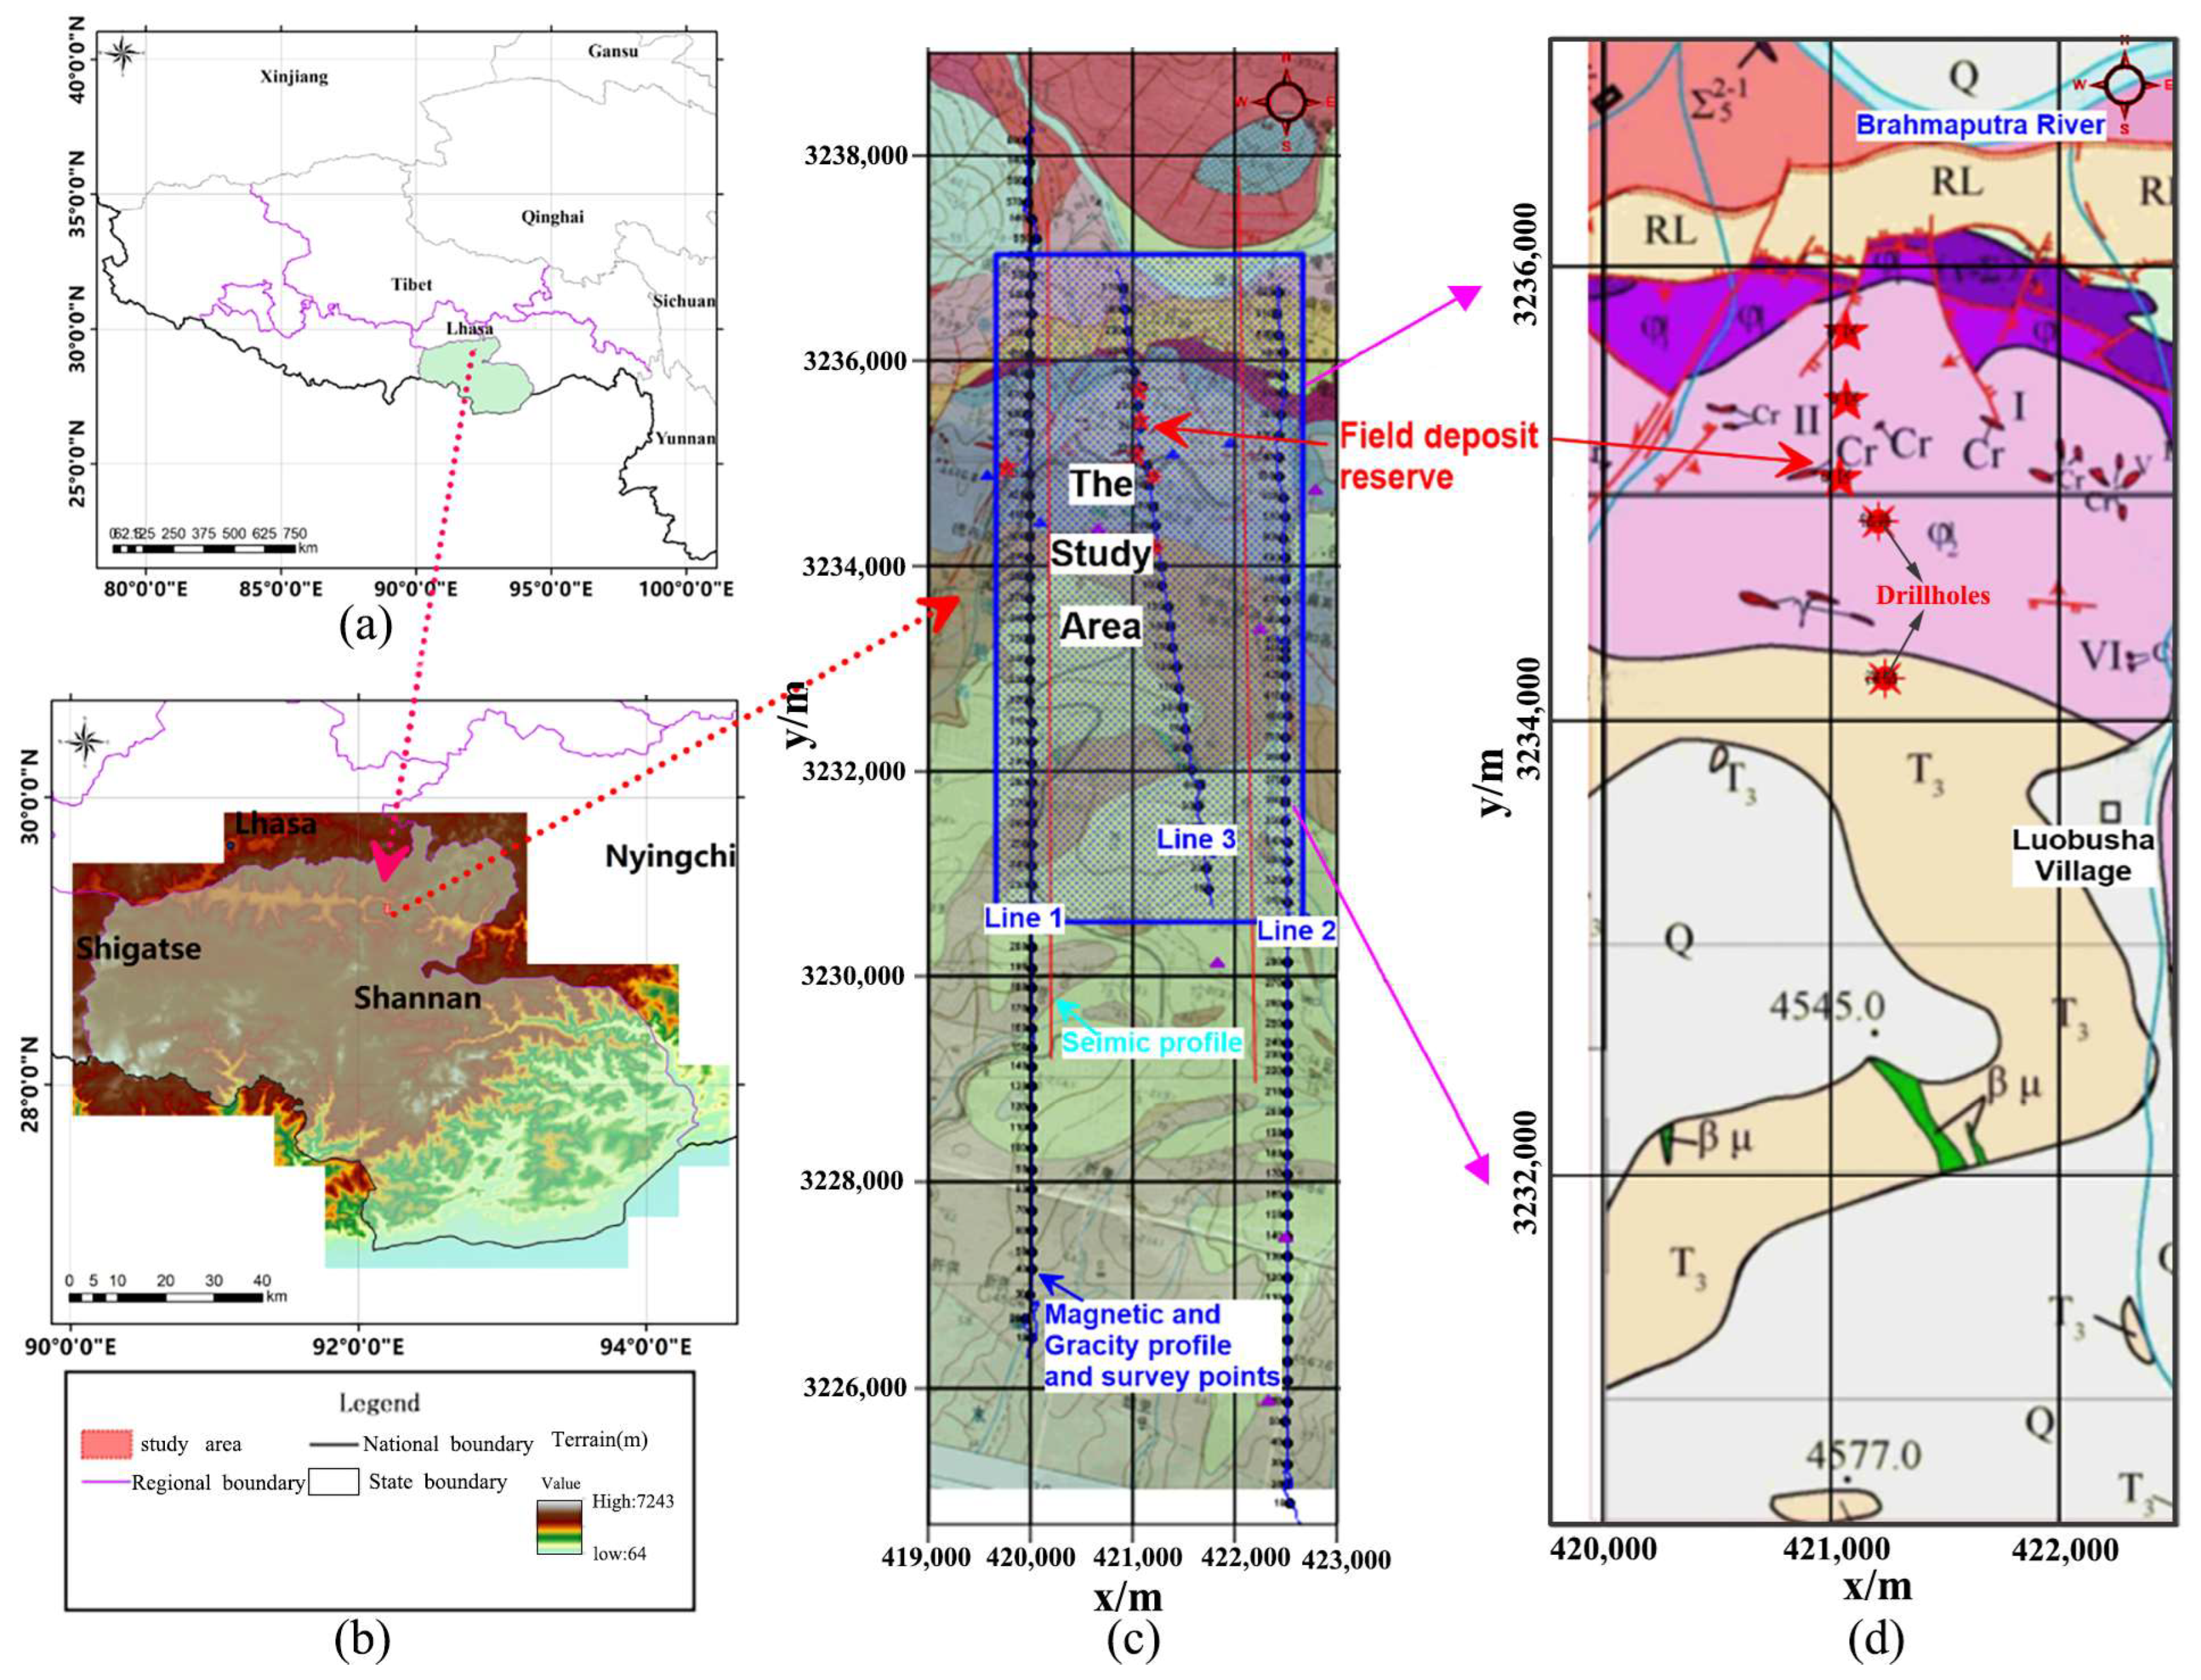
The study area is funded by the “Continental Scientific Drilling: Site Selection and Pilot Holes Research Project”, and the target geological ore body is situated in the Luobusha chromite deposit. The Luobusha chromite mine [32] is seated in the town of Qusong, Tibet, China, as seen in Figure 6, and is currently one of the largest deposits of chromite in China, with accumulated reserves of over 5 million tons. The deposit is located in Luobusha ultramafic pluton from the ultrabasic rock belts of the Indus-Yarlung Zangbo suture [33,34], north of the Late-Triassic sequences (Figure 6). The main lithology is peridotity with podiform chromitites, euphotides and diabse dikes, middle-late Cretaceous sandstone, and phyllites [35]. Partial deposits were individualized with liquation and differentiation, and were not able to reach the industrial grade. The dominant deposit was derived from the Orthomagmatic stage.
Three level II chromite belts are distributed in the Luobusha chromite mine of the study area. Deposits I and II occur in the development of faults; they are nearly in parallel with the lithological contact interface between harzburgite ( ϕ 2 1 ) and dunite ( ϕ 1 1 ) facies belts, and belong to the lower ore type. As shown in Figure 6, deposit IV is located to the south of deposit I, and is classified as the upper-ore type. The maximum and minimum elevation of the study area is 4626 m and 3575 m, respectively, with a drop height of up to 1051 m.

3.2. Magnetic and Gravity Anomalies of the Study Area

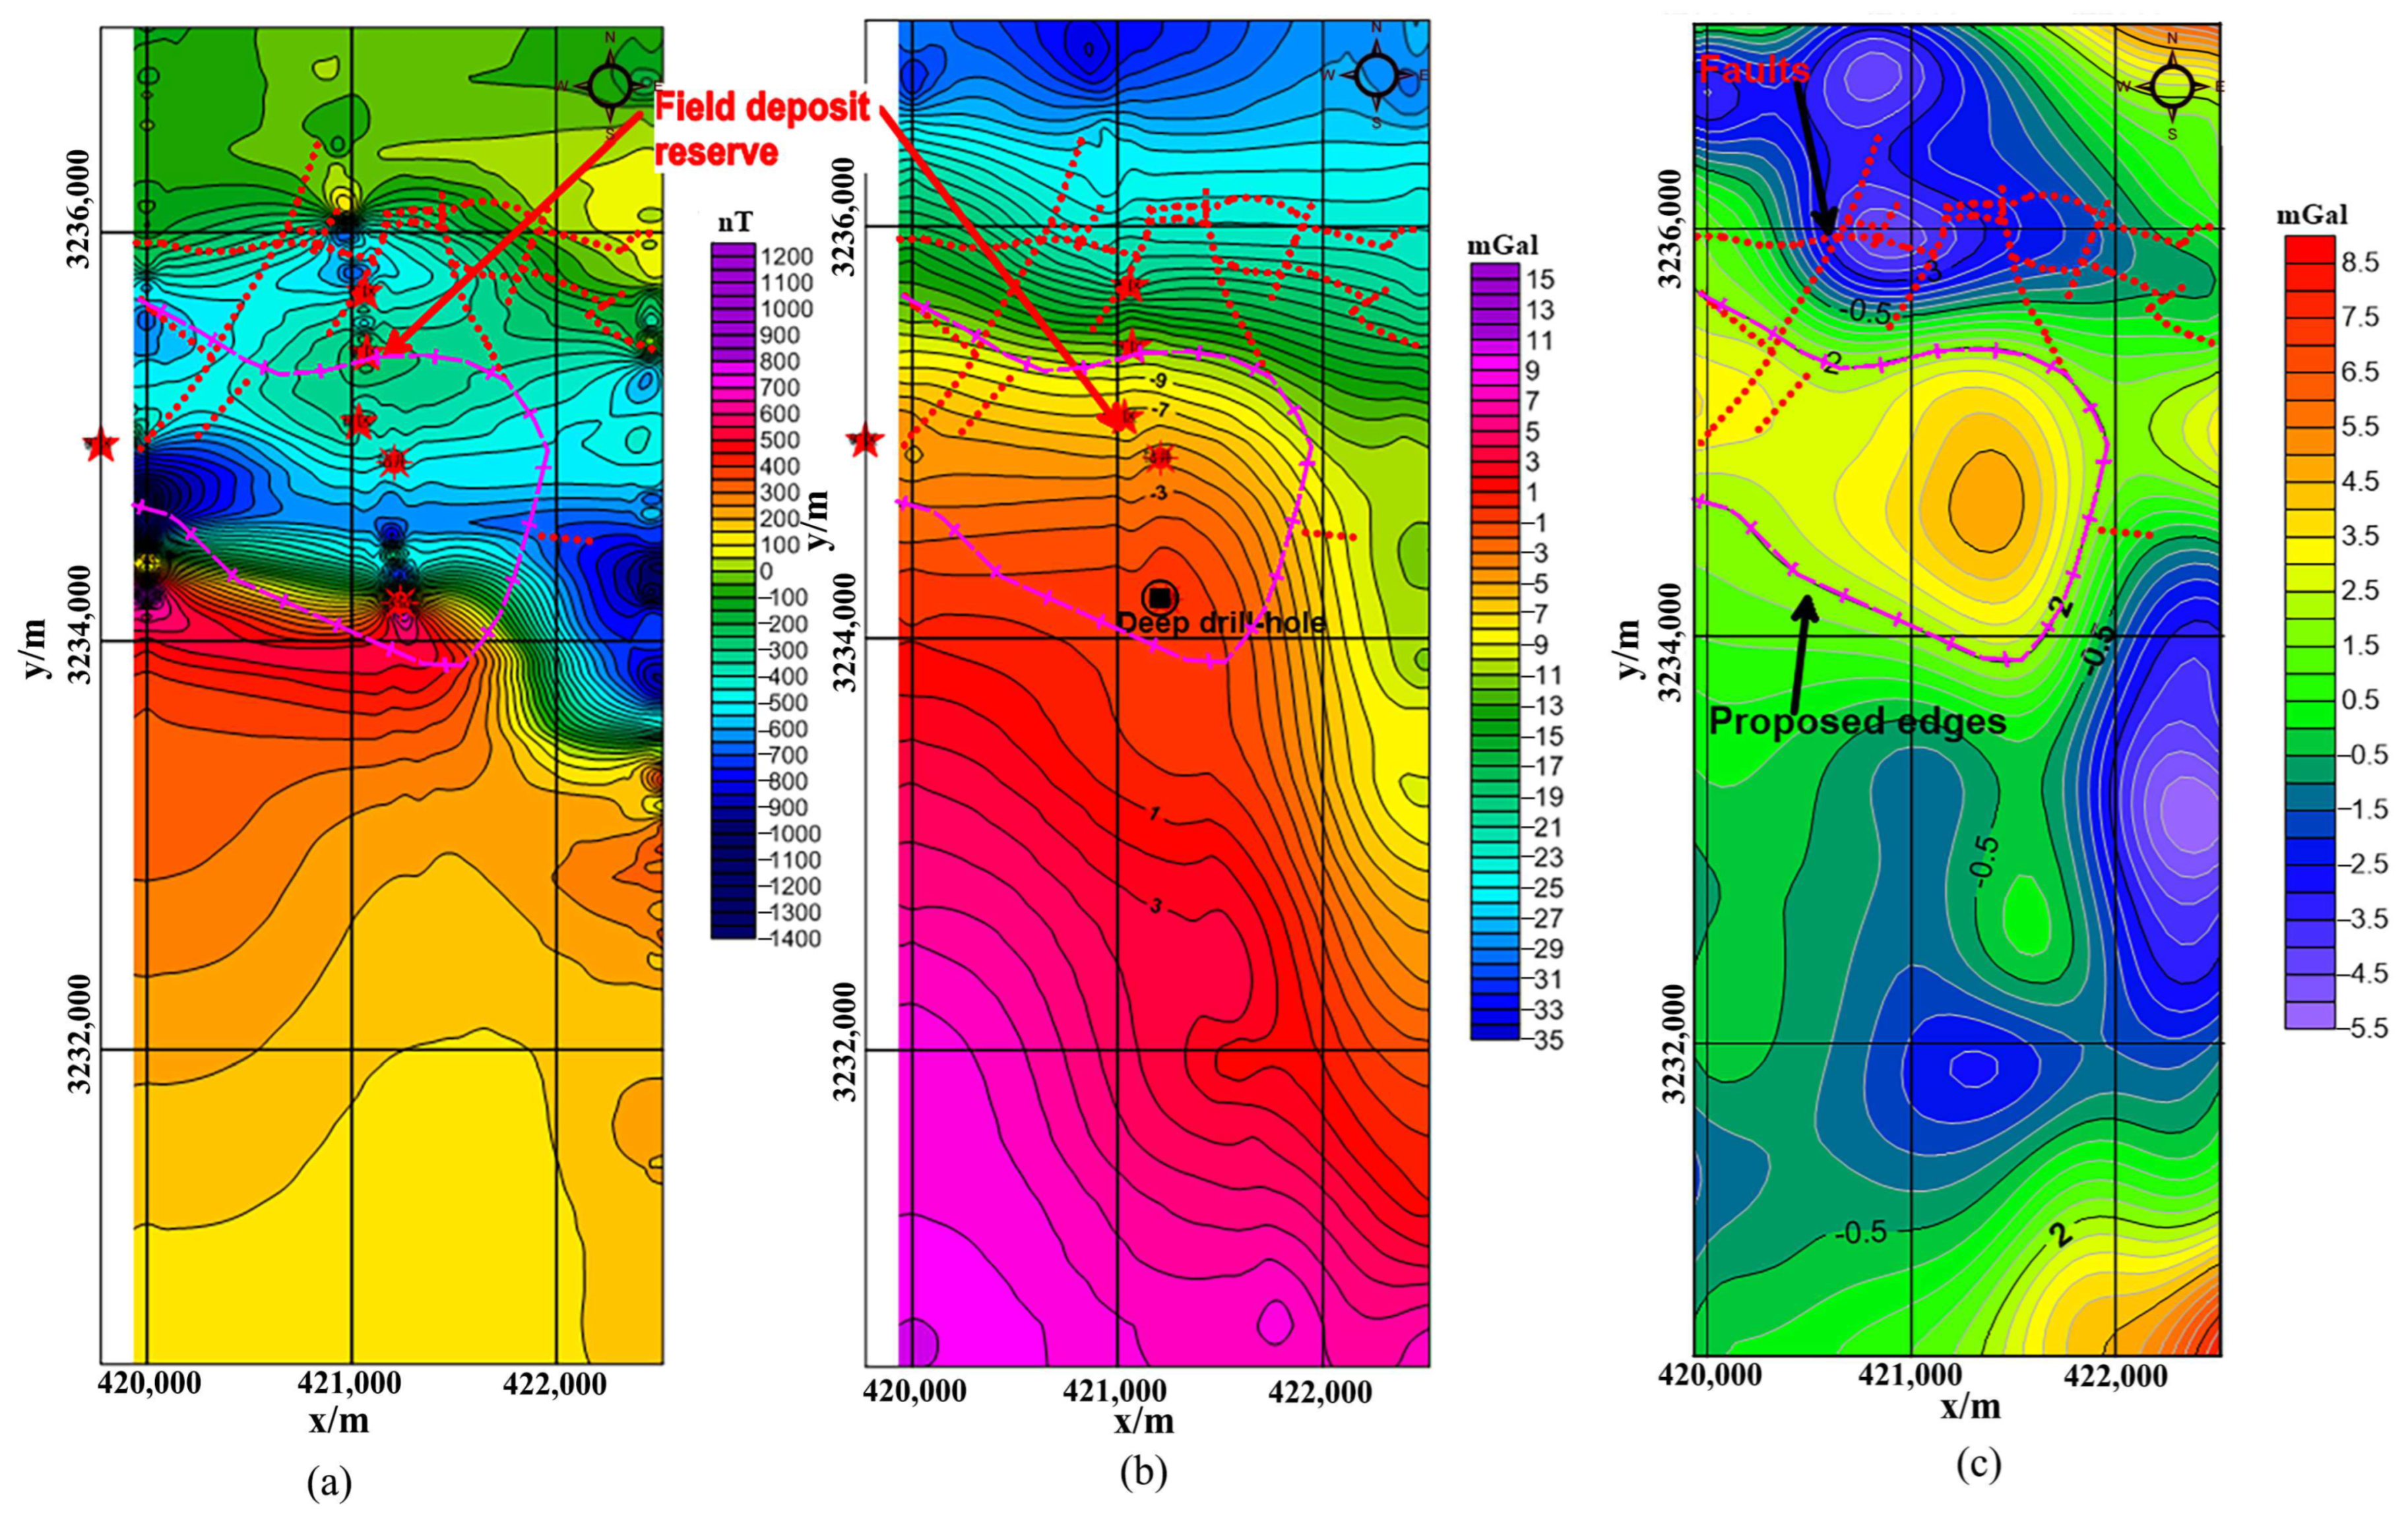
Gravity and magnetic anomalies are often used to identify geological structures; to divide faults, strata and metallogenic belts; and to comprehensively utilize the characteristics of gravity and magnetic anomalies in the study area as an important indicator for chromite exploration. Figure 7 shows the contour map of gravity and magnetic anomalies in this area. Figure 7a is a contour map of the magnetic anomaly, and it can be seen that the amplitude of the magnetic anomaly varies sharply between −1400 nT and 1300 nT, especially in the north-central area containing pure crystalline rocks and magnesite. The magnetic values of the above-mentioned ultrabasic plutons are lower than those of the rocks in the southern sequence of the Upper Triassic. The lithologic contact interface can be determined by the magnetic value gradient zone. The magnetic value of the Upper Triassic strata in the southern region gradually decreases from north to south, indicating that the lithological contact surface is deeper in the south. In contrast, the granite and Tertiary Robusha conglomerate regions in the north have lower magnetic anomaly amplitudes and gentle changes.
Figure 7b shows the anomaly of free air gravity in the study area. The area is located in a mountainous area, and gravity anomalies are heavily influenced by topography [36]. In order to eliminate the terrain fluctuation effect and regional signal interference, a wavelength filtering method is used for terrain correction and the residual separation of the source signal and background signal. Figure 7c shows the contour map of the residual gravity anomaly in this region. The red circle defines the contour of the residual gravity anomaly amplitude of 2 mGal, which corresponds to the location of the Robusa chromite deposit (the average density of chromite is 4.13 g/cm3). The huge Brahmaputra ultramafic rock mass is clearly presented by the residual gravity anomaly and magnetic anomaly. According to the geological record of deep boreholes, the high-gravity anomaly is caused by magnesite (average density 3.02 g/cm3) and pure crystalline rock (average density 2.88 g/cm3). By combining the annular features of the local high gravity anomaly with the braided positive magnetic anomaly, the ultrabasic rock area is determined.

3.3. Analysis for Application in the Luobusha Chromite Deposit

The fractal surface variance statistical method was applied to the gravity anomaly of the Robusha chromite deposit, and its edge detection was carried out. The obtained fractal dimension maps of the four directions of the Robussa chromite gravity anomaly are shown in Figure 8a–d. It can be seen that they have an obvious directional distribution. Through directional calculations, some faults and geological interfaces in the northern part of the study area can be identified. The 2 mGal gravity anomaly contours used as the reference range for chromite deposits do not correspond well to the fractal dimension values. Furthermore, it is worth stating that deposits I, II, VI and V are distributed at different high values and cannot be confirmed by just one directional calculation. The high value of the maximum fractal dimension (Figure 8e) obtained by the fractal surface variance statistics method shows the complexity of the development of faults and geological structures in this area, and the range is larger than the high value of the average fractal dimension (Figure 8f). Deposits I, II, IV and V, as well as deposits exposed by boreholes and workings, are surrounded by high-depth contours. Because the fractal change law of damaged rocks can be inferred through fractal analysis, high-value fault development zones can be determined according to the self-similar law. Therefore, the macroscopic properties of the fault distribution can be determined by the fractal dimension. Figure 8f shows high values of dimensionality greater than 2.6, indicating the boundaries of geological bodies and fault development zones, with smoother contours than those shown in Figure 8e, showing more detail.
The above analysis shows that the fractal dimension of the fractal surface variance statistics method is more sensitive to the abnormal gradient area, and is suitable for edge detection. Due to the self-similarity and self-affinity of fractals, the maximum fractal dimension is the best dimension to explain the complexity of the geological structure and reduce the influence of the direction of grid calculation. High values of fractal dimension correspond to deposit boundaries or interfaces with significant density differences. To summarise, the fractal dimension indicator “lightsup” is located at the maximum gradient in the graph. Similarly, continuous stratigraphic regions with few faults correspond to low-value regions. The analysis yields more detailed information about the deposit, structure, and interface. Therefore, the fractal surface variance statistical method is an effective method to determine the geological structure and locate the ore area by using the gravity anomaly data in geological surveying and exploration.

4. Conclusions

In this study, the main contributions are that the fractal surface variance statistics method is introduced and compared with the conventional methods, and that it is applied to identify structures or fault developments in the Luobusha chromite mine. According to the four directional, maximum and average fractal dimensions given by the fractal surface variance statistics method, it is specified that the geological boundaries, structures or interfaces of deposits could be demonstrated by high values in those contours. More geological details are presented than the conventional method. The distributions of the fractal dimensions in each direction are more sensitive to the direction of the structure, and the zone of high values shows great geological heterogeneity.
Different sliding window sizes and the other methods of fractal dimensions are required in future work. Besides this, the internal area of the geological body should be studied quantificationally. The directional influence resulting from grid calculation is going to be eliminated. The geological depth of the deposit should be confirmed by other fractal dimension calculations because of their different dimensions and characteristics.

Author Contributions

Conceptualization, Z.Z. and B.A.; methodology, D.Z.; software, B.A.; validation, Y.D. and Z.Y.; formal analysis, B.A.; investigation, D.Z.; resources, Y.Z.; data curation, Z.Z.; writing—original draft preparation, B.A.; writing—review and editing, C.Y.; visualization, Y.D.; supervision, C.Y.; project administration, Z.Y.; funding acquisition, Z.Z. All authors have read and agreed to the published version of the manuscript.

Funding

This research was funded by the National Natural Science Foundation of China (42074119), the Science Foundation of Ningxia (2019AAC03309), the Key Research & Development Project of Ningxia (2018BFG02012), the Young Talents of Science and Technology Support Project of Ningxia (NXTJGC2018041), the National Key Research & Development Project of China (2020YFE0201300), and the Basic Scientific Research Project (JKY202007).

Institutional Review Board Statement

Not applicable.

Informed Consent Statement

Informed consent was obtained from all subjects involved in the study. Written informed consent has been obtained from the patient(s) to publish this paper.

Data Availability Statement

Not applicable.

Acknowledgments

We would like to thank the editor and reviewers for their reviews, which improved the contents of this paper.

Conflicts of Interest

The authors declare no conflict of interest.

References

  1. Volland, S.; Kruhl, J.H. Anisotropy quantification: The application of fractal geometry methods on tectonic fracture patterns of a Hercynian fault zone in NW Sardinia. J. Struct. Geol. 2004, 26, 1499–1510. [Google Scholar]
  2. Kemblowski, M.W.; Wen, J.C. Contaminant spreading in stratified soils with fractal permeability distribution. Water Resour. Res. 1993, 29, 419–425. [Google Scholar]
  3. Kruhl, J.H. Fractal-geometry techniques in the quantification of complex rock structures: A special view on scaling regimes, inhomogeneity and anisotropy. J. Struct. Geol. 2013, 46, 2–21. [Google Scholar]
  4. Molz, F.J.; Boman, G.K.; Greald, K.B. A Fractal-Based Stochastic Interpolation Scheme in Subsurface Hydrology. Water Resour. Res. 1993, 29, 3769–3774. [Google Scholar]
  5. Puente, C.E.; Robayo, O.; Sivakumar, B. A fractal-multifractal approach to groundwater contamination. 2. Predicting conservative tracers at the Borden site. Stoch. Environ. Res. Risk Assess. 2001, 15, 372–383. [Google Scholar]
  6. Zhokh, A.; Trypolskyi, A.; Strizhak, P. Relationship between the anomalous diffusion and the fractal dimension of the environment. Chem. Phys. 2018, 503, 71–76. [Google Scholar]
  7. Cello, G. Fractal analysis of a Quaternary fault array in the central Apennines, Italy. J. Struct. Geol. 1997, 19, 945–953. [Google Scholar]
  8. Balka, R.; Buczolich, Z.; Elekes, M. A new fractal dimension: The topological Hausdorff dimension. Adv. Math. 2015, 274, 881–927. [Google Scholar]
  9. Ai, T.; Zhang, R.; Zhou, H.W.; Pei, J.L. Box-counting methods to directly estimate the fractal dimension of a rock surface. Appl. Surf. Sci. 2014, 314, 610–621. [Google Scholar]
  10. Rosenberg, E. Maximal entropy coverings and the information dimension of a complex network. Phys. Lett. A 2017, 381, 574–580. [Google Scholar]
  11. Dlask, M.; Kukal, J. Application of rotational spectrum for correlation dimension estimation. Chaos Solitons Fractals 2017, 99, 256–262. [Google Scholar]
  12. Gallos, L.K.; Song, C.; Makse, H.A. A review of fractality and self-similarity in complex networks. Phys. A Stat. Mech. Its Appl. 2007, 386, 686–691. [Google Scholar]
  13. Carr, J.R. Statistical self-affinity, fractal dimension, and geologic interpretation. Eng. Geol. 1997, 48, 269–282. [Google Scholar]
  14. Lopes, R.; Betrouni, N. Fractal and multifractal analysis: A review. Med. Image Anal. 2009, 13, 634–649. [Google Scholar]
  15. Zuo, B.; Hu, X. Edge detection of gravity field using eigenvalue analysis of gravity gradient tensor. J. Appl. Geophys. 2015, 114, 263–270. [Google Scholar]
  16. Chen, G.; Cheng, Q. Singularity analysis based on wavelet transform of fractal measures for identifying geochemical anomaly in mineral exploration. Comput. Geosci. 2016, 87, 56–66. [Google Scholar]
  17. Agterberg, F.P. Multifractals and geostatistics. J. Geochem. Explor. 2012, 122, 113–122. [Google Scholar]
  18. Afzal, P.; Ahmadi, K.; Rahbar, K. Application of fractal-wavelet analysis for separation of geochemical anomalies. J. Afr. Earth Sci. 2017, 128, 27–36. [Google Scholar]
  19. Yuan, F.; Li, X.; Zhou, T.; Deng, Y.; Zhang, D.; Xu, C.; Zhang, R.; Jia, C.; Jowitt, S. Multifractal modelling-based mapping and identification of geochemical anomalies associated with Cu and Au mineralisation in the NW Junggar area of northern Xinjiang Province, China. J. Geochem. Explor. 2015, 154, 252–264. [Google Scholar]
  20. Chen, G.; Cheng, Q.; Zuo, R. Fractal analysis of geochemical landscapes using scaling noise model. J. Geochem. Explor. 2016, 161, 62–71. [Google Scholar]
  21. Subhakar, D.; Chandrasekhar, E. Reservoir characterization using multifractal detrended fluctuation analysis of geophysical well-log data. Phys. A Stat. Mech. Its Appl. 2016, 445, 57–65. [Google Scholar]
  22. Wang, G.; Zhang, S.; Yan, C.; Xu, G.; Ma, M.; Li, K.; Feng, Y. Application of the multifractal singular value decomposition for delineating geophysical anomalies associated with molybdenum occurrences in the Luanchuan ore field (China). J. Appl. Geophys. 2012, 86, 109–119. [Google Scholar]
  23. Dimri, V.P. (Ed.) Fractals in Geophysics and Seismology: An Introduction, in Fractal Behaviour of the Earth System; Springer: Berlin/Heidelberg, Germany, 2005; pp. 1–22. [Google Scholar]
  24. Mark, D.M.; Aronson, P.B. Scale-dependent fractal dimensions of topographic surfaces: An empirical investigation, with applications in geomorphology and computer mapping. J. Int. Assoc. Math. Geol. 1984, 16, 671–683. [Google Scholar]
  25. Srivastava, R.P.; Vedanti, N.; Dimri, V.P. Optimal Design of a Gravity Survey Network and its Application to Delineate the Jabera-Damoh Structure in the Vindhyan Basin, Central India. Pure Appl. Geophys. 2007, 164, 2009–2022. [Google Scholar]
  26. Chen, G.; Cheng, Q.; Zhang, H. Matched filtering method for separating magnetic anomaly using fractal model. Comput. Geosci. 2016, 90, 179–188. [Google Scholar]
  27. Chen, G.; Cheng, Q. Fractal-Based wavelet filter for separating geophysical or geochemical anomalies from background. Math. Geosci. 2018, 50, 249–272. [Google Scholar]
  28. Ma, G.; Li, L. Edge detection in potential fields with the normalized total horizontal derivative. Comput. Geosci. 2012, 41, 83–87. [Google Scholar]
  29. Hosseini, A.A.; Doulati Ardejani, F.; Tabatabaie, S.H.; Hezarkhani, A. Edge detection in gravity field of the Gheshm sedimentary basin. Int. J. Min. Geo-Eng. 2013, 47, 41–50. [Google Scholar]
  30. Oliveira, S.P.; Ferreira, F.J.F.; Souza, J.D. EdgeDetectPFI: An algorithm for automatic edge detection in potential field anomaly images—Application to dike-like magnetic structures. Comput. Geosci. 2017, 103, 80–91. [Google Scholar]
  31. Zhang, Y.; Jin, Z.; Griffin, W.L.; Wang, C.; Wu, Y. High-pressure experiments provide insights into the Mantle Transition Zone history of chromitite in Tibetan ophiolites. Earth Planet. Sci. Lett. 2017, 463, 151–158. [Google Scholar]
  32. Wei, S.; Pengda, Z. Theoretical study of statistical fractal model with applications to mineral resource prediction. Comput. Geosci. 2002, 28, 369–376. [Google Scholar]
  33. Liu, C.Z.; Wu, F.Y.; Wilde, S.A.; Yu, L.J.; Li, J.L. Anorthitic plagioclase and pargasitic amphibole in mantle peridotites from the Yungbwa ophiolite (southwestern Tibetan Plateau) formed by hydrous melt metasomatism. Lithos 2010, 114, 413–422. [Google Scholar]
  34. Shi, N.; Ma, Z.; Xiong, M.; Dai, M.; Bai, W.; Fang, Q.; Yan, B.; Yang, J. The crystal structure of (Fe4Cr4Ni)9C4. Sci. China Ser. D Earth Sci. 2005, 48, 338. [Google Scholar]
  35. Li, G.; Tian, Y.; Kohn, B.P.; Sandiford, M.; Xu, Z.; Cai, Z. Cenozoic low temperature cooling history of the Northern Tethyan Himalaya in Zedang, SE Tibet and its implications. Tectonophysics 2015, 643, 80–93. [Google Scholar]
  36. Nowell, D.A.G. Gravity terrain corrections—An overview. J. Appl. Geophys. 1999, 42, 117–134. [Google Scholar]
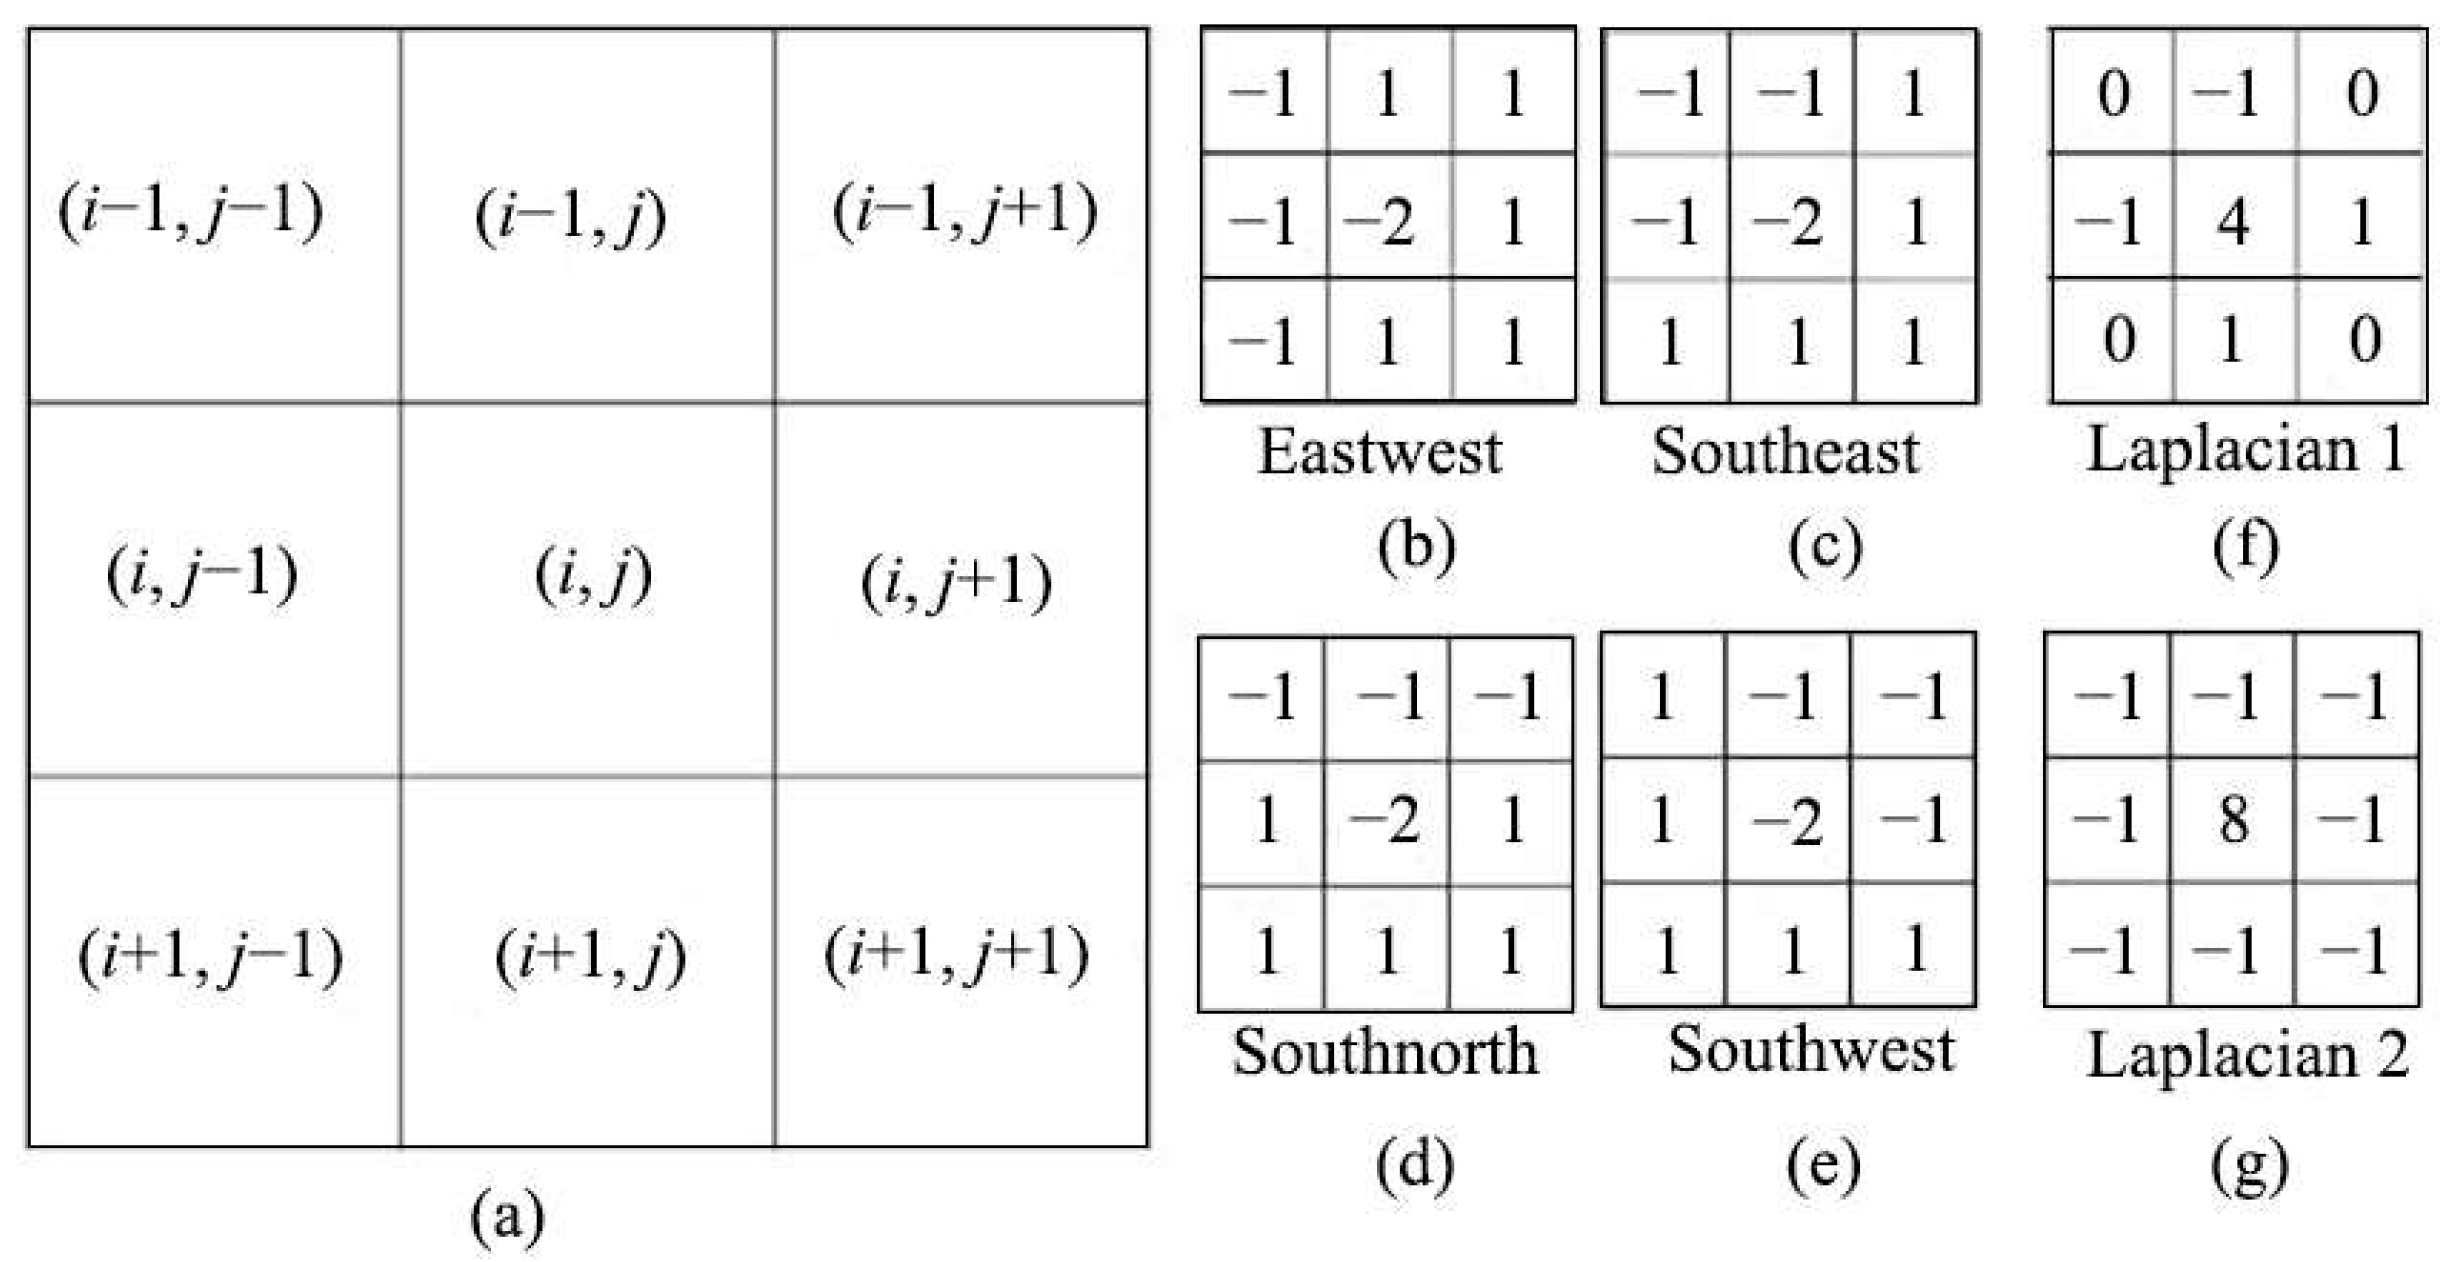
Figure 1. Operator model for the directional gradient filter and the second–order derivate filters of Laplacian 1 and 2. (a) The sliding window of 3 × 3 matrix calculation; (b) the eastwest gradient filters; (c) the southeast gradient filters; (d) the southnorth gradient filters; (e) the southwest gradient filters; (f) the second−order derivate filters of Laplacian 1; (g) the second-order derivate filters of Laplacian 2.
Applsci 12 08172 g001
Figure 2. A sliding window for a 3 × 3 matrix of variance statistics for fractal surfaces. (a) Southnorth direction; (b) eastwest direction; (c) southeastnorthwest direction; (d) northeastsouthwest direction. The red arrows represent the direction of movement during calculation.
Applsci 12 08172 g002
Figure 3. Contour map of the gravity anomaly for the model.
Applsci 12 08172 g003
Figure 4. Fractal dimension results. (a) S-N direction; (b) W-E direction; (c) WN-SE direction; (d) NE-SW direction; (e) the maximum fractal dimension; (f) the average fractal dimension.
Applsci 12 08172 g004
Figure 5. Results of different filter methods. (a) E direction; (b) S−E direction; (c) S direction; (d) SW direction; (e) the second−order derivative of Laplacian 1; (f) the second−order derivative of Laplacian 2.
Applsci 12 08172 g005
Figure 6. Location map and geological map of the study area. (a) Location map of the study area; (b) terrain map of the study area; (c) gravity and magnetic profile position; (d) geological map of the study area.
Applsci 12 08172 g006
Figure 7. The gravity and magnetic anomaly map of the study area. (a) Contour map of magnetic anomaly in the study area; (b) contour map of the gravity anomaly; (c) contour map of the residual gravity anomaly.
Applsci 12 08172 g007
Figure 8. Fractal dimension results of the research area. (a) S-N direction; (b) W-E direction; (c) WN-SE direction; (d) NE-SW direction; (e) the maximum fractal dimension; (f) the average fractal dimension.
Applsci 12 08172 g008
Publisher’s Note: MDPI stays neutral with regard to jurisdictional claims in published maps and institutional affiliations.