Article

Fluid Dynamics in a Continuous Pump-Mixer

1
Laboratory of Reaction and Fluid Process Engineering, Technische Universität Kaiserslautern, 67663 Kaiserslautern, Germany
2
Chair of Hydraulic Fluid Machinery, Ruhr Universität Bochum, 44801 Bochum, Germany
*
Authors to whom correspondence should be addressed.
Appl. Sci. 2022, 12(16), 8195; https://doi.org/10.3390/app12168195
Submission received: 19 July 2022 / Revised: 11 August 2022 / Accepted: 11 August 2022 / Published: 16 August 2022

Abstract

:

Featured Application

This work contains a detailed database for the design of pump-mixers and shows general approaches for scale up.

Abstract

The fluid dynamic (flow rates) and hydrodynamic behavior (local droplet size distributions and local holdup) of a continuous DN300 pump-mixer were investigated using water as the continuous phase and paraffin oil as the dispersed phase. The influence of the impeller speed ( N   = 375 to 425 rpm), the feed phase ratio ( φ F = 10 to 30 vol.-%), and the flow rate ( V ˙ t o t ≈ 0.5 to 2.3 L/min) were investigated by measuring the pumping height, local holdup of the disperse phase, and the droplet size distribution (DSD). The latter one was measured at three different vessel positions using an image-based telecentric shadowgraphic technique. The droplet diameters were extracted from the acquired images using a neural network. The Sauter mean diameters were calculated from the DSD and correlated with an extended model based on Doulah (1975), considering the impeller speed, the feed phase ratio, and additionally the flow rate. The new correlation can describe an extensive database containing 155 experiments of the fluid and hydrodynamic within a 15% error range.

1. Introduction

Pump-mixer-settlers are frequently used in metal extraction processes for the production or recovery of metals from ores or environments such as copper, manganese, and cobalt (e.g., PUREX plutonium uranium recovery by reactive extraction). These apparatuses are a special version of conventional mixer-settlers including not only mixing and dispersing, but also the pumping of the liquids. To achieve this, the impeller is used in combination with a suction orifice to pump the fluid between the mixer-settlers in a cascade, thus reducing the need for pumps. In addition, the system is rather robust against suspended solid particles as no pump impeller is involved in the fluid transport. While pumps tend to fail under the abrasion of solids, stirred vessels are comparatively tolerant in respect to solids. The shear forces in conventional pumps are much higher than in stirred vessels, causing higher entrainment of small, dispersed phase droplets, which is another advantage of this setup.
The concept of the pump-mixer was first reported 1939 in a US patent [1] and is nowadays in industrial use as more advanced designs [2], such as the General Mills or the Davy-Powergas designs. Although the pump-mixer concept has obvious advantages and is industrially used, there is little basis for two-phase or three-phase (with solid particles) design and layout of these apparatuses. Since 2000, pump-mixers have been the subject of increased research, where the majority of publications are related to exclusively simulative studies or single-phase experiments. Only a few recent publications reveal more sophisticated data, such as DSD. To the best of our knowledge, no studies exist that consider both the pumping behavior and internal variables, such as the flow pattern or the DSD. Models or correlations that predict droplet size in the apparatus are rare and do not account for the necessary pumping behavior. In the following, a short overview of publications related to pump-mixers is provided.
In 2004, Singh et al. [3] published an approach to predict the pumping and power characteristics of a General Mills pump-mixer in single-phase operation using a neural network. In the following years, the research group conducted many studies using Computational Fluid Dynamics (CFD), focusing on the flow field at different impeller types and geometry [4,5]. In addition, different suction orifice geometries were investigated, using a draft-tube to suck the liquids in the General Mills and the Davy-Powergas design. In a later work, Singh et al. published a correlation for the DSD and the local holdup [6] in two-phase pump-mixers.
Srilatha et al. started with the head characteristics of different impellers and impeller heights in 2008 [7] and published two-phase experiments and CFD modeling. Their measurement setup was similar to the one reported by Singh et al. [6] and their focus was on detailed phenomena between the flow pattern in the tank and its respective DSD [8,9].
In 2010, Tabib et al. published their CFD results on pump-mixers in General Mills design using a square vessel [10]. In 2012, another paper was published that focused mainly on the simulative study of different geometric design parameters considering the energy dissipation in the vessel based on particle image velocimetry (PIV) data [11].
Zhou et al. published, in 2019, measurements in a square-tank pump mixer and investigated droplet breakage [12] and the influence of dispersed phase viscosity [13]. In their experiments, the dispersed phase was pumped into the vessel instead of sucking it with the impeller. In 2021, they published a CFD approach with a coupled population balance model (PBM) in highly diluted dispersions [14].
Tang et al. also published a study in a square-tank continuous pump-mixer with CFD combined with PBM relying on flow field PIV measurements [15]. They correlated their data but only investigated a flow rate of 3 L/min, which was controlled by a peristaltic pump [16].
Modeling a DSD in general is usually performed via semi-empirical approaches based on the theory of isotropic turbulence of Kolmogorov [17] and Hinze [18]. For liquid–liquid systems, the most of it is related to stirred-batch vessels [6,19,20,21,22] and in rare cases with pump-mixers, as by Singh et al. [6]. Most of the literature refers to highly diluted dispersions and only a few studies relate to higher phase fractions [22]. The most common approach [2,23,24] initially developed by Doulah [25] for high-phase fractions up to φ   ≤ 30 vol.-% is given as:
d 32 D = f ( φ ) C 4 W e T 0.6 = C 4 ( 1 + C 5 φ ) W e T 0.6   =   C 4 ( 1 + C 5 φ ) W e T C 9
Equation (1) relates the Sauter mean diameter, d 32 D , for a given impeller diameter, D , and the Weber number, W e T , of the tank. It is modified by an exponent, C 9 , which can be theoretically derived as C 9 = −0.6 [22] in a droplet breakage domain. At higher phase fractions, φ , increased coalescence leads to other values [26]. It should be noted here that φ describes the volume-based fraction in a batch tank as:
φ = V d V d + V c
where V d is the total volume of the dispersed, and V c is the volume of the continuous phase. For ideally mixed batch vessels, the integral holdup Φ ¯ equals the phase fraction φ .
The parameters C 4 and C 5 depend on the geometry of the vessel, the coalescence tendency of the chemical system, and especially on the impeller type and were derived in our previous publication [22]. The definition of the Weber number is as:
W e T = ( ρ c N 2 D 3 σ d , c )
It depends on the impeller speed, N , the impeller diameter, D , the continuous phase density, ρ c , and the interfacial surface tension between the dispersed and continuous phase, σ d , c . Equation (1) is valid for stirred batch vessels but can also be adapted for pump-mixers due to the similar apparatus design.
Singh et al. [6] used the approach in Equation (1) with a quadratic function for the phase fraction and introduced the volume flow rate via the mean residence time τ ¯ as an exponent in an exponential function shown in Equation (4).
d 32 D = C 4 ( 1 + C 5 φ F + C 6 φ F 2 ) W e T C 9 · e C 7 τ ¯   with   τ ¯ = V T V ˙ c + V ˙ d
V T is the tank volume. C 6 is introduced to represent the quadratic trend of the droplet diameters over the phase fraction and C 7 to model the volume flow as mean residence time τ ¯ . Since this is a continuous apparatus, there is often a difference between the feed phase fraction φ F and the actual integral holdup   Φ ¯ . Therefore, it should be noted that in the analysis the authors refer to the feed phase ratio φ F , which can be significantly different from the holdup. The feed phase ratio is defined as:
φ F = V ˙ d V ˙ d + V ˙ c = V ˙ d V ˙ t o t
The mean residence time τ ¯ is calculated here using the tank volume V T and the volume flows V ˙ c . and V ˙ d in steady state. The authors do not use the theoretical value for the Weber exponent; instead, they correlated C 9 to be −0.85125.
Available literature provides a certain insight into the behavior of pump-mixers. However, predictive simulations of fluid dynamic (flow rates, flow patterns, local energy dissipation) and hydrodynamic behavior (local droplet size distributions, local and integral holdup) are not yet possible. Another problem is that some publications use pumps to operate multiphase pump-mixers [14,16], so there is a change in residence time, dispersing properties, and the resulting DSD.
A DN300 pump-mixer was experimentally investigated in this work to close this gap in the literature. Our study focused on DSD and the pumping behavior based on shadowgraphic image analysis using a convolutional neuronal network [27]. An extensive database was established to describe the mutual influences of the process conditions such as impeller speed, feed phase fraction, and flow rate on the DSD, Sauter mean diameter, and the local holdup. As in our previous work [22,28,29], the image-based probe can reliably measure the DSD with a high statistical significance, even under difficult conditions at a high disperse phase fraction. Together with the CFD, detailed information about the flow patterns and the DSD could be evaluated. The generated data were finally used to develop a model, which adequately describes the Sauter mean diameter under different process conditions within a 15% error range.

2. Materials and Methods

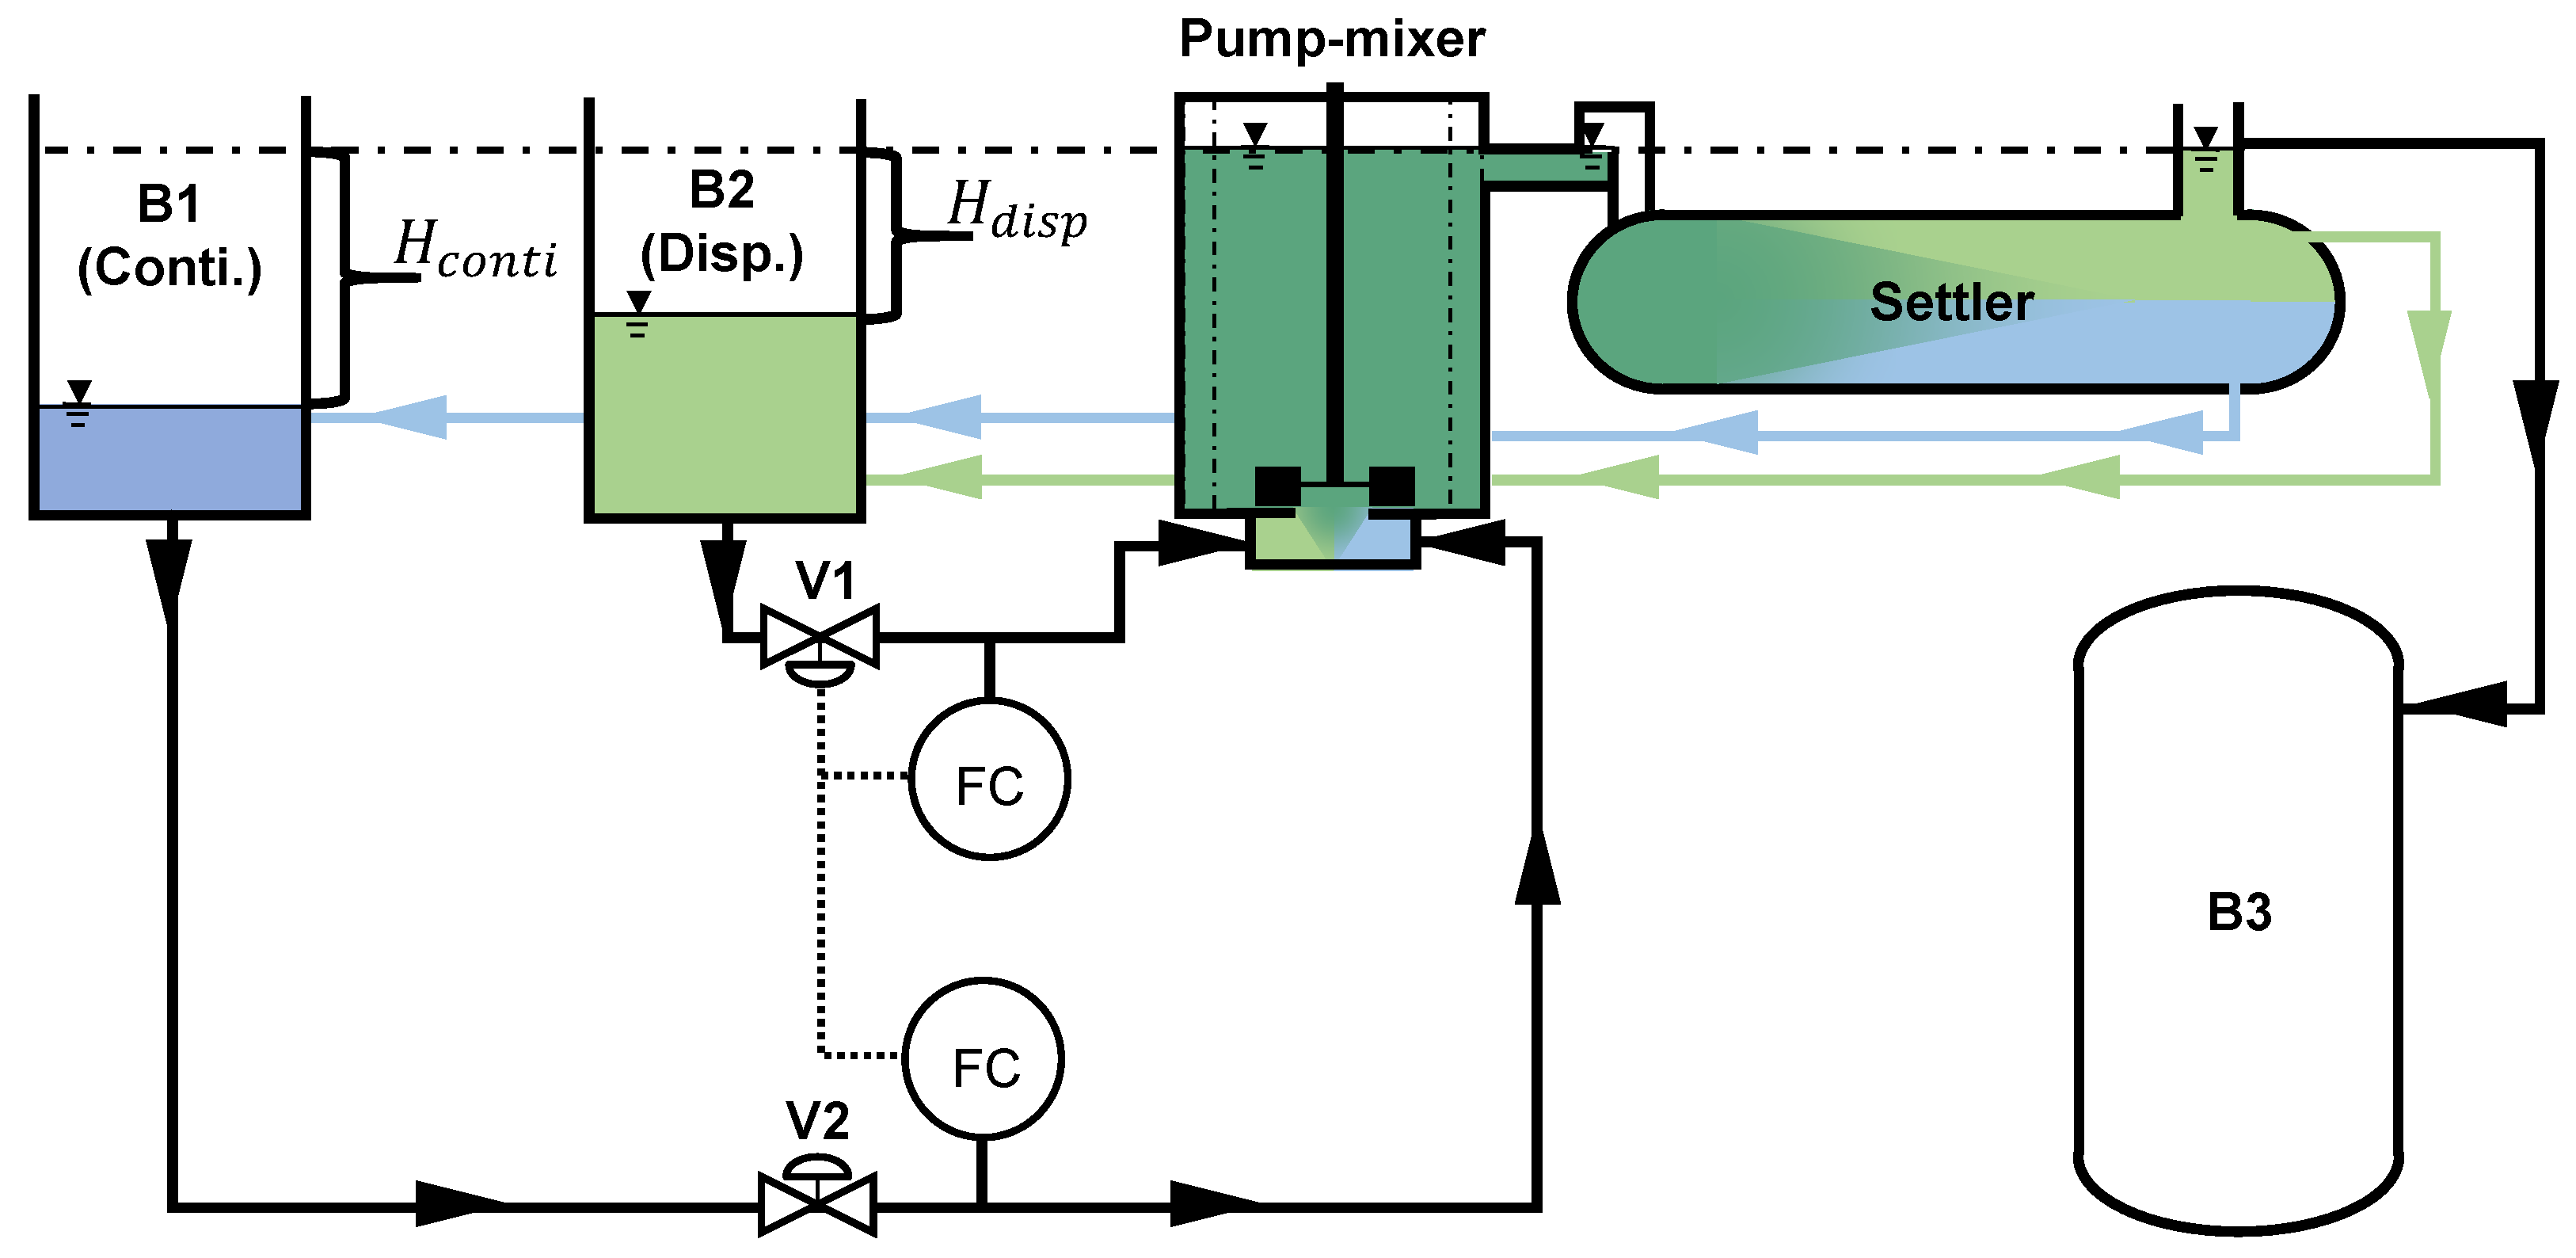
2.1. Experimental Setup

Experiments were performed in a continuous two-phase General Mills design DN300 pump-mixer-settler without any pumps as depicted in Figure 1. The feed phase ratio is controlled by a flow ratio control and the complete apparatus is operated without pumps. B1 and B2 are the storage tanks (Ø400 mm) for the continuous and dispersed phase. B3 samples the overflow of the settler at too high flow rates. Both phases have their individual feed tanks B1 and B2 and pipes with a diameter of 25 mm feed the suction chamber beneath the tank. In the 25 mm diameter connecting pipes of each phase is a supersonic flow control (FC, DUK S300–DN25, Kobold Messring GmbH, Hofheim am Taunus, Germany) and a sleeve valve (V1 and V2 QP25–08NR, AirCom Pneumatic GmbH, Ratingen, Germany), which allow for a ratio control of both phases. To maximize the total volumetric flow (continuous and disperse phase), only V1 is used. The valve V2 controls the flow of the continuous phase, which was held at a constant value (fully open) throughout this study. Inside the suction chamber is a weir, which separates the phases until they reach the suction orifice. Above the suction orifice is a Rushton turbine impeller, which sucks the phases into the fully baffled tank. The dispersion produced by the impeller leaves the tank through a 50 mm pipe to an overflow weir prior entering the settler. The overflow weir keeps the liquid level in the mixer constant regardless of the height difference to the feed tank. This means that the height (head) to overcome during operation is determined only by the total volume of liquid in the system. Both, the head of the continuous phase H c o n t i and the head of the disperse phase H d i s p can solely be determined from their fill levels in the feed tanks B1 and B2 respectively, because the fill level in the pump-mixer is constant. The settler for phase separation has a diameter of Ø300 mm and a length of 1.4 m. After their separation in the settler, both phases are returned to their feed tanks via DN25 pipes. An overflow at the settler is connected to a compensating reservoir B3; hence, it can be ensured that the pump-mixer-settler is completely filled. The total maximum volume of the whole apparatus is approximately 310 L.

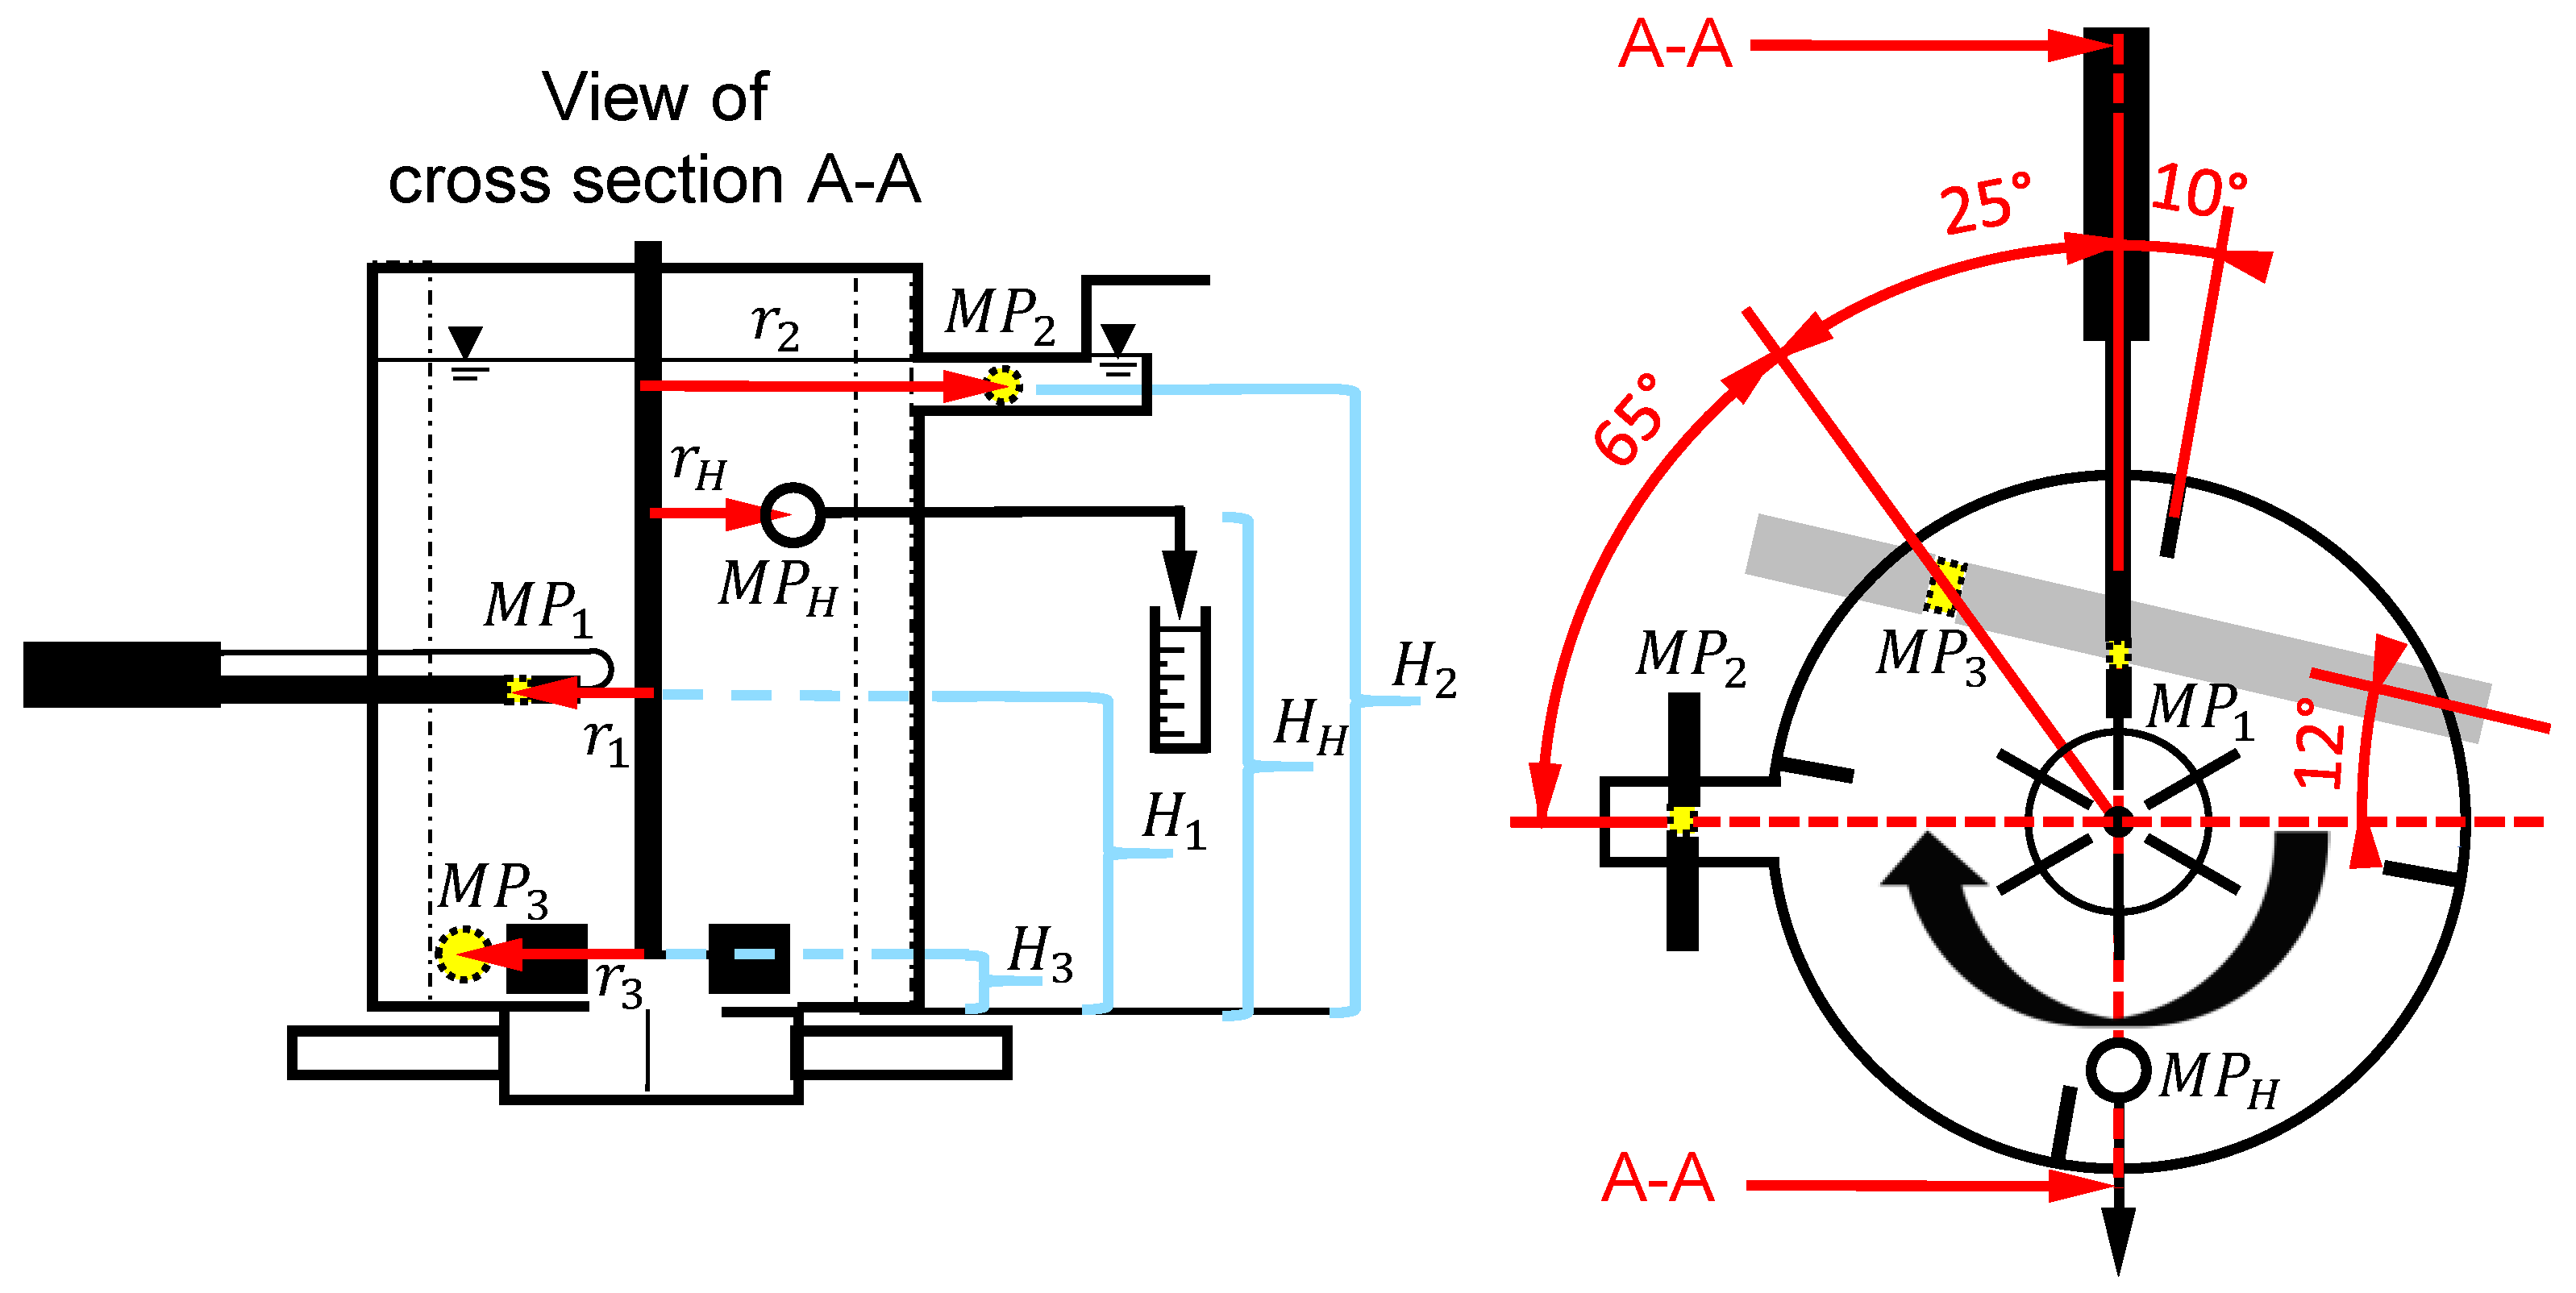
2.2. Pump-Mixer Geometry

The object of investigation was a fully-baffled cylindrical pump-mixer based on a General Mills design schematically shown in Figure 2. The mixer has an inner diameter of T   = 300 mm and a total height of H 0 = 390 mm. With the overflow weir, the liquid height in operation was constant at H = 360 mm, providing a H / T = 1.2 ratio. This is slightly diverging from the literature [23,24] with H / T = 1. The tank is equipped with a 6-blade Rushton turbine impeller with a diameter D = T / 3 = 100 mm mounted on a 26 mm shaft driven by a stirring unit (Heidolph instruments & Co. KG, RZR 2052 control, Schwabach, Germany). The impeller disc was 75 mm in diameter and 2 mm thick. The impeller blades are equally spaced and have a width of 25 mm, a height of 20 mm, and a thickness of 2 mm. The lower edge of the impeller is 1 mm above the suction orifice and therefore has an off-bottom clearance C = T /36 = 10 mm (measured from the suction orifice to the impeller disc).
The suction orifice has a diameter of T S = T / 4 = 75 mm and a thickness of 4 mm. The suction chamber beneath the orifice has a diameter of T S C = 200 mm and a suction chamber height of H s c = 55 mm. The tank has 4 equal-spaced baffles (4 × 90°) each with a width of B   = T /10 = 30 mm and a thickness of 8 mm while also covering the full height H 0 of the tank. The baffles were simply clamped against the wall; hence, they were not sealed against the wall completely. It can still be assumed that there is no flow behind the baffles.
Three Optical Multimode Online Probes (OMOP) [30] were used to investigate the droplet size distribution ( M P 1 3 ) at different positions and the local holdup was measured in the upper half of the vessel ( M P H ) as depicted in Figure 3.
An endoscopic optical probe is inserted from outside at M P 1 and was also used in previous works [22,29,31,32] and is described elsewhere [33]. The positions M P 2 and M P 3 are based on a two-sided design by Mickler and Bart [30] needing a measurement flange. The measurement position M P 2 is a symmetric DN50 measurement flange with a Ø22 mm optical probe. Hence, the overflow weir is necessary to ensure the outlet tube is filled with liquid. Position M P 3 is an eccentric measurement flange with a Ø38 mm optical probe. The probe in M P 3 can be rotated at an angle of 12° (see Figure 3, left) for a better alignment with the assumed flow direction generated by the Rushton turbine. All measurement positions are equipped with a Basler acA 1300–60 gm camera and a 1× telecentric lens, providing an image size of 1024 × 1024 pixels (5.4 mm × 5.4 mm). All measurement positions were adjusted at a depth of the measurement gap of 2 mm between the camera and LED light source of the probe. Additionally, the local holdup was measured at M P H by taking samples of 25 mL into a graduated cylinder. The dimensions of the measuring positions mentioned in Figure 3 are listed in Table 1.

2.3. Chemical System

Deionized water was used as the continuous phase and paraffin oil (FC 2006, Fauth GmbH + Co. KG, Mannheim, Germany) as the dispersed phase. Fifty mmol Na2SO4 was dissolved in the water to provide an electric conductivity of 8800 µS/cm. Adding Na2SO4 does not alter the substance properties except for a negligible increase in the density of the water. However, it guarantees measurement reproducibility by dampening the influence of hardly detectable impurities affecting coalescence [34,35]. The physical properties are listed in Table 2.
All liquid densities were measured using a DMA55 density meter (Stabinger Messtechnik GmbH, Germany) while the kinematic viscosities were measured using a Viscoboy 2 viscometer (LAUDA Scientific GmbH, Lauda-Königshofen, Germany). The interfacial surface tension of a disperse droplet in the water/Na2SO4 solution being saturated with paraffin oil was measured with a contact angle microscope (DataPhysics Instruments GmbH, Filderstadt, Germany) using the pendant drop method. It must be noted that the value of σ d , c s a t = 37 mN/m significantly diverges from the value of the unsaturated system, σ d , c = 53 mN/m.

2.4. Experimental Procedure

The apparatus was filled with the water/Na2SO4 solution in the feed tank B1 and the paraffin oil in feed tank B2. The impeller was used to fill the apparatus until the whole mixer-settler was filled and paraffin oil flowed into the compensating tank B3 in Figure 1. Afterwards, the impeller was shut off and the feed tanks were refilled to the overflow level of B3 to ensure the apparatus was completely filled. Then, the impeller was set to the desired impeller speed N and the ratio control was set to the desired phase feed ratio φ F (using valve V1). All combinations of the impeller speeds N = 375, 400 and 425 rpm and feed phase ratios φ F = 10 to 30 vol.-% in 5 vol.-% steps were investigated. The parameter set for N   = 400 rpm was measured a second time using only measurement position M P 1 to ensure reproducibility of the DSD.
The ratio was determined by the flow rates measured at the two FC’s, where V ˙ c is the flow rate of the continuous phase and V ˙ d the one of the disperse phase, respectively the total flow rate V ˙ t o t . After 1 h the apparatus was at a steady state, which was confirmed by constant liquid heights in the feed tanks and the settler and constant flow rates over at least 4 min. After the steady state was ensured, the flow rates were measured via the two FC’s, the liquid heights H c o n t i and H d i s p (see Figure 1) in the feed tanks were measured manually to determine the head, and the DSD was measured at the measurement positions M P 1 to M P 3 . At each measurement position, 1500 pictures were captured at 10 fps and an exposure time of 10 µs. After all measurements were finished, the local holdup Φ was measured at the position M P H by taking a 25 mL sample of dispersion through a tube into a graduated cylinder. This negligible sampling amount did not influence the overall process (25 mL << 28 L). The local holdup, Φ , was measured by determining the heights of the continuous phase, h c , and disperse phase, h d , in the measuring cylinder of the settled sample using Equation (6):
ϕ = h d h d + h c
The liquid heights H c o n t i and H d i s p , which determine the head, increased and the flow rate decreased when equal amounts of liquid from each phase were removed from the apparatus. This procedure was repeated until the heads were so high that the impeller could not maintain a flow rate ( V ˙ c = V ˙ d = 0 L/min). At this limiting point, only the liquid heights and no DSD were measured. This was performed for every impeller speed ( N = 375, 400, and 425 rpm) and each feed phase ratio ( φ F = 10, 15, 20, 25, and 30 vol.-%) The first dataset for N = 400 rpm was conducted where only the flow rate and DSD at the middle measurement position M P 1 were measured. The second data set covered all three impeller speeds, DSD measurements at all measurement positions M P 1 3 , and the measurement of the local holdup. The data set with all impeller speeds was named Exp. 1, since it is of major interest. The first data set was named as Exp. 2, since it was only used to ensure reproducibility of the pumping curves and DSD measurements.

2.5. Data Analysis and Modelling

The droplet diameters were analyzed by a Convolutional Neural Network (CNN) published by Schäfer et al. [27] and exemplarily depicted in Figure 4. The CNN can reliably detect the droplet diameter [22,27,28]. The number distribution, q 0 , and the volume distribution, q 3 , are calculated by neglecting 1% of the largest drops of each measurement to systematically exclude erroneous detections by the CNN. A constant droplet diameter class width of Δ d i   = 20 µm was used throughout and the Sauter mean diameter was calculated from the second and third moment of the distributions as described elsewhere [22]. In one measurement run (1500 images), between 124,000 and 550,000 droplets were analyzed, ensuring statistical significance.
For the modeling of the Sauter mean diameter, Equation (1) was used as the model of Singh et al. [6] (see Equation (4)) could not represent our data due to opposing trends caused by much shorter mean residence times. Since Equation (1) does not consider the flow rate, it was modified. The coefficients C 4 and C 5 were replaced with a linear equation considering the total flow rate, V ˙ t o t , in Equations (7) and (8). For the sake of simplicity, C 4 was replaced by A and C 5 by B , leading to the following equations.
A = A ( V ˙ t o t ) = A 1 · V ˙ t o t + A 0  
and for B :
B = B ( V ˙ t o t ) = B 1 · V ˙ t o t + B 0  
This was carried out for every impeller speed, leading to three equations in the following form (one for each impeller speed, hence N resp. W e T = const.):
d 32 D = A ( V ˙ t o t ) ( 1 + B ( V ˙ t o t ) φ ) W e T 0.6 = ( A 1 · V ˙ t o t + A 0 ) · [ 1 + ( B 1 · V ˙ t o t + B 0   ) φ F ] W e T 0.6   f o r   N   =   const .
After a study of A 0 , A 1 , B 0 , and B 1 (see Figure 12), the coefficients were replaced by calculating their mean values considering all impeller speeds, which led to the following final equation:
d 32 D = A ( V ˙ t o t ) ( 1 + B ( V ˙ t o t ) φ ) W e T 0.6 = ( A ¯ 1 · V ˙ t o t + A ¯ 0 ) · [ 1 + ( B ¯ 1 · V ˙ t o t + B ¯ 0   ) φ F ] W e T 0.6
where A ¯ 0 , A ¯ 1 , B ¯ 0 , and B ¯ 1 are the mean correlation coefficients of different coefficients of Equation (9). The coefficients were derived from experimental data using the least square method in Matlab® Curve Fitting Tool (Matlab®, The MathWorks Inc., Natick, MA, USA version 9.6.0.1072779; R2019a and Curve Fitting Toolbox 3.5.9).

3. Results

3.1. Experimental Results

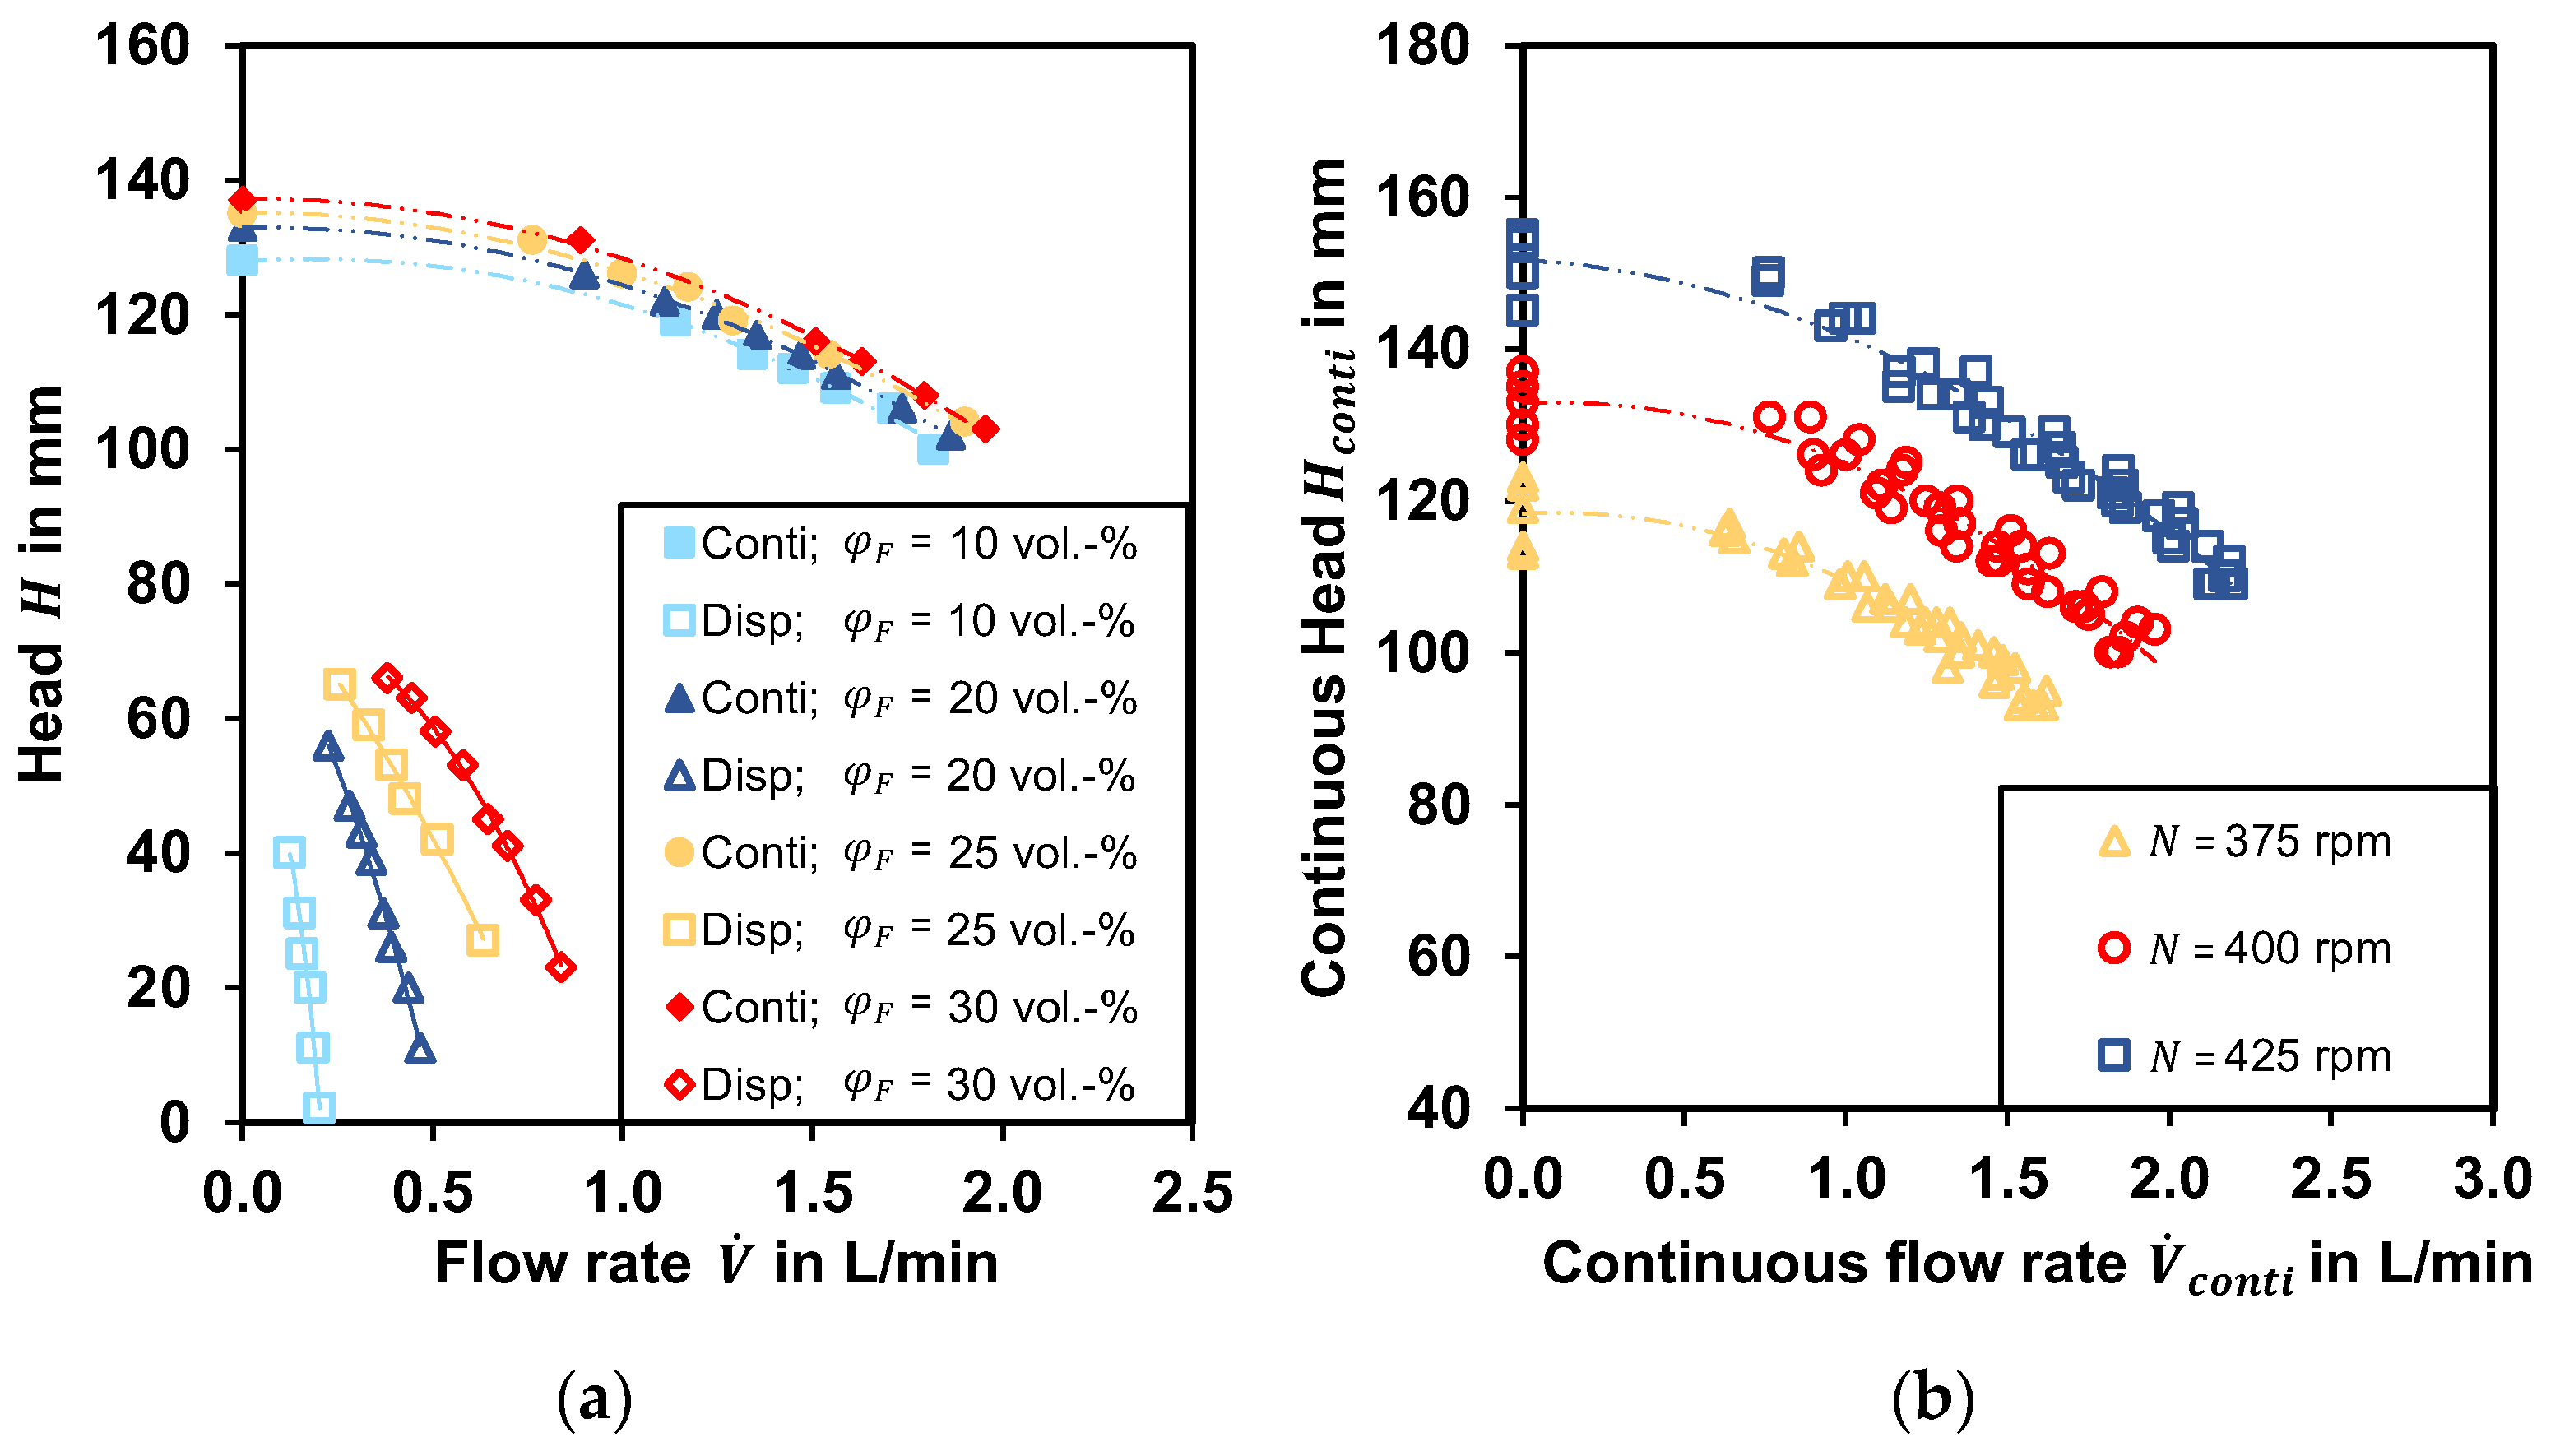
3.1.1. Pumping Behavior

Figure 5 shows the measured heads as a function of the flow rate. Figure 5a depicts a typical quadratic pumping curve for the disperse and continuous phases at N = 400 rpm. The pumping curve was rather flat compared with conventional pumps, because the pumping mechanism relies on an increase of the fluid velocity instead of an increased total pressure, which is caused by a tank that is much larger than the size of the impeller. It can also be seen that the pumping curves of the disperse phase were steeper and at lower height compared with those of the continuous phase. This is caused by the pressure loss in valve V1, which controls the disperse flow rate. In addition, the head was much smaller, caused by the difference in densities between the continuous and disperse phase. The pumping curves for the continuous phase were slightly higher at higher feed phase ratios, φ F , but the small difference was negligible. This may change with other impeller types and dimensions but is almost equal for the 100 mm Rushton turbine.
In contrast to the negligible influence of the phase ratio, the pumping curves show a strong dependency on the impeller speeds as depicted in Figure 5b. The maximal supported feed phase ratio was found to be approximately 33 vol.-% with both valves V1 and V2 fully open. All measured heads and flow rates are listed in the supplementary Material, in Table S1.

3.1.2. DSD at Different Measurement Positions

The most suitable measurement position was found to be M P 1 where the droplet size at every combination of impeller speed, phase ratio, and flow rate could be measured. The droplet size measurement at position M P 2 could only be measured at low feed phase ratios because droplets accumulated at the glass windows and would lead to erroneous droplet size measurements. However, measurement position M P 3 was capable of reliably measuring the droplet size, except at feed phase ratios of φ F = 25 and 30 vol.-% with an impeller speed of N = 425 rpm. The main reasons for droplet adhesion are the usage of simple borosilicate glasses without any coating and the local flow rate in the measurement gap was too low to tear off the droplets. The measured DSDs for all measurement positions are exemplarily depicted for N = 400 rpm and φ F = 10 vol.-% in Figure 6a. It shows identical, almost normally distributed DSDs for every measurement position. Hence, it can be assumed that the DSD generated by the impeller does not change until it leaves the pump-mixer, which indicates an axial-flow regime throughout the vessel. This is reasonable and is caused by the low off-bottom clearance C . = 10 mm, leading to a single-loop pattern [28,29,36,37] in a comparable batch vessel. This was also observed in pump-mixers by other authors using a low off-bottom clearance [7,10].
The normal distributed shape, slightly shifted to a log-normal distribution of the DSD, can be observed in a good approximation for all measured droplet sizes. This indicates a weak coalescence tendency that was already observed in our previous work using the same chemicals [22]. Hence, the DSD is well represented by the Sauter mean diameter, d 32 N , being depicted for N = 425 rpm and feed phase ratios of φ F = 10 and 20 vol.-% in Figure 6b. It can be seen that the Sauter mean diameters were almost identical at different measurement positions and the deviations were within the typical error range of ± 20 µm, which is consistent with our previous studies [22,32]. A consistent DSD between impeller and pump-mixer outlet could only be confirmed for φ F = 10 vol.-% because of the effects of droplet adhesion at higher values as mentioned above. However, it can be assumed that this is also valid for higher feed phase fractions. The measured Sauter mean diameters for all measurement positions are listed in the supplementary material in Table S2. Since the measured DSDs and Sauter mean diameters are almost equal, it can be assumed that at all measurement positions M P 1 3 the DSDs are equal. Since measurement position M P 1 was the only measurement position at which the DSD could always be measured, the following results and effects are discussed on the Sauter mean diameters measured at M P 1 .

3.1.3. Influences on Local Holdup

Figure 7a depicts the local holdup, Φ , at the measurement position M P H for φ F = 20 vol.-%. It can be seen that all holdup measurements showed a linear relation for different impeller speeds. The local holdup, Φ , was between 4 and 12 and is clearly lower than the feed phase ratio φ F , indicating a significantly shorter residence time of the disperse phase in the pump-mixer than the continuous phase. This effect decreased with increasing flow rate, which was also observed by Tang et al. [16]. We can assume that this is less pronounced with increasing impeller speed, but the relationship between flow rate and impeller speed must be considered. As the flow rate depends on impeller speed, this behavior cannot be clearly isolated. We can assume the effect is based on the flow rate and the mean residence time rather than on the impeller speed because identical flow rates lead to equal local holdup independent of the impeller speed. The general trend of lower local holdups with higher mean residence time was also found by Singh et al. [6]. Additionally, they found a holdup larger than the feed phase ratio. This was the opposite in our work, which can be explained by the comparably small mean residence times ( τ ¯ = 0.5 to 2 min) in the work of Singh et al. [6] compared with the ones in our work ( τ ¯ ≈ 8 min to 33 min).
The influence of the feed phase ratio φ F at an impeller speed of N = 425 rpm on the local holdup is exemplarily depicted in Figure 7b. It shows a significant increase of the local holdup with increased feed phase ratio. It can be seen that the holdup was about 5 to 10 vol.-% smaller than the feed phase ratio, which led to less slip between φ F and Φ when φ F was increased. The effect of increased local holdup with higher flow rates can be seen in all measurement points. One exception was found for the measurements at N = 375 rpm and φ F = 30 vol.-%, where the local holdup Φ ≈ 8–14 and the gap between feed phase ratio and local holdup was significantly larger. All measured holdup data are listed in the supplementary material in Table S2 and Figure S1.

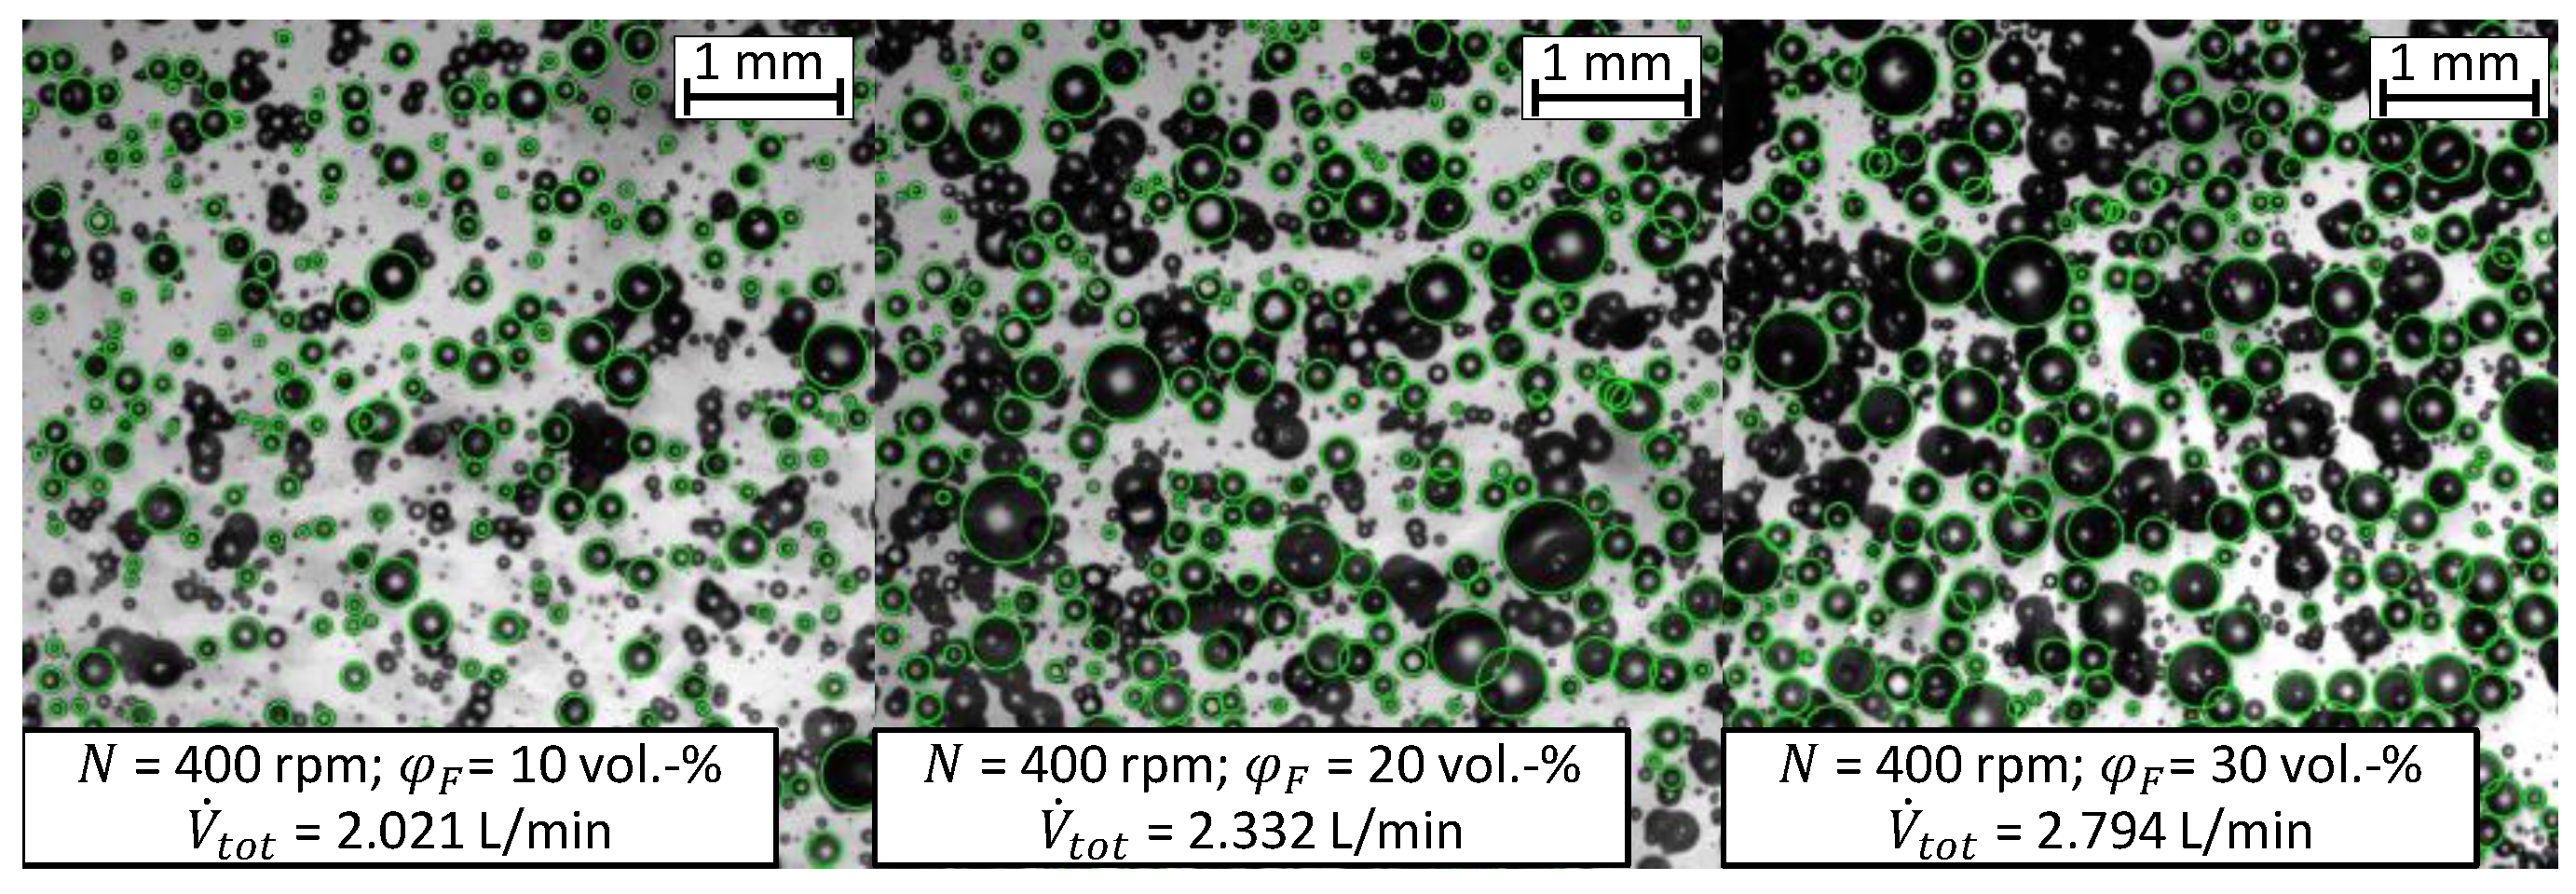
3.1.4. Effects of the Process Parameters on the DSD

Several parameters affect the DSD and the Sauter mean diameter, namely the feed phase ratio, the flow rate, and the impeller speed. The largest and most pronounced influence was found for the feed phase ratio, φ F . The DSDs for N = 375 and 425 rpm are exemplarily depicted in Figure 8 for different feed phase ratios, φ F .
Figure 8a shows that the q 3 distribution shifted towards larger drops with increasing feed phase ratio, φ F , if the impeller speed and flow rate were kept constant. This could be seen with all investigated impeller speeds and flow rates only if the feed phase ratio was varied. This is consistent with observations in literature for batch vessels [23,24]. In general, higher phase fractions lead to more collisions between droplets and therefore increase coalescence. Nevertheless, the degree of the influence of the feed phase ratio, φ F , on the DSD depends on the impeller speed, too. The effect of φ F = 10–20 vol.-% was rather small for N = 375 rpm (see Figure 8a) and larger for φ F > 20 vol.-%. At higher impeller speeds, this effect becomes equally pronounced, which can be seen in the q 3 distributions depicted for N = 425 rpm in Figure 8b, where the effect of φ F on the DSD was almost equal for all feed phase fractions. This effect was also visible in the Sauter mean diameters, which are exemplarily depicted for N = 425 rpm in Figure 9a. All measured DSD data are listed in the supplementary material in Tables S3–S292.
In Figure 9a the Sauter mean diameter for N = 425 rpm shows a linear relationship with respect to the total flow rate V ˙ t o t at a constant feed phase ratio φ F . The slope is almost equal for different feed phase ratios and a constant impeller speed when increasing the Sauter mean diameter by increasing the flow rate. The vertical distance, so to say the difference in the Sauter mean diameters, between the different feed phase ratios (dashed lines) varied and was the highest around the feed phase ratio φ F = 20 vol.-%. This can be seen as a transition point, where assumingly more coalescence is present, and the droplet diameter rises faster. This transition could also be observed for the other impeller speeds and was then even more pronounced. For N = 375 rpm the transition was found at φ F = 20 to 25 vol.-%, while the effect on φ F in other regions was rather negligible. For N = 400 rpm, the transition was more consistent across all values of φ F = 10 to 30 vol.-%. Likewise, Figure 9a, other impeller speeds are shown in the supplementary material in Figures S2 and S3 and all measured Sauter mean diameters are listed in Table S2.
Figure 9b shows the Sauter mean diameter as a function of the total flow rate of all experiments without considering the impeller speed. We can conclude that increasing the feed phase ratio increases the Sauter mean diameter and increasing the flow rate has the same effect but has less impact than the feed phase ratio. The slope of the dashed lines in Figure 9b show that the influence of the flow rate seemed to vary at around φ F = 20 and 25 vol.-%. Additionally, while the values for φ F = 10, 15, and 30 vol.-% were close to their least square lines, the values for the feed phase ratios φ F = 20 and 25 vol.-% were scattered.
The impeller speed had a low impact on the Sauter mean diameter at different feed phase ratios φ F = 10, 20, and 30 vol.-%. The cases for φ F = 10 and 20 vol.-% are depicted in Figure 10a,b. Increasing the impeller speed at φ F = 10 vol.-% led to smaller Sauter mean diameters, as expected from literature [23,24] and previous studies in batch vessels [22]. Generally, a higher impeller speed leads to a higher energy dissipation and thus smaller droplets (see Figure 10a). This trend is present for the feed phase ratio φ F = 10 vol.-%. In addition, the influence of the flow rate increased for lower impeller speeds, because the slopes of the dashed lines are flatter at lower impeller speeds. From Figure 10b, it can be seen that this behavior changes at a feed phase ratio of φ F = 20 vol.-% because all Sauter mean diameters were more or less on one line. This indicates that the Sauter mean diameter at this feed phase ratio was mostly independent of the impeller speed. However, as long as the volume flow at the operating point is the same, the impeller speed has little to no significance on the Sauter mean diameter. It can be assumed that in the transition region, where collision and therefore coalescence suddenly increase (around φ F = 20 vol.-%), the additional energy dissipation caused by the impeller speed is compensated. This indicates that the impeller speed has no impact, but this is only true for this specific feed phase ratio.
Investigating this for the feed phase ratio φ F = 30 vol.-% gives the Sauter mean diameter depicted in Figure 11a, where at a φ F = 30 vol.-% the impeller speed N = 400 rpm produces the smallest Sauter mean diameters. This is counterintuitive, as a larger impeller speed generally lead to smaller droplets. However, the DSD at N = 400 rpm depicted in Figure 11b showed a large peak at around d = 40–60 µm, which are fine emulsified droplets. We assume that this emulsification is a result of an increased energy dissipation. Since the most emulsification was found at N = 400 rpm compared with the other impeller speeds, we assume the highest energy dissipation is at N = 400 rpm. Additionally, data for φ F = 15 and 25 vol.-% are shown in the supplementary material in Figure S4.

3.2. Modelling

Parameter Analysis

A standard approach according to Equation (1) by Doulah [25] for stirred batch vessels was utilized because Equation (4) by Singh et al. [6] predicts increasing Sauter mean diameters at increased impeller speeds. This is due to relatively large flow rates where the energy dissipation at larger impeller speed decreased significantly due to the flow rate. The drawback of Equation (1) by Doulah [25] is that no flow rate is considered as it was developed for batch vessels and a modified approach led to Equations (9) and (10). The dependencies of the correlation constants on impeller speed are depicted in Figure 12 and corresponding values and confidence intervals are given in Table 3.
All data of Exp. 1 for N = 375 and 425 rpm were used to fit Equation (9) for those impeller speeds. For N = 400 rpm, the Sauter mean diameters and process parameters were taken from Exp. 2, because the measured Sauter mean diameters had less fluctuations in the data. Only the set for φ F = 20 and N = 400 rpm was excluded, since the Sauter mean diameters were found to be sensitive in this region and had larger deviations between Exp. 1 and Exp. 2.
The ordinate, A 0 , and the slope, A 1 , at each impeller speed showed approximately similar values. A larger variation was found with B ( V ˙ t o t ) where the slope B 1 and the offset B 0 varies at different impeller speeds and their values were the largest for N = 425 rpm. The slope of B ( V ˙ t o t ) is questionable because B 1 had an extremely large confidence interval (changing from positive to negative values). We can conclude that the coefficients for A ( V ˙ t o t ) only have a small dependency on N and V ˙ t o t , strongly aligning with the Hinze–Kolmogorov theory [18] where A only depends on the impeller type. The coefficients B 0 and B 1 are more sensitive to the process parameters, especially at small flow rates (see Figure 12b). Nevertheless, when calculating the mean coefficients for the slope and the offset of A ( V ˙ t o t ) and B ( V ˙ t o t ) (see Table 3), one overall equation can sufficiently describe the data.
d 32 D = A ( V ˙ t o t ) ( 1 + B ( V ˙ t o t ) φ F ) W e T 0.6 = ( 1297   s · m 3 · V ˙ t o t + 0.077 ) · [ 1 + ( 22,589   s · m 3 · V ˙ t o t + 3 ) φ F ] W e T 0.6
or as an apparatus independent form using the mean residence time τ ¯ :
d 32 D = ( A 0 1 τ ¯ + A 1 ) · ( 1 + ( B 0 · 1 τ ¯ + B 1 ) φ F ) W e T 0 , 6   = ( 33   s · 1 τ ¯ + 0.077 ) · [ 1 + ( 575   s · 1 τ ¯ + 3 ) φ F ] W e T 0 , 6
A plot of Equation (11) and the parity plot are shown in Figure 13a,b. It shows that the new correlation is capable of describing all of the experimental data. Larger deviations were especially found at higher values of φ F at an impeller speed of N = 400 rpm as discussed above (see Figure 11b). The good quality of the correlation can also be seen in the parity plot in Figure 13b where 152 of 155 experimentally measured Sauter diameters can be described within a 15% error range. The three values outside the 15% error range are caused by an accumulation of the error range of the shadowgraphic probe and the fitting.

4. Conclusions

In this work, a continuously operated DN 300 General Mills designed pump-mixer was investigated in detail considering the pumping behavior and hydrodynamics in a water/paraffin oil system using a shadowgraphic optical probe. The paraffin oil had an around ten times higher viscosity as compared with water. It was found that φ F , max ≈ 33 vol.-% is the maximum feed phase ratio in an operation without any external pumps. Quadratic pumping performance curves for the pump-mixer in a General Mills design were estimated at N = 375, 400, and 425 rpm with a maximum total flow rate of V ˙ t o t ≈ 3.3 L/min at 425 rpm and a maximum head for water of around H c o n t i = 120 to 150 mm. The pumping curve of the continuous phase was found to be minimally higher when the feed phase ratio φ F was increased. This is negligible for this setup, but may change with other impeller types.
The local holdup in the tank was smaller than the feed phase ratio, which was found by taking volumetric samples of the upper half of the vessel. This is a difference compared with an ideal batch vessel, where local and integral holdups have similar values. It was also found that increasing only the flow rate increases the holdup, which is consistent with the literature [16]. Higher local holdups were measured at high feed phase ratios with a maximum of approximately 22 vol.-%.
An image-based shadowgraphic probe with subsequent analysis via a neural network was inserted at three different measurement positions to measure the DSD at the bottom, middle, and outlet of the vessel. While measuring in the middle of the tank was always possible due to local high turbulence as no droplets were attached to the probe, the other positions were limited in that respect. The bottom position near the impeller could be used, except at the highest impeller speed N = 425 rpm at feed phase ratios φ F > 20 vol.-%. The high impeller speed induced a high circular flow in the impeller region, which did not align with the flow direction. The measurement position at the outlet of the vessel was limited to feed phase ratios φ F < 20 vol.-% since the flow velocity at the outlet weir was comparably low compared to the mixing vessel. At higher feed phase ratios droplets were adsorbed at the probe and hindered an analysis.
The volume and number of DSDs were estimated at high resolution and statistically significant numbers with at least 120,000 drops. It was found that the DSD was almost identical at all three measurement positions; therefore, one can assume an axial pumping behavior. It was also observed that the Sauter mean diameter increased with increased feed phase ratio as coalescence tendency increased and larger drops were formed. This was found to be a spontaneous transition for lower impeller speeds ( N = 375 rpm, φ F ≈ 10 vol.-%) and a more transient evolution for higher impeller speeds ( N = 400 and 425 rpm).
An increase of the flow rate had the same effect because the energy of the impeller was distributed to a larger mass of fluid and decreased the energy dissipation, resulting in larger droplets, which was also found by Singh et al. [6].
For the high-feed-phase ratios of 30 vol.-%, the smallest droplet sizes were found for the middle impeller speed, N = 400 rpm. An emulsification at this condition could be repeatedly confirmed by the optical images and the q 0 distributions.
A Sauter mean diameter correlation of Doulah [25] for batch vessels was modified and utilized to describe a large data set of Sauter mean diameters within a 15% error range. Individual consideration for each impeller speed showed similar trends and as a final result a unified equation covering the complete data set is a more a more applicable approach for technical use. The extensive data base in the supplementary material can easily be used and extended in future work (different geometries, chemical systems, modeling, etc.).

Supplementary Materials

The following supporting information can be downloaded at: https://www.mdpi.com/article/10.3390/app12168195/s1, Figure S1: local holdup measurements; Figures S2–S4: Sauter mean diameters Table S1: measured torques, flow rates and heads; Table S2: measured Sauter mean diameters and local holdups; Tables S3–S292 calculated number and volume distributions. The data are additionally available as Excel-files.

Author Contributions

Conceptualization, D.W., K.R. and M.H.; methodology, D.W.; software, D.W.; validation, D.W., S.G.; formal analysis, D.W.; investigation, D.W., S.G.; resources, E.v.H. and H.-J.B.; data curation, D.W., S.G.; writing—original draft preparation, D.W and A.F.; writing—review and editing, D.W., S.G., A.F., K.R., M.H., E.v.H., H.-J.B.; visualization, D.W.; supervision, A.F., E.v.H., H.-J.B. and R.S.; project administration, H.-J.B., E.v.H. and R.S.; funding acquisition, H.-J.B. and R.S. All authors have read and agreed to the published version of the manuscript.

Funding

This research was funded by German Research Foundation, grant number 395373747 and the Research Initiative “Nanokat” of the Federal State of Rhineland-Palatinate.

Institutional Review Board Statement

Not applicable.

Informed Consent Statement

Not applicable.

Data Availability Statement

All data are listed in the provided Supplementary Materials.

Acknowledgments

The authors gratefully acknowledge the German Research Foundation (DFG) (Project “Extraktion in Pump-Mischern bei Anwesenheit von Feststoffen”, project number: 395373747) and the Research Initiative “Nanokat” of the Federal State of Rhineland-Palatinate for financial support. We also like to thank Justin Tran for proofreading.

Conflicts of Interest

The authors declare no conflict of interest. The funders had no role in the design of the study; in the collection, analyses, or interpretation of data; in the writing of the manuscript, or in the decision to publish the results.

References

  1. Gordon, J.J.; Zeigler, J.H. Apparatus for Extracting. U.S. Patent Nr. 2,176,899, 24 October 1934. Serial No. 751,843, 7 filed November 1934 and granted 1939. [Google Scholar]
  2. Godfrey, J.C. (Ed.) Liquid-Liquid Extraction Equipment; Wiley: Chichester, UK, 1994. [Google Scholar]
  3. Singh, K.K.; Shenoy, K.T.; Mahendra, A.K.; Ghosh, S.K. Artificial neural network based modelling of head and power characteristics of pump-mixer. Chem. Eng. Sci. 2004, 59, 2937–2945. [Google Scholar] [CrossRef]
  4. Singh, K.K.; Mahajani, S.M.; Shenoy, K.T.; Patwardhan, A.W.; Ghosh, S.K. CFD modeling of pilot-scale pump-mixer: Single-phase head and power characteristics. Chem. Eng. Sci. 2007, 62, 1308–1322. [Google Scholar] [CrossRef]
  5. Singh, K.K.; Mahajani, S.M.; Shenoy, K.T.; Ghosh, S.K. CFD modeling of pump-mix action in continuous flow stirred tank. AIChE J. 2008, 54, 42–55. [Google Scholar] [CrossRef]
  6. Singh, K.K.; Mahajani, S.M.; Shenoy, K.T.; Ghosh, S.K. Representative drop sizes and drop size distributions in A/O dispersions in continuous flow stirred tank. Hydrometallurgy 2008, 90, 121–136. [Google Scholar] [CrossRef]
  7. Srilatha, C.; Savant, A.R.; Patwardhan, A.W.; Ghosh, S.K. Head–flow characteristics of pump-mix mixers. Chem. Eng. Process. Process. Intensif. 2008, 47, 1678–1692. [Google Scholar] [CrossRef]
  8. Srilatha, C.; Morab, V.V.; Mundada, T.P.; Patwardhan, A.W. Relation between hydrodynamics and drop size distributions in pump–mix mixer. Chem. Eng. Sci. 2010, 65, 3409–3426. [Google Scholar] [CrossRef]
  9. Srilatha, C.; Mundada, T.P.; Patwardhan, A.W. Scale-up of pump-mix mixers using CFD. Chem. Eng. Res. Des. 2010, 88, 10–22. [Google Scholar] [CrossRef]
  10. Tabib, M.; Lane, G.; Yang, W.; Schwarz, M.P. CFD Simulation of a Solvent Extraction Pump Mixer Unit: Evaluating Large Eddy Simulation RANSBased Models. J. Comput. Multiph. Flows 2010, 2, 165–178. [Google Scholar] [CrossRef]
  11. Tabib, M.V.; Lane, G.; Yang, W.; Schwarz, M.P. CFD study of single phase and multiphase (liquid–liquid) pump-mixer: Analyzing design parameters, flow structures and turbulence. Chem. Eng. Sci. 2012, 80, 55–69. [Google Scholar] [CrossRef]
  12. Zhou, H.; Yu, X.; Jing, S.; Zhou, H.; Lan, W.; Li, S. Measurement of droplet breakage in a pump-mixer. Chem. Eng. Sci. 2019, 195, 23–38. [Google Scholar] [CrossRef]
  13. Zhou, H.; Yang, J.; Jing, S.; Lan, W.; Zheng, Q.; Li, S. Influence of Dispersed-Phase Viscosity on Droplet Breakup in a Continuous Pump-Mixer. Ind. Eng. Chem. Res. 2019, 58, 23458–23467. [Google Scholar] [CrossRef]
  14. Zhou, H.; Yu, X.; Wang, B.; Jing, S.; Lan, W.; Li, S. CFD–PBM Simulation of Liquid–Liquid Dispersions in a Pump-Mixer. Ind. Eng. Chem. Res. 2021, 60, 1926–1938. [Google Scholar] [CrossRef]
  15. Tang, Q.; Ye, S.; Wang, Y.; Liu, Z. A study on liquid-liquid dispersions in a continuous mixer via computational fluid dynamics (CFD) simulation combined with population balance model (PBM). Can. J. Chem. Eng. 2018, 87, 507. [Google Scholar] [CrossRef]
  16. Tang, Q.; Zhang, J.; Wu, Y.; Wang, Y.; Liu, Z. An experimental study of immiscible liquid–liquid dispersions in a pump–mixer of mixer–settler. Chin. J. Chem. Eng. 2020, 28, 33–45. [Google Scholar] [CrossRef]
  17. Kolmogorov, A. The Local Structure of Turbulence in Incompressible Viscous Fluid for Very Large Reynolds’ Numbers. Dokl. Akad. Nauk SSSR 1941, 30, 301–305. [Google Scholar]
  18. Hinze, J.O. Fundamentals of the hydrodynamic mechanism of splitting in dispersion processes. AIChE J. 1955, 1, 289–295. [Google Scholar] [CrossRef]
  19. Angle, C.W.; Hamza, H.A. Predicting the sizes of toluene-diluted heavy oil emulsions in turbulent flow Part 2: Hinze–Kolmogorov based model adapted for increased oil fractions and energy dissipation in a stirred tank. Chem. Eng. Sci. 2006, 61, 7325–7335. [Google Scholar] [CrossRef]
  20. Cull, S.G.; Lovick, J.W.; Lye, G.J.; Angeli, P. Scale-down studies on the hydrodynamics of two-liquid phase biocatalytic reactors. Bioprocess Biosyst. Eng. 2002, 25, 143–153. [Google Scholar]
  21. Zerfa, M.; Brooks, B.W. Prediction of vinyl chloride drop sizes in stabilised liquid-liquid agitated dispersion. Chem. Eng. Sci. 1996, 51, 3223–3233. [Google Scholar] [CrossRef]
  22. Wirz, D.; Friebel, A.; Rave, K.; Hermes, M.; Skoda, R.; Harbou Ev Bart, H.-J. Experimental Investigation and Modelling of the Droplet Size in a DN300 Stirred Vessel at High Disperse Phase Content Using a Telecentric Shadowgraphic Probe. Appl. Sci. 2022, 12, 4069. [Google Scholar] [CrossRef]
  23. Kraume, M. Transportvorgänge in der Verfahrenstechnik; Springer: Berlin/Heidelberg, Germany, 2012. [Google Scholar]
  24. Zlokarnik, M. Stirring: Theory and Practice; Wiley-VCH: Weinheim, Germany; Chichester, UK, 2010. [Google Scholar]
  25. Doulah, M.S. An effect of hold-up on drop sizes in liquid-liquid dispersions. Ind. Eng. Chem. Fundam. 1975, 14, 137–138. [Google Scholar] [CrossRef]
  26. Gäbler, A.; Wegener, M.; Paschedag, A.R.; Kraume, M. The effect of pH on experimental and simulation results of transient drop size distributions in stirred liquid–liquid dispersions. Chem. Eng. Sci. 2006, 61, 3018–3024. [Google Scholar] [CrossRef]
  27. Schäfer, J.; Schmitt, P.; Hlawitschka, M.W.; Bart, H.-J. Measuring Particle Size Distributions in Multiphase Flows Using a Convolutional Neural Network. Chem. Ing. Tech. 2019, 83, 992. [Google Scholar] [CrossRef]
  28. Rave, K.; Lehmenkühler, M.; Wirz, D.; Bart, H.-J.; Skoda, R. 3D flow simulation of a baffled stirred tank for an assessment of geometry simplifications and a scale-adaptive turbulence model. Chem. Eng. Sci. 2021, 231, 116262. [Google Scholar] [CrossRef]
  29. Rave, K.; Hermes, M.; Wirz, D.; Hundshagen, M.; Friebel, A.; Harbou Ev Bart, H.-J.; Skoda, R. Experiments and fully transient coupled CFD-PBM 3D flow simulations of disperse liquid-liquid flow in a baffled stirred tank. Chem. Eng. Sci. 2022, 120, 117518. [Google Scholar] [CrossRef]
  30. Mickler, M.; Bart, H.-J. Optical Multimode Online Probe: Erfassung und Analyse von Partikelkollektiven. Chem. Ing. Tech. 2013, 85, 901–906. [Google Scholar] [CrossRef]
  31. Wirz, D.; Bart, H.-J. Advances in particle size analysis with transmitted light techniques. Bulg. Chem. Commun. 2020, 52, 554–560. [Google Scholar]
  32. Wirz, D.; Hofmann, M.; Lorenz, H.; Bart, H.-J.; Seidel-Morgenstern, A.; Temmel, E. A Novel Shadowgraphic Inline Measurement Technique for Image-Based Crystal Size Distribution Analysis. Crystals 2020, 10, 740. [Google Scholar] [CrossRef]
  33. Lichti, M.; Bart, H.-J. Bubble size distributions with a shadowgraphic optical probe. Flow Meas. Instrum. 2018, 60, 164–170. [Google Scholar] [CrossRef]
  34. Villwock, J.; Gebauer, F.; Kamp, J.; Bart, H.-J.; Kraume, M. Systematic Analysis of Single Droplet Coalescence. Chem. Eng. Technol. 2014, 37, 1103–1111. [Google Scholar] [CrossRef]
  35. Gebauer, F. Fundamentals of Binary Droplet Coalescence in Liquid-Liquid Systems, Dissertation. Technical University of Kaiserslautern, Kaiserslautern, Germany, 2018. [Google Scholar]
  36. Montante, G.; Brucato, A.; Lee, K.C.; Yianneskis, M. An experimental study of double-to-single-loop transition in stirred vessels. Can. J. Chem. Eng. 1999, 77, 649–659. [Google Scholar] [CrossRef]
  37. Montante, G.; Lee, K.C.; Brucato, A.; Yianneskis, M. Numerical simulations of the dependency of flow pattern on impeller clearance in stirred vessels. Chem. Eng. Sci. 2001, 56, 3751–3770. [Google Scholar] [CrossRef]
Figure 1. Scheme of the DN300 pump-mixer-settler.
Applsci 12 08195 g001
Figure 2. Geometry of the DN300 pump-mixer in accordance with the General Mills design.
Applsci 12 08195 g002
Figure 3. Measurement positions M P 1 3 in the DN300 General Mills pump-mixer.
Applsci 12 08195 g003
Figure 4. Examples of the image analyses by the CNN-based method. The images were taken at different feed phase fractions at measurement position M P 1 .
Applsci 12 08195 g004
Figure 5. (a) Measured heads and flow rates for N = 400 rpm. (b) Measured heads and flow rates of the continuous phase for N = 375, 400, and 425 rpm for all measured feed phase ratios. The lines are the pumping curves calculated as quadratic polynomials as a guide for the eye.
Applsci 12 08195 g005
Figure 6. (a) Measured DSDs at different positions M P 1 3 for N = 400 rpm and φ F = 10 vol.-%; (b) Sauter mean diameter for the feed phase ratios φ F = 10 and 20 vol.-% at N = 425 rpm. A measurement at the upper location M P 2 with a feed phase ratio φ F = 20 vol.-% was not possible due to droplet adhesion at the probe windows.
Applsci 12 08195 g006
Figure 7. (a) Measured local holdup at the position M P H at different impeller speeds and a feed phase ratio φ F = 20 vol.-%; (b) measured local holdup at the position M P H at a constant impeller speed N = 425 rpm and different feed phase ratios.
Applsci 12 08195 g007
Figure 8. (a) Measured DSDs at an impeller speed of N = 375 rpm, a total flow rate of V ˙ t o t ≈ 1.2 L/min at different feed phase ratios measured at position M P 1 . (b) Measured DSD’s at an impeller speed of N = 425 rpm, a total flow rate of V ˙ t o t ≈ 1.3 L/min at different feed phase ratios measured at position M P 1 .
Applsci 12 08195 g008
Figure 9. (a) Measured Sauter mean diameters for N = 425 rpm at measurement position M P 1 at different feed phase ratios φ F and total flow rates V ˙ t o t . The dashed lines are linear least square lines as a guide for the eye. (b) Measured Sauter mean diameters at all impeller speeds N = 375, 400, and 425 rpm at different feed phase ratios and flow rates. The dashed lines are linear fits as a guide for the eyes. All Sauter mean diameters are measured at measurement position M P 1 .
Applsci 12 08195 g009
Figure 10. Sauter mean diameter at measurement position M P 1 at a feed phase ratio of (a) 10 and (b) 20 vol.-%. The dashed lines are least square lines as a guide for the eye.
Applsci 12 08195 g010
Figure 11. (a) Sauter mean diameters at measurement position M P 1 at a feed phase ratio of 30 vol.-%. (b) Measured DSD at different impeller speed at measurement position M P 1 , a feed phase ratio of φ F = 30 vol.-%, and a total flow rate V ˙ t o t = 1.33 L/min. The lines are a guide to the eye.
Applsci 12 08195 g011
Figure 12. Function of (a) A ( V ˙ t o t ) and (b) B ( V ˙ t o t ) over the total flow rate V ˙ t o t with the parameters of Table 3 at N = 375, 400, and 425 rpm.
Applsci 12 08195 g012
Figure 13. (a) Experimental data and Equation (11) as solid line. (b) Parity plot of all experiments versus Equation (11).
Applsci 12 08195 g013
Table 1. Dimensions of the measurement positions measured from the top edge of the suction orifice to the middle of the measurement position.
Measurement
Position
Measurement Heightin mmMeasurement
Radius
in mm
M P 1 H 1 195.0 r 1 75.0
M P 2 H 2 332.5 r 2 290.0
M P 3 H 3 59.0 r 3 115.0
M P H H 4 240.0 r 4 75.0
Table 2. Physical properties of the chemicals.
Substance Density   ρ in kg/m3 Kinematic   Viscosity   ν in mm2/s Interfacial Surface
Tension   σ d , c s a t   in   mN / m
Wer + Na2SO4 (50 mmol/L)10001.0-
Paraffin oil FC 200682513.137
Table 3. Determined coefficients for Equation (9) at different impeller speeds, the mean values for Equation (10), and their corresponding confidence intervals.
Impeller Speed in rpmConstantsConfidence Intervals (95 %)
A 0 A 1 in s·m−3 B 0 B 1 in s·m−3 A 0 A 1 in s·m−3 B 0 B 1 in s·m−3
3750.07214342.4–10,3900.04048 to 0.1044199.3 to 26680.436 to 4.369–81,550 to 60,770
4000.08912021.9–84080.07799 to 0.09957844.4 to 15591.369 to 2.424–24,660 to 7848
4250.06912565.0–48,9700.05464 to 0.08277870.7 to 16413.916 to 6.157–76,170 to –21,770
Mean value A ¯ 0 A ¯ 1 in s·m−3 B ¯ 0 B ¯ 1 in s·m−3
0.07712973.1–22,589
Publisher’s Note: MDPI stays neutral with regard to jurisdictional claims in published maps and institutional affiliations.

