Featured Application
Automatic evaluation for timber in construction. Currently, humans conduct this evaluation. It is tedious and time-consuming. CNN is suitable because it can incorporate subjective human evaluations and reduce time and human effort.
Abstract
Cedar and other timbers used for construction generally undergo a high-temperature drying process after being harvested to maintain their quality. However, internal cracks occur during this process. This is an issue because it deteriorates the structural performance, such as buckling strength and joint durability of the timber. Since preventing these internal cracks is difficult, their severity must be examined manually. Currently, the length, thickness, and area of the cracks on a cross-sectional surface of square timber are measured using calipers. However, this process is time-consuming and labor-intensive. Therefore, we employed a convolutional neural network (CNN), widely used in artificial intelligence applications, to automatically evaluate the severity of cracks from cross-sectional images of timber. A novel CNN was constructed and experimentally evaluated in this study. The average classification accuracy was 85.67%.
1. Introduction
Timber used as building material, such as cedar, goes through a drying process after being cut from the woods. This drying process primarily improves its strength. Additionally, drying is essential to stabilize the quality of timber: it prevents changes in size and shape, and the growth of bacteria. Furthermore, the weight reduction due to lower moisture content leads to lower transportation costs. High-temperature drying is the generally employed process [1]; however, it leads to significant internal cracking invisible from outside [2], as shown in Figure 1.
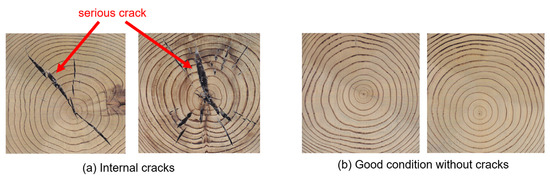
Figure 1.
Pictures of the internal cross-section of timber. (a) Timber samples with critical cracks not found from outside; (b) good condition dried timber.
Cracking is a problem because it deteriorates structural performance parameters, such as buckling strength and joint durability [3,4]. Therefore, many researchers have investigated the mechanism of cracking propagation during the drying process [5,6]. Since completely preventing cracking is impractical, we need to evaluate the severity of these cracks in the timber used for construction.
To assess the severity of internal cracks, workers check a cross-sectional view of a square piece of timber and measure the length, thickness, and area of the cracks using calipers. However, this method of examination is time- and labor-intensive. Therefore, to facilitate the automatic evaluation of internal cracks, we propose a convolutional neural network (CNN) [7,8]. CNNs are widely used in image recognition applications using artificial intelligence. If such a computational system is realized, the effort and time required for the manual inspection of timber will reduce. The aim of this study was to develop a CNN capable of classifying crack severity in lieu of a worker, as shown in Figure 2. To check timber quality, the timber specimen is first cut as shown in Figure 2a. Next, a special silver paint is sprayed onto the timber piece to highlight the cracks on the cross section. Since visual inspection is labor-intensive, as shown in Figure 2c, the CNN is used to evaluate the cracks, as shown in Figure 2d. Finally, with the proposed system, human intervention for timber inspection can be completely avoided in the future.
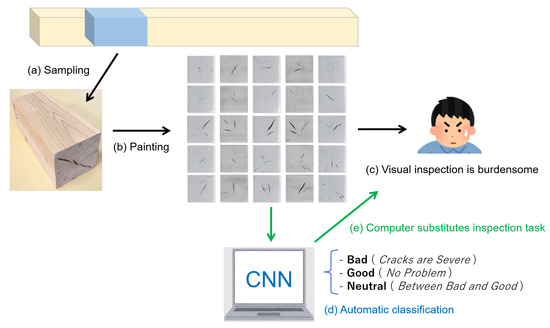
Figure 2.
Schematic of the proposed system. (a) Timber samples; (b) silver-painted cross sections highlight cracks; (c) human inspection of crack severity; (d) automatic classification of crack severity using the proposed CNN; (e) finally, the computer will substitute the inspection task.
Previous studies have attempted to estimate the state of invisible internal cracks from the propagation characteristics of acoustic vibrations [9,10,11]. Some studies employed CNNs to recognize defects in timber. A method to automatically detect cracks in wooden surfaces has been previously reported [12]. In addition, a method for the automatic detection of defects in wood, such as splits, knots, and molds, has been developed [13,14]. Unlike previous research, our study attempted to automatically evaluate the level of crack severity in a cross section of timber that has been cut and made directly visible. Additionally, we developed a CNN to detect crack severity but not defects.
The rest of this paper is organized as follows: Section 2 describes the preparation of square cedar cross-sectional images used in this study. Section 3 describes the structure of the proposed CNN. Section 4 discusses the evaluation experiments and their results. Finally, Section 5 concludes the study with a summary and direction for future work.
2. Preparation of Timber Cross-Section Image
As shown in Figure 3, a 3000 mm-long high-temperature, dried cedar square timber was cut at four positions from P1 to P4. Then, a silver spray (ROVAL RS-420ML) was applied to enhance the visibility of the cracks, as shown in Figure 2. Silver-painted images at positions P1–P4 were captured with a scanner (Canon CanoScan LiDE 700F) for 32 identical cedar timbers. Therefore, a total of 128 images (32 pieces × 4 positions) were obtained. Note that only one photo was taken at each cutting position.
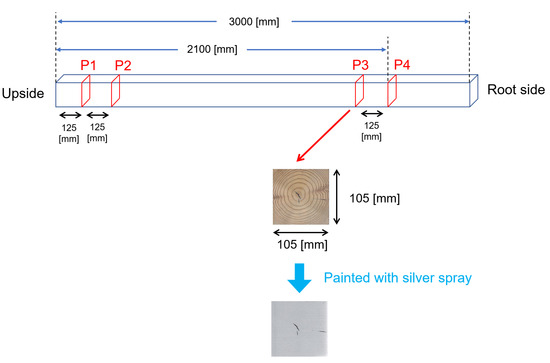
Figure 3.
Schematic of the 3000 mm-long cedar timber used for obtaining images. It has a square cross-section area of 105 × 105 mm2. Silver paint is sprayed to enhance the visibility of the cracks in the cross section.
Figure 4 shows the images of before and after being painted; S5 in Figure 4 shows that the silver spray can highlight even thin cracks on the surface of the cross section. In this study, coating the timber pieces with silver paint was considered the first step in our study.
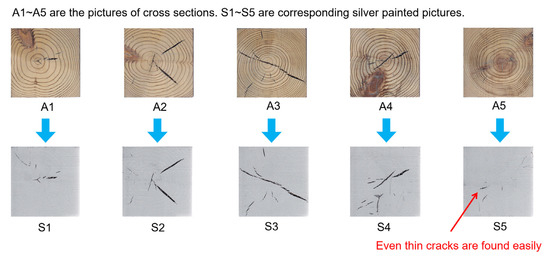
Figure 4.
Silver-painted cross-sectional images.
A total of 128 images were classified by timber quality control experts as “Bad,” “Good,” and “Neutral” based on crack severity. Figure 5 shows a portion of the entire classification set. The images in the “Bad” category have many large cracks, while the “Good” ones have almost no cracks. Accordingly, the “Neutral” category has images with crack severity between those of the “Good” and “Bad” categories. From the dataset of 128 images, 49 “Bad,” 33 “Good,” and 46 “Neutral” images were obtained.
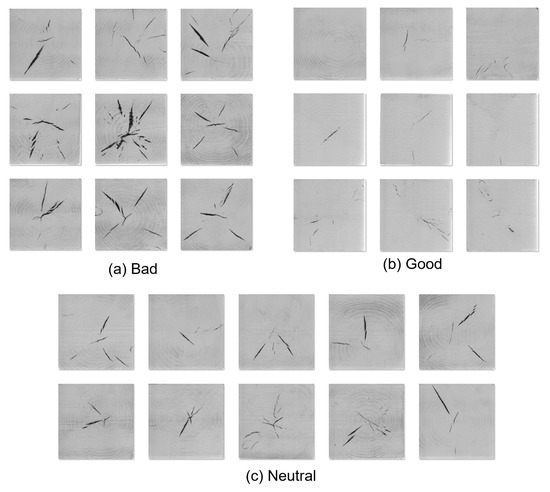
Figure 5.
Examples of expert’s classification based on crack severity. (a) Potentially risky to use in construction due to large cracks. (b) It is clearly safe. (c) It is safe with almost no major cracks.
3. Simple CNN Configuration
Figure 6 shows the schematic of a simple CNN architecture. The input image is a grayscale image of 500 × 500 pixels. As shown in Figure 6, convolution operations are performed three times (Conv1–Conv3) [7]. The output of the CNN is the classification result of an input image, which can be “Bad,” “Good,” or “Neutral.” This implies that only one class with the highest value in the output of the Soft-Max layer is considered as the classification result.
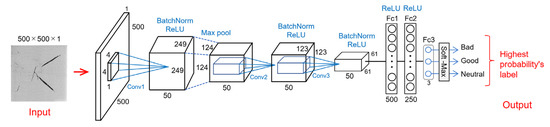
Figure 6.
Architecture of the proposed simple CNN.
Table 1 and Figure 7 illustrate the feedforward calculation of the CNN. A breakdown of the calculations for the size of the feature maps and the output by convolution operations is provided. “BatchNorm” refers to the batch normalization operation [15]. It adjusts the scale between different mini batches and prevents network overfitting (over-adaptation to training data). Most of the recently proposed deep networks, such as ResNet [16] and DenseNet [17], employ batch normalization. ReLU (Rectified Linear Units) operation [18] is commonly used in CNNs. ReLU operation has been adopted in many well-known CNNs from around 2010, such as Alexnet [19], Vgg [20], and Googlenet [21]. For instance, ResNet [16] is applied for object detection [22] in an RGB image. By contrast, the proposed shallow CNN deals with gray-scale images. The famous pre-trained CNNs [16,17,19,20,21] are trained with RGB color images of the ImageNet, including 1000 kinds of objects such as fish, houses, flowers, tigers, and so on. In the instance that the number of available training data is small, pre-trained CNNs would be applied by fine tuning (transfer-learning); however, pre-trained CNNs need large memory capacity; therefore, they are not suitable for edge computing. The proposed shallow CNN is suitable for memory saving and computational resources.

Table 1.
CNN feedforward calculation.
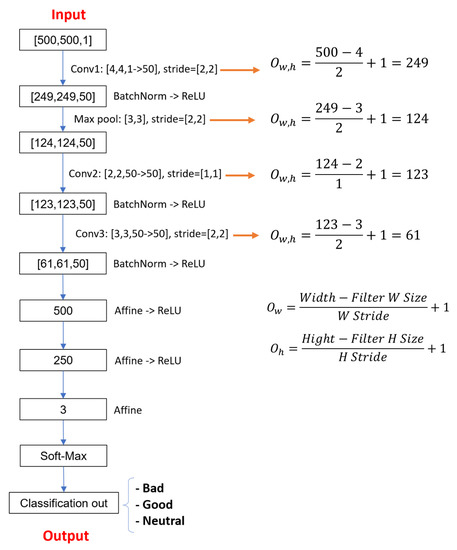
Figure 7.
CNN feedforward flow.
4. Validation of the Proposed Simple CNN
Experiments were conducted to evaluate the classification accuracy of the CNN for the 128 images (Bad: 49, Good: 33, Neutral: 46) described in Section 2. It is not always possible to collect enough data to evaluate a machine learning model [23]. Therefore, the training image data were augmented by flipping the images left and right, up and down, and rotating them to increase the size of the training dataset virtually. This augmentation of training image data allows the CNN to learn the common features required for inference.
Furthermore, we employed repeated random subsampling validation. This generates datasets comprising various combinations of training and test images and evaluates their accuracy. We employed this because the available data is limited.
4.1. Training of CNN
The training dataset was augmented, as shown in Figure 8. Random left-to-right flipping (Figure 8a), up-and-down flipping (Figure 8b), and random clockwise rotation over 0–360° (Figure 8c) were performed on the training images.
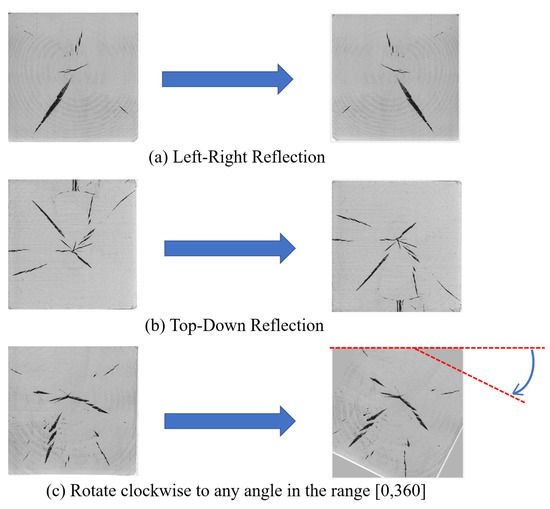
Figure 8.
Augmentation of CNN training dataset. (a) Left–right reflection is performed in 50% of images; (b) top-down reflection is performed in 50% of images; (c) random clockwise rotation from 0–360° is performed for 100% of cases in the training phase.
CNN training was divided into First Half and Last Half, as shown in Table 2. It also enumerates the training conditions for the CNN.
Table 2.
CNN training condition.
In Last Half, training was performed with unrotated images. In the repeated random subsampling validation, the 128 images were divided into 113 images for training and 15 images for testing, as shown in Figure 9.
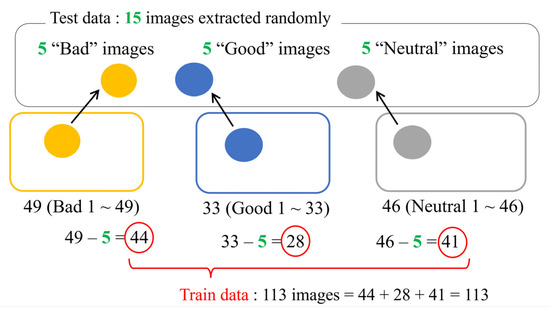
Figure 9.
Overview of repeated random subsampling validation.
Note that we determined the hyperparameters shown in Table 2 and CNN configuration illustrated in Figure 6 and Figure 7 in a heuristic manner.
After training the CNN, its classification accuracy was evaluated using a set of 15 test images not used for training. Figure 10 shows the change in loss during the training phase for each trial with different datasets. We adopted a cross-entropy error function [24] for loss calculation to minimize error. We confirmed that the loss decreased as the epoch progressed. Thereby, we concluded that learning was performed appropriately in all trials.
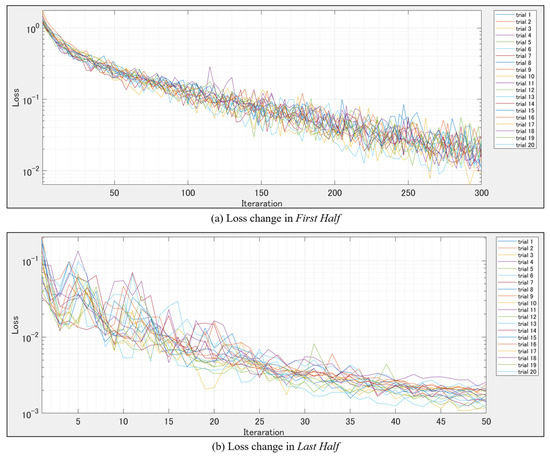
Figure 10.
Loss in each epoch.
4.2. Testing the CNN
Table 3 shows the IDs of the data images not used to train the CNN and to evaluate its accuracy in each trial. Figure 11a shows the classification accuracy for test images not used for training the CNN (different datasets). In all the trials, the accuracy was higher than 70%, and the mean accuracy was 85.67%. As demonstrated in the confusion matrix in Figure 11b, misjudged “Bad” and “Good” images were classified as “Neutral” in all the trials.
Table 3.
CNN testing results.
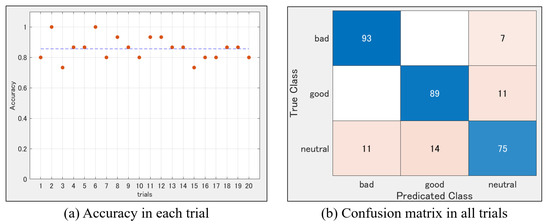
Figure 11.
Test results. (a) Accuracy during each trial; (b) confusion matrix showing that the CNN did not confuse between “Bad” and “Good” images.
Figure 12 shows the misclassified images. Figure 12a,b display actual “Bad” and “Good” images, respectively. This shows that the CNN performs classification like a human because such distinguishment includes boundary fuzziness [25]. However, in the future, we will explore suitable methodology to judge the order of “bad,” “neutral”, and “good”.
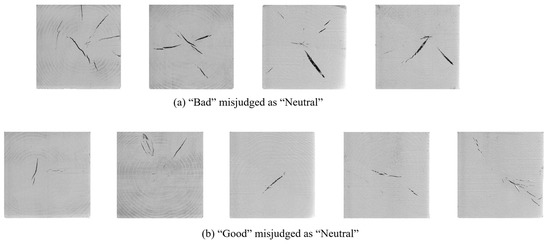
Figure 12.
Misjudged Images (a) “Bad” images classified as “Neutral”; (b) “Good” images classified as “Neutral”.
Figure 13 shows the misclassified images as well. Figure 13a,b display actual “Neutral” images classified as “Bad” and “Good” images, respectively.
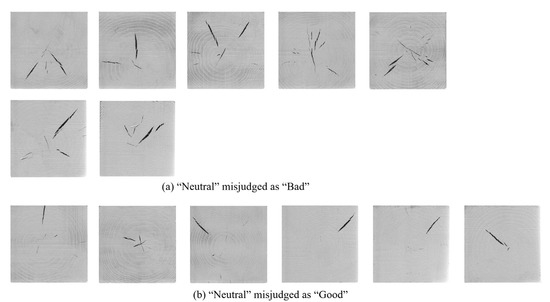
Figure 13.
Misjudged Images (a) “Neutral” images classified as “Bad”; (b) “Neutral” images classified as “Good”.
The proposed system could distinguish the images between “Bad” and “Good.” However, the Neutral-like images were hard to classify. On the other hand, misjudged “Bad” images look like “Neutral.” Therefore, “Neutral” evaluated images are close to “Good.” By increasing training data, the CNN can remove “Bad” specimens. This system could be a decision support system for the human quality management judge.
5. Conclusions
This study developed a CNN for the automatic evaluation of the severity of internal cracks in a cross section of square timber. We experimentally confirmed that the average classification accuracy of the CNN was 85.67%. Additionally, the CNN did not confuse between “Good” and “Bad” images and performed human-like classification. In this paper, we illustrated that the CNN could distinguish between “Bad” and “Good.” This result implies the humans’ task will only be to find out obviously “Bad” from “Neutral”-judged specimens. Future work includes the development of a portable device for practical applications. Furthermore, we will attempt to realize a CNN that can classify the severity of cracks even from images without silver spray paint. For that purpose, we will collect many training datasets of the un-sprayed images.
We expect to share image data and code with academic non-commercial researchers who are willing to collaborate with us.
Author Contributions
S.K.: conceptualization, methodology, software, validation, formal analysis, investigation, writing—original draft preparation, writing—review and editing, and visualization; N.W.: conceptualization, methodology, validation, formal analysis, investigation, supervision, and project administration; K.S.: conceptualization, methodology, validation, formal analysis, and investigation; T.T.: conceptualization, methodology, validation, formal analysis, and investigation; T.K.: validation, formal analysis, and investigation; R.T.: methodology, software, validation, formal analysis, and investigation; H.N.; conceptualization, methodology, validation, formal analysis, and investigation. All authors have read and agreed to the published version of the manuscript.
Funding
This research was funded by JSPS bearing grant number: 20K06116.
Acknowledgments
The authors would like to thank Ueno and Maeda at MathWorks for their technical advice.
Conflicts of Interest
The authors declare no conflict of interest.
References
- Bergman, R. Drying and Control of Moisture Content and Dimensional Changes. In Wood Handbook, Wood as an Engineering Material; USDA: Washington, DC, USA, 2021; Chapter 13; pp. 1–20. [Google Scholar]
- Yamashita, K.; Hirakawa, Y.; Saito, S.; Ikeda, M.; Ohta, M. Internal-Check Variation in Boxed-Heart Square Timber of sugi (Cryptomeria japonica) Cultivars Dried by High-Temperature Kiln Drying. J. Wood Sci. 2012, 58, 375–382. [Google Scholar] [CrossRef]
- Tomita, M. Effects of Internal Checks Caused by High-Temperature Drying on Mechanical Properties of Sugi Squared Sawn Timbers: Bending Strength of Beam and Resistance of Bolted Wood-Joints. Wood Ind. 2009, 64, 416–422. [Google Scholar]
- Tonosaki, M.; Saito, S.; Miyamoto, K. Evaluation of Internal Checks in High Temperature Dried Sugi Boxed Heart Square Sawn Timber by Dynamic Shear Modulus. Mokuzai Gakkaishi 2010, 56, 79–83. [Google Scholar] [CrossRef][Green Version]
- Teranishi, Y.; Kaimoto, H.; Matsumoto, H. Steam-Heated/Radio-Frequency Hybrid Drying for Sugi Boxed-Heart Timbers(1)Effect of High Temperature Setting Time on Internal Checks. Wood Ind. 2016, 72, 52–57. [Google Scholar]
- Yin, Q.; Liu, H.-H. Drying Stress and Strain of Wood: A Review. Appl. Sci. 2021, 11, 5023. [Google Scholar] [CrossRef]
- LeCun, Y.; Bottou, L.; Bengio, Y.; Haffner, P. Gradient-Based Learning Applied to Document Recognition. Proc. IEEE 1998, 86, 2278–2324. [Google Scholar] [CrossRef]
- Kato, S.; Wada, N.; Shiogai, K.; Tamaki, T. Evaluation of the Crack Severity in Squared Timber Using CNN. In Lecture Notes in Networks and Systems, Proceedings of the 36th International Conference on Advanced Information Networking and Applications, Sydney, Australia, 13–15 April 2022; Springer: Cham, Switzerland, 2022; Volume 3, pp. 441–447. [Google Scholar] [CrossRef]
- Nakayama, S. Evaluation of Internal Checks on Boxed-Heart Structural Timber of Sugi and Hinoki Using Stress-Wave Propagation I. Effects of Moisture Content, Timber Temperature, Knots, and the Internal Check Form. J. For. Biomass Util. Soc. 2012, 7, 51–58. [Google Scholar]
- Nakayama, S.; Matsumoto, H.; Teranishi, Y.; Kato, H.; Shibata, H.; Shibata, N. Evaluation of Internal Checks on Boxed-Heart Structural Timber of Sugi and Hinoki Using Stress-Wave Propagation II. Evaluating Internal Checks of Full-Sized Timber. J. For. Biomass Util. Soc. 2013, 8, 21–27. [Google Scholar]
- Nakayama, S.; Matsumoto, H.; Teranishi, Y.; Kato, H.; Shibata, H.; Shibata, N. Evaluation of Internal Checks on Boxed-Heart Structural Timber of Sugi and Hinoki Using Stress-Wave Propagation (III) Estimation of the Length of Internal Checks in Boxed-Heart Square Timber of sugi. J. For. Biomass Util. Soc. 2013, 8, 61–65. [Google Scholar]
- Liu, Y.; Hou, M.; Li, A.; Dong, Y.; Xie, L.; Ji, Y. Automatic Detection of Timber-Cracks in Wooden Architectural Heritage Using Yolov3 Algorithm. Int. Arch. Photogramm. Remote Sens. Spat. Inf. Sci. 2020, XLIII–B2, 1471–1476. [Google Scholar] [CrossRef]
- He, T.; Liu, Y.; Yu, Y.; Zhao, Q.; Hu, Z. Application of Deep Convolutional Neural Network on Feature Extraction and Detection of Wood Defects. Measurement 2020, 152, 1–8. [Google Scholar] [CrossRef]
- Pan, L.; Rogulin, R.; Kondrashev, S. Artificial Neural Network for Defect Detection in CT Images of Wood. Comput. Electron. Agric. 2021, 187, 1–7. [Google Scholar] [CrossRef]
- Ioffe, S.; Szegedy, C. Batch Normalization: Accelerating Deep Network Training by Reducing Internal Covariate Shift. Int. Conf. Mach. Learn. 2015. Available online: https://arxiv.org/abs/1502.03167 (accessed on 1 July 2022).
- He, K.; Zhang, X.; Ren, S.; Sun, J. Deep Residual Learning for Image Recognition. In Proceedings of the IEEE Conference on Computer Vision and Pattern Recognition, Las Vegas, NV, USA, 27–30 June 2016; pp. 770–778. [Google Scholar]
- Huang, G.; Liu, Z.; van der Maaten, L.; Weinberger, K.Q. Densely Connected Convolutional Networks. In Proceedings of the IEEE Conference on Computer Vision and Pattern Recognition (CVPR), Honolulu, HI, USA, 21–26 July 2017; pp. 4700–4708. [Google Scholar]
- Nair, V.; Hinton, G. Rectified Linear Units Improve Restricted Boltzmann Machines. In Proceedings of the 27th International Conference on Machine Learning (ICML-10), Haifa, Israel, 21–24 June 2010; pp. 807–814. [Google Scholar]
- Krizhevsky, A.; Sutskever, I.; Geoffrey, E.H. ImageNet classification with deep convolutional neural networks. Adv. Neural Inf. Process. Syst. 2012, 25, 1097–1105. [Google Scholar] [CrossRef]
- Simonyan, K.; Zisserman, A. Very Deep Convolutional Networks for Large-Scale Image Recognition. arXiv 2015. [Google Scholar] [CrossRef]
- Szegedy, C.; Liu, W.; Jia, Y.; Sermanet, P.; Reed, S.; Anguelov, D.; Erhan, D.; Vanhoucke, V.; Rabinovich, A. Going Deeper with Convolutions. arXiv 2014. [Google Scholar] [CrossRef]
- Mazzeo, P.L.; Argentieri, A.; de Luca, F.; Spagnolo, P.; Distante, C.; Leo, M.; Carcagni, P. Convolutional neural networks for recognition and segmentation of aluminum profiles, Proc. SPIE 11059. Multimodal Sens. Technol. Appl. 2019, 11059, 219–229. [Google Scholar] [CrossRef]
- Priddy, K.L.; Keller, P.E. Dealing with Limited Amounts of Data. In Artificial Neural Networks—An Introduction; SPIE Press: Bellingham, WA, USA, 2005; Chapter 11; pp. 101–105. [Google Scholar]
- Bishop, C.M. Pattern Recognition and Machine Learning; Springer: New York, NY, USA, 2006. [Google Scholar]
- Zadeh, L.A. Fuzzy sets. Inf. Control. 1965, 8, 338–353. [Google Scholar] [CrossRef]


Publisher’s Note: MDPI stays neutral with regard to jurisdictional claims in published maps and institutional affiliations. |
© 2022 by the authors. Licensee MDPI, Basel, Switzerland. This article is an open access article distributed under the terms and conditions of the Creative Commons Attribution (CC BY) license (https://creativecommons.org/licenses/by/4.0/).