Abstract
The Internet of Things (IoT) is a swiftly developing technology in all sectors, with the number of devices that connect to the Internet has increased remarkably in recent years. However, most of these devices use cheap hardware and lack a concrete security defence system. This may encourage hackers to recruit these devices and use them to launch Distributed Denial of Service (DDoS) attacks, which is one of the main causes of concern among security engineers. This paper investigates the possibility of using a matrix profile to detect DDoS attacks in an IoT-based environment. According to our empirical experiments, the preliminary findings illustrate that the matrix profile algorithm can efficiently detect IoT-based DDoS attacks.
1. Introduction
The Internet of Things (IoT) is a system of connected computing devices as well as mechanical and digital machines [1]. IoT is swiftly spreading and becoming ubiquitous. User experience can be transformed by IoT as it begins to change the ways of using smart devices, from coffee machines to computers [1]. Considering this accelerated development, various challenges need to be addressed in the IoT environment. These challenges include but are not limited to, the heterogeneity of the network, the volume of generated data, as well as network scale, privacy, and security [2]. There are many applications for IoT, for example, healthcare, traffic monitoring, agriculture, industrial automation, hospitality, smart grid, water supply, wearable devices, smart home appliances, smart cities, etc. [1,2,3]. However, we consider only smart city and smart home applications in this paper.
Many cities around the world have begun using technologies such as smart devices, control systems, and communication infrastructure to improve quality of life, save energy, improve traffic management, etc. [4,5,6]. These cities are called smart cities [4]. Smart cities contain a large number of smart appliances and devices such as sensors, CCTVs, traffic lights, etc. [5]. The authors of one study [7] offered the following definition: “A smart city uses IoT technologies to gather information from required areas and communicate with the public, which improves the welfare of a country’s people and government services”. Thus, the main purpose is to collect data and use it to control smart cities in order to optimise costs and increase safety and security in these cities [6]. In addition, these smart appliances and devices are heterogeneous. Therefore, IoT-based networks are prone to many security risks such as information leakage and malicious cyberattacks due to hardware limitations and poor cybersecurity defence [8]. According to one study [9], smart cities consist of four main areas: smart grid, smart buildings, smart transportation systems, and smart healthcare.
Distributed Denial of Service (DDoS) attacks constitute one of the most challenging types of cyberattacks [10]. They can have serious consequences in smart cities where attackers try to make the network or server unavailable to legitimate users by overwhelming the servers or network with traffic from different sources [10]. There are many reasons behind DDoS attacks, including but not limited to revenge, damaging competitors, entertainment, personal challenges, etc. [10]. There are many kinds of DDoS attacks, including SYN flood, slow read attack, Mirai botnet, TTL expiry attack, etc. [11]. There are also many defence techniques that have been utilised to mitigate the effects of DDoS attacks, including but not limited to firewalls, routers, switches, upstream filtering, blocking ports, and intrusion-prevention systems [10,12,13]. However, most of these techniques have not been evaluated with respect to the simplicity and scalability of the methodology. Additionally, most of these solutions work on the victim’s side.
In this paper, we investigate the possibility of using the method of data structure and associated algorithms called “matrix profile” to detect DDoS attacks in smart cities. Using matrix profile can solve the problem of detecting IoT-based traffic anomalies (DDoS attacks) in smart cities. This study utilises matrix profile to identify the malicious behaviour of DDoS attacks via discovering respective symptoms rather than monitoring traffic details. The main reason behind this is that malicious behaviour can be characterised by a set of symptoms, such as high CPU utilisation, an increase in voltage usage, growth in the number of tasks, high memory usage, etc.; it could be challenging to detect DDoS attacks at the source (attacker side) as it is difficult to distinguish between legitimate and malicious traffic. Three IoT-based devices are used in this case study to launch a DDoS attack. The findings show that the accuracy of the matrix profile algorithm ranges from 93.33% to 100% when using time-series data, whereas the accuracy range is 80–100% when using Z-normalised time-series data. Additionally, the results show that using Z-normalised data with matrix profile results in a shorter calculation time.
2. Literature Review
This section reviews various methodologies that have been used to detect DDoS attacks using different mechanisms, such as machine learning, entropy or statistically based methods, software-defined networking methods, etc.
2.1. Machine Learning-Based Methods
One study [14] illustrates a mitigation system to help protect the IoT against DDoS attacks. The paper proposes a model that can check network traffic and detect any DDoS attacks using an algorithm based on deep learning techniques. Another study [14] adopts convolutional neural networks to extract features of flows. After that, the researchers applied an auto-encoder to perform unsupervised malicious traffic classification. Their main object is a model that detects malicious traffic by checking a sample of packets as opposed to all traffic. They validate their system by comparing it with previous models. The authors claim that their system achieved 100% accuracy, which is somewhat unrealistic.
Study [15] suggested a strategy to mitigate DDoS attacks in IoT networks. The researchers use learning automata concepts in their model: a Service-Oriented Architecture (SOA) is used as a model for the IoT. SOA is a platform for developing applications for the IoT. The findings reveal that the proposed scheme is effective in mitigating DDoS attacks in the IoT. Nevertheless, the authors make a controversial claim that their model prevents DDoS attacks, which is inaccurate as no security system can prevent these attacks. Existing systems can help mitigate DDoS attacks but not prevent them.
The researchers in one study [16] proposed a DDoS attack detection method based on the support vector machine (SVM) in software-defined networks (SDN). The findings show that the average accuracy of the proposed technique is around 95.24% with a small amount of flow. Nevertheless, the disadvantages of the SVM model ire that it requires excessive training and deep knowledge of machine learning, it is not easy to understand and interpret the final model, and it is not easy to fine-tune the SVM parameters.
A comparison among different machine learning methods in detecting DDoS attacks is presented in another study [17]. The techniques studied are Artificial Neural Network (ANN), SVM, Naive Bayes (NB), Decision Tree (DT), and Unsupervised learning methods (X-means, K-means, etc.). Their findings show that all these methods can be used to detect DDoS attacks. The accuracy of these methods varies from around 91% to around 98%. Another study [18] also discusses using various machine learning techniques such as SVM, NB, and random forest algorithms. According to the authors, the suggested hybrid system shows better results and can be used for intrusion-detection purposes. SVM, NB, and random forest showed accuracies of 99.7%, 97.6%, and 98.0%, respectively.
There are a few limitations in using machine learning to detect DDoS attacks. First, machine learning-based methods such as ANN depend on the hardware, which means they require high-performance computational power [19]. Therefore, this method may not be suitable for use at the router level as the router does not have high-performance computing capabilities. Using ANN could result in some network behaviour being unexplained, which makes it less reliable [20]. Additionally, ANN does not have a determined structure; the network structure is achieved through trial and error during the experiment [21]. SVM-based methods have many limitations as well. They require long training times and large datasets [22]. Additionally, it is not easy to choose the kernel function for the SVM, and it is difficult to understand and interpret the final SVM model [23]. Methods that use k-nearest neighbour (KNN) as a detection algorithm also have some limitations, including but not limited to the following: (i) accuracy depends primarily on the quality of the training dataset; (ii) k-NN does not perform very well (slow) with large datasets; and (iii) the space complexity is very high (requires large memory for large datasets) [24,25].
2.2. Statistical-Based Methods
The authors of one study [11] proposed a statistical-based detection mechanism based on continuously ranked probability scores and exponentially smoothing to detect denial of service (DoS) and DDoS attacks efficiently. The finding shows that the suggested method is suitable for large-scale DDoS attacks only. The results show that the accuracy of the proposed model in medium or low traffic is not sufficient to detect DDoS attacks.
In another study [26], the authors demonstrate a model for a smart home that could be a target for a DDoS attack. The authors claim that their proposed model provides comfort and a secure system for the smart home. The paper suggests a VPN to detect an active attack in IoT devices using Snort tools and Mikrotik Routers. This study aims to analyse network traffic to detect any possible intruders in the IoT devices.
The authors of one study [27] investigate the possibility of utilizing a lightweight statistical approach for DDoS detection methods. The algorithm is designed to be used at the Internet Service Provider (ISP) level. The suggested algorithm involves minimal computational complexity. The proposed technique monitors traffic and uses the calculated Z-score and covariance values to detect anomaly traffic (DDoS) attacks. The authors claim that their method can detect up to 100% of attacks within 30 s.
2.3. Software-Defined Network Methods
SDN constitute a relatively new networking paradigm that redefines the term “network” by allowing network engineers to program SDN devices (SDN controllers). Security engineers can monitor the traffic and control it from a central point, called the controller [28].
SDN depends mainly on a controller to route the traffic as SDN switches do not have a control plan to route traffic, as do traditional switches. Therefore, the SDN controller is a potential target for DDoS attacks. One study [29] proposes a method that uses an SDN controller and machine learning to classify traffic as normal or abnormal. In their findings, the authors claim that this method has a detection rate of 98.8% accuracy. However, this method is suitable for SDN networks only, which means it cannot be applied to traditional routers or switches.
One study [30] investigates SDN technology to protect an enterprise network from DDoS attacks. The proposed defence mechanism uses a graphically based model that effectively monitors the traffic and flags any suspicious traffic in the SDN network. The SDN controller monitors the traffic and routes it through SDN switches. The proposed technique is not applicable in traditional networks and cannot be utilised in routers or switches.
2.4. Other Methods
The authors of one study [5] propose a DDoS detection method for smart cities. The proposed technique takes a defensive or self-protective stance by using load balancing to mitigate the impact of DDoS attacks in smart cities. The proposed methodology is based on keeping track of trusted IP addresses and diverting new IP addresses in cases where a DDoS attack is detected. In addition, this method checks the identity of IP addresses and then decides whether the traffic is an attack or legitimate. For instance, if the IP address of a CCTV is trying to connect to the Facebook or Twitter server, it might be a DDoS attack as these companies do not yet provide services to IoT devices such as CCTV. Although the authors claim that their method is effective, there is not enough evidence or experimentation discussed in the paper to support their claim; neither have they discussed the scalability of their proposed method.
One study [12] proposes a constrained application protocol at the application layer to detect and mitigate DDoS attacks in IoT-based smart homes. The researchers use datagram transport layer security (DTLS) as a security protocol for securing communication between clients and servers. The authors propose a novel algorithm for the detection and mitigation of DoS and DDoS attacks at an early stage, and they use the Contiki Cooja simulator. They claim that their findings show that their proposed model performs better than the E-Lite system. Their comparison criteria are the malicious packet delivery ratio and legitimate packet delivery ratio. However, this is a short paper, and no details are provided.
A correlation-based method is proposed in another study [31] to detect DDoS attacks. The authors use a hybrid method composed of a machine learning-based method (k-nearest neighbours) and a statistically based method (correlation analysis) to detect DDoS attack traffic. The authors claim that their hybrid method improves the detection rate compared to the statistically based method alone. Nevertheless, this method is very complicated and shares the limitations of k-NN and statistical methods.
The authors of another study [32] present a lightweight defensive algorithm for DDoS attacks in the IoT network environment. The paper contains preliminary findings. The authors use Contiki OS, COOJA, and Rime stack to model their system. The proposed model is utilised to detect DDoS attacks. The authors claim that the proposed model is effective against DDoS attacks. However, the mechanism used to detect DDoS attacks is not explained in the paper. The authors claim that their model is effective, but a justification is missing.
DDoS attacks on cloud auto-scaling mechanisms are investigated in another study [33]. An auto-scaling system is proposed to protect the cloud from DDoS attacks. Yo-Yo is a relatively new DDoS attack, which is investigated in this study. The authors demonstrate a DDoS attack on a computing instance (EC2) and analyse the victim’s protective measures by re-configuring the auto-scaling mechanism.
Attackers can use many types of DDoS attacks to attack any victim’s server, each of which has its own pattern and features, making it very difficult to cope with such threats. After reviewing many research papers that use different techniques, such as machine learning, statistically based algorithms, and SDN techniques, to the best of our knowledge, we could not find any research investigating the possibility of utilizing time-series methods and the algorithms used to analyse network traffic in order to detect DDoS attacks in network traffic in IoT.
The Intrusion-Detection System (IDS) normally depends on a statistical algorithm to detect a DDoS attack [34]. We focus on identifying DDoS traffic using an anomaly detection mechanism. Furthermore, an IDS works on the victim side only, while our proposed system detects DDoS attacks on both the compromised IoT nodes being used to perform a DDoS attack and the victim side (servers).
3. Methodology: Matrix Profile
Data scientists are usually interested in two things when analysing time-series data. These two essential aspects are anomalies and trends [35]. For instance, someone who works in finance may be interested in analysing time-series data and identifying anomalies or trends in the stock market. Another example might be a business owner who wants to analyse sales data to find trends (seasonality demand) to prepare for orders by increasing their stock to meet projected increases in demand [36]. The similarity join is another way to highlight anomalies and trends in time-series data. Basically, it compares one part or snippet of the time-series data by computing the Euclidean distance between two datasets. This coding is easy when using a naive algorithm (a few for loops). However, with massive datasets, it could take months or even years to find any helpful information (anomalies or trends) [35,36].
Example 1.
Assume that there are food vessels at a food factory. These vessels have sensors that log pressure as time-series data, for instance, one reading every minute. Each year in the log file, there are 525,600 entries.
To perform a similarity self-join calculation on just a week’s worth of this dataset (10,080 entries) using existing algorithms would require carrying out 132,880,692,960 Euclidean distances. If each calculation requires 0.0001 s using a nested loop algorithm, it will take 153.8 days to finish the process. [37].
In 2016, a collaboration of two research groups from the University of California, Riverside, and the University of New Mexico in the US introduced a technique called matrix profile [38], which can be a helpful tool in analysing time-series data as it remarkably reduces the time and space complexity of the problem of analysing time-series data. In their first published work regarding matrix profile, the authors proposed it as a tool to find motifs, discords, and shapelets [35].
If matrix profile is used with the example mentioned above, the matrix profile algorithm can finish the calculation of this huge dataset in just around 6.3 h using the same computer [37].
Matrix profile is composed of a data structure and associated algorithms that help solve the dual problem of anomaly detection and motif discovery [39]. It is robust, scalable, and largely parameter-free [40]. There are two essential components in matrix profile: profile index and distance profile. The profile indices hold the index of their first nearest neighbour (the location of its most similar subset of data), whereas the distance profile is configurable, which means it can be a one-dimensional array of minimum Euclidean distances or Z-normalised Euclidean distances [36].
3.1. Problem Definitions and Notation
In this section, we provide some definitions of terms used in this paper regarding matrix profile, which is a tool or method to detect IoT-based DDoS attacks.
Definition 1.
Assume a time series T where T is a sequence of real-value numbers , and n is the length of the time-series data (T).
We do not look at all global properties of the time-series data. We investigate the similarity between local sub-sequences. As a result, we find the anomaly [37].
Definition 2.
Define of T as a continuous subset of values where m is the length of the sub-sequence data vector, i is the index of the first value in the subset in T, and .
It is possible to take part of the sequence (sub-sequence) and use it to calculate its distance to all sequences. The ordered vector is called the distance profile [37].
Definition 3.
A vector of the Euclidean distances between a given sub-sequence and every other sub-sequence in the entire sequence is called a distance profile between and [37].
We can consider a distance profile as a meta time-series that represents the time-series data T that is used to calculate it. Additionally, we should mention that it is assumed the distance is calculated by finding the Euclidean distance between either sub-sequences of a data series or Z-normalised sub-sequences of a data series [37].
The distance profile is zero at the location of the query if the query and all sub-sequences belong to the same time-series data; this is known in the literature as a trivial match in the time series. These trivial matches can be removed or excluded, as will be demonstrated in detail later in this paper. The distance profile is close to zero before and after the location of the query. Since this paper is about finding anomalies in network traffic (DDoS attacks), we do not discuss finding patterns in detail; it is mentioned in this paper only for the sake of completeness.
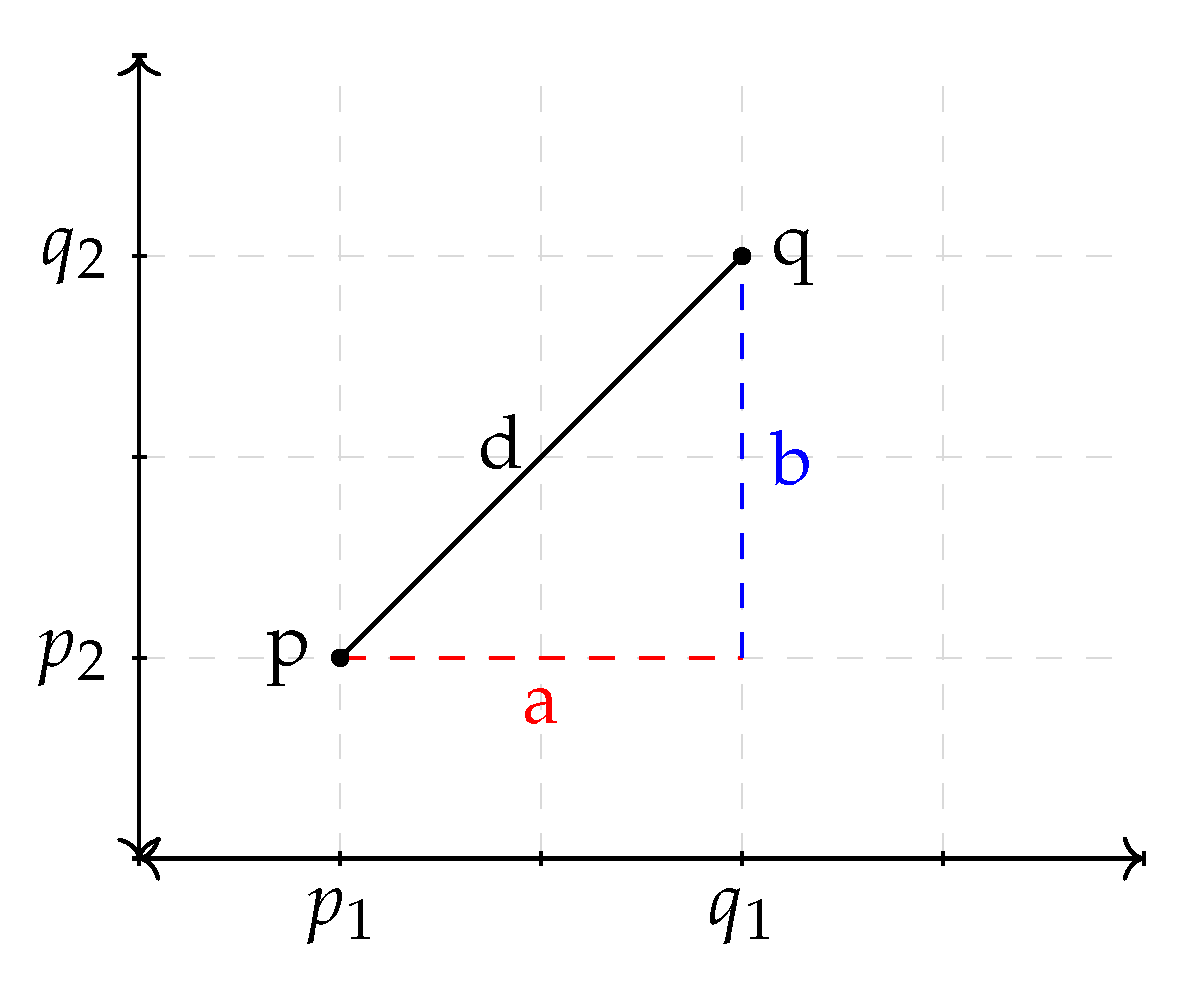
The Euclidean distance is the difference between any two points in so-called Euclidean space. It is also sometimes called the Pythagorean distance because it is calculated using the Pythagorean theorem. The distance between points q and p in Figure 1 can be calculated using the simple formula , or it can be calculated using the Pythagorean theorem, as follows: [38].
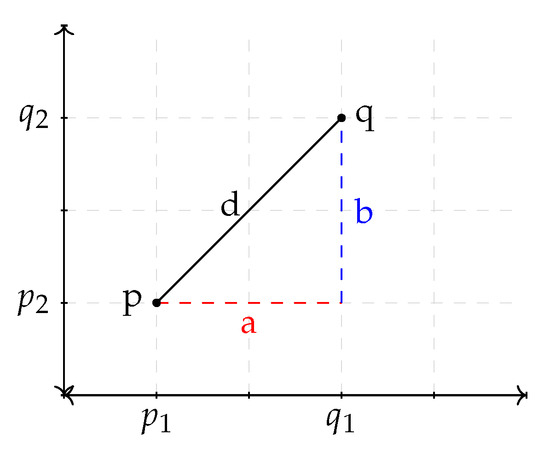
Figure 1.
Euclidean distance between two points.
In the figure, and .
The matrix profile algorithm can use time-series data to calculate the Euclidean distance by Equation (1), or it can use Z-normalised time-series to calculate the Euclidean distance using Equation (4). To calculate Euclidean distance for Z-normalised time-series data, the mean and standard deviation must be calculated. Equations (2) and (3) are used to calculate the Z-normalised p and q.
where and are the average and and are the standard deviation of data q and p, respectively.
Definition 4.
Define P as matrix profile of time-series T, which is the Euclidean distance between each subsequent and the closest match in time series T, in other words, its nearest neighbour. Therefore, we can define P as [40].
3.2. Matrix Profile Procedure
The matrix profile is calculated using a receding horizon or sliding window algorithm in which a subset of a time series is compared with the rest of the time-series data. The following steps summarise how the matrix profile is calculated.
- 1.
- Calculate the distances for the windowed sub-sequence from the whole dataset.
- 2.
- Set an exclusion zone to ignore trivial matches.
- 3.
- Update the distance profile with the minimal values.
- 4.
- Set the first nearest neighbour index [36].
The essential purpose of using matrix profile is to find motifs and/or discords in time-series datasets, in other words, to highlight any interesting events, patterns, or anomalies. The author of one study [36] defines motifs and discords as follows: “Motif is a repeated pattern in a time series and a discord is an anomaly”. Having calculated a matrix profile from a time-series dataset, it is straightforward to identify the top K number of anomalies (discords) and/or pattern motifs in the dataset. Matrix profile reserves the distance in Euclidean space, which means a distance near zero is most similar to other sub-sequences in the time-series data. On the other hand, a large figure (≥50) indicates a sub-sequence unlike any other sub-sequence (anomalies). To sum up, motifs (patterns) can be found by extracting the lowest distances, whereas discords (anomalies) can be identified by finding the largest distances in the time-series dataset [35,36].
According to the authors of one study [36], the algorithms used to calculate the matrix profile can be classified into two main types (algorithmic implementations): exact and anytime algorithms. Exact algorithms calculate the exact solution, which means that the algorithms must complete all calculations before providing any solution (matrix profile). The list below demonstrates the algorithms that can be used to compute the matrix profile:
- MPX: a high-speed algorithm that does not require a Fourier transform to compute the matrix profile.
- STOMP: the first algorithm that can be used to calculate the matrix profile for any time-series dataset.
- Brute force PMP: this type of algorithm is considered slow because it tries all possible data and thus is not recommended for large datasets.
In the following, we demonstrate how matrix profile works through an example.
Example 2.

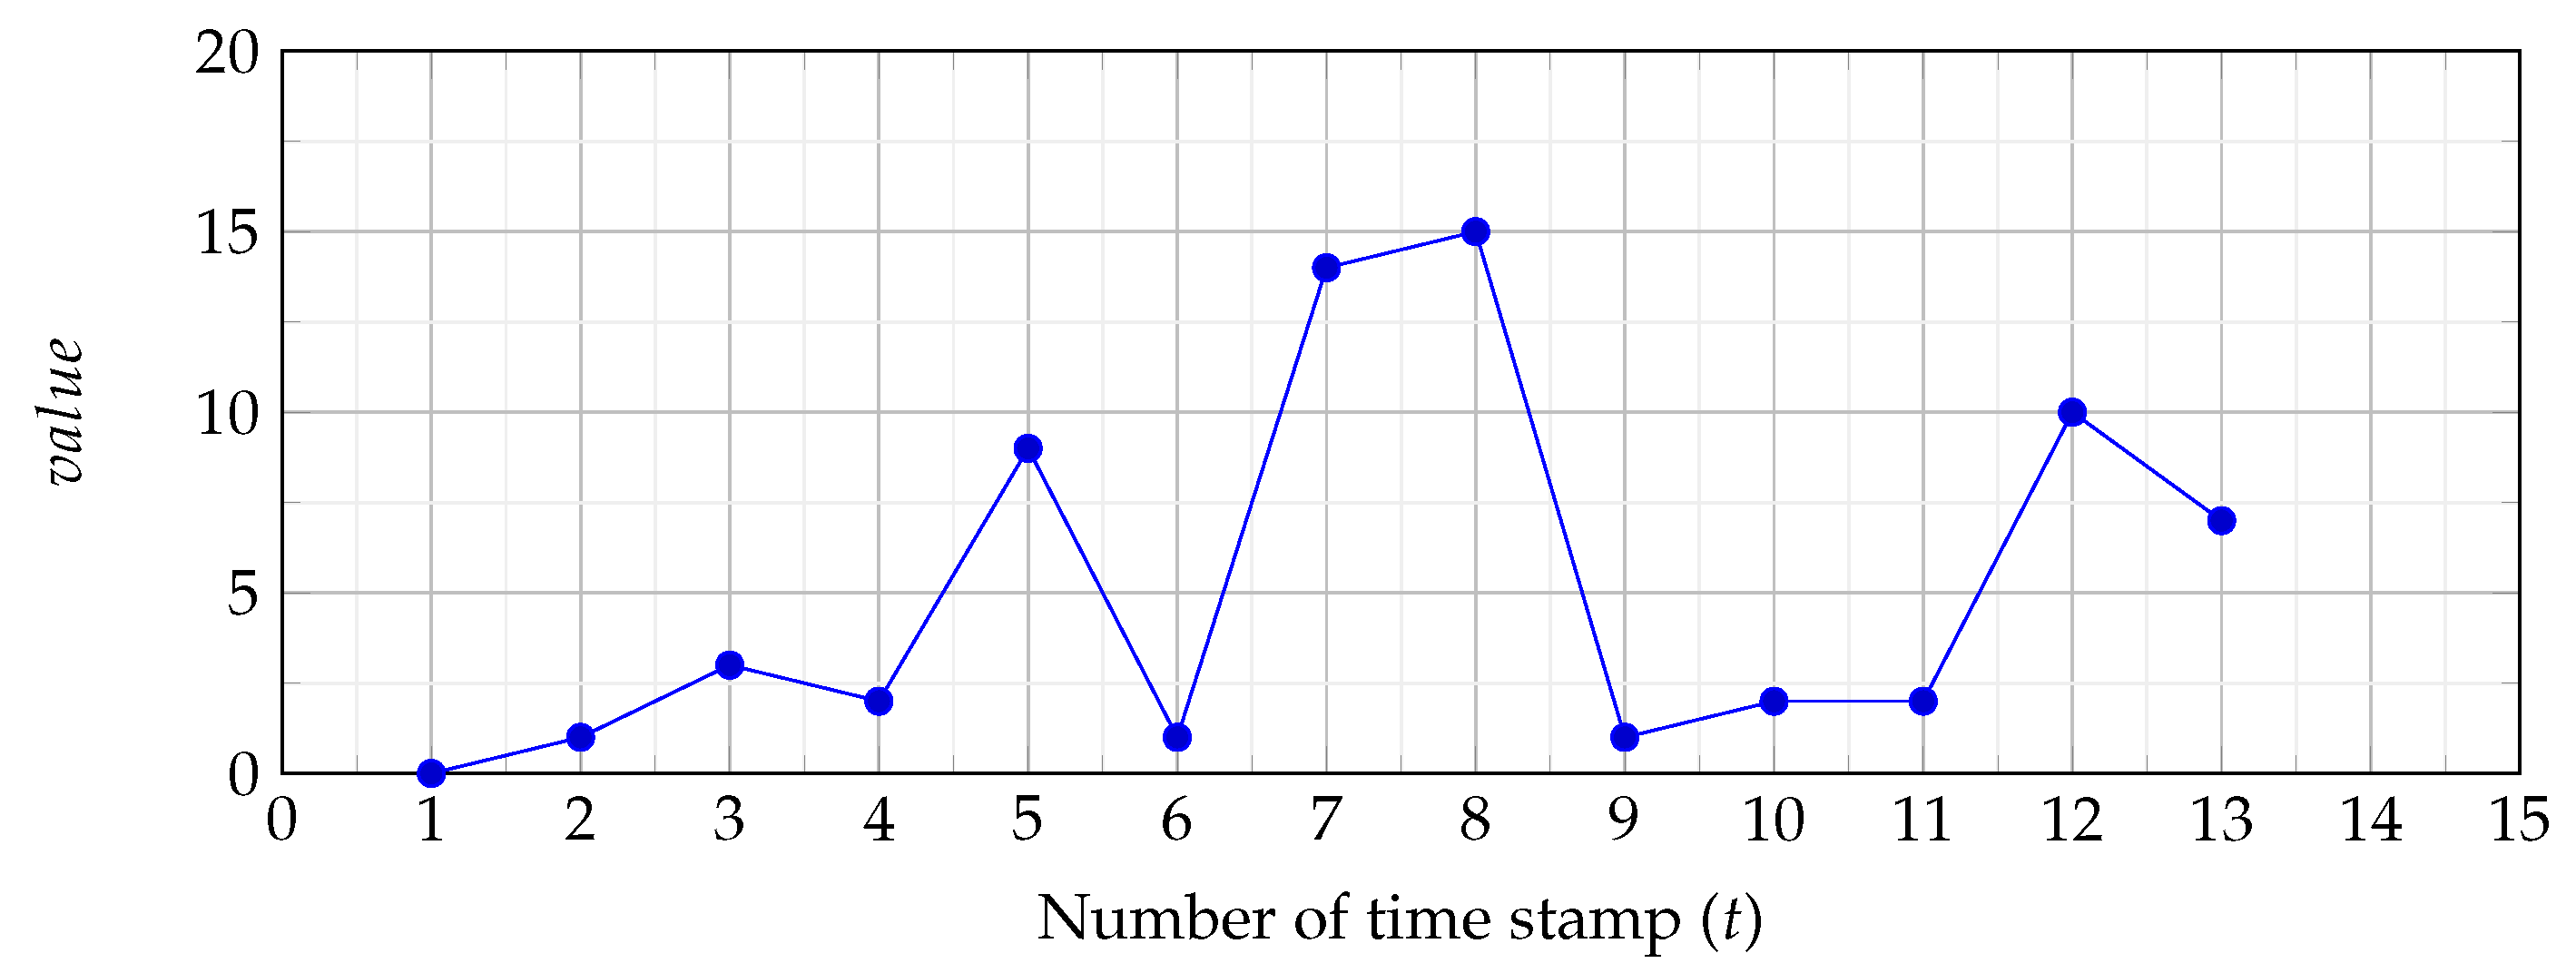
To ensure that the above-mentioned explanation is clear and understood, we demonstrate it here with simple numerical values. Assume a time-series T with length . The real values of T are illustrated in Figure 2 and Figure 3. It is assumed that the sliding window size is 4, . For simplicity, we do not use Z-normalised values in this example.
Figure 2.
Time-series data T.
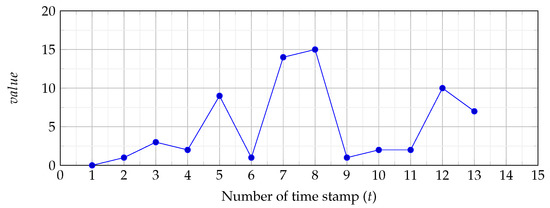
Figure 3.
Time-series data, where the x-axis denotes the time stamp and the y-axis denotes the real values.
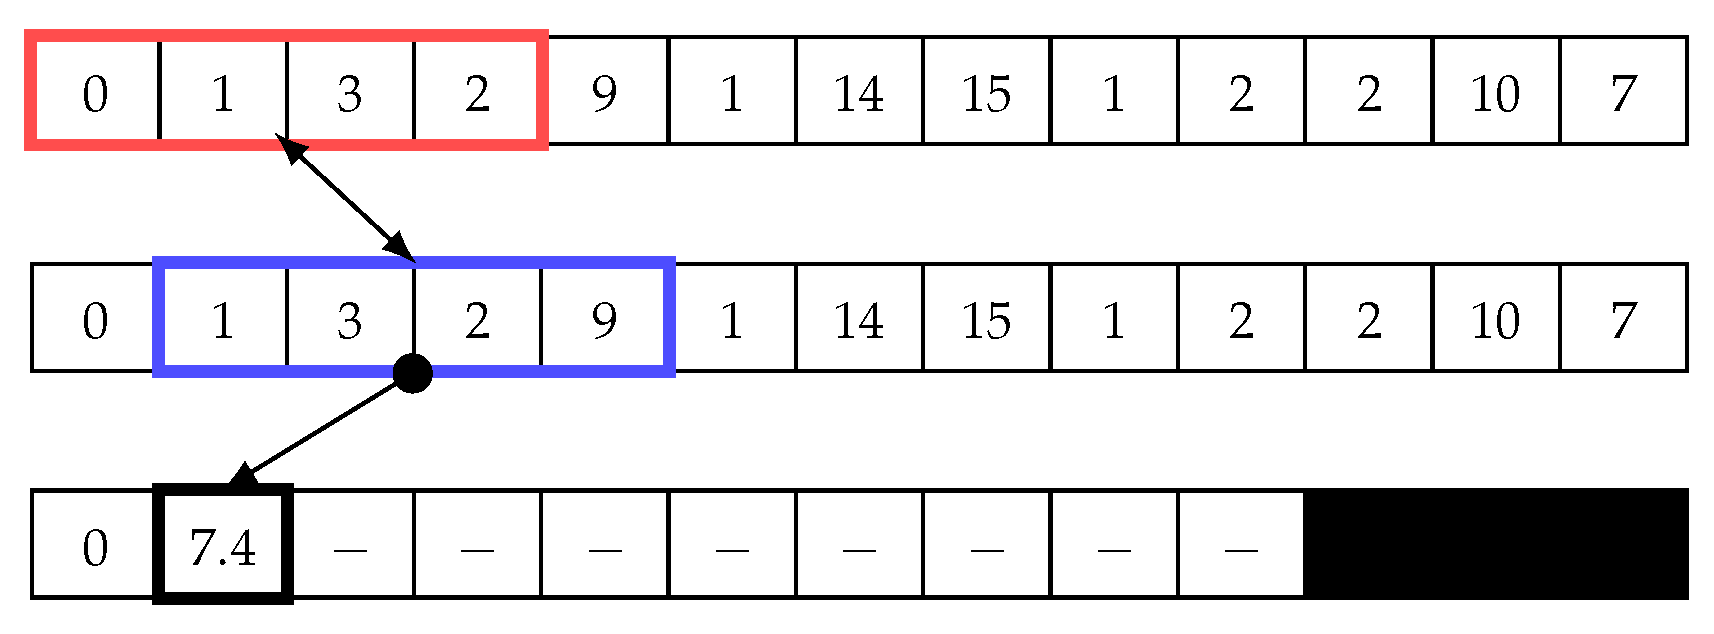
Figure 4 illustrates how the sliding window works in the matrix profile. In this example, we use a window size of four to calculate the Euclidean distance using Equation (1). The first value is calculated by comparing two points in the time-series data, which are (0, 1, 3, 2) and (0, 1, 3, 2). The Euclidean distance d between these two points is ; thus, this is a trivial match. Next, the blue window begins shifting to the right by one cell. The same equation is then used to calculate Euclidean distance, ; see Figure 5. Next, the sliding window continues shifting one cell to the right, and the distance is calculated until the end (see Figure 6). Subsequently, the minimum value in the distance array is added to the matrix profile. Note that trivial matches should be disregarded as they merely compare data with itself, so they are not considered as minimum values in the distance array. In other words, The second minimum value should be chosen.

Figure 4.
Sliding window: First step in the first iteration to calculate the distance array and matrix profile.

Figure 5.
Sliding window: Second step in the first iteration to calculate the distance array and matrix profile.
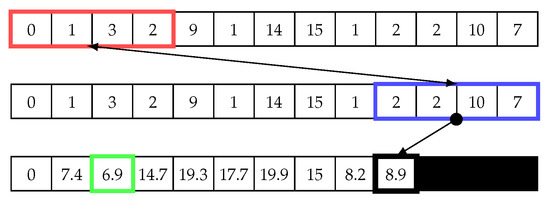
Figure 6.
Sliding window: Last step in the first iteration to calculate the distance array and matrix profile.
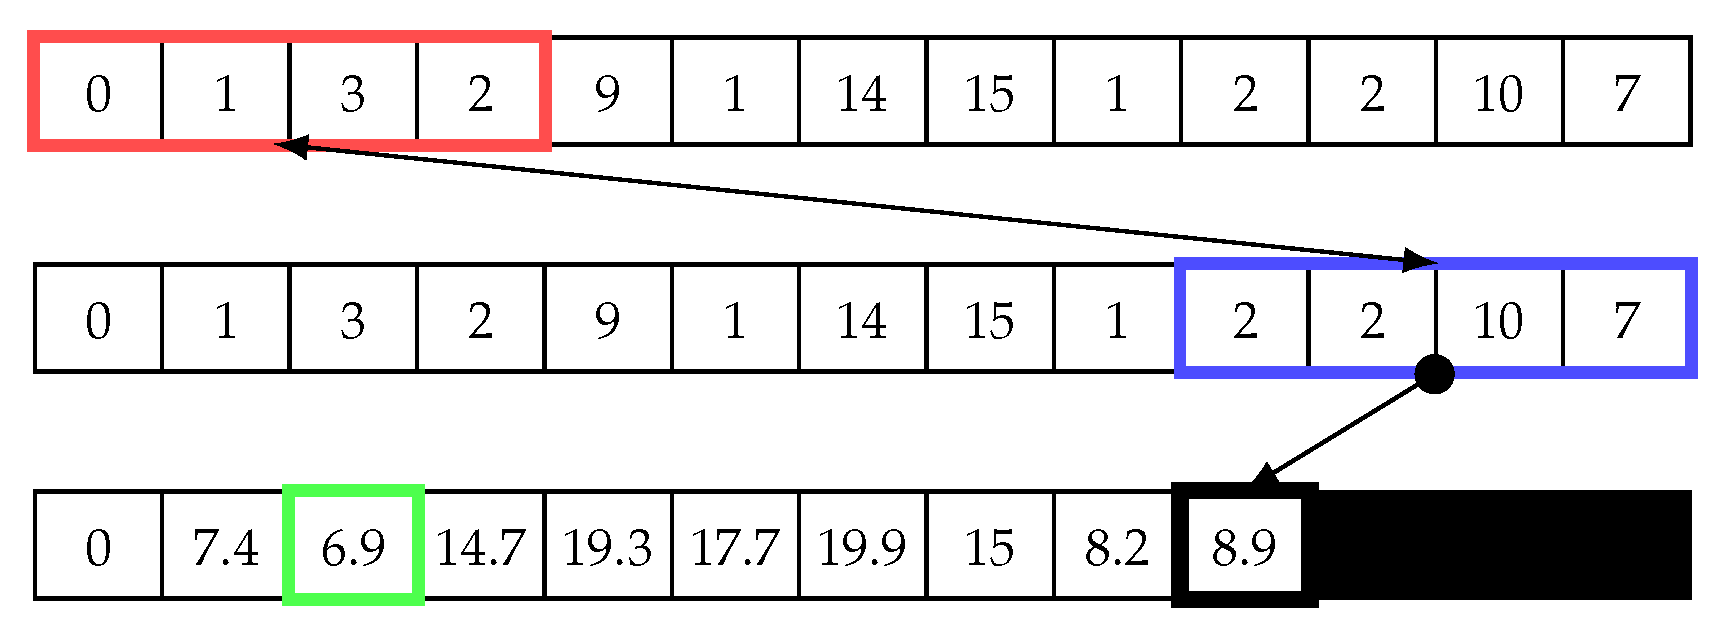
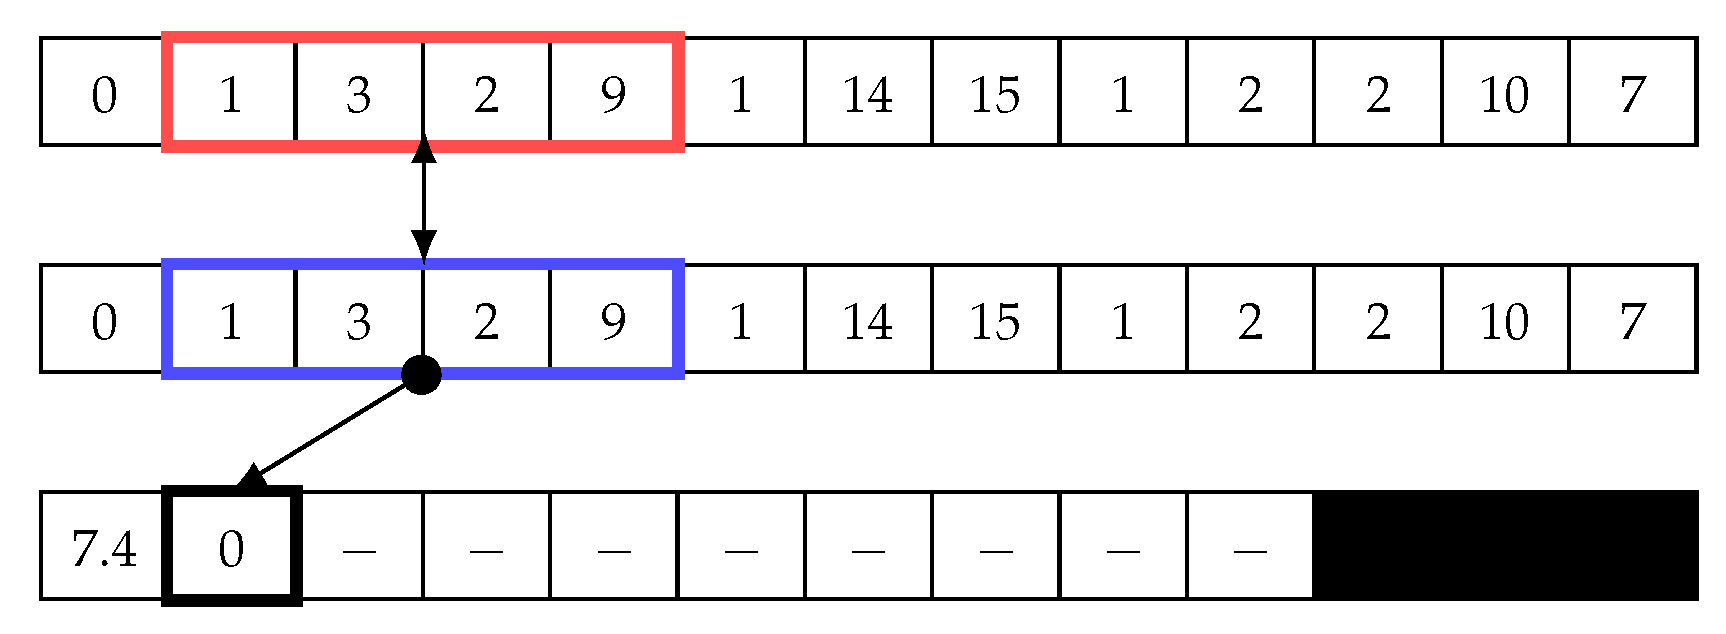
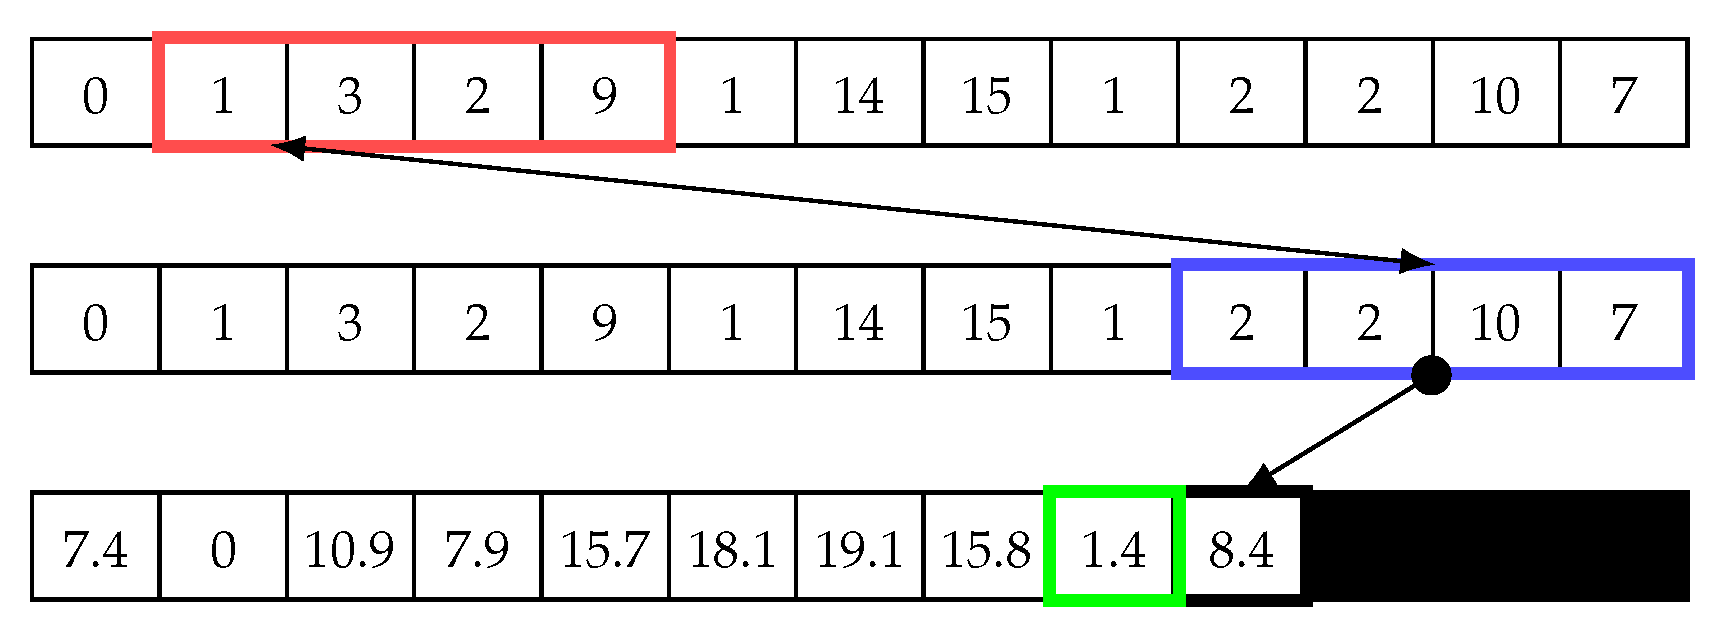
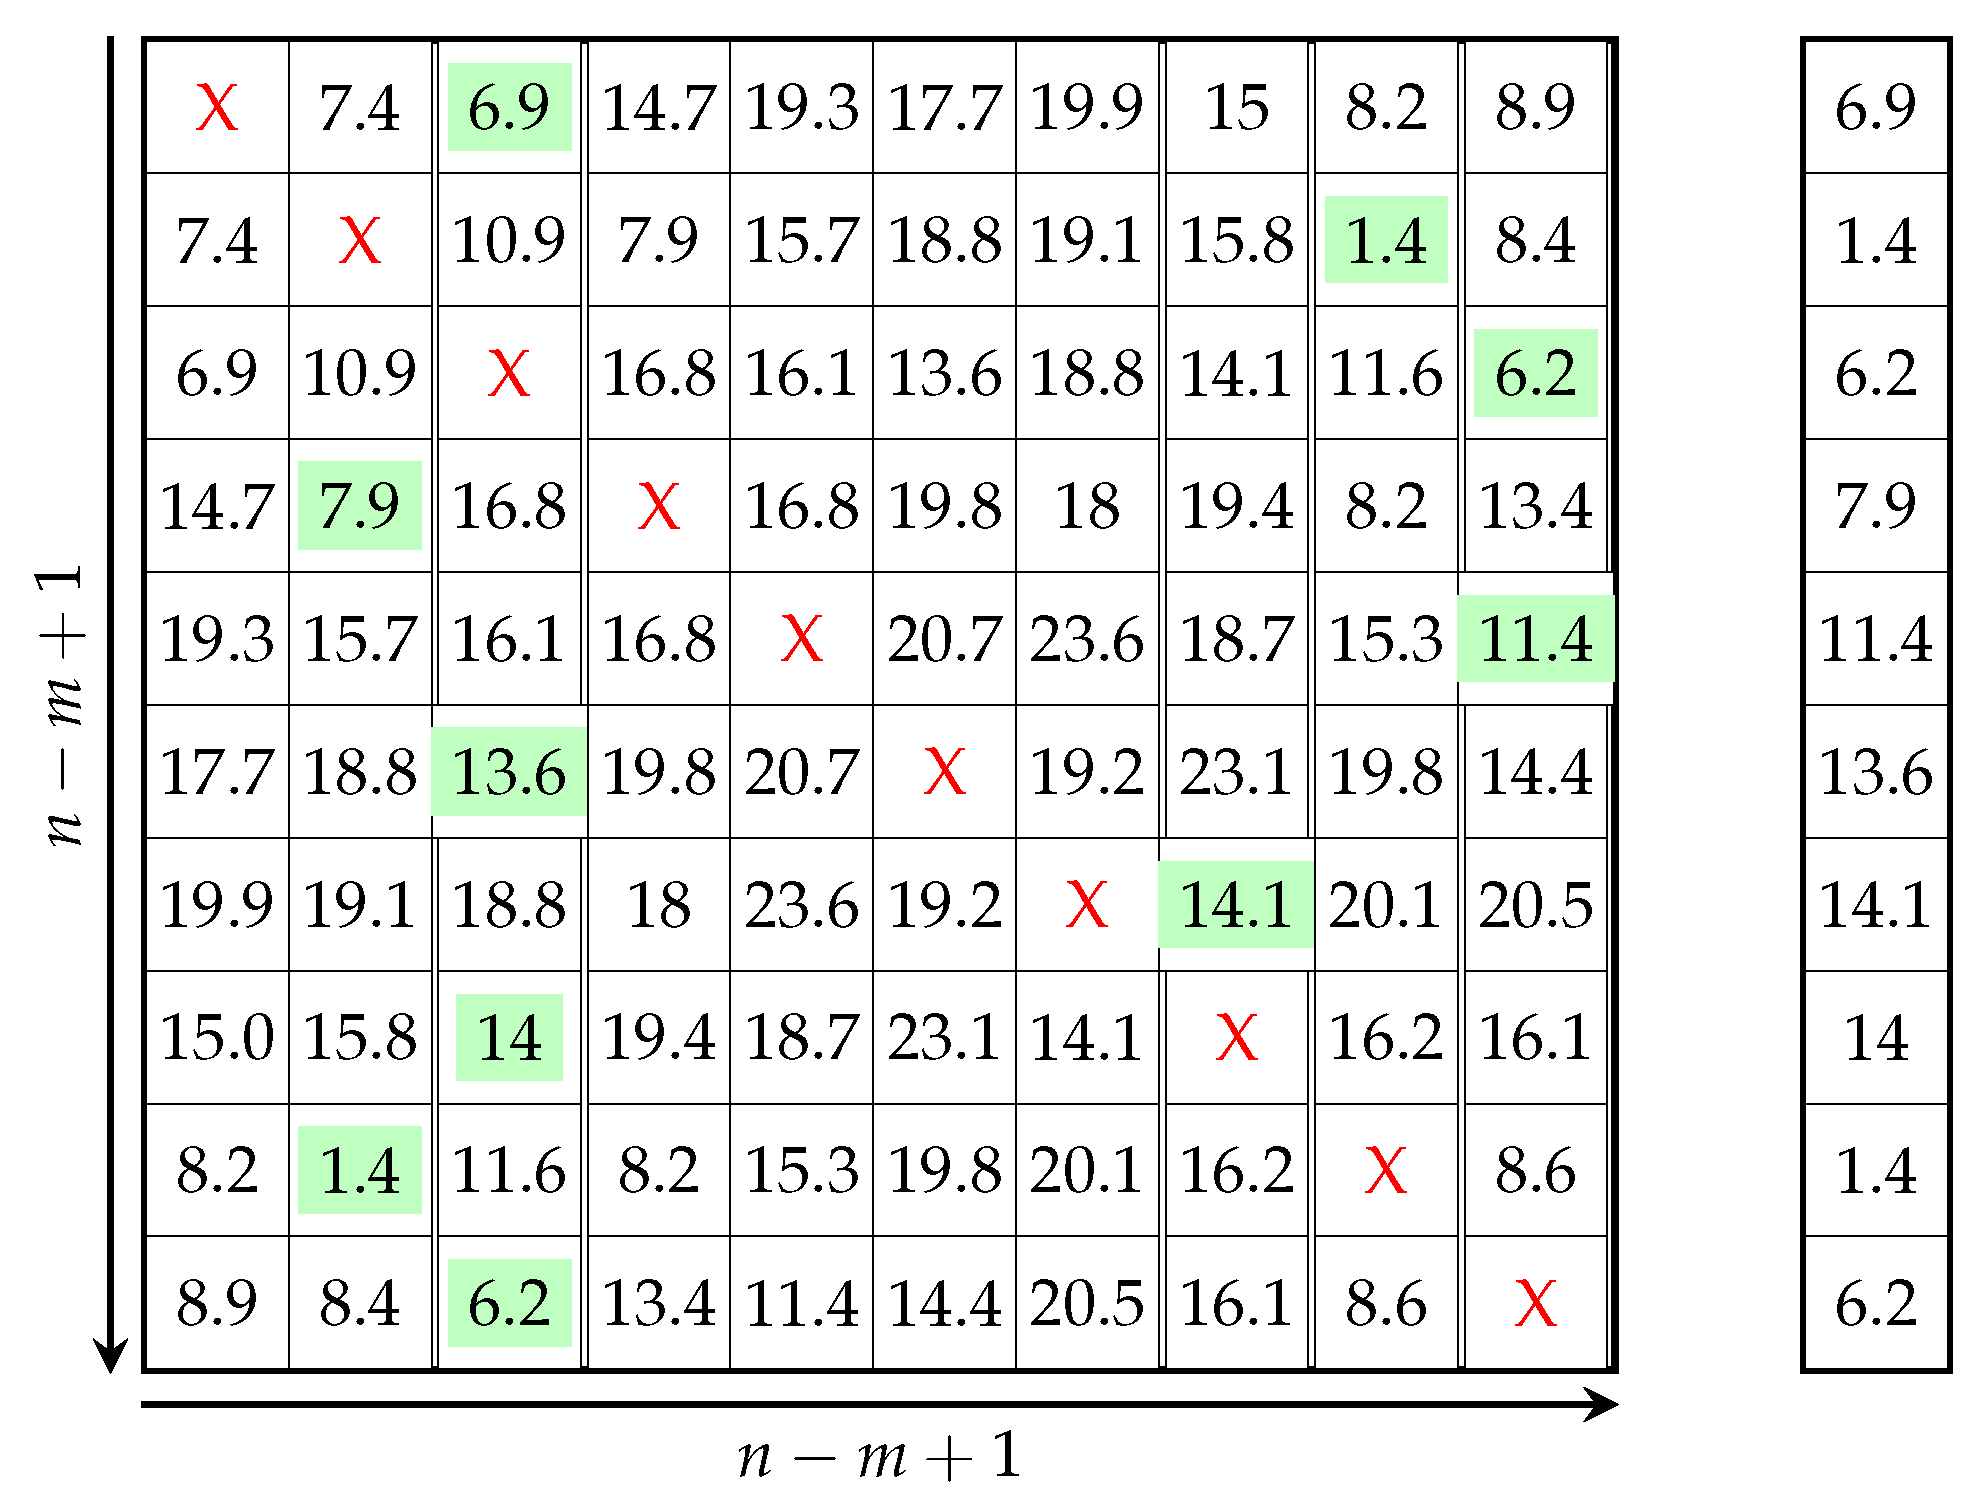
Having calculated the matrix profile for the first matrix value, the red sliding window in Figure 7 is shifted, and the index of the blue sliding window is reset (starts again from the first index). Next, the same steps described above are repeated until the end of the array, as shown in Figure 7, Figure 8 and Figure 9. Then, the minimum value of the second iteration, which is 1.4, is chosen and added to the matrix profile array. The matrix profile algorithm continues shifting the red sliding window by one cell and repeating the steps until the end of the vector. The result is a two-dimensional array, as shown in Figure 10. This matrix represents a distance matrix, and the minimum value of each row in this matrix is added to a vector array called the matrix profile, as shown on the right of Figure 10. Note, we use “X” in the distance matrix to illustrate that this cell is a trivial match, which is zero, and because it has been discarded, we replace zero with “X”.

Figure 7.
Sliding window: First step in the second iteration to calculate the distance array and matrix profile.

Figure 8.
Sliding window: Second step in the second iteration to calculate the distance array and matrix profile.
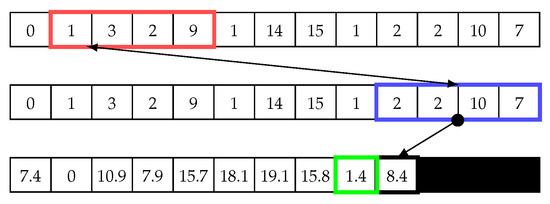
Figure 9.
Sliding window: Last step in the second iteration to calculate the distance array and matrix profile.
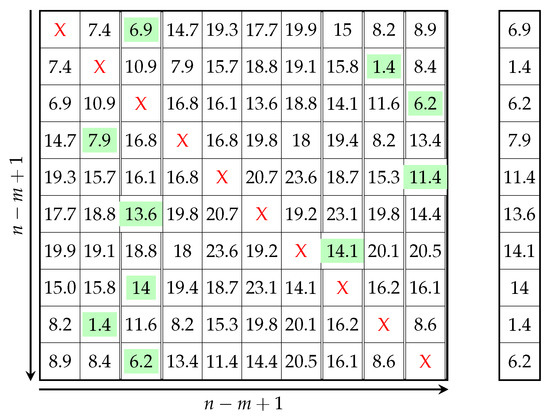
Figure 10.
Distance Matrix, and Matrix Profile (highlighted in green). X denotes the trivial matches.
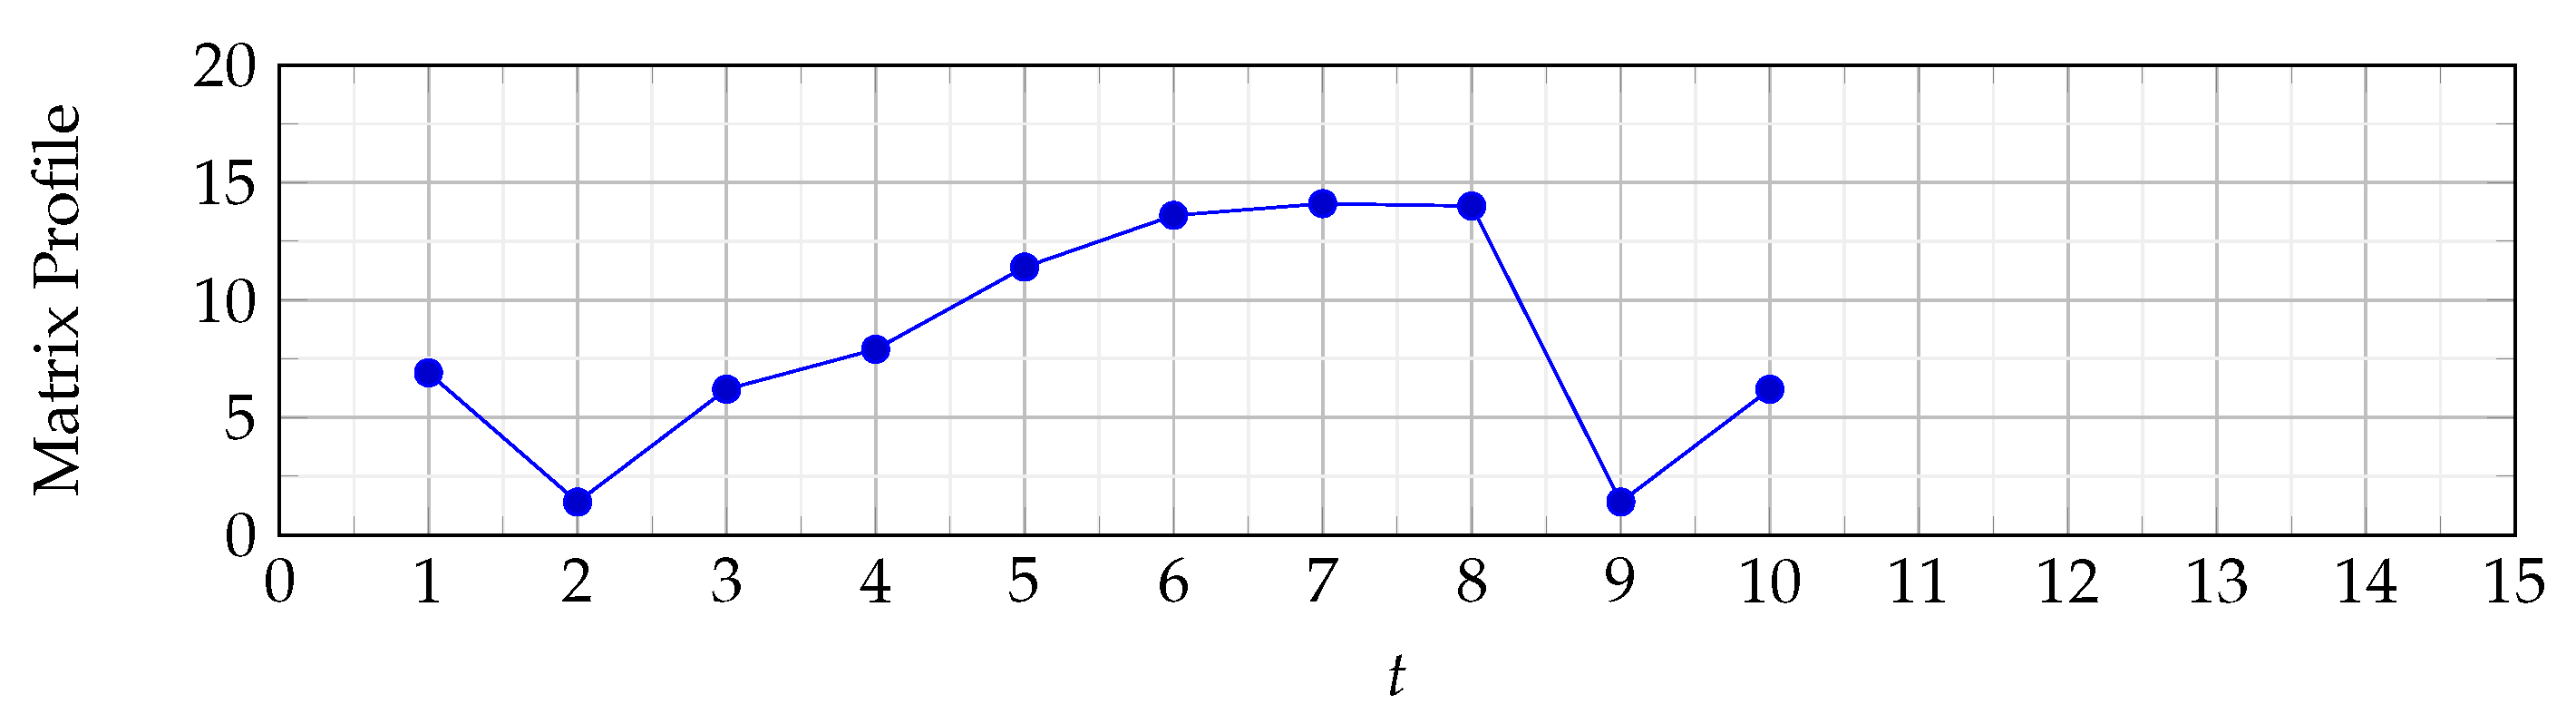
Figure 11 illustrates the matrix profile. As can be seen, there are only 10 values as this is the number of points minus the size of the sliding window plus 1 (). It is clear that the matrix profile is high at and . This is expected because the Euclidean distance is high at these points (see Figure 3). Finally, it may seem that the matrix profile in this example does not reveal much. Our response is that this is due to the fact that we used a small dataset to demonstrate the way the matrix profile algorithm works; a larger dataset is used in the next section, which will highlight how powerful the matrix profile is in detecting anomalies in large datasets.

Figure 11.
Matrix profile.
4. Findings and Discussion
All experiments in this paper were conducted on a machine with the following specifications: Intel(R) Core(TM) i7-8750H CPU @ 2.20 GHz 2.21 GHz, Installed RAM 16.0 GB (15.9 GB usable), 64-bit operating system, x64-based processor, and Windows 10 Pro (version 20H2). Python was the main tool used to implement the model. In addition, we used the STUMPY library, which is the Python library for matrix profile [41].
The main objective of this experiment is to investigate the possibility of using matrix profile to identify malicious behaviour connected to DDoS attacks via discovering respective symptoms rather than monitoring traffic directly. The main reason for this experiment is that malicious behaviour can be characterised by a set of symptoms such as high CPU utilisation, increase in voltage usage, growth in the number of tasks, high memory usage, etc. In addition, it can be challenging to detect a DDoS attack at its source as it is difficult to distinguish between legitimate and malicious traffic.
4.1. Input Setting
We used the IoT-based dataset from three different IoT devices that contain malicious and legitimate traffic. The dataset used in this experiment was provided by the Security Management and Quantification Research Group at the State University of Londrina, Brazil [42]. The dataset was collected from real IoT-based devices (Raspberry Pi). The IoT-based device was infected by botnet malware in the testing environment. The dataset contained readings of different perspectives of the operation of the device, including CPU usage, Memory usage, Voltage usage, number of tasks, and device temperature. This dataset also contained malicious and legitimate data. By legitimate data, we mean the regular behaviour of IoT devices such as surveillance cameras (SCs) and media centres (MCs). In contrast, malicious data are generated by botnets activities such as communication with the command and control and DDoS attacks.
Three profiles of IoT devices were used because the dataset [42] contained data for three devices only. These devices are listed below:
- 1.
- The MC profile simulates devices that consume streams of video to transform regular TVs into smart TVs.
- 2.
- The SC profile simulates the operation of a camera that constantly transmits video to a monitoring station.
- 3.
- The SC with additional traffic (ST) profile is similar to the SC profile, but it also includes legitimate traffic related to other services, such as Telnet and HTTP.
Each device has a set of features (readings) composed of CPU utilisation, memory utilisation, the temperature of the device, voltage usage, and the number of tasks. Therefore, there are 15 times more time-series data than in the matrix profile because each IoT device has 5 features, and there are 3 devices, so the total is 3 × 5 = 15. Each dataset has 10,000 readings. Note that we do not need many IoT devices in this case study because we are detecting malicious behaviour at the attacker side and not the victim side.
- 1.
- MC DDoS attack starts at 11:30:34 AM and ends at 11:43:10 AM.
- 2.
- SC DDoS attack starts at 11:12:51 AM and ends at 12:50:36 PM.
- 3.
- SC with additional traffic DDoS attack starts at 10:59:57 AM and ends at 1:07:58 PM.
In all figures, we use the record number in the x-axis for simplicity and space-saving, as we cannot draw all 10,000 dates in the figures.
4.2. Empirical Findings
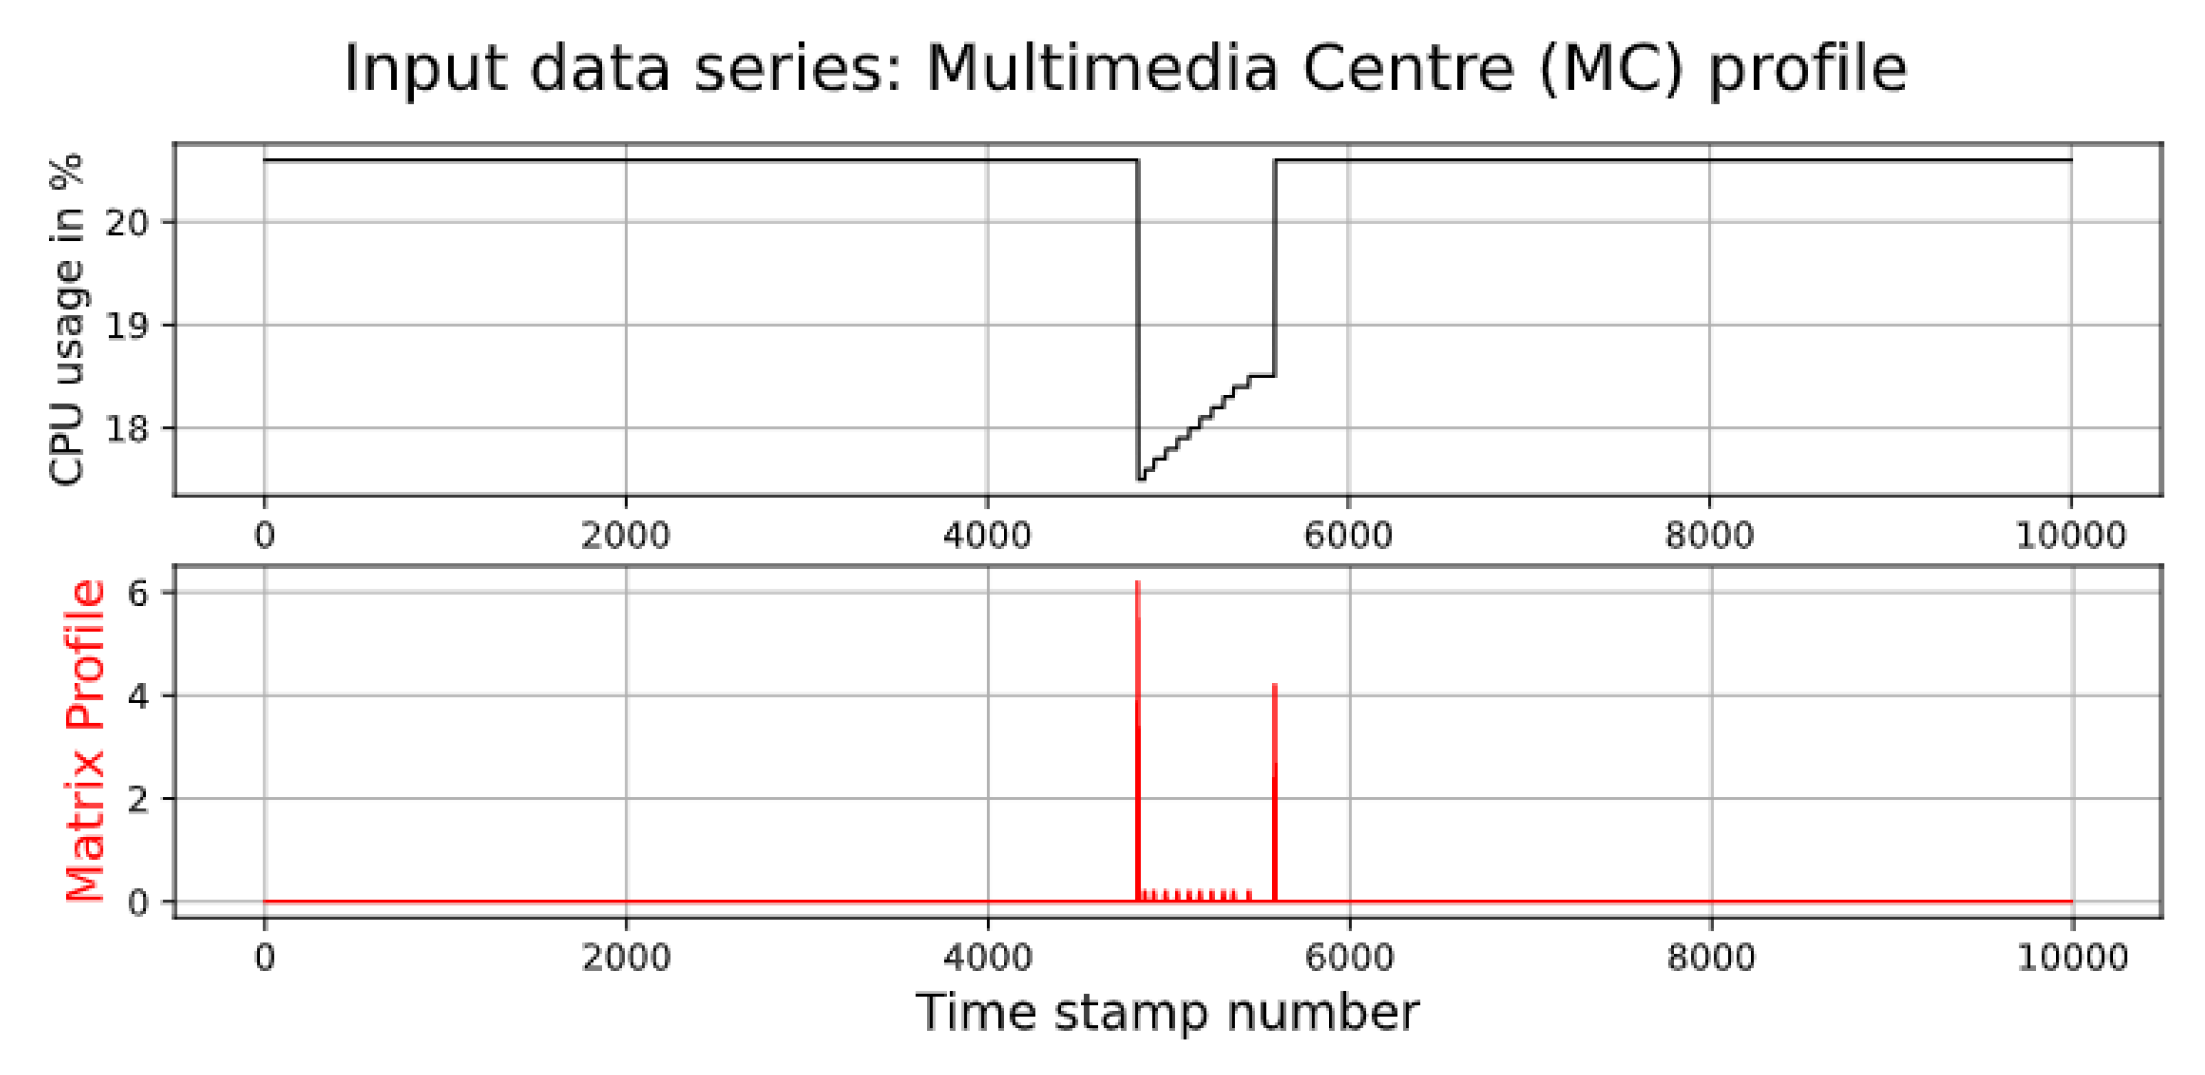
This section presents the results of the empirical experiment. First, we illustrate the results with the MC that consumes streams of video to transform regular TVs. Figure 12 shows the CPU utilisation and matrix profile. As can be seen, the matrix profile was able to detect the start and end of the anomaly in CPU utilisation. The outcome of the matrix profile specified that the attack started at 11:30:32 AM and ended at 11:43:10 AM.
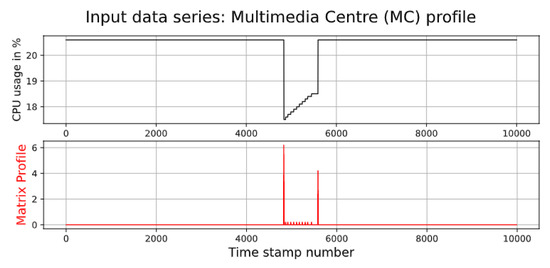
Figure 12.
CPU utilisation of Multimedia Centre.
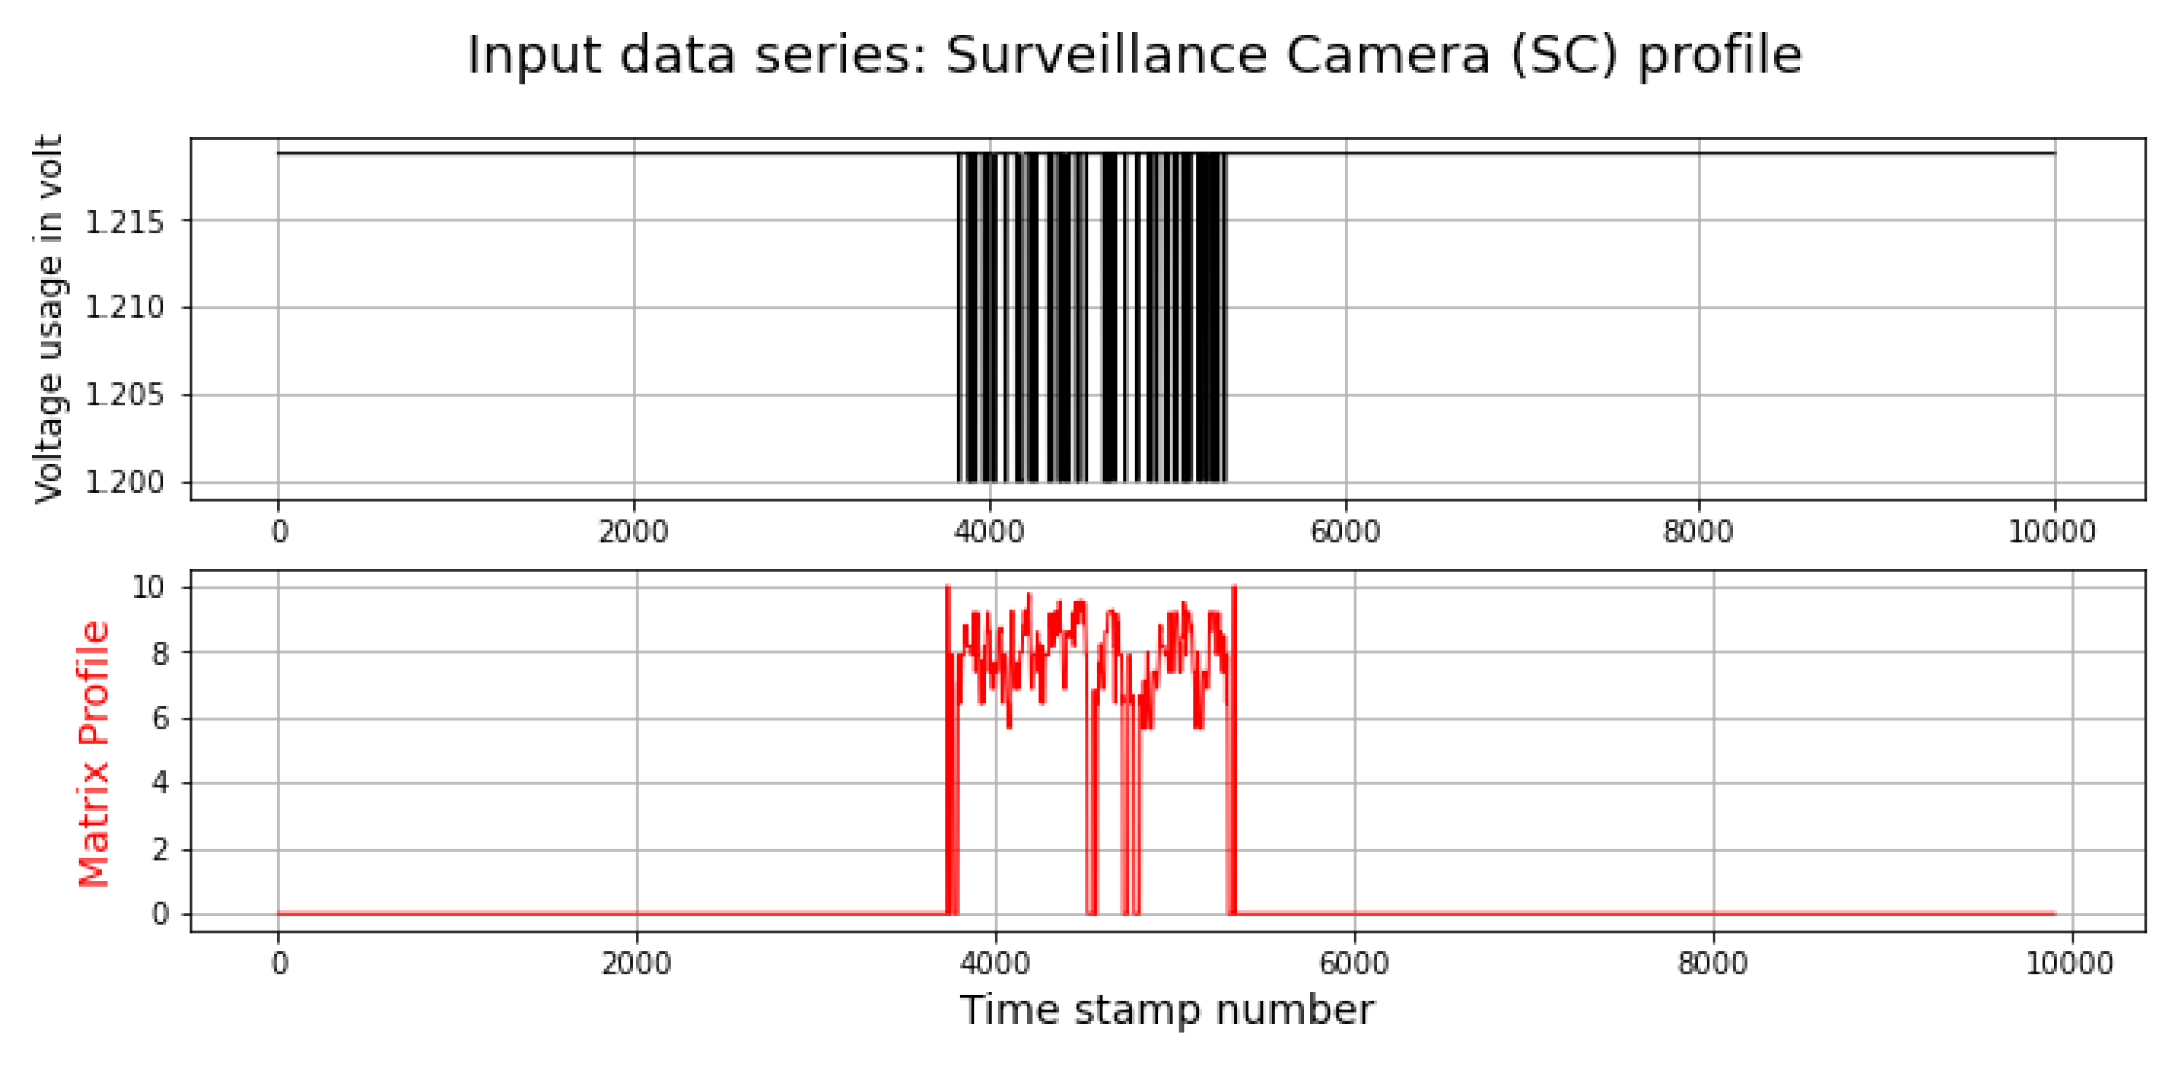
DDoS attacks cause a fluctuation in voltage usage in some IoT devices such as SC. Therefore, this voltage usage fluctuation can be a symptom of a DDoS attack. This experiment investigated using this feature to detect DDoS attacks. Figure 13 demonstrates the voltage reading and calculated matrix profile. As can be seen, matrix profile managed to determine the anomaly in voltage usage caused by the DDoS attack on the SC.
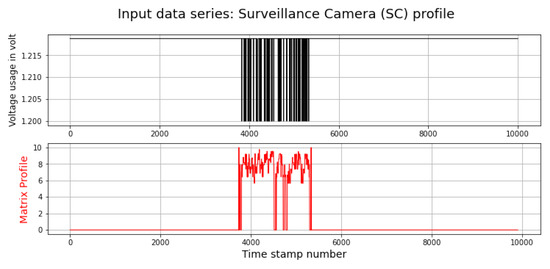
Figure 13.
Voltage usage of Surveillance Camera.
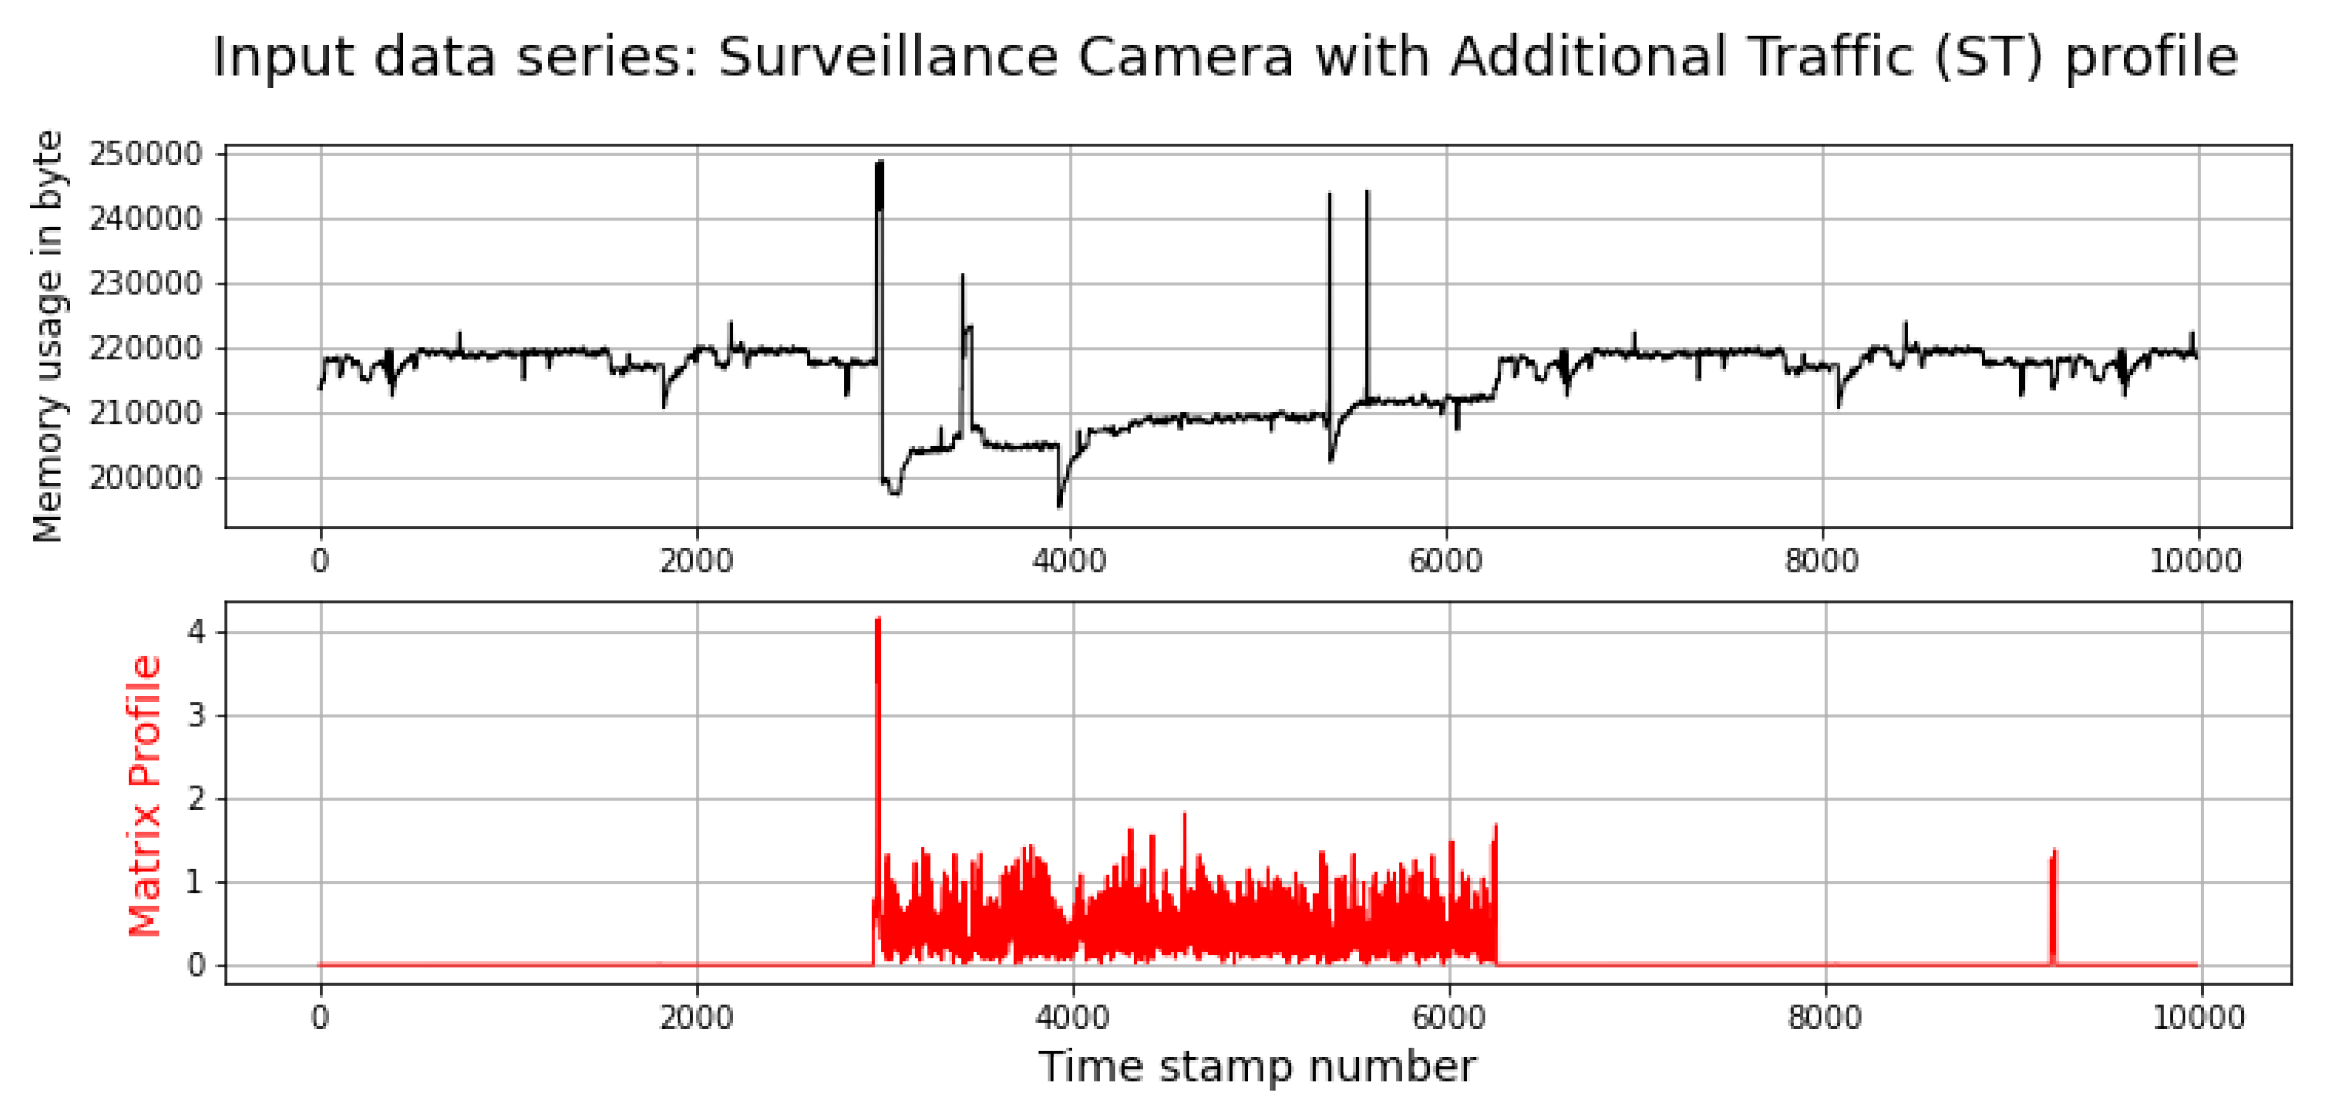
Figure 14 depicts memory utilisation and its matrix profile. Memory utilisation is another feature that can be used to detect DDoS attacks that use compromised SCs with additional traffic. The results show that this feature can also be used to detect DDoS attacks. Note that by looking at the top chart only, it is very difficult to identify the anomaly in the data, whereas by looking at its matrix profile, the anomaly (DDoS) is very clear.
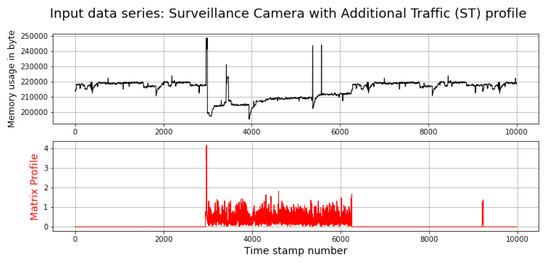
Figure 14.
Memory Utilisation in Surveillance Camera with additional traffic.
4.3. Evaluation and Discussion
In this section, we evaluate the proposed method (matrix profile) to detect DDoS attacks in terms of precision, accuracy, and runtime of the algorithm. In addition, this section discusses the results and explains them. First, we repeat one of the experiments in the previous section using different values of window sizes as window size can affect the accuracy of the matrix profile, as shown in the results. In addition, we use time-series data and Z-normalised time-series data as inputs to the proposed algorithm to calculate the matrix profile and explain which one is recommended.
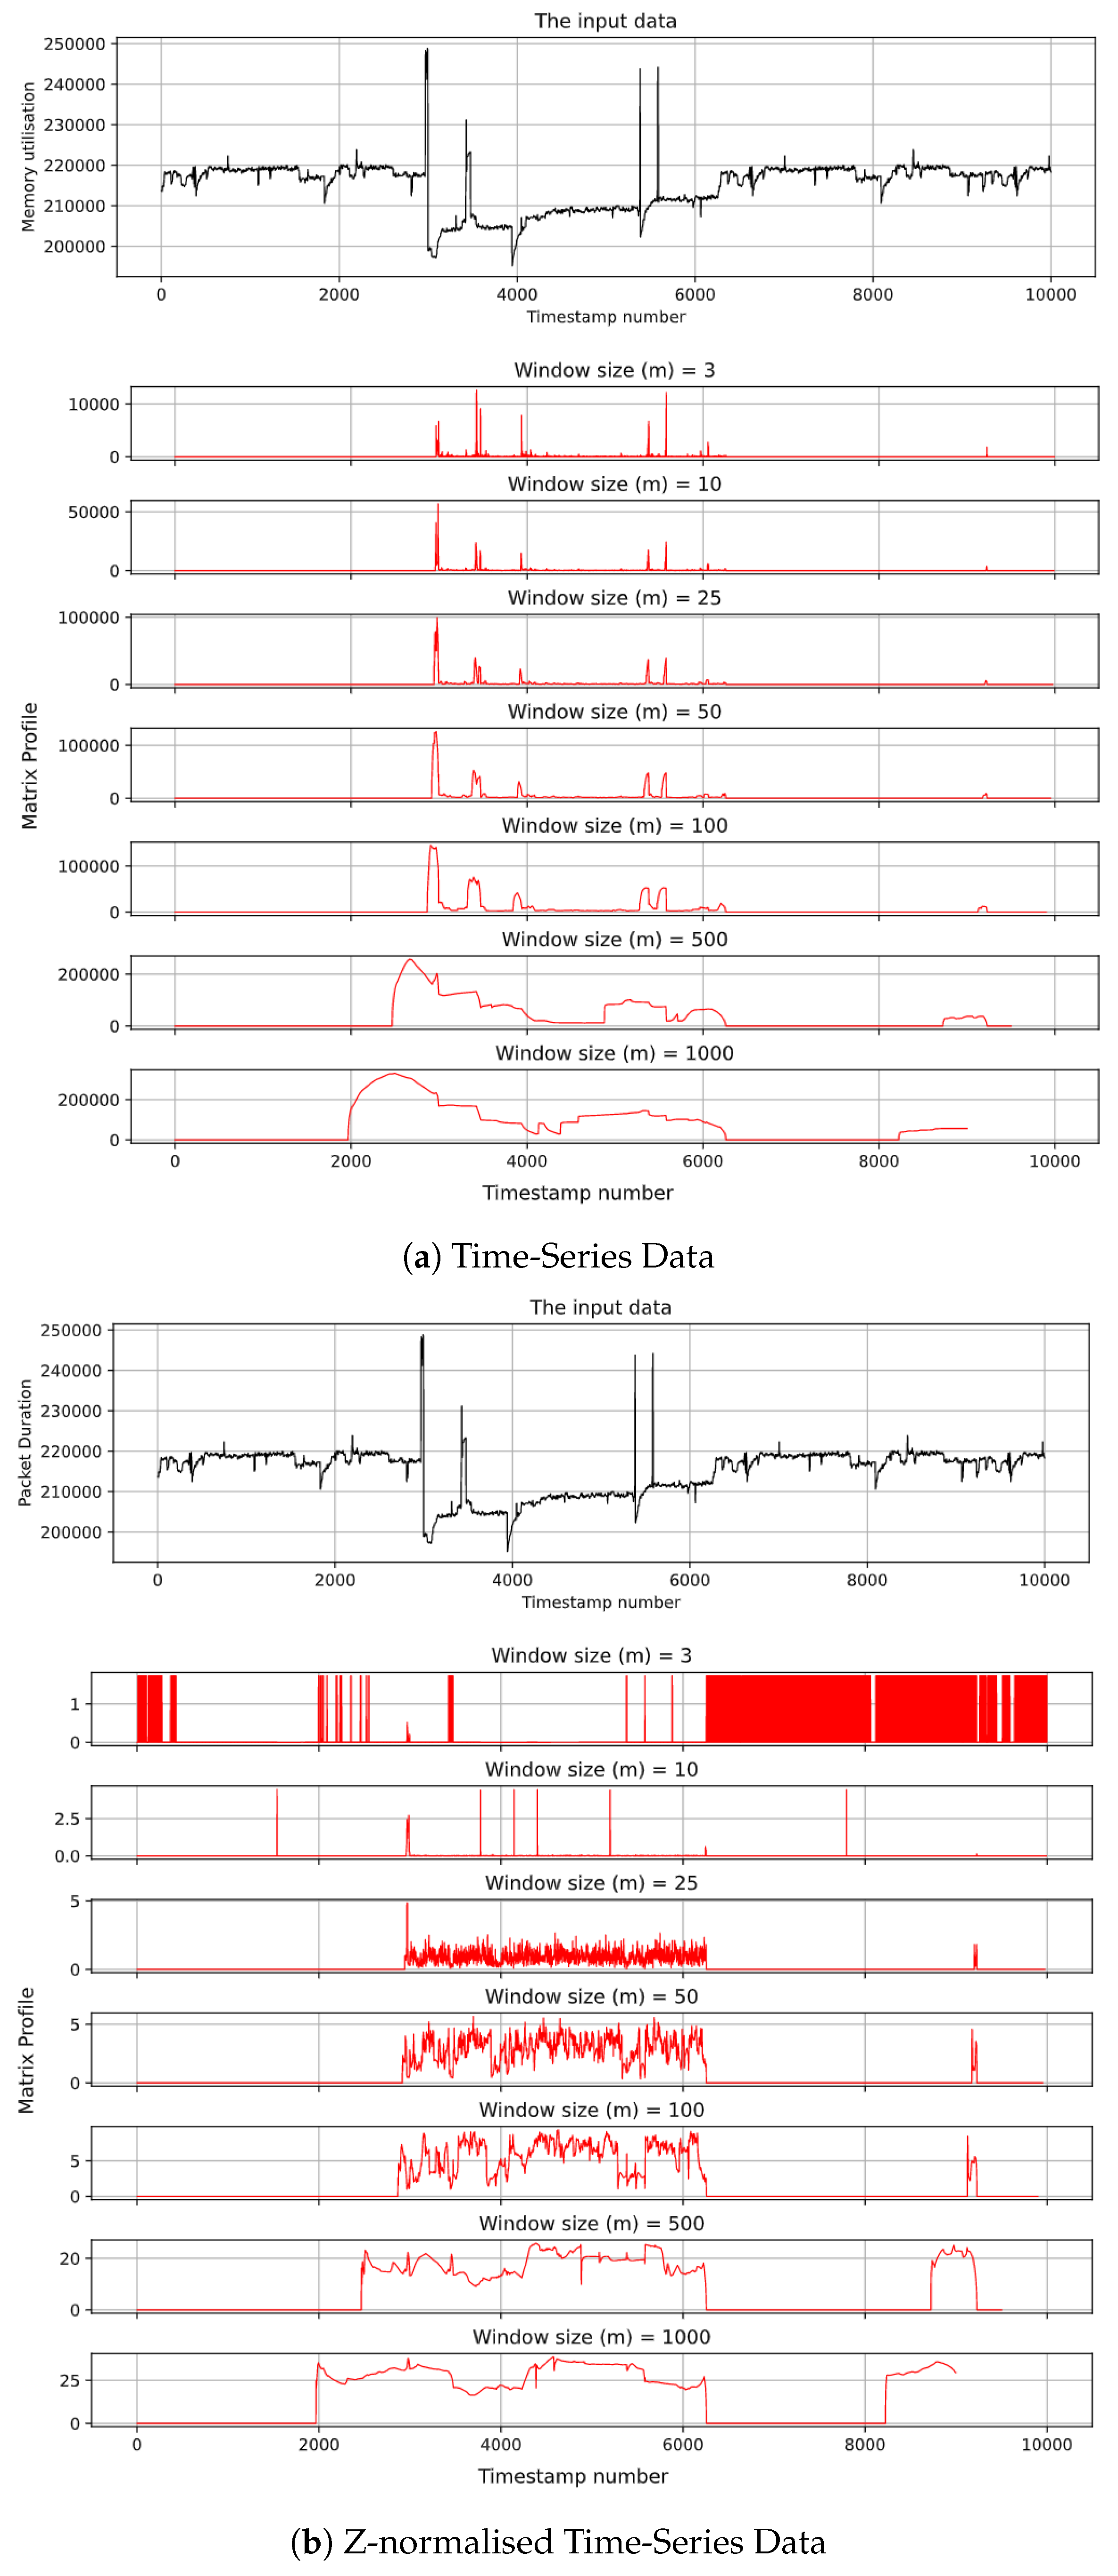
Figure 15 demonstrates the matrix profile calculation for time-series data (memory utilisation of SC) with different values of window size (3, 10, 25, 50, 100, 500, and 1000). Note that we begin with 3 because 3 is the smallest number that we can use as a window size in matrix profile. As can be seen, the algorithm successfully identified the anomaly in the data that occurred because of a DDoS attack. It is worth mentioning that the anomaly is clearer when using a larger window size. However, it should be kept in mind that the length of the matrix profile is equal to the data minus the window size. Therefore, if the window size is large, for example, 1000, then the attack occurred at the time of detection plus window size.
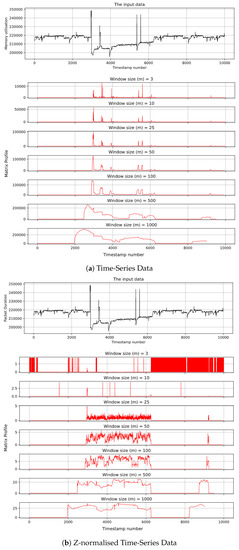
Figure 15.
Matrix profile for memory utilisation using different window sizes.
On the other hand, Figure 15b illustrates the matrix profile for Z-normalised time-series data (memory utilisation of SC). This figure shows that window size can affect the accuracy of the matrix profile algorithm. The outcome shows that when the window size is small, the accuracy is negatively affected in the Z-normalised time-series data. This is because the Z-normalised data are less sensitive to change. Therefore, when using a small window size, the algorithm may fail to detect the anomaly in the data. However, the runtime of the matrix profile algorithm when using Z-normalised data is shorter.
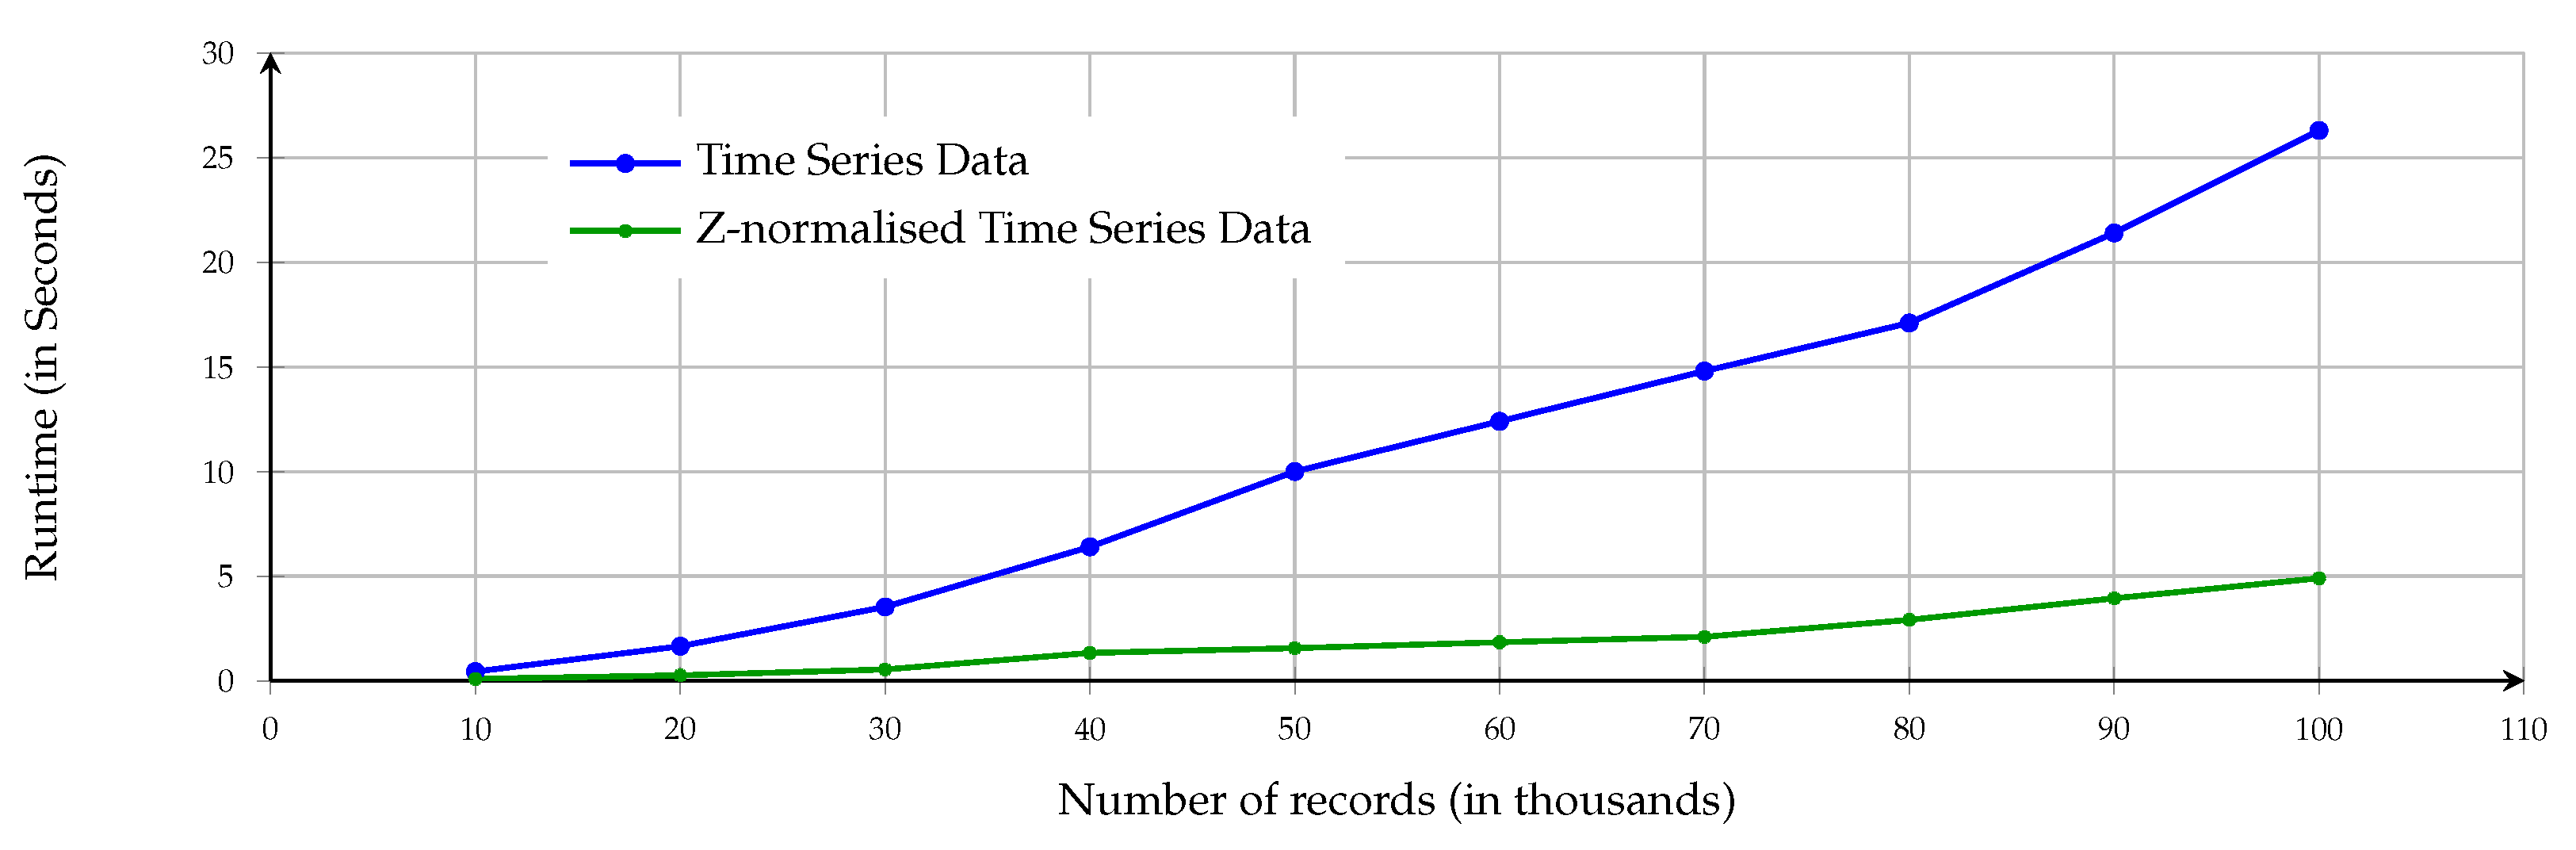
Figure 16 depicts a matrix profile algorithm runtime comparison between using time-series data and Z-normalised time-series data. The figure shows that there is almost no difference between using time-series data and Z-normalised data with matrix profile in terms of calculation time when the size of the data is small (around 10 K). On the other hand, the figure highlights that runtime using Z-normalised time-series data is much shorter than the runtime using the matrix profile algorithm with time-series data. Therefore, we recommended using Z-normalised time-series data when the size of the data is large.
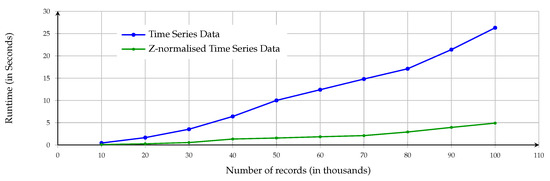
Figure 16.
Matrix profile algorithm runtime with time-series data and Z-normalised time-series data.
Table 1 shows the number of true positives and false positives from the experiment. It also shows the precision of the algorithm. Note that Equation (5) is utilised to calculate the precision of the matrix profile algorithm when using time-series data and Z-normalised time-series data with different values of window sizes [43]. The table shows that the precision of the matrix profile algorithm with time-series data is much better than that of using Z-normalised time-series data because the matrix profile algorithm becomes less sensitive to anomaly data when using Z-normalised data.

Table 1.
Precision of matrix profile. FP = False Positive; TP = True Positive.
In addition, paper [44] used an unsupervised machine learning algorithm to detect DDoS attacks in the same dataset. The accuracy of their algorithm is around 87%. However, the precision of this algorithm is varied from one DDoS attack to another. For example, the precision of their algorithm is 28% for UDP DDoS attacks, whereas it is 100% for TCP DDoS attacks. Comparing this result with our finding, our algorithm is data agnostic because it analyses the symptoms of the DDoS attack and not the traffic itself. Thus, the precision is the same, disregarding the type of DDoS attack. The precision of our algorithm varies from 80% to 100%.
5. Future Work
The outcome of our experiment shows that using a Z-normalised time-series data matrix profile can be efficient when dealing with large datasets. It is also helpful with noisy data. Further, more experiments are required in this area. Investigating the victim side using matrix profile could be another area of research. Finally, investigating using matrix profile in a real-time or near-real-time model is a good candidate for enhancing the current model; we propose using a buffer with a limited time window and analysing data using matrix profile in near-real-time. More investigation is needed to evaluate the effectiveness of matrix profile in online settings.
6. Conclusions
This paper illustrated that the matrix profile algorithm could be a very efficient tool for detecting malicious attacks via discovering respective symptoms rather than monitoring traffic directly. The findings showed that the precision of the matrix profile algorithm is 93.33–100% when using time-series data, whereas the accuracy of the algorithm is 80–100% when using Z-normalised time-series data, see Table 1. Regarding computation time, the matrix profile algorithm managed to detect DDoS in 5 s in a time series with 100K reading, and 25 s for the same number of readings for time-series data. Furthermore, this paper showed that the runtime of the algorithm could be improved using Z-normalised time-series data, as the runtime can be 20% of the computation time of the matrix profile algorithm using time-series data, see Figure 16. Finally, the findings demonstrated that the matrix profile algorithm is scalable, as shown in Figure 16, and is a data-agnostic tool that does not require specific experience to utilise.
Author Contributions
Supervision, A.M.A. and M.S.S.; Writing—original draft, M.A.A.; Writing—review and editing, A.M.A. and M.S.S. All authors have read and agreed to the published version of the manuscript.
Funding
This research received no funding.
Institutional Review Board Statement
Not applicable.
Informed Consent Statement
Not applicable.
Data Availability Statement
Not applicable.
Conflicts of Interest
The authors declare no conflict of interest.
References
- Bouhaï, N.; Saleh, I. Internet of Things: Evolutions and Innovations; John Wiley & Sons: Hoboken, NJ, USA, 2017. [Google Scholar]
- Weber, R.H.; Weber, R. Internet of Things; Springer: Berlin/Heidelberg, Germany, 2010; Volume 12. [Google Scholar]
- Syed, A.S.; Sierra-Sosa, D.; Kumar, A.; Elmaghraby, A. IoT in Smart Cities: A Survey of Technologies, Practices and Challenges. Smart Cities 2021, 4, 429–475. [Google Scholar] [CrossRef]
- Chen, W.; Xiao, S.; Liu, L.; Jiang, X.; Tang, Z. A DDoS attacks traceback scheme for SDN-based smart city. Comput. Electr. Eng. 2020, 81, 106503. [Google Scholar] [CrossRef]
- Nasr, E.Y.; Shahrour, I.; Nakhle, F.E.; Sakr, D.R.; Karam, L.Y. Smart City DDoS Attacks Maneuver Based on Identification, Heuristics and Load Balancers. Int. J. Sci. Eng. Res. 2018, 9, 1285–1294. [Google Scholar] [CrossRef]
- Kitchin, R.; Dodge, M. The (in) security of smart cities: Vulnerabilities, risks, mitigation, and prevention. J. Urban Technol. 2019, 26, 47–65. [Google Scholar] [CrossRef]
- Janani, R.; Renuka, K.; Aruna, A.; Lakshmi , N.K. IoT in smart cities: A contemporary survey. Glob. Transit. Proc. 2021, 2, 187–193. [Google Scholar]
- Zhao, F.; Fashola, O.I.; Olarewaju, T.I.; Onwumere, I. Smart city research: A holistic and state of the art literature review. Cities 2021, 119, 103406. [Google Scholar] [CrossRef]
- Ma, C. Smart city and cyber-security; technologies used, leading challenges and future recommendations. Energy Rep. 2021, 7, 7999–8012. [Google Scholar] [CrossRef]
- Traer, S.; Bednar, P. Motives Behind DDoS Attacks. In Digital Transformation and Human Behavior; Metallo, C., Ferrara, M., Lazazzara, A., Za, S., Eds.; Springer International Publishing: Cham, Switzerland, 2021. [Google Scholar]
- Bouyeddou, B.; Kadri, B.; Harrou, F.; Sun, Y. DDOS-attacks detection using an efficient measurement-based statistical mechanism. Eng. Sci. Technol. Int. J. 2020, 23, 870–878. [Google Scholar] [CrossRef]
- Kajwadkar, S.; Jain, V.K. A Novel Algorithm for DoS and DDoS attack detection in Internet Of Things. In Proceedings of the 2018 Conference on Information and Communication Technology, Yogyaka, Indonesia, 6–7 March 2018. [Google Scholar] [CrossRef]
- Praseed, A.; Thilagam, P.S. DDoS attacks at the application layer: Challenges and research perspectives for safeguarding web applications. IEEE Commun. Surv. Tutor. 2018, 21, 661–685. [Google Scholar] [CrossRef]
- Hwang, R.H.; Peng, M.C.; Huang, C.W. Detecting IoT Malicious Traffic Based on Autoencoder and Convolutional Neural Network. In Proceedings of the 2019 IEEE Globecom Workshops (GC Wkshps), Waikoloa, HI, USA, 9–13 December 2019. [Google Scholar] [CrossRef]
- Misra, S.; Krishna, P.V.; Agarwal, H.; Saxena, A.; Obaidat, M.S. A Learning Automata Based Solution for Preventing Distributed Denial of Service in Internet of Things. In Proceedings of the 2011 International Conference on Internet of Things and 4th International Conference on Cyber, Physical and Social Computing, Dalian, China, 19–22 October 2011. [Google Scholar] [CrossRef]
- Ye, J.; Cheng, X.; Zhu, J.; Feng, L.; Song, L. A DDoS attack detection method based on SVM in software defined network. Secur. Commun. Netw. 2018, 2018, 9804061. [Google Scholar] [CrossRef]
- Tuan, T.A.; Long, H.V.; Son, L.H.; Kumar, R.; Priyadarshini, I.; Son, N.T.K. Performance evaluation of Botnet DDoS attack detection using machine learning. Evol. Intell. 2020, 13, 283–294. [Google Scholar] [CrossRef]
- Wani, A.R.; Rana, Q.; Saxena, U.; Pandey, N. Analysis and detection of DDoS attacks on cloud computing environment using machine learning techniques. In Proceedings of the 2019 Amity International Conference on Artificial Intelligence, Dubai, United Arab Emirates, 4–6 February 2019; IEEE: Piscataway, NJ, USA, 2019. [Google Scholar]
- Fanelli, A.M. Recent Advances in Artificial Neural Networks: Design and Applications; CRC Press: Boca Raton, FL, USA, 2018. [Google Scholar]
- Alanis, A.Y.; Arana-Daniel, N.; Lopez-Franco, C. Artificial Neural Networks for Engineering Applications; Academic Press: Cambridge, MA, USA, 2019. [Google Scholar]
- Yegnanarayana, B. Artificial Neural Networks; PHI Learning Pvt. Ltd.: Delhi, India, 2009. [Google Scholar]
- Ma, Y.; Guo, G. Support Vector Machines Applications; Springer: Berlin/Heidelberg, Germany, 2014; Volume 649. [Google Scholar]
- Suthaharan, S. Support vector machine. In Machine Learning Models and Algorithms for Big Data Classification; Springer: Berlin/Heidelberg, Germany, 2016. [Google Scholar]
- Alkahtani, H.; Aldhyani, T.H.; Al-Yaari, M. Adaptive anomaly detection framework model objects in cyberspace. Appl. Bionics Biomech. 2020, 2020, 6660489. [Google Scholar] [CrossRef] [PubMed]
- Mohammed, M.A.; Abd Ghani, M.K.; Hamed, R.I.; Mostafa, S.A.; Ibrahim, D.A.; Jameel, H.K.; Alallah, A.H. Solving vehicle routing problem by using improved K-nearest neighbor algorithm for best solution. J. Comput. Sci. 2017, 21, 232–240. [Google Scholar] [CrossRef]
- Wibowo, B.; Alaydrus, M. Smart Home Security Analysis Using Arduino Based Virtual Private Network. In Proceedings of the 2019 Fourth International Conference on Informatics and Computing, Semarang, Indonesia, 16–17 October 2019. [Google Scholar] [CrossRef]
- Majed, H.; Noura, H.N.; Salman, O.; Malli, M.; Chehab, A. Efficient and Secure Statistical DDoS Detection Scheme. In Proceedings of the ICETE, Paris, France, 8–10 July 2020. [Google Scholar]
- Xia, W.; Wen, Y.; Foh, C.H.; Niyato, D.; Xie, H. A survey on software-defined networking. IEEE Commun. Surv. Tutor. 2014, 17, 27–51. [Google Scholar] [CrossRef]
- Ahuja, N.; Singal, G.; Mukhopadhyay, D.; Kumar, N. Automated DDOS attack detection in software defined networking. J. Netw. Comput. Appl. 2021, 187, 103108. [Google Scholar] [CrossRef]
- Wang, B.; Zheng, Y.; Lou, W.; Hou, Y.T. DDoS attack protection in the era of cloud computing and software-defined networking. Comput. Netw. 2015, 81, 308–319. [Google Scholar] [CrossRef]
- Xiao, P.; Qu, W.; Qi, H.; Li, Z. Detecting DDoS attacks against data center with correlation analysis. Comput. Commun. 2015, 67, 66–74. [Google Scholar] [CrossRef]
- Zhang, C.; Green, R. Communication security in internet of thing: Preventive measure and avoid DDoS attack over IoT network. In Proceedings of the 18th Symposium on Communications & Networking, Alexandria, VA, USA, 12–15 April 2015. [Google Scholar]
- Bremler-Barr, A.; Brosh, E.; Sides, M. DDoS attack on cloud auto-scaling mechanisms. In Proceedings of the IEEE INFOCOM 2017—IEEE Conference on Computer Communications, Atlanta, GA, USA, 1–4 May 2017. [Google Scholar]
- Liao, H.J.; Richard Lin, C.H.; Lin, Y.C.; Tung, K.Y. Intrusion detection system: A comprehensive review. J. Netw. Comput. Appl. 2013, 36, 16–24. [Google Scholar] [CrossRef]
- The UCR Matrix Profile Page. Available online: https://www.cs.ucr.edu/~eamonn/MatrixProfile.html (accessed on 30 January 2022).
- Introduction To Matrix Profile. Available online: https://towardsdatascience.com/introdu-ction-to-matrix-profiles-5568f3375d90 (accessed on 30 January 2022).
- Yeh, C.C.M.; Zhu, Y.; Ulanova, L.; Begum, N.; Ding, Y.; Dau, H.A.; Silva, D.F.; Mueen, A.; Keogh, E. Matrix profile I: All pairs similarity joins for time series: A unifying view that includes motifs, discords and shapelets. In Proceedings of the 2016 IEEE 16th International Conference on Data Mining (ICDM), Barcelona, Spain, 12–15 December 2016; IEEE: Piscataway, NJ, USA, 2016. [Google Scholar]
- The Matrix Profile. Available online: https://stumpy.readthedocs.io/en/latest/Tutorial_The-_Matrix_Profile.html (accessed on 30 January 2022).
- Matrix Profile Foundation. Available online: https://matrixprofile.org/posts/how-to-painlessly-analyze-your-time-series/ (accessed on 2 February 2022).
- Zhu, Y.; Zimmerman, Z.; Senobari, N.S.; Yeh, C.C.M.; Funning, G.; Mueen, A.; Brisk, P.; Keogh, E. Matrix profile ii: Exploiting a novel algorithm and gpus to break the one hundred million barrier for time series motifs and joins. In Proceedings of the 2016 IEEE 16th International Conference on Data Mining (ICDM), Barcelona, Spain, 12–15 December 2016; IEEE: Piscataway, NJ, USA, 2016. [Google Scholar]
- Law, S.M. STUMPY: A Powerful and Scalable Python Library for Time Series Data Mining. J. Open Source Softw. 2019, 4, 1504. [Google Scholar] [CrossRef]
- Bezerra, V.H.; da Costa, V.G.T.; Martins, R.A.; Junior, S.B.; Miani, R.S.; Zarpelao, B.B. Providing IoT host-based datasets for intrusion detection research. In Proceedings of the Anais do XVIII Simpósio Brasileiro de Segurança da Informação e de Sistemas Computacionais, Porto Alegre, Brasil, 22–25 October 2018; SBC: Augusta, GA, USA, 2018. [Google Scholar]
- Awoyemi, J.O.; Adetunmbi, A.O.; Oluwadare, S.A. Credit card fraud detection using machine learning techniques: A comparative analysis. In Proceedings of the 2017 International Conference on Computing Networking and Informatics (ICCNI), Lagos, Nigeria, 29–31 October 2017. [Google Scholar] [CrossRef]
- Nakagawa, F.H.; Junior, S.B.; Zarpelão, B.B. Attack Detection in Smart Home IoT Networks using CluStream and Page-Hinkley Test. In Proceedings of the 2021 IEEE Latin-American Conference on Communications (LATINCOM), Santo Domingo, Dominican Republic, 17–19 November 2021; IEEE: Piscataway, NJ, USA, 2021. [Google Scholar]


Publisher’s Note: MDPI stays neutral with regard to jurisdictional claims in published maps and institutional affiliations. |
© 2022 by the authors. Licensee MDPI, Basel, Switzerland. This article is an open access article distributed under the terms and conditions of the Creative Commons Attribution (CC BY) license (https://creativecommons.org/licenses/by/4.0/).