1. Introduction
Building muscle endurance takes time and consistency in training in a context in which muscles adapt quickly to exercises and the way they are performed. The way the muscle adapts to resistance training depends on several variables such as the load, volume, frequency of training, speed of contraction, work-to-rest ratios and time under tension [
1]. In training, one approach is to base the prescription on the number of repetitions. The number of repetitions left in reserve in a training set is correlated with the level of effort [
2]. However, some studies show that there are difficulties in predicting the proximity of momentary task failure [
3] or the number of repetitions in reserve [
4].
The maximum number of repetition is obtained and maintained due to the intensity, volume and metabolic response to a workload [
1,
5]. According to [
6,
7,
8], the numbers of possible repetitions prior to failure at the same relative intensity (%1RM) vary between exercises and individuals.
Training to failure and the maximum number of repetitions (MNR) strategy, according to [
9,
10], are not optimal for maximizing performance. Additionally, it is difficult to determine the exact number of repetitions left in reserve. So, understanding the physiognomy of the sets can be useful for predicting the number of repetitions left in reserve in a training set.
The factors that influence the maximum number of repetitions in the case of bicep curls were analyzed by Iglesias et al. There is an inverse relationship between MNR and relative intensity, defined by the load ratio per maximum one-repetition attempt, 1RM [
11].
Related to the influence of the training experience upon the MNR, studies that have evaluated the MNR between individuals with different training experience shows little [
12] or no influence [
13] on this variable.
Some strategies were developed in order to increase the MNR and training intensity. Pedrosa et al. [
14] showed that a greater number of repetitions with a shorter mean repetition duration were performed in the barbell bench press exercise with an elastic device named the Sling Shot than without it, regardless of the individuals’ training experience.
The literature also presents special programs dedicated to increasing training intensity: the method of reducing rest periods between sets (e.g., Nubret), based on the traditional training objective which manages the ability to recover between sets [
15,
16]; superset training, based on muscle pairs, takes advantage of the contraction of antagonistic muscles and the reduction in rest-on periods, offering very good results for short training times [
17,
18,
19]; compound-set training, which is similar to superset training with the exception that it refers to exercises for the same muscle group, reducing the duration of training and high-intensity training, which produces a dramatic increase in intensity (i.e., beyond the point of muscle failure) in terms of volume reduction and training duration reduction [
20,
21,
22].
It also seems intuitive to suggest that there may be differences between the repetitions during the entire cycle, in the case of the MNR strategy.
Reiser et al. presents the problem of morphological differences between the beginning and the end of a repetition, highlighting factors that influence the intensity of a conventional bicep curl; in this case, the critical role of acceleration is highlighted for the first time [
23].
Nolte et al. presented a three-dimensional musculoskeletal model of the seated bicep curl resistance training exercise in which the influence of small deviations from the ideal trajectory is highlighted [
24]. In the literature, there are also references to the models of kinematics, kinetics and muscle activation during explosive upper body movements, focusing on large muscle groups, but in this case, no reference is made to small groups.
Based on the literature review, some gaps have been found in this field. Different studies have focused on the analysis of the MNR and 1RM in subjects with different training backgrounds [
11,
25,
26]; however, there are a small number of contributions focused on the physiognomy of the repetitions in an execution to the point of refusal with light weights, as well as the MNR impact on the performance of subjects after long periods of physical inactivity.
Another very little-studied problem in the case of small muscle groups is understanding the major differences between the physiognomy of repetitions during the entire cycle, in the case of the MNR strategy, starting from comparisons of the pairs of the first and last repetitions. The interest was in analyzing the mechanisms of developing muscular endurance in a small group, based on high-volume training. The main objective was to analyze the correlations between Scott machine load and the dynamics of force over the entire set, but also the concentric phase of the relevant repetition considering the strategy of maximum number of repetitions (i.e., typically at 30–40 %1RM relative intensity) and the impact of the initial stage of resuming strength training.
The analysis of the correlations between the maximal forces, volume and duration of an MNR set in the case of one-arm Scott machine seated bicep curls represents a novelty in the field of strength training, especially in the context of the difficulty in evaluating performances, generally expressed by relative intensity (%1RM) and the correlation with MNR, respectively.
We hypothesized that: (i) there is a relationship between the MNR, maximum force (Fmax) and the machine load; (ii) there are differences between the maximum forces developed during the initial and final repetitions of the exercise sets or for the different machine loads; (iii) the duration of the MNR strategy set increases while the machine load is reduced and (iv) the deterioration of the execution mode is different for the initial and final repetitions.
2. Materials and Methods
2.1. Participants
In this research, we proposed the research of a specific exercise for a small muscle group, on a relatively large sample of young people with relatively similar abilities (students at the Transilvania University of Brasov). GPower software (version 3.1.9.4, University of Düsseldorf, Düsseldorf, Germany) was used to calculate the sample size, considering an effect size of 0.4 for a recreationally trained population [
27], power (1–β) of 0.8 and an α level of 0.05. Accordingly, 34 participants would be required as a necessary sample size.
As such, 35 participants, male students at the Transilvania University of Brașov, were recruited to participate in this study. The inclusion and exclusion criteria for participation in the study were: (a) having at least one year of experience in weightlifting, as a hobby; (b) spending a minimum of 2 days per week training and (c) having no previous injuries which may interfere with the study.
Five participants were excluded due to a loss of interest and personal issues, and the final sample included 30 participants (20.1 ± 1.6 years; 80 ± 3.5 kg) with experience of 23.8 ± 7.2 months and a frequency of 3 ± 1.1 times/week.
The subjects were informed of the research procedure and gave their consent. The experimental procedure was approved by the local ethics committee of the Transilvania University. The muscle testing was performed in the Department of Motor Performance of the Transilvania University of Brașov.
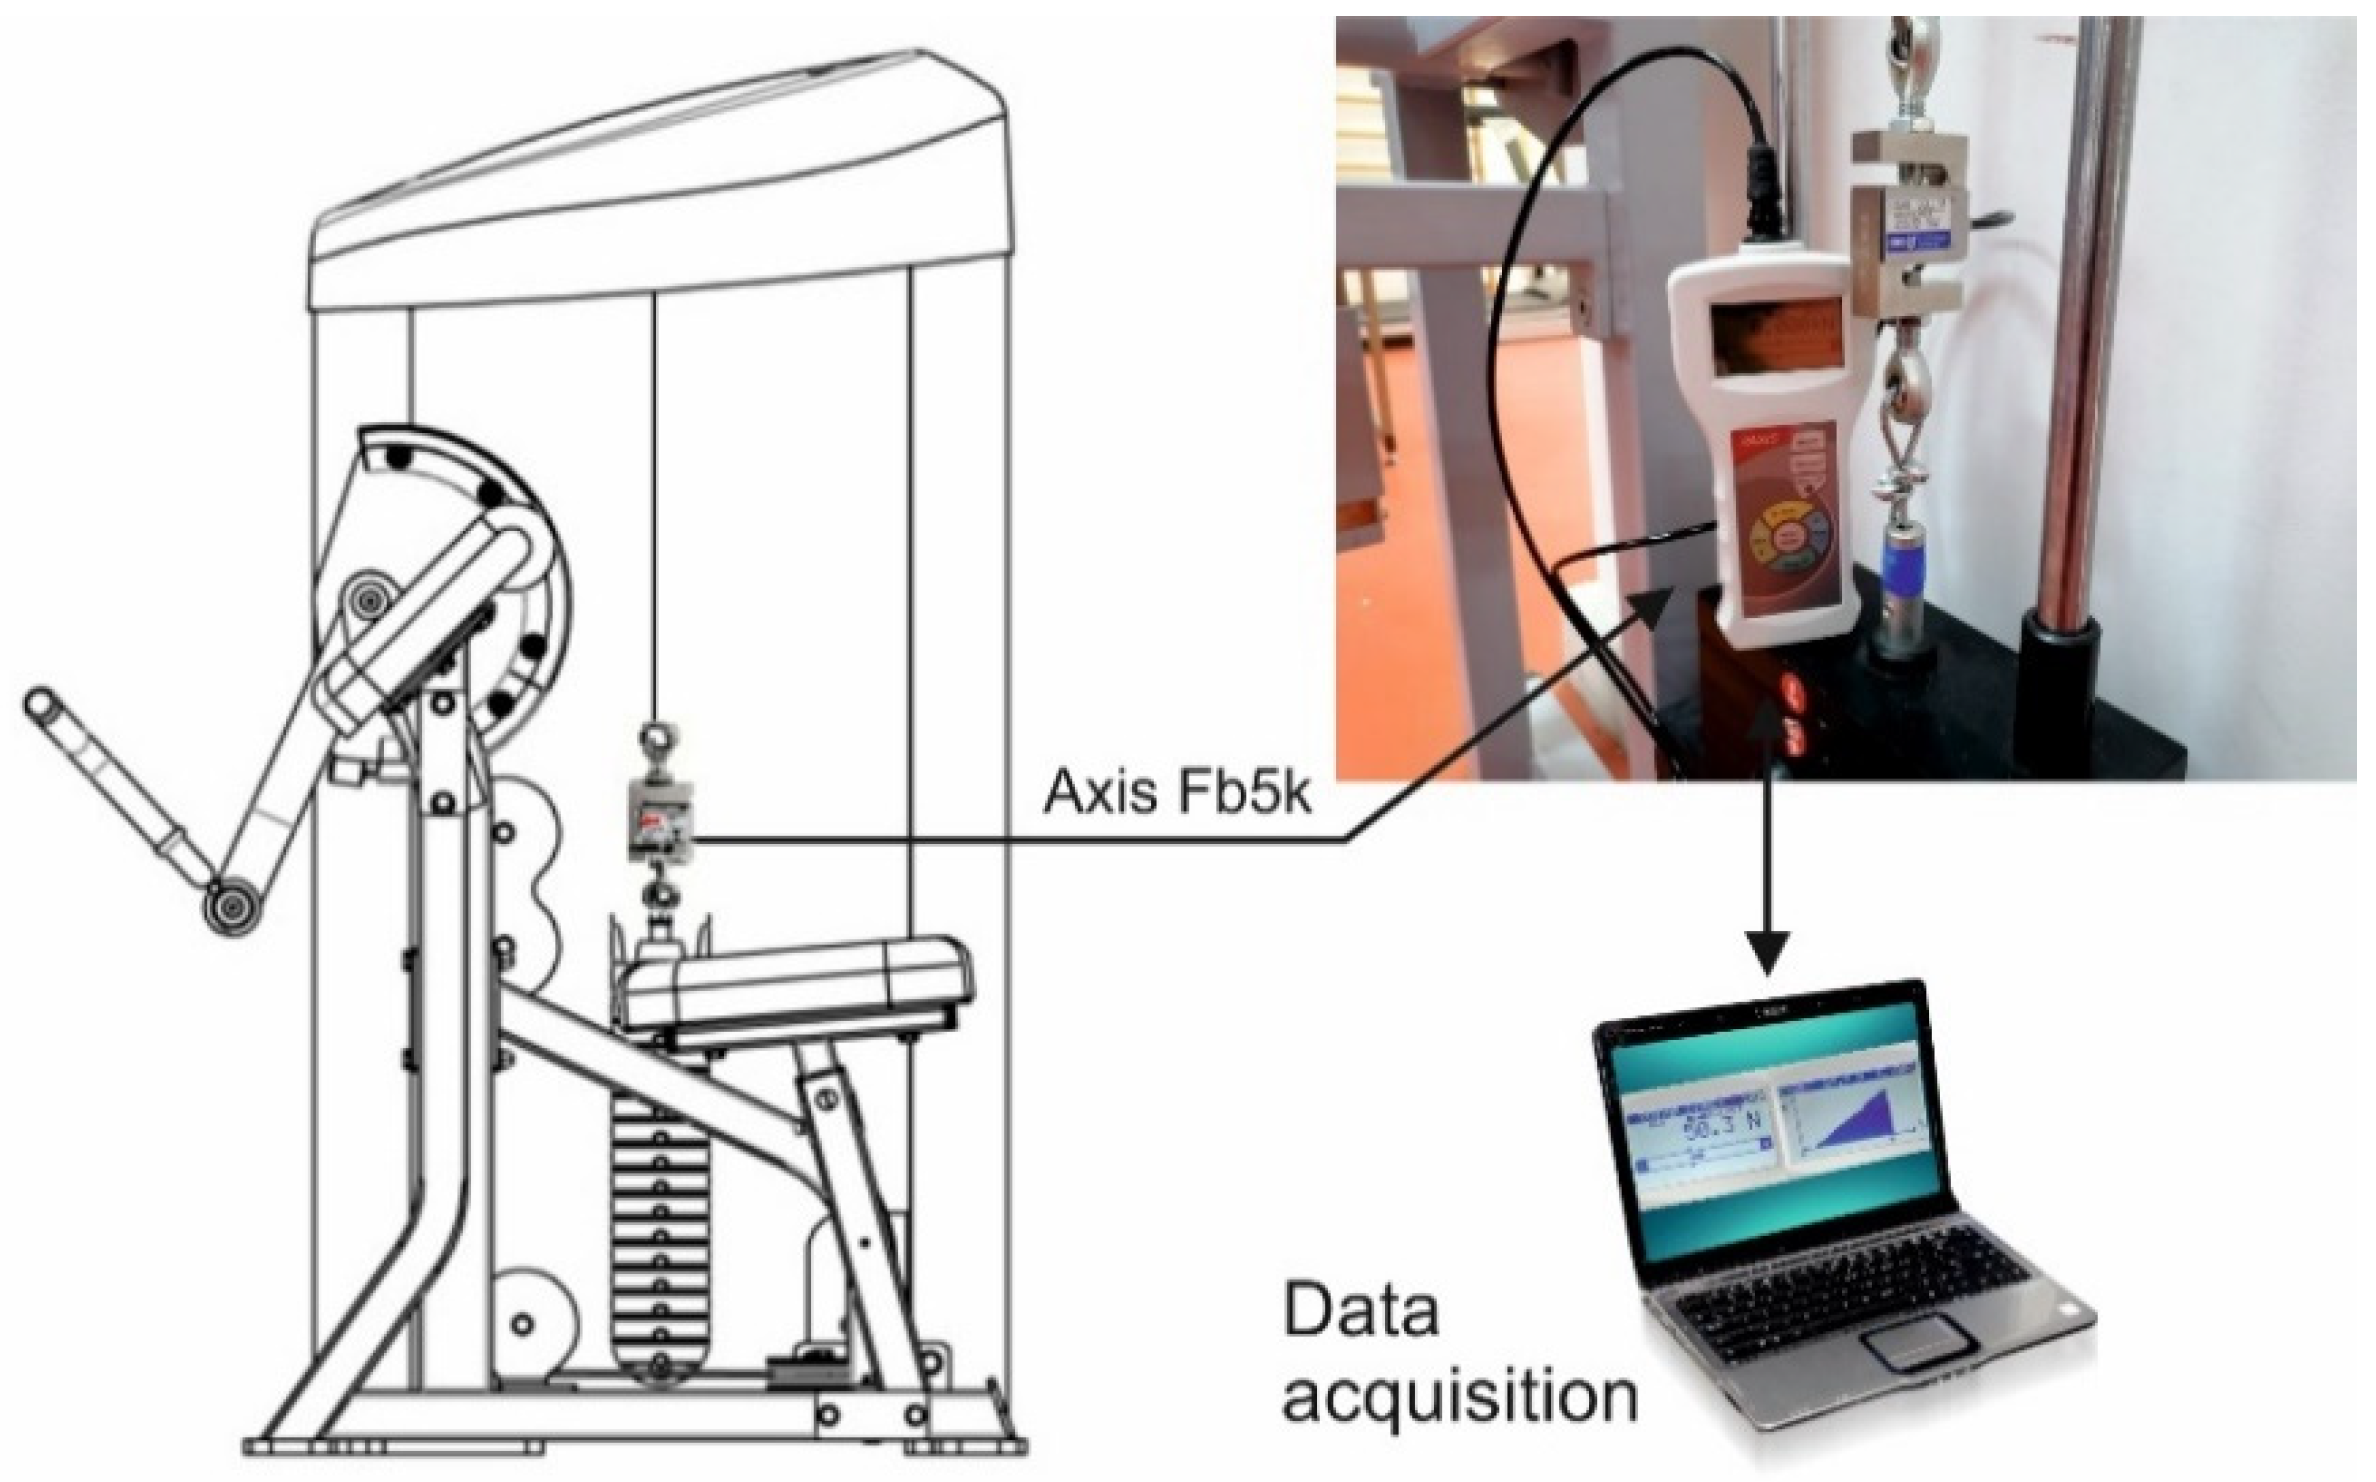
2.2. Components of Experimental Setup
The experimental setup used for determining the forces developed at muscle contraction, in the cases of 10 and 5 kg load, consisted of several components, as presented in
Figure 1.
The machine used for the experiment was the Scott machine for seated bicep curls (SM-SBCs), supporting standard weights of 10 × 8 kg + 5 × 5 kg. The dynamometer used for determining the forces developed during the exercise was manufactured by AXIS FM, and was model Fb5k. The capacity of the dynamometer was 5000 N and the accuracy was ±0.1%. The measurement speed was from 10 to 40 measurements/second. The values were obtained by means of Axis FM software. Axis FM software allows the following operations to take place: reading device information; reading the information on the display, in real time; recording measurements on the computer while the dynamometer is connected to the PC and the program is working; downloading data saved in the device memory; viewing measurements with diagrams and statistics; saving measurements and diagrams in files; controlling the dynamometer functions from the computer keyboard and changing the working settings of the device in the program.
2.3. The Selection of Bicep Curl Exercise
Bicep curls (BC) involve the biceps brachii, one of the main muscles of the upper arm which acts on both the shoulder joint and the elbow joint. In this type of exercise, there are differences in the implementation (e.g., free weight lifting vs. machines) and the involved muscle groups also depend on the grip (e.g., supination vs. pronation).
Regardless of the bicep curl type, the execution requires that the elbow flexion range of motion be performed completely. The isolation or elimination of the contribution of the shoulders and back must be taken in consideration. By selecting the exercise, the correct execution was required as well as the elimination of the contribution of adjacent muscle groups, a particularly important aspect in testing small muscle groups. We opted for one-arm SM-SBCs due to the fact that the machine offers faster measurement possibilities, avoiding errors due to the 3D movements, and those introduced by specific free-weight BC, which could be affected by small cheats. The machine also offers the possibility of more accurate execution and at a more uniform rhythm.
Preliminary discussions with the participants showed that regardless of the selection of exercises in these routines, there is a distinct place for the arm exercises, especially the biceps (e.g., dumbbell/barbell curls standing/seated/incline/preacher curls); this is due to the simplicity of these exercises, but also to the visibility and the ability to quickly evaluate the first results. These exercises are suitable for light load–high repetition training in which the use of slow-twitch muscle fibers is highlighted, and for specific endurance training for small muscle groups such as the biceps.
The used strategy for the research was one set of training to failure, which can provide a quick boost after a period of inactivity because it creates a critical amount of metabolic stress and muscular damage to further endurance development.
2.4. The Procedure of Testing the Subjects
The methodology of the research was adapted to the ambitious objectives of this research, and the particularities of the exercise. It is innovative and it started from the calibration of the subjects for maximum repetition (i.e., 1RM one-arm SM-SBCs), followed by a set of repetitions to the point of refusal with light weights.
Step 1: The first step was to perform a one-repetition-maximum test in order to calibrate the subjects, which was performed 48–72 h before. 1RM measurement refers to the maximum force on the concentric phase of a single repetition. The subjects had the opportunity to select their best performance from successive attempts with 5 min of rest between them.
Step 2: The subjects continued to use one-arm SM-SBCs with one set of training to failure with two different types of load on the Scott machine: 10 kg and 5 kg.
In Step 2, the experiment was performed as follows:
The participant sat down on the bicep Scott machine.
The machine load of 10 kg/5 kg was chosen, according to the MNR strategy, and the machine set to a typical 30–40% relative intensity.
The starting position was set, with the subject positioning the triceps of the dominant hand on the preacher pad and grasping the handle.
The exercise was performed, with the subject lifting the hand and contracting the biceps.
At each repetition, the forces was measured by means of the dynamometer.
The execution was performed to the point of refusal. The maximum number of repetitions was counted.
After the exercise was performed, 48–72 h of rest was allowed in order for the muscle to stabilize. The subjects were monitored for execution mode, with the hand-to-shoulder starting position of the dominant hand, the wrist joint following the forearm, with complete movement.
The measurements were repeated for each subject and mediation of the results was conducted, in order to understand the dynamics of a set using the MNR strategy and analyze the first/last relevant repetition. The expected results refer to the execution mode: the durations of the phases in a repetition cycle, the equation of the dynamics of the force on the concentric phase, the developed impulse and other useful elements in the in-depth understanding of the MNR strategy.
The research design was adapted to the sample of relatively homogeneous subjects and to the characteristics of the selected exercise. The methodology combines several work procedures, among which was 1RM testing, the performance averaging method (i.e., allowed by the experimental setting specific to the selected exercise), the comparative analysis of the force evolution depending on the duration of the prolonged sets, with the study of the major differences at the level of the initial versus the final repetitions using the MNR strategy.
Figure 2 presents a flow chart of the experimental test procedure and shows the particularities of the experimental methodology, adapted to the MNR strategy, to the specific characteristics of the muscle group and to the selected exercise.
2.5. Data Analysis
The data analysis was performed using IBM SPSS Statistics for Windows, version 20.0 (IBM Corp., Armonk, NY, USA). The associations between the variables were analyzed using independent
t-test samples. Some correlations between the variables were determined. A correlational value above 0.5 was considered to be strong, values between 0.3 and 0.49 were considered moderate, and any value less than 0.29 was considered to be poor [
28].
A paired
t-test was conducted in order to compare the maximum forces developed during the initial and final repetitions of the exercise set, or for the different machine loads. Data analysis was carried out at a 0.05 significance level (
p), which means a 95% confidence level. The Cohen’s d effect sizes were calculated for each repetition pair (i.e., initial and final) and defined as trivial (<0.2), small (≥0.2), moderate (≥0.5) or large (≥0.8) [
28].
3. Results
The first testing phase considered the establishment of 1RM in the participants and 1RM in relation to the body mass of the subjects. The obtained values for 1RM were 0.24 ± 0.02 kN. In this case, the 1RM/body-mass rate was also calculated (0.31 ± 0.03).
In the second phase of testing, SM-SBCs for single-arm exercises were performed, using two machine loads of 10 kg and 5 kg, respectively.
Table 1 presents the descriptive statistics of the MNR and the maximum forces developed during the repetitions for the sample. At a low machine load, the maximum number of repetitions was increased.
The first hypothesis was confirmed by the correlation determined between the load, MNR and Fmax, respectively. There was a large correlation between load and maximum force (p < 0.01; r = 0.896) and an inverse correlation between load and MNR (p < 0.01; r = −0.949) and between MNR and Fmax (p < 0.01; r = −0.840).
The experimental research and the obtained results followed three directions. The first direction aimed to analyze two cycles of repetitions: one at the beginning of the exercise and one at the end, with the human carrying out a machine load of 10 kg.
The second direction followed the same methodology, for a machine load of 5 kg.
The purpose of the third direction was to make a comparison between the repetitions.
3.1. Detailed Analysis of the Typical Cycle of a Repetition for a 10 kg Load
For the analysis of a cycle of a repetition, a mediation of the obtained results was performed, due to the large number of records. The purpose of mediating the recordings was to understand the physiognomy of the relevant set using the MNR strategy.
The results are presented in the following lines, considering a machine load of 10 kg applied to the Scott machine.
As seen in
Figure 3, the MNR is 25 and the average duration of the repetitions is 2.26 s, considering the method of execution to the point of refusal, with a total duration of the set of 56.64 s. It is also noted that the maximum value of the recording force during the set did not deposit 0.142 kN, recorded at the seventh repetition (i.e., under the conditions of the average manner of execution of the relevant set, it was 34–42% higher than the static force of the Scott machine). This indicates the role of the accelerators in the case of a medium load for a small muscle group, with the subjects having the possibility to manage the effort. Regarding the problem of the relevance of the repetitions, the fact that the last repetition was canceled due to its incorrect execution was taken into account.
As seen in
Table 2, the forces reached a maximum point at each repetition, for the entire cycle. The average value of the maximum forces related to 1RM led us to obtain the relative intensity (%1RM).
The obtained value of the %1RM was 54%. This value may seem quite high, but the explanation also depends on the fact that the test procedure was aimed at a small muscle group and an exercise performed on a cable machine, and not with free-load.
The evolution of the maximum forces, in time, at each repetition, is shown in
Figure 4.
It can be observed that, in the first half of the set, there was a good regularity of frequency and amplitude; after that, the maximum force had a decrease followed by a return near the end of the set, in which the subjects tried to add an additional repetition by forcing the speed of execution.
3.1.1. Evaluation of the Cycle of One Repetition—Initial and Final
For an initial repetition, the evolution of the force for a cycle of one repetition is presented in
Figure 5a. The second repetition (R2) was analyzed, being more relevant than the first one; in this case, considering that the number of repetitions was high, it can be considered that this was the relevant initial repetition. There was an interesting physiognomy of R2, with a concentric phase with reduced oscillations around the trend and an eccentric phase with a long bearing around the reference.
It can also be observed in
Figure 5a that the ascending time (t
a) and the descending time (t
d) had very close values. The duration of R2 was 1.72 s, with t
a being 0.81 s.
For a final repetition (R24), the evolution of the force for a cycle of one repetition is presented in
Figure 5b. In this case, interesting mechanisms were observed. First, the duration of R24 was 4.38 s, with t
a being 0.41. A short t
d of 0.24 s was followed by a holding time (t
h) of 3.34 s. A sudden decrease of 0.39 s ended the final repetition cycle.
This result, observed and measured at R24 whereby the subjects maintained muscle contraction for a longer period, was surprising because there is energy consumption and the natural tendency would have been exactly the opposite. The explanation lies in the psychological pressure related to the failure to add a new repetition to the MNR set. However, there was an interesting implication of maintaining the muscle contraction in the proximal area of the maximum force (i.e., 85–90%) related to the execution of the exercise through which the MNR strategy determines this surprising behavior.
The amplitude of the oscillations on this level was higher, which confirms the effect of the subject’s fatigue, close to the exhaustion of the set.
3.1.2. Evaluation of the Superposition of the Relevant Repetitions
The idea of overlapping the concentric phase of R2 and R24 allowed us to understand how the bicep muscle adapted during exertion in a typical extended set, with MNR = 25.
Figure 6 presents the superposition of the forces’ evolution for the initial and final repetition in the case of the 10 kg machine load.
In the case of a 10 kg load, we can observe some differences between the first and last relevant repetitions. It can be seen that the time taken to reach the maximum value of the force was longer at the beginning. Additionally, the slope of the ascending curve (i.e., the geometric place of the mean values of the micro cycles) was less inclined in R2, which proves that, towards the end, a fatigue threshold was reached, which causes an increase in the execution speed on the concentric phase of the repetition cycle. Hence, the third hypothesis was validated.
A polynomial regression was found that presents the evolution of the forces in time, for each initial and final repetition. In
Figure 6, those regressions are represented by a red line. Identifying one type of regression could lead to the identification of different strategies for changing the way the exercise is performed. For the initial repetition, the regression that best fits the average values of the forces is presented in Equation (1). The coefficient of determination (R square) is 0.729 and interprets, as a percentage, how representative the regression line is for the investigated data (72%).
Based on the polynomial regression developed, the impulse was calculated by integration. For the period of reaching the highest force (i.e., 0.8 s), in the case of an initial repetition, the impulse was 0.041 kN·s.
The polynomial regression that best fits the measured average values for the final repetition is presented in Equation (2). R square for this regression is 0.607.
Based on Equation (2), the impulse developed at a final repetition, in 0.41 s, decreased at 0.023 kN·s. It can be observed that the impulse was 50% lower in the case of the final repetition.
Table 3 presents the results obtained from the paired
t-test application. It can be observed that, for the first relevant repetition, the mean of the maximum force values was 0.127 ± 0.004 kN, an 8% lower value than the mean of the final repetition of the exercise set, which was 0.138 ± 0.006 kN.
There was a significant average difference between R2_Fmax and R24_Fmax (t29 = 8.14, p ≤ 0.001), and R2_Fmax was 0.011 points lower than R24_Fmax. The second hypothesis was validated; there was a statistically significant difference between the maximum forces developed during the initial and final repetitions of the exercise set.
Cohen’s d was calculated in order to find the size of the difference between the means. The value was, in this case, −2.15, meaning a large effect size and a practical significance.
3.2. Detailed Analysis of the Cycle of a Repetition for a 5 kg Machine Load
In
Section 3.2 the procedure from
Section 3.1 and the execution mode of the reference set was repeated, with a machine load of 5 kg. As seen in
Figure 7, the medium duration of a typical repetition was 1.53 s, according to MNR = 40, and the total duration of a set was 61.49 s. Comparing to the duration of a typical cycle of repetitions of 2.26 s, in this case, the duration was reduced by 32%. The frequency of the repetitions was increased, which highlights that, due to the aim of obtaining as high an MNR value as possible, there was a tendency to increase the speed of execution. This translated into higher accelerations and values of the maximum force, which exceeded 0.105 kN, more than twice the load of the Scott machine.
Hence, the first important conclusion for this loading case was the tendency of subjects to increase the execution speed; this allowed an increase in the acceleration, transposed in the maximum double force compared to the loading of the machine, compared to an increase of only 35% in the case of loading in
Section 3.1. This observation also takes into account the 8.4% longer duration of the set, so a higher time-under-tension of the bicep muscle (i.e., 61.49 s vs. 56.64 s).
Although the load of the machine was reduced by half, the maximum force during the set was reduced by 22.2% (i.e., 0.105 kN vs. 0.142 kN), and the duration of the set, and therefore, the time under tension, increased by only 8.4%.
The intensity of %1RM was, in this case, 39%, which, for a number of 40 repetitions seems a high value. The explanations for the higher load are, thus, reconfirmed, with a special role of compensatory acceleration in the case of bicep curls, through which the subjects tried to pass quickly over the critical points in the concentric phase.
Table 4 presents the maximum values of the force for the execution cycle.
The evolution of the maximum forces for the entire cycle is presented in
Figure 8a. The dynamics of the maximum forces per cycle demonstrate much better regularity than in the case of the higher loading of the Scott machine, suggesting better execution accuracy. The % 1RM load of 39% becomes reasonable for training with bicep curls and emphasizes the proposal to include sub-periods dedicated to MNR strategy.
The graph in
Figure 8b presents the comparison via superposition of the force dynamics for an initial (R2) and final (R39) repetition.
It can be observed that the time taken to reach the maximum force in the case of the first repetition was about 0.71 s. Compared to the value of 0.8 s in
Section 3.1, it resulted in a reduction of 11% in the duration of the concentric phase. Additionally, the dynamics of the force during this phase changed significantly.
The time taken to reach the maximum force for R39 was 0.61 s. Compared to the value of 0.71 s for R2, there was a 14% decrease in the duration of the concentric phase, a smaller decrease than in
Section 3.1. in which the duration decreased from 0.8 s to 0.41 s.
This result was also interesting because it highlights the role of compensatory acceleration for the two different Scott machine loads; additionally, there were dynamics and mechanisms for adjusting the execution by subjects with significantly different nonlinearities. Compensatory acceleration training is a strategy for executing concentric motion as quickly as possible for the capitalization of the leverage zones.
The dynamics of the force during the concentric phase of the repetition was also dramatically changed, highlighting a change in the mechanisms specific to the use of the bicep muscles.
Elements of nonlinearity were anticipated in the sense that the 50% reduced load was not transposed with proportional evolutions at the level of the maximum value of the forces on the relevant repetitions.
For the initial repetition, the regression that best fits the average values of the forces is presented in Equation (3). R square is 0.505.
Based on Equation (3), for an initial repetition, the impulse developed in 0.71 s was 0.014 kN·s.
The polynomial regression that best fits the measured average values for the final repetition is presented in Equation (4). R square for this regression is 0.526.
Based on Equation (4), for the final repetition, the impulse developed in 0.61 s was 0.018 kN·s. It is an anomaly in this case, demonstrating that for reduced intensities within small muscle groups, the subjects forced an additional repetition with the help of other muscle groups. This surprising result refers strictly to the exercise of one-arm Scott machine seated bicep curls at very low intensities.
Table 5 presents the results obtained from the paired
t-test application. It can be observed that, for the first relevant repetition, the mean of the maximum force values was 0.077 ± 0.005 kN, a 15% lower value than the mean of the final repetition of the exercise set, which was 0.091 ± 0.007 kN.
From the results, we can say that there was a significant average difference between R2_Fmax and R39_Fmax (t29 = 12.71, p ≤ 0.001), and R2_Fmax was 0.014 points lower than R39_Fmax. This result validates the second hypothesis; there is statistically significant difference between the maximum forces developed during the initial and final repetitions of the exercise set. In this case, a large effect size was also observed, and Cohen’s d was −2.3.
3.3. Comparison between the Forces Developed at 10 kg and 5 kg Loads
A comparison of the physiognomy of the concentric phases of the initial and final repetitions was made for the two situations—loads of 10 kg and 5 kg, respectively.
In the case of the first relevant repetitions, as seen in
Figure 9a, it can be observed that the forces were higher for the higher load. The slopes of the instantaneous forces in relation to the ascending time were related, demonstrating similar styles of repetition, with similar speeds and accelerations. Another observation is that the time taken to reach Fmax and the ascending duration on the concentric phase were lower in the case of the last relevant repetition with the load of 5 kg.
In the situation of the final repetitions, there were differences in dynamics, with very interesting practical implications. The evolution of the forces for the concentric phase for the two machine loads can be observed in
Figure 9b. The first observation is that although in the initial phase of the repetitions the forces were similar, in the case of the higher load, an increase was observed; this demonstrates the attempt to complete the repetition in a shorter time, materialized, therefore, by the acceleration and the reduction in the duration of the ascent phase of the repetition. Additionally, the values of Fmax obtained for the considered loads were not proportional. The duration of the concentric phase of the last repetition, relevant for the low load, was approximately 25% higher than the case of the other considered load.
As seen in
Table 6 there was a statistically significant difference between the maximum forces developed during the initial repetition of the exercise set at considered loads, respectively (t
29 = 34.23 and
p ≤ 0.001). For the final repetitions, t
29 = 23.009,
p ≤ 0.001.
The average difference between the mean of the maximum forces developed during the initial repetition in the case of each machine load was M = 0.05 ± 0.008 kN. For the final repetition, M = 0.047 ± 0.011 kN.
Figure 10 presents the relationship between %1RM and MNR for Scott machine seated bicep curls. This diagram is in line with the literature that studies the correlation between %1RM and loads in the area of 4–7 RM or 8–10 RM for other exercises performed for large muscle groups. Higher values of %1RM are highlighted; these have been explained previously and have opened the doors to new research related to possible links with high-intensity training or new periodization strategies for training macrocycles.
4. Discussion
To understand the dynamics of the force during the single set analyzed for the two Scott machine loads, a 1RM calibration was performed first, and in the second phase, the main parameters of interest were: volume/repetition range, load and manner of execution. There are very complex intercorrelations between these parameters, which depend on the training strategy and the selection of exercises.
The tests were performed for two loads on the Scott machine which, through the execution mode, offer more interesting dynamics of force evolution in the concentric phase. It turns out that when the load was reduced to 50%, a significantly higher number of repetitions was obtained but there was a slightly longer duration of the set
The evolution of the maximum forces per cycle in the case of a 10 kg load had good regularity of frequency and amplitude and, after that, the maximum force had a decrease, followed by a return near the end of the set in which the subjects tried to add an additional repetition by forcing the speed of execution. For a 50% reduced load, the dynamics of the maximum forces per cycle demonstrated much better regularity, suggesting better execution accuracy.
In the case of a 10 kg machine load, some differences can be observed between the first and last relevant repetition. It can be noticed that the time taken to reach the maximum value of the force was longer at the beginning. Additionally, the ascending slope was less inclined in R2, which proves that, towards the end, a fatigue threshold was reached, which caused an increase in the execution speed in the concentric phase of the repetition cycle.
For a 50% reduced machine load, there was a 14% decrease in the time taken to reach the maximum force, highlighting the role of compensatory acceleration for the two different Scott machine loads.
In the case of 5 kg machine load, the frequency of the repetitions was increased, which highlights that, due to the aim of obtaining as high an MNR value as possible, there was a tendency to increase the speed of execution.
It was observed that, in the case of a reduced load, the impulse developed at the final repetition was about 29% higher than in the case of the initial repetition, demonstrating that for reduced intensities within small muscle groups the subjects forced an additional repetition with the help of other muscle groups.
Additionally, the data collection method offered a simple way to understand the correlations between the MNR and intensity %1RM in the MNR single-set strategy in the case of Scott machine bicep curls. Particularly interesting features were observed in these unique sets using the MNR strategy. A correlation between the intensity of %1RM and the MNR for the two machines was also drawn for the two machine loads, which highlighted an approximation in terms of the intensity and duration of execution, even if the MNR differed significantly.
Therefore, we confirmed that the hypotheses were validated by the analyzed results.
The analysis led to the identification of innovative strategies capable of manipulating the intensity factors and boosting the efficiency of the exercises based only on small, intelligent changes to the set-up.
The first strategy would be drop-set MNR, respectively reducing the machine load after consuming 70–75% of the MNR with the maximum load and extending the MNR with the resulting lower machine load.
The second strategy refers to the exercise technique using only the Scott machine mixed with an additional load, which can be represented by some elastic resistance bands or even some pneumatic muscles. By attaching the elastic bands, an increase in tension was obtained in the desired portions of the trajectory of the movement. In the initial sub-phase of the concentric part of the repetitions, the forces were much smaller than the maximum force. On the one hand, this allowed for a higher number of repetitions, but also resulted in a longer duration of the set using the MNR strategy. On the other hand, in this case, a significant change in the physiognomy of the last relevant repetition in the sets would be expected.
A periodization strategy can be considered, referring to the addition of a distinct 1–2-week MNR strategy phase for a training macrocycle. For example, in the case of recovery after a long period, in the initial phase (i.e., 2–3 weeks with 2 workouts per week) it is possible to use the MNR strategy with a single set to failure; in the next phase dedicated to increase strength, the subjects could follow a strategy of 5–6 sets of 3–5 repetitions, for 3–4 weeks, and then, a hypertrophy phase with 3–4 sets of 8–12 repetitions.
The research has some limitations. The first limitation is related to the need for calibration of the subjects for a maximum repetition 1RM one-arm SM-SBC. Secondly, the research was conducted on a homogeneous group. The aim was to understand the mechanisms specific to a single set extended to the point of muscle failure, for a homogeneous group—in this case, a male group. Third, the study was conducted only on university students. So, the obtained results cannot be generalized.
Future work will be focused on analyzing the effect of the MNR strategy on high-intensity training and managing these emerging strategies for efficient recovery. Research based on this methodology can also be applied to other small muscle groups. REID applications can also be considered for future work, for person re-identification, based on supervised exercise using camera views.
5. Conclusions
The presented research was focused on the study of one-arm Scott machine bicep curls using the MNR strategy, considering a relatively large representative sample of subjects with similar abilities. The selection of a relevant exercise for testing a small muscle group using the MNR strategy was harmonized with the relatively large number of subjects with homogeneous capabilities and performances and the very large volume of data required. The interest was in analyzing the sets of one-arm bicep curls using the MNR strategy with a special focus on understanding the physiognomy of microcycles for the first and last relevant concentric phases of repetitions.
In summary, the detailed analyses of sets using the MNR strategy and of the microcycles for the first and last relevant concentric phases of repetition showed that there is a correlation between the machine loads, the maximum developed forces and the MNR. Additionally, there were significant differences observed between the maximum forces of the initial and final repetitions of the exercise sets for the different machine loads. The duration of the MNR increased while the machine load was reduced and a deterioration of the execution mode was observed when the maximum number of repetitions was reached.
All the research hypotheses were demonstrated for the two different machine loads. A series of mechanisms and correlations specific to the selected exercise were demonstrated; they were explained, during the analyses of the dynamics of force, as a function of time, both for the concentric phase of the repetitions and for the entire set using the MNR strategy.
We conclude that the study of the physiognomy of cycles and comparisons at the level of relevant repetitions have revealed new research directions: establishing new test architecture for relatively large and homogeneous groups of subjects; testing the performance of small muscle groups for MNR strategies; and explaining the differences between the physiognomy of the first and the last repetition within MNR sets. These will allow researchers to highlight new strategies specific to resistance training for small muscle groups.


 ,
, 


