Article

RISE Test Facilities for the Measurement of Ultra-Low Flow Rates and Volumes with a Focus on Medical Applications

RISE—Research Institutes of Sweden, Brinellgatan 4, 504 62 Borås, Sweden
*
Author to whom correspondence should be addressed.
Appl. Sci. 2022, 12(16), 8332; https://doi.org/10.3390/app12168332
Submission received: 29 June 2022 / Revised: 3 August 2022 / Accepted: 18 August 2022 / Published: 20 August 2022

Abstract

:
In the framework of the ongoing EMPIR JRP 18HLT08 Metrology for Drug Delivery (MeDDII), a main task is to improve dosing accuracy and enable traceable measurements of volume, flow and pressure of existing drug delivery devices and in-line sensors operating, in some cases, at ultra-low flow rates. This can be achieved by developing new calibration methods and by expanding existing metrological infrastructure. The MeDDII project includes, among other issues, investigations on fast changing flow rates, physical properties of liquid mixtures and occlusion phenomena to avoid inaccurate measurement results and thus improve patient safety. This paper describes the extension of an existing measurement facility at RISE and the design and construction of a new measurement facility to be able to carry out such investigations. The new measurement facility, which is based on the dynamic gravimetric method, is unique worldwide in respect of the lowest measurable flow rate. The gravimetric measuring principle is pushed to the limits of what is feasible. Here, the smallest changes in the ambient conditions have a large influence on the measurement accuracy. The new infrastructure can be used to develop and validate novel calibration procedures for existing drug delivery devices over a wide flow rate range. The extension of the measurement facilities also enables inline measurement of the pressure and the dynamic viscosity of Newtonian liquids. For this purpose, it is ensured that all measurements are traceable to primary standards.

1. Introduction

The most commonly used form of therapy in health care is infusion therapy [1]. Conservative estimates say that 80% of hospitalised patients receive infusion therapy. For most infusions, peripheral and central veins are used. Intravenous (IV) and intra-arterial accesses provide an effective method for delivering fluids, blood and medicines to a patient’s vital organs. Intravenous administration is an excellent route for continuous drug therapy. The most important factor in the administration of drugs is probably the amount or concentration. Underdosing may not provide adequate therapy and overdosing may cause serious side effects [2,3,4,5]. The infusion of many drugs, especially strong cardioactive drugs and radioactive drugs, requires a high degree of accuracy. In addition to the absolute amount of the drug administered, flow stability (often also called flow variability) is also a decisive factor. Low-risk patients can generally tolerate a small variability in infusion rates well. However, in some situations, especially in patients with limited fluid intake such as neonates, a prolonged (persistent) flow fluctuation may stress the cardiovascular and renal system. In many cases, the effect of a drug cannot be monitored directly, in which case it is often assumed that the desired therapeutic objective can be achieved with a certain concentration or infusion rate. In summary, it can be said that, especially for fast-acting drugs, besides the long-term accuracy (dosing quantity), flow stability (flow variability) is also of significant importance.
The Emergency Care Research Institute (ECRI) declares dosing errors, where pumps or administration devices fail, staff unknowingly bypass a safety mechanism or the infusion is incorrectly programmed, as the greatest health risk in 2017 [6]. These errors, especially those that result in incorrect drug delivery to the patient, can harm the patient and even lead to death. A well-defined metrological infrastructure is needed to perform traceable measurements with infusion devices and to ensure that manufacturers of such devices can obtain robust information about the performance of their devices. The gravimetric method is one of the most common methods for the traceability of quantities and flow rates. It has the great advantage that it is a direct method, i.e., a measurement method in which the value of the measurand is determined directly without any calculation and traceability is straightforward. In contrast, it is much more complex to perform traceability of the alternative optical methods such as front tracking and micro-Particle Image Velocimetry (microPIV, µPIV) used at nanoflow. Compared to the gravimetric method, these methods can be used for even lower flow rates, but in turn can have much larger measurement uncertainties. Another outstanding advantage is that changes in flow rate can be seen immediately in real time based on the weight values and no post-processing of image data is necessary, as is the case with the two optical methods. This allows a full characterisation of the behaviour of drug delivery devices (infusion devices) and in-line sensors. Some National Metrology Institutes (NMI) have established infrastructures for testing the most commonly used infusion devices in hospitals, such as syringe pumps and Infusion Device Analyser (IDA), i.e., for flow rates down to about 1 mL h 1 (16,667 nL min 1 ). Of these NMIs, at most, five are capable of measuring flow rates down to about 100 nL min 1 . However, this flow range is not sufficient to investigate, for example, pain pumps (intrathecal pumps) and insulin pumps as these drug delivery devices administer very small volumes at ultra-low flow rates. For therapeutic purposes, pain pumps have programmable flow ranges down to 2 μ L h 1 ( 33.333 nL min 1 ) and, for non-therapeutic purposes, the pumps can usually deliver even smaller flow rates down to 0.25 μ L h 1 ( 4.167 nL min 1 ), which is about the same as the lowest flow rate for insulin pumps. To the best of our knowledge, there is no traceable test facility based on the dynamic gravimetric method available worldwide for flows down to about 5 nL min 1 as the measurement uncertainty at nanoflow increases substantially with decreasing flow rate. At these low flows, environmental uncertainties (variations in ambient temperature, air pressure and humidity), smallest impurities in the test liquid, air bubbles, uncertainties of the microbalance (linearity and drift) as reference and other measuring instruments, capillary effects, buoyancy effects, suction effects, stick/slip of the test liquid, jet forces on the microbalance and immersed tube, water absorption, but also possibly other effects, become very important. Evaporation becomes the most critical error component. Measurements with flow rates down to 5 nL min 1 , with a measurement uncertainty of U ( k = 2 ) 5.0%, probably represent the range of feasibility using the dynamic gravimetric calibration method.

2. Materials and Methods

2.1. Measurement Facility for Flow Rates from 0.25 μL h−1 to 1 mL h−1

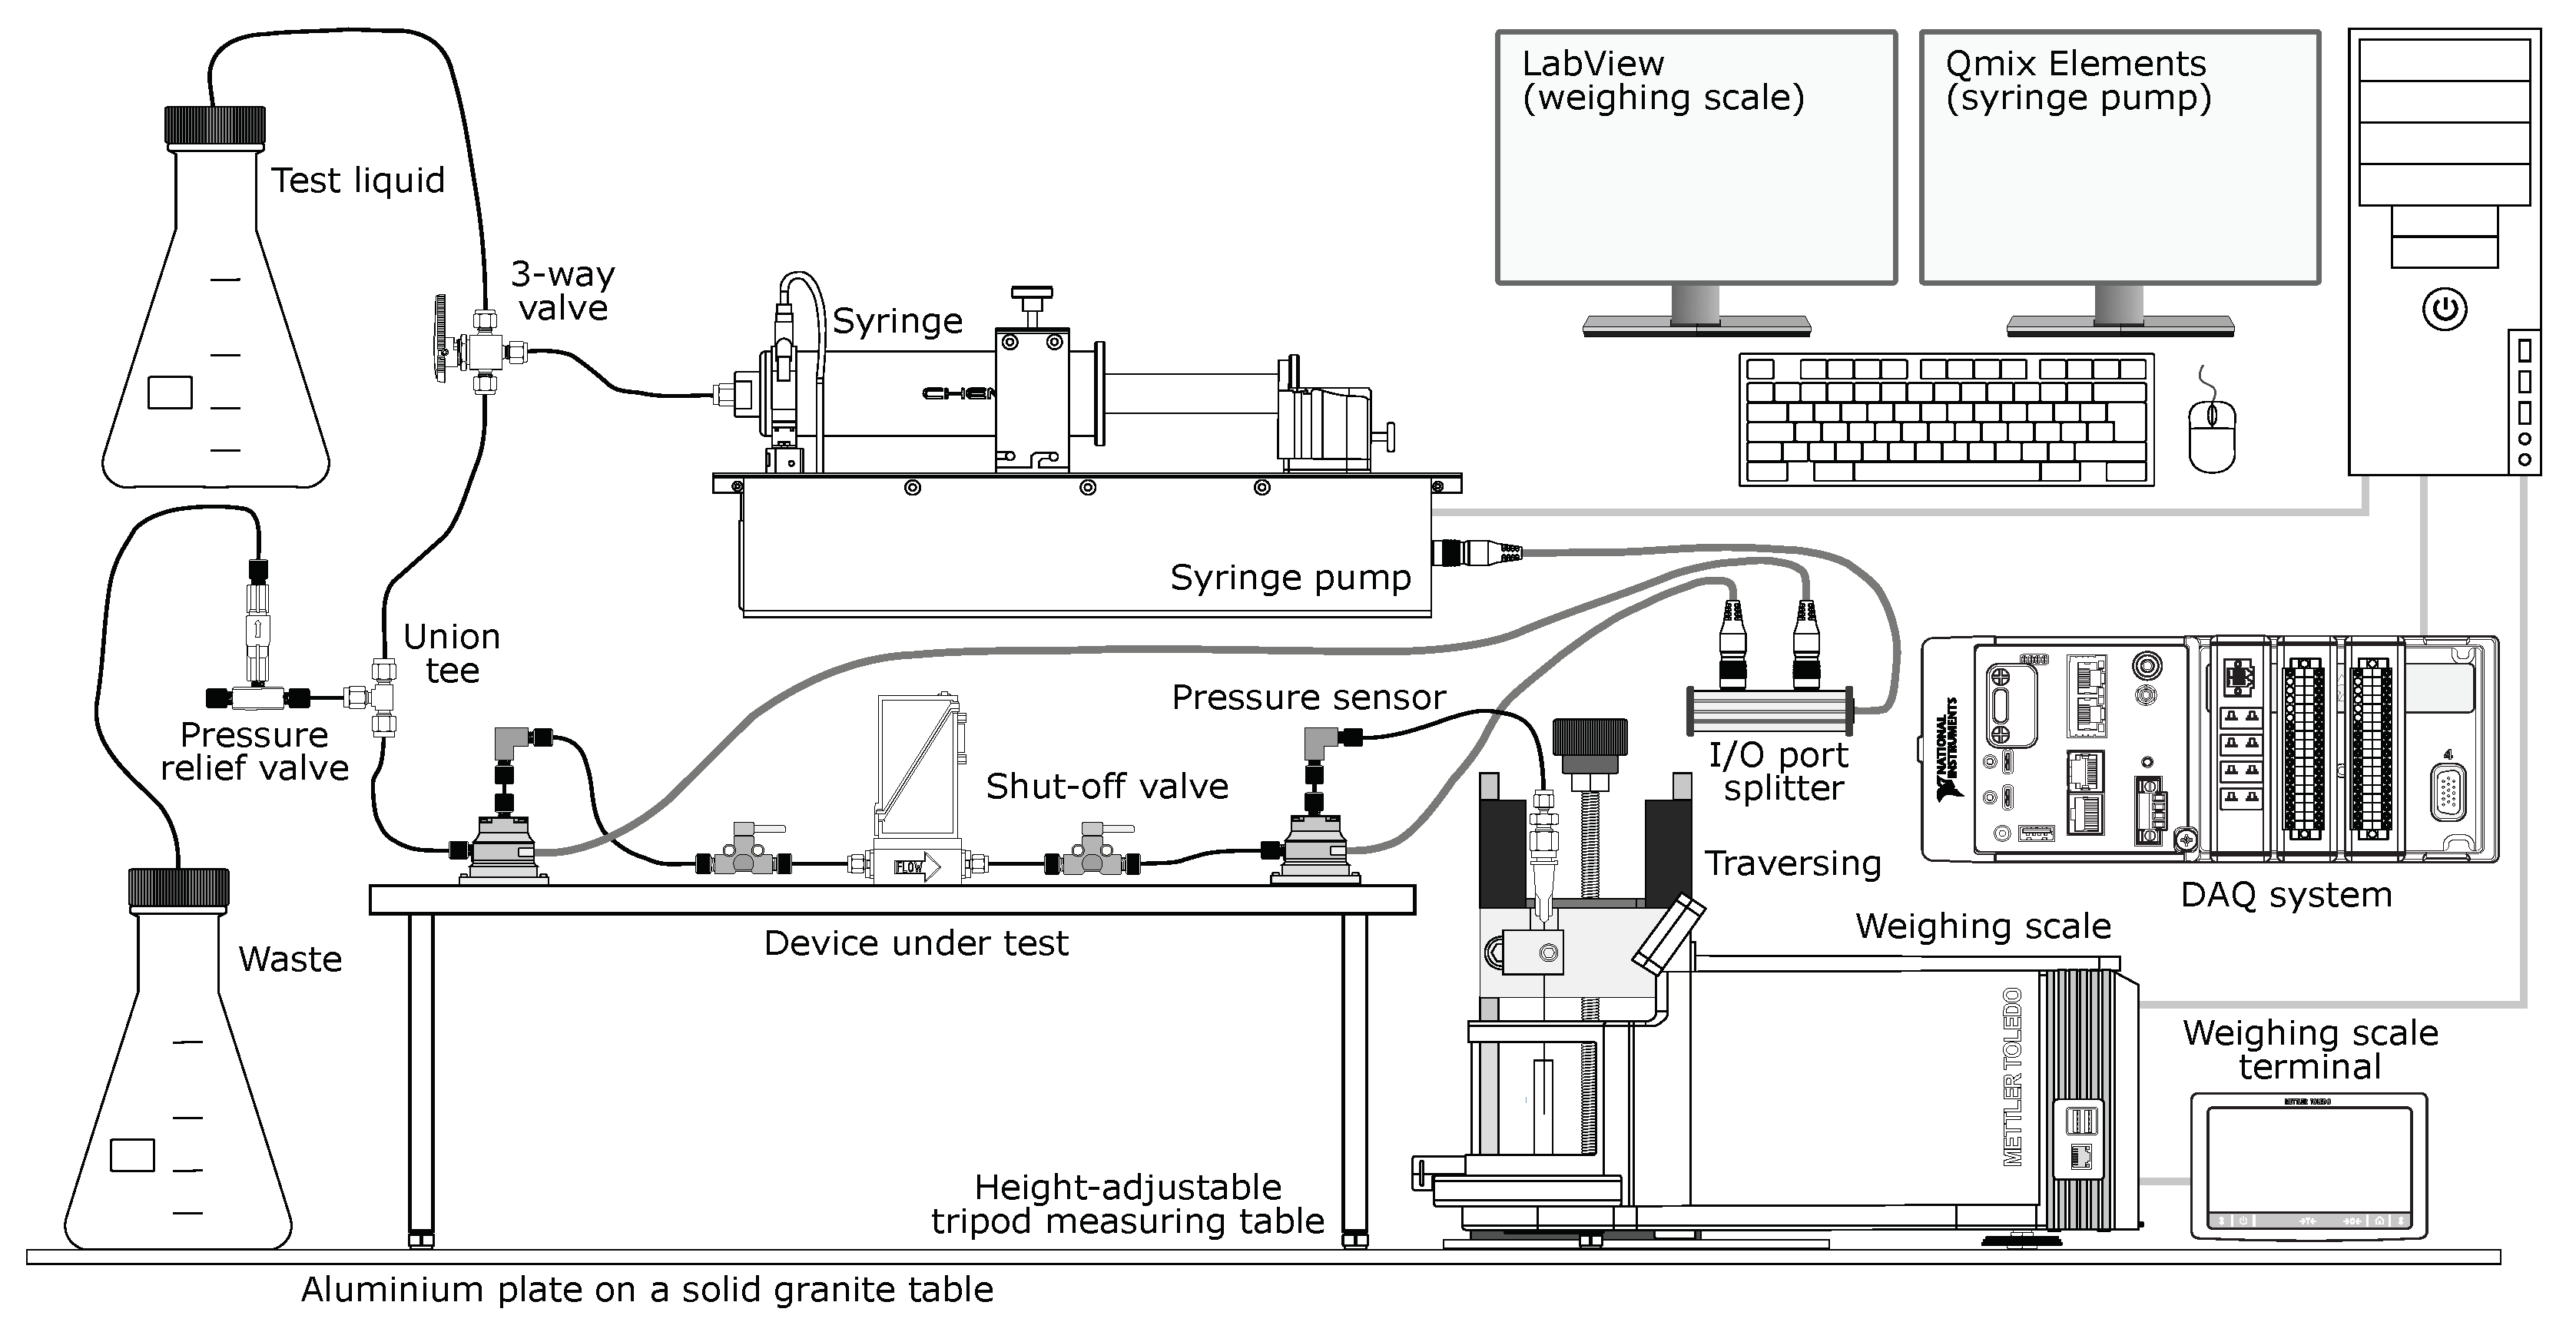
2.1.1. Nanoflow Test Facility

The test facility described in the following was built as part of the European Metrology Programme for Innovation and Research (EMPIR) Joint Research Project (JRP) 18HLT08 Metrology for Drug Delivery (MeDDII) [7]. Up to that point, RISE only had a test facility with a minimum flow rate of 1 mL h 1 (16,667 nL min 1 ). The new test facility was built with the aim of being able to perform traceable measurements down to a flow rate of at least 50 nL min 1 . This target was even exceeded.

2.1.2. Operating Principle

The measuring principle of the test facility is based on the dynamic weighing method, also known as the dynamic gravimetric method [8,9,10] (Figure 1 and Figure 2). For the measurement, a Mettler Toledo XPR10 (ultra microcomparator balance) with a capacity of 10.1 g and a readability of 1 μ g (6 decimal places) was used. The weighing scale was read with the aid of a Personal Computer (PC) and a Universal Serial Bus (USB) connection using Mettler Toledo Standard Interface Command Set (MT-SICS) interface commands. For measurements over a long measuring period (basal mode, long-term delivery), the weighing scale was read-out with 1 HZ and, for short measuring periods (bolus mode, quick-acting delivery, dynamic flow rates), with around 10 HZ. The data acquisition and control of the weighing scale was realised using LabVIEW.
The desired flow rate was generated by means of a high precision syringe pump (CETONI neMESYS Base 120 controller and neMESYS Low Pressure module 290N) and calibrated syringes of different sizes and volumes. The syringe was connected to a 3-way valve (Swagelok SS-41GXS2). By changing the position of the 3-way valve, it was possible to either fill the syringe with the liquid to be tested from a glass flask or to carry out a measurement. Normally, the dosing unit of the Cetoni syringe pump has a 2-way valve (aspirate, dispense), for this purpose, which can be switched by software. When the valve is electronically switched to the filling position, the valve becomes very warm and transfers the heat to the liquid with which the syringe is filled. It can then take several hours before the liquid has reached room temperature again. For this reason, the manual solution with the 3-way valve was chosen.
In the measurement, directly after the 3-way valve, a pressure relief valve (IDEX U-456 with a pressure setting of 100 psi (7 bar) and 1/16 OD tubing with 1/4 -28 UNF connections) was installed with the aid of a tee connector (Swagelok 1/8 union tee SS-200-3). The pressure relief valve was intentionally not installed directly in the measuring line to keep its possible influence on the flow through its cross-section reduction negligible. An additional pressure relief valve is not actually required, as the Cetoni syringe pump has its own emergency stop system if the pressure is too high. For safety reasons, however, a second safety mechanism was installed. From the tee, the measuring line continues to the actual measurement section. The measuring section was placed on a tripod measuring table and consisted of the Device Under Test (DUT) and, in this case, two pressure sensors. The two external pressure sensors (Cetoni) with flat ceramic membrane and a nominal pressure rating of 500 k Pa ( 5.0 bar) were used to measure the pressure upstream (before) and downstream (after) the DUT. The pressure sensors were directly connected to the Cetoni syringe pump by means of a Cetoni Input/Output (I/O) port splitter. After the downstream pressure sensor, the measuring line ends at an infusion needle that protrudes into the weighing vessel (beaker). When preparing the measurements, special attention was paid to the beaker. To minimise the evaporation effects, the beaker was first filled with around 10 m m of water (Chemical Abstract Service (CAS) number 7732-18-5) and then with around 5 m m of paraffin oil. The paraffin oil (CAS number 8012-95-1) has a lower density (0.827 g m L 1 to 0.890 g m L 1 at 20 C ) than the water and thus prevents evaporation on the surface. Our own investigations have shown that, for a visible effect for this setup, an oil film of at least 4 m m is necessary. The beaker has an inner diameter (ID) of 15.43   m m and a height of around 53 m m with a total weight of around 1.7 g. This results in a usable weight ( 0.8 g oil, 1.9 g water, 1.7 g beaker) of around 5.7 g.
A challenge is to insert the needle through the oil film so that the tip of the needle is at the end roughly in the middle of the water below the oil film. The needle tip must not be too close to the oil film but also not too close to the bottom of the beaker. Both scenarios would have a negative impact on the measurements. To realise the exact positioning of the needle in the beaker, a traverse system was built at RISE Central Workshop, which enables the exact lifting and lowering of the needle. The traversing system consists mainly of a Bosch Rexroth guide unit and a fine-thread rod with hand knob. One turn corresponds to an axial displacement of 1.0   m m . The weighing scale and the traversing system are accurately aligned with each other by means of guide rails. Depending on the flow rate, different needles with various inner and outer diameters are available for the measurements. During the measurements (filling process) the buoyancy of the needle must be considered. For testing volumetric infusion pumps and volumetric infusion controllers, the IEC/ISO 60601-2-24 [11] standard proposes the use of an 18G needle with a nominal outer diameter (OD) of 1.270   m m and a nominal inner diameter (ID) of 0.838   m m . As the focus is on lower flow rates, a 20G needle with a nominal OD of 0.908   m m and a nominal ID of 0.603   m m was used in most cases shown in the following. In this configuration, any change in the level in the weighing container (beaker) results in a necessary correction compared to water of 0.000636   m L m m 1 . The corresponding corrected weight value can then be calculated by means of the actual temperature-dependent water density. All tests shown here were carried out at an ambient and water temperature of 23.0 C ± 0.5 C .
For most measurements, it is important to keep the infusion lines as short as possible to minimise the so-called dead volume. For this reason, the tripod table was built in such a way that the measuring set-up, including the DUT can be placed on the table and the scales can be placed under the table to save space. For a typical measurement set-up, the hoses in the measuring section are 1/16 OD Polyether ether ketone (PEEK) tubing (with IDs from 0.13 m m to 0.75 m m depending on the DUT and the flow rates) and the hoses in the refill line are usually 1/8 OD Swagelok Perfluoroalkoxy (PFA) tubing (PFA-T2-030) with an ID of 1.65   m m .

2.1.3. Data Acquisition (DAQ)

The data acquisition was carried out with a compactRIO DAQ system (cRIO-9040 with three expansion cards NI 9210, NI 9207 and NI 9216) from National Instruments and with the pump software (Qmix Elements) supplied by Cetoni. The flow rate (dosed volume) was recorded using the Cetoni software. Since the two pressure sensors were connected directly to the pump with the help of the Cetoni I/O port splitter, the values of the two pressure sensors were also logged directly in the programme of the Cetoni pump. The measurement data was later exported as a single Comma Separated Values (CSV) file (including absolute time stamps, dosed volume and both pressure values) for further evaluation. The temperature of the test liquid was indirectly measured with the help of type K thermocouples (TC) with 2-pin mini-TC connectors attached at four different spots in the measuring setup: (1) at the outlet of the syringe; (2) at the upstream pressure sensor; (3) at the downstream pressure sensor and (4) at the needle. All thermocouples were connected directly to the DAQ system via the NI 9210 expansion card. The measuring conditions in the laboratory (air pressure, room temperature and air humidity) were measured separately by means of a Vaisala PTU300 and logged on the RISE internal server (EXOscada). The Vaisala device has an internal data logger that can be read out via different interfaces. In addition, there is the possibility to connect the Vaisala device directly to the DAQ system. The Vaisala device has current and voltage signal outputs for air temperature and air humidity. However, for the measurements shown in the following, the unit was not directly connected to the DAQ system.

2.2. Measurement Facility for Flow Rates from 1 mL h−1 to 100 mL h−1

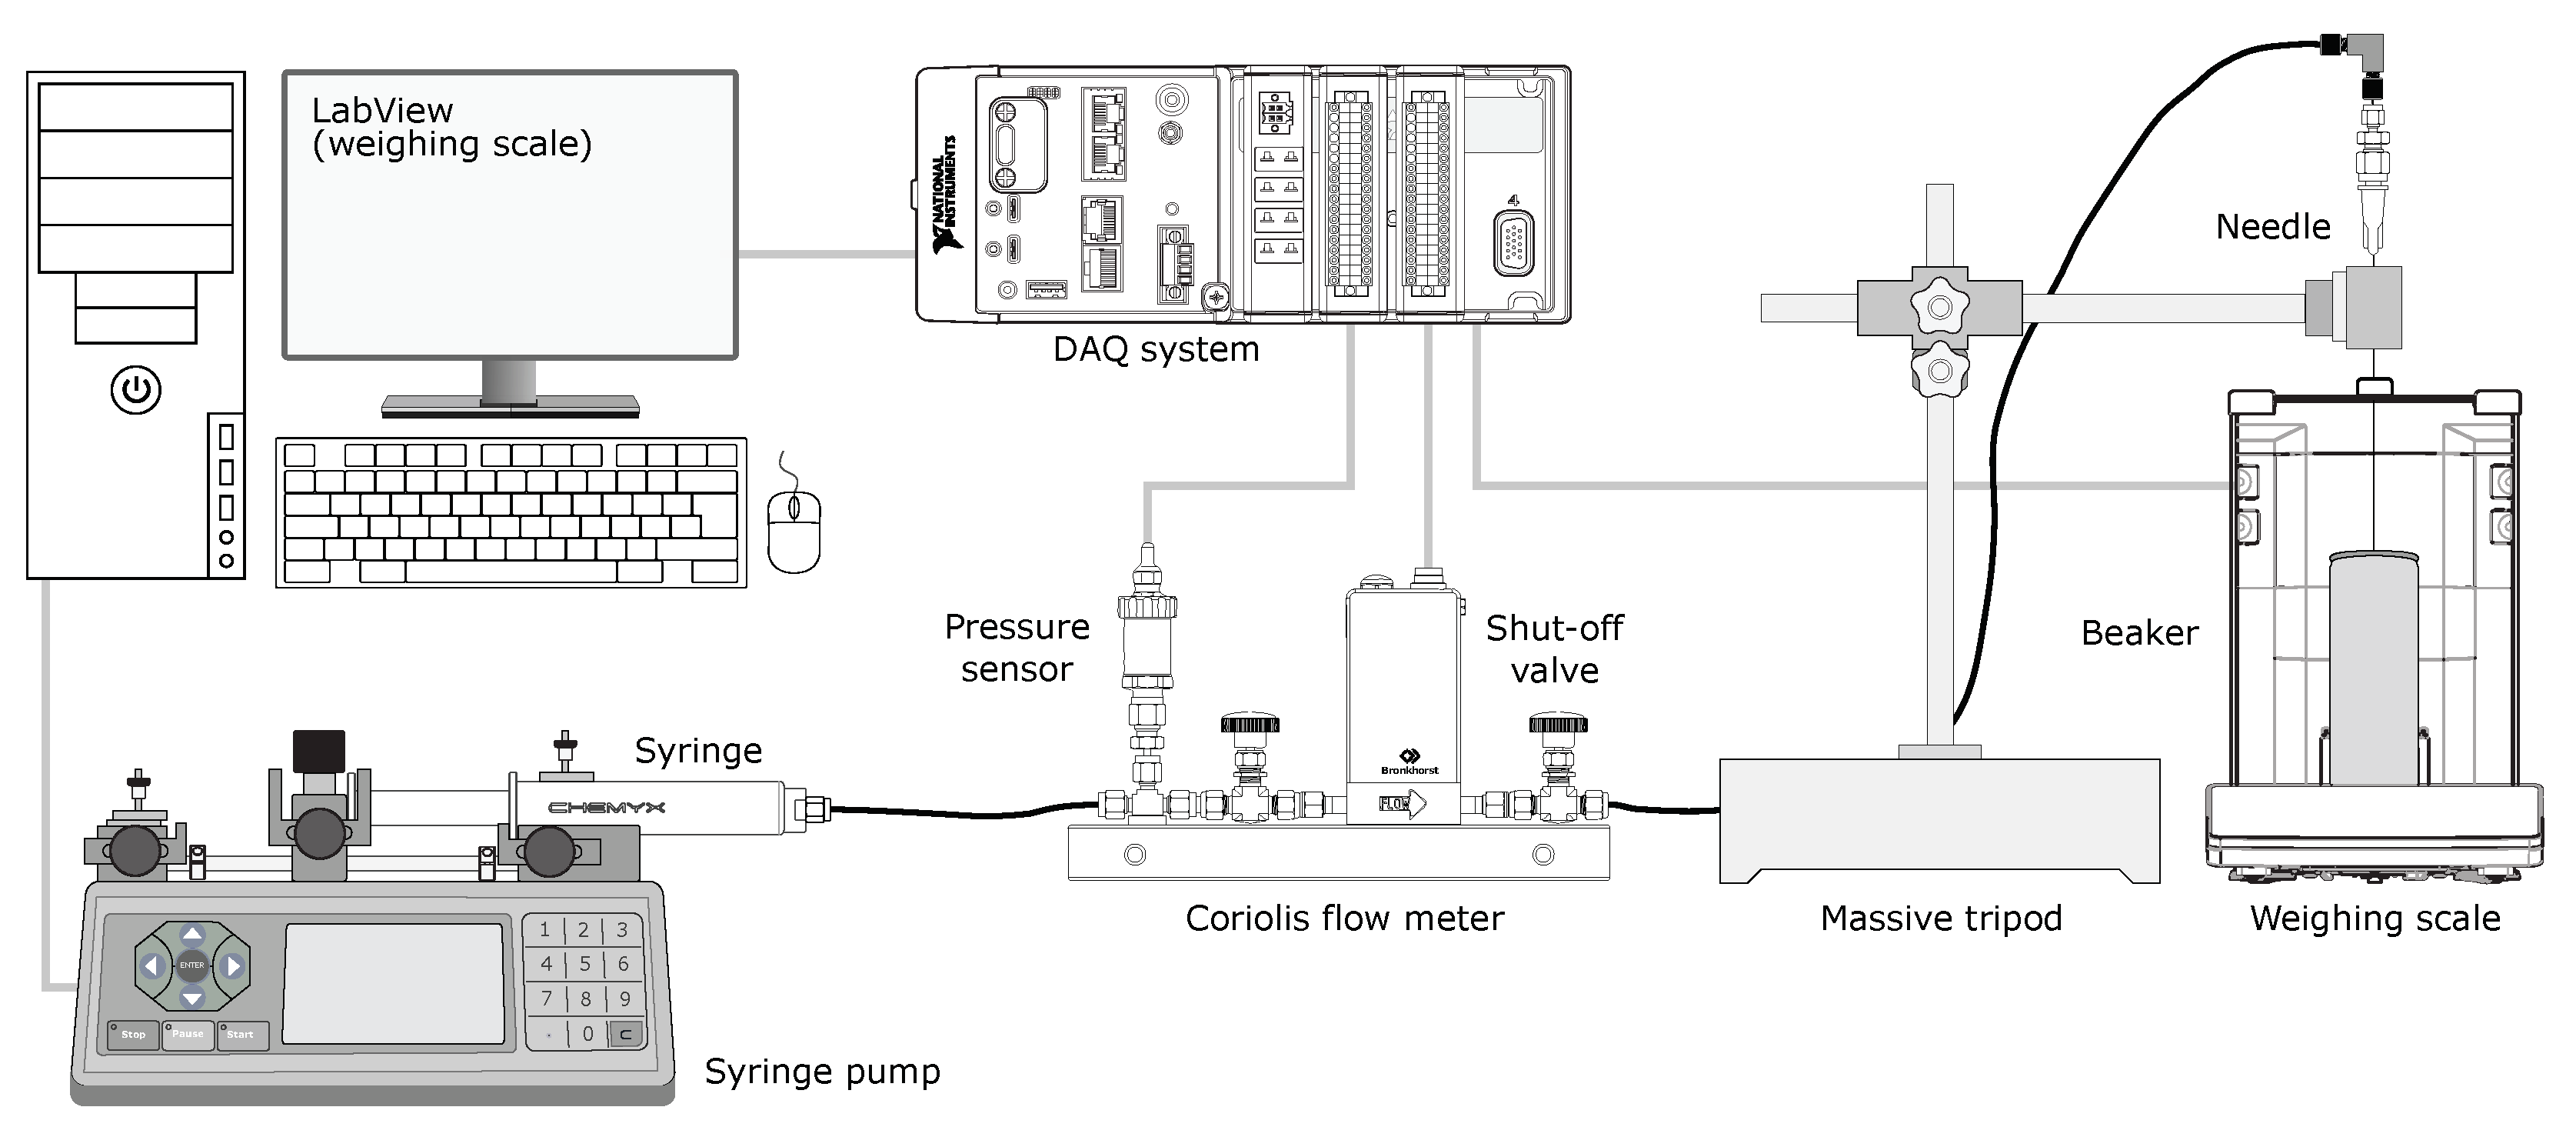
2.2.1. Microflow Test Facility

Already in 2015, a primary measurement facility in the flow rate range from 0.1 m L min 1 to 10 m L min 1 (6 mL h 1 to 600 mL h 1 ) for ultra-pure water at ambient temperature with an expanded measurement uncertainty of U ( k = 2 ) 0.5 % was built as part of a project (2014-05078) funded by Sweden’s Innovation Agency (Vinnova). Nowadays, the system is usually operated in the aforementioned flow rate range. The original project aimed to deepen the competence within the National Laboratory for volume, flow and density and to develop traceability in the field of microflow. At this time, the need for traceable measurements was seen primarily in areas such as healthcare, where, among other things, very high demands are placed on the controlled dosing/injection of certain types of drugs during intravenous administration, but also in biotechnology, chemistry, vacuum measurement technology and the automotive sector.

2.2.2. Operating Principle

The measurement set-up (Figure 3) was comparable to the previously presented test facility (Figure 1 and Figure 2). The difference is that, due to the higher flow rates, a weighing scale with a higher capacity was used. A Mettler Toledo XPR205 (ultra microcomparator balance) with a capacity of 220 g and a readability of 10 μ g (5 decimal places) was selected. As before, the balance was operated with the aid of a PC and a USB connection via MT-SICS interface commands. For measurements over a long measurement period, the scale was read out at 1 HZ, and for short measurement periods, at about 10 HZ. Data acquisition and control of the scale were also carried out via LabVIEW. The required flow rate was generated using the ultra-high precision Cetoni syringe pump or the ultra-high precision syringe pump Chemyx Nexus 3000, which is also available (Table 1). For the lower flow rates, the Cetoni pump was used, and for the higher flow rates, the Chemyx pump. One main reason is that the syringe holder of the Cetoni pump can only take syringes up to 50 m L and the Chemyx pump can firstly take much larger syringes and secondly also two syringes at the same time.
In the simplest configuration, the ultra-high precision syringe pump Chemyx Nexus 3000 delivered the set flow rate directly to the DUT or to a secondary standard (Figure 3). The secondary standard (reference flow meter) was a mini Coriolis Flow Meter (CFM) CORI-FLOW M12 from Bronkhorst with 1/8 OD Swagelok connections installed on a solid metal block with vibration dampers to ensure zero point stability. On the metal block, at the same distance upstream and downstream of the CFM, there are two needle (shut-off) valves (Swagelok SS-ORS2), which are used when determining the zero point of the CFM. Finally, there is a pressure transmitter (Swagelok PTI-S-NG100-12AQ) on the block connected via a t-connector (Swagelok SS-200-3) and a tube fitting reducer (Swagelok SS-400-R-2) to measure the inlet pressure. The CFM has a flow rate range from 0 g h 1 to 200 g h 1 and is calibrated against the weighing scale at regular intervals. Subsequently, the DUT (or the CFM reference setup) is connected to the needle, which is inserted into the weighing vessel (beaker), which is placed on the weighing scale. The beaker had an OD of 53.15   m m and a wall thickness of 0.11   m m , which results in an ID of 52.93   m m . The height of the beaker was around 135 m m , resulting in a usable volume of about 250 m L . The container weighed about 11 g, which means a usable weight of the weighing scale of about 170 g when pre-filled with water (22 g, 10 m m ) and oil layer (15 g, 8 m m ) to prevent evaporation. The measuring time at the highest flow rate (100 mL h 1 ) is limited by the capacity of the scale. The maximum measuring time at this flow rate is approximately 1 1 2 h . If longer measuring times are necessary, it is possible to measure without the scale against the reference CFM. However, if higher flow rates are required, it would be possible to calibrate two larger syringes (e.g., 200 m L or 300 m L ) individually and then use them together for such a purpose.
For a typical measurement set-up, all hoses in the measuring section are usually 1/8 OD Swagelok PFA tubing (PFA-T2-030) with an ID of 1.65   m m .
For some investigations, the flow generator can be used directly as a reference. Examples are the piston prover method [12] and the interferometer method [13]. These methods can be used where a specific flow rate is to be generated and a weighing scale is not required. Examples include the testing of Infusion Device Analysers (IDA). These tests can also be carried out using a commercial ultra-high precision syringe pump with a calibrated syringe as a secondary standard. In the simplest case, this setup has been previously calibrated against the weighing scale. The Cetoni pump with integrated encoder and calibrated syringes is then basically also a type of piston prover. One disadvantage is that it is often difficult (syringe pumps), or mostly not possible (pain and insulin pumps), to study other flow generators (pumps) with these methods. Here, the dynamic gravimetric method must be used.

2.2.3. Data Acquisition (DAQ)

When the Cetoni pump is used, nothing changes compared to the configuration for very low flows and the Nanoflow test facility. Here, the weighing scale of the same type is read out via USB and LabVIEW. In the reference flow meter configuration (Figure 3), the Bronkhorst flow meter is directly connected via RS232 to the PC. The flow meter is readout and controlled using the Bronkhorst FlowDDE server application together with the client application FlowPlot and/or FlowView, which are also based on LabVIEW. The measurement data of the flow meter can later be exported as an Excel file. The Chemyx syringe pump can be operated either directly via keypad or the data input screen, via Bluetooth or via RS232 and a PC. In this case, a separate LabVIEW programme was written that contains the most important commands of the pump. The temperature of the test liquid is indirectly measured at different locations with the help of type K thermocouples, which are directly connected to the compactRIO DAQ system. In the reference flow meter configuration, the advantage is that the temperature of the medium can also be measured (indirectly) with the Bronkhorst flow meter by means of the temperature sensor mounted on the measuring tube of the CFM. The measuring conditions in the laboratory are logged on the RISE internal server, as in the case of the Nanoflow test facility. Both facilities are located next to each other in the same room.

2.2.4. Design Considerations

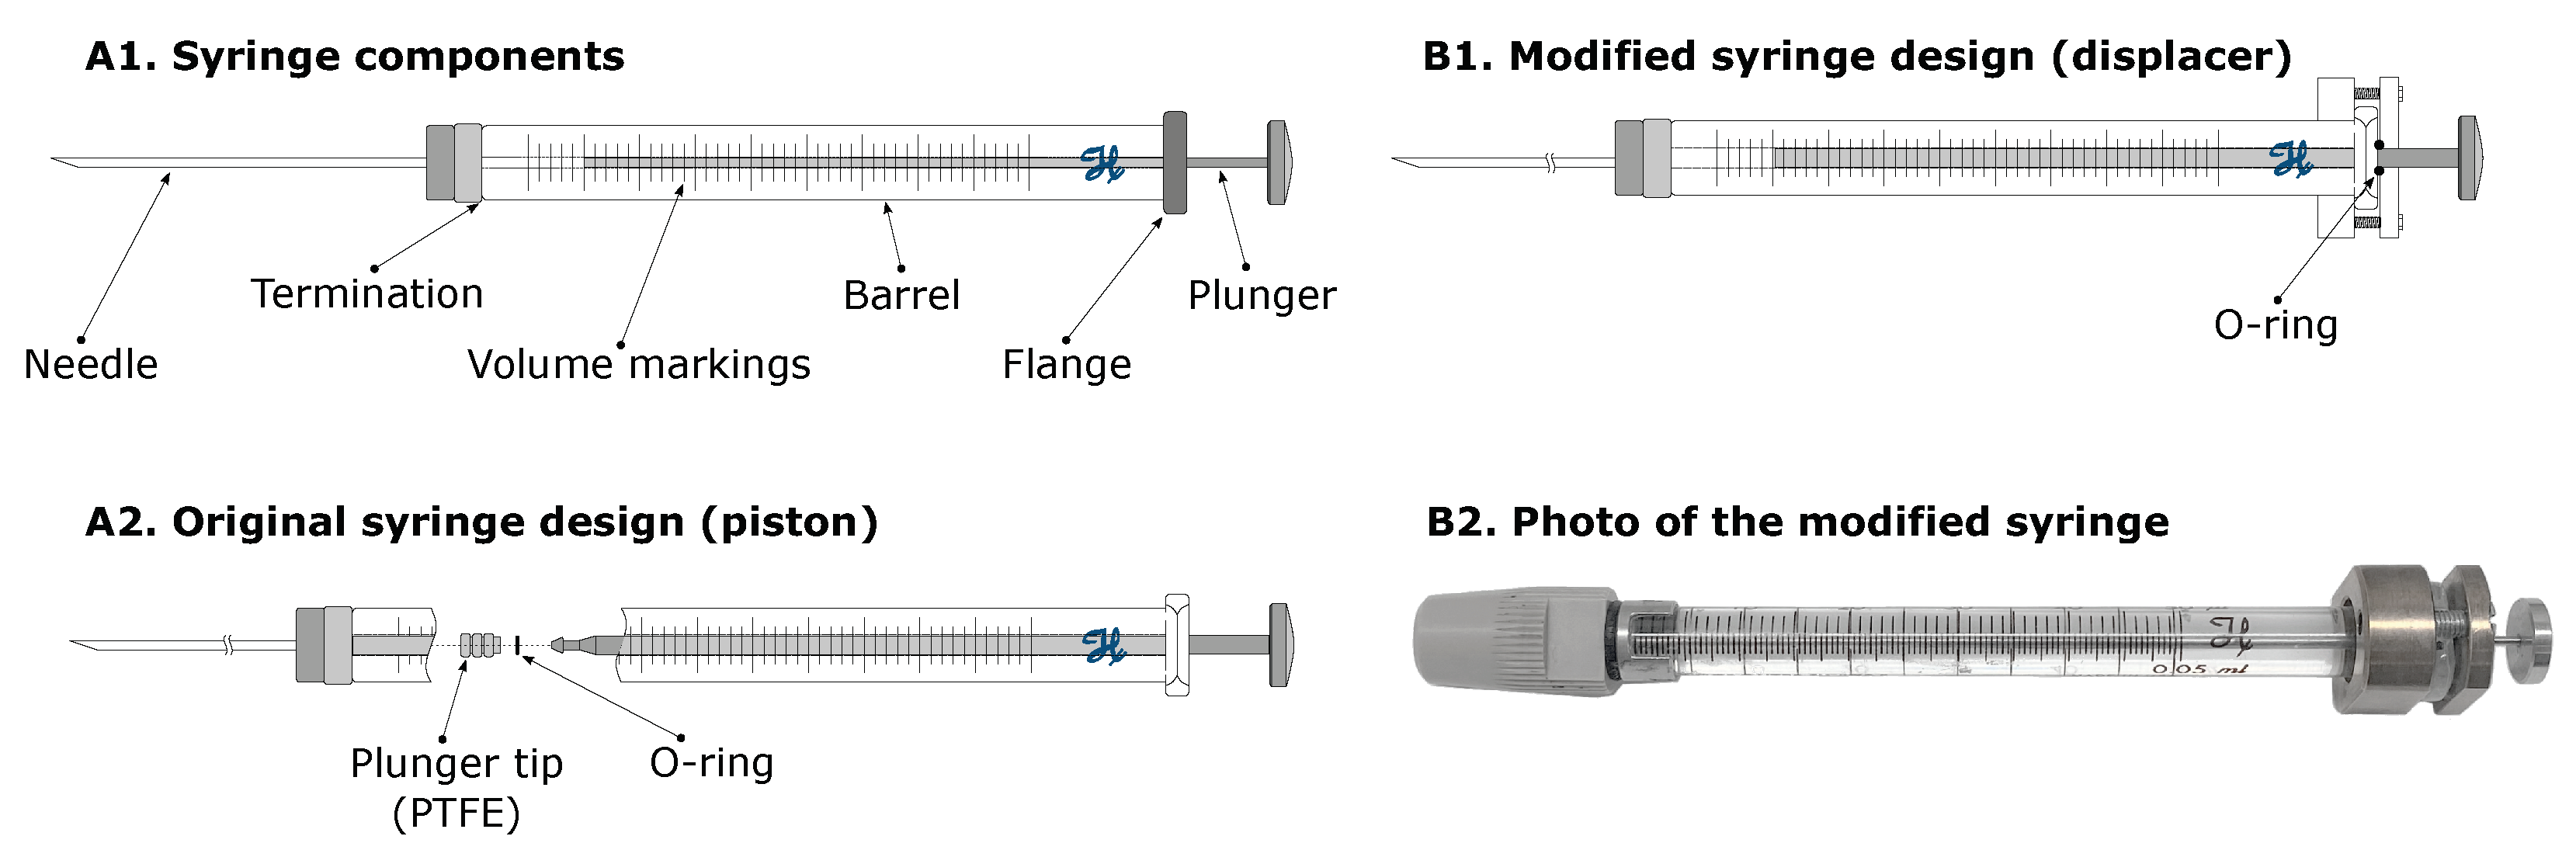
Flow Generation (Syringes)

A syringe consists of a hollow, cylindrical barrel in which a movable piston, the syringe plunger, can slide back (aspiration) and forth (injection).
The flow rate of the syringe is determined by the internal diameter (ID) of the syringe respectively by the piston area or plunger tip. The pressure also depends on the piston area of the syringe beside the outlet opening. A smaller piston area and/or a smaller outlet opening cause a higher pressure than a larger one for the same amount of force. The ID of a syringe is not constant and therefore flow and pressure variations occur. To minimise these flow and pressure fluctuations, a set of syringes was modified at RISE Central Workshop (Figure 4) so that the plunger can move freely without contact with the inner wall of the syringe. In this configuration, the plunger tip does not seal against the inner wall, but the sealing is made at the syringe inlet with the aid of an O-ring. In this case, the outer diameter (OD) of the plunger determines the flow rate. The OD of the plunger was measured at RISE National Laboratory for Length and Dimensional Metrology with micrometre resolution. The pressure fluctuations due to friction at the sealing surface improved only minimally, for an exact volume determination the spatially resolved determination of the OD of the plunger is easier than the spatially resolved measurement of the ID of the syringe.

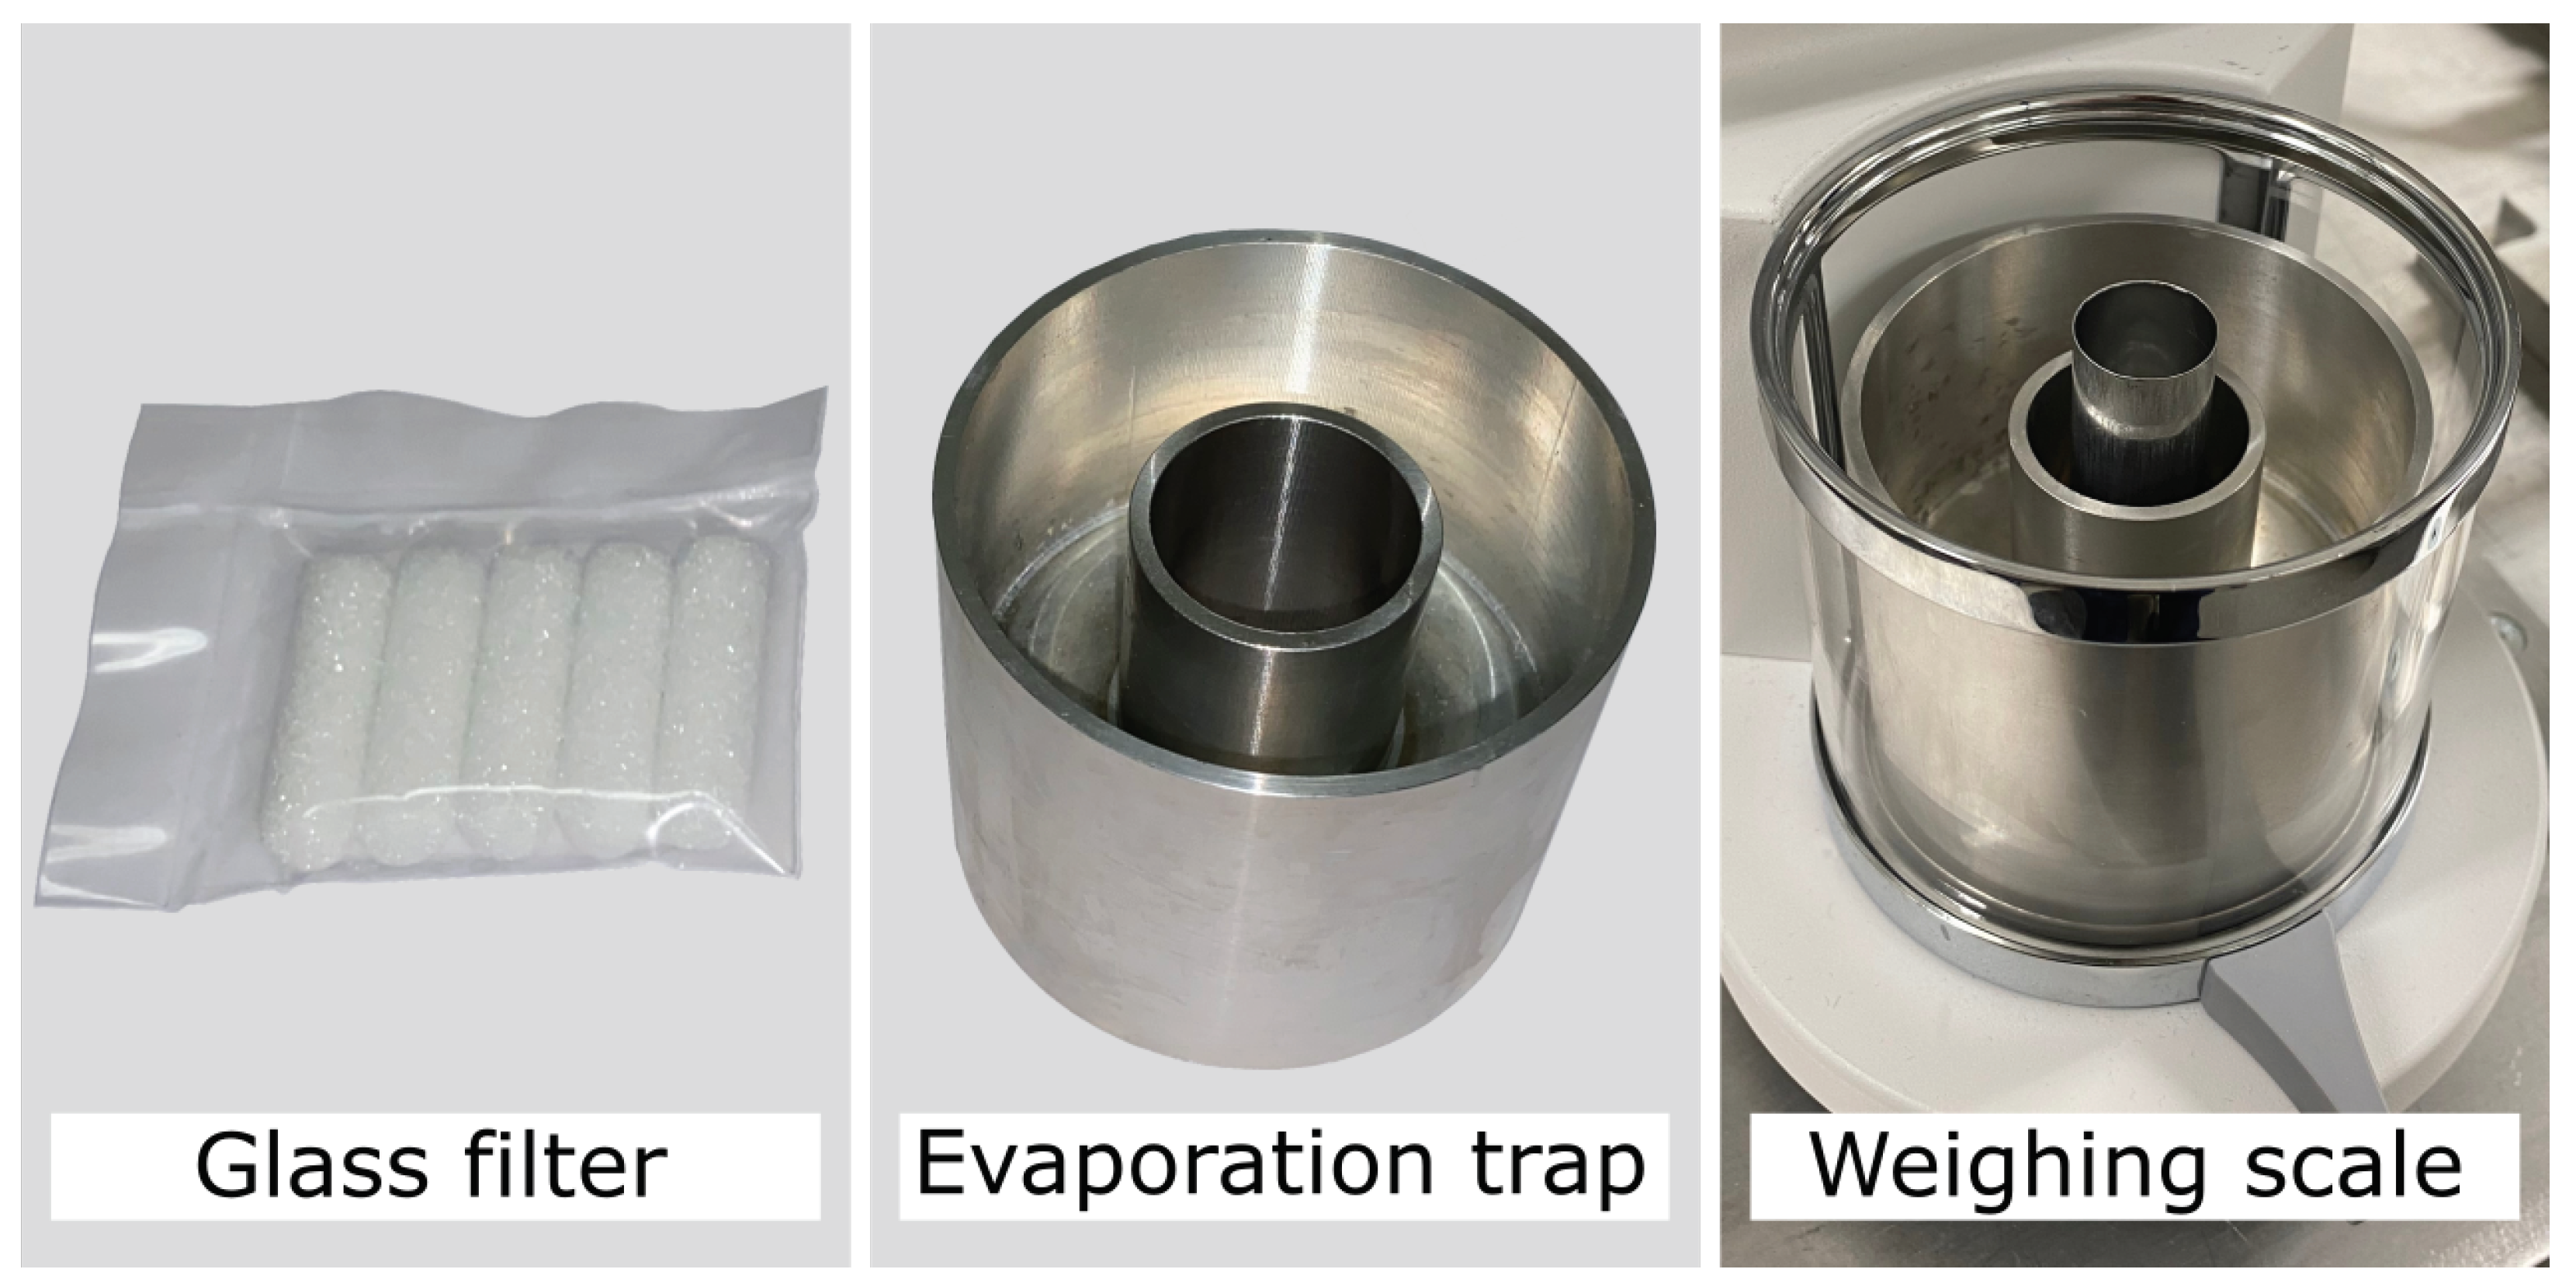
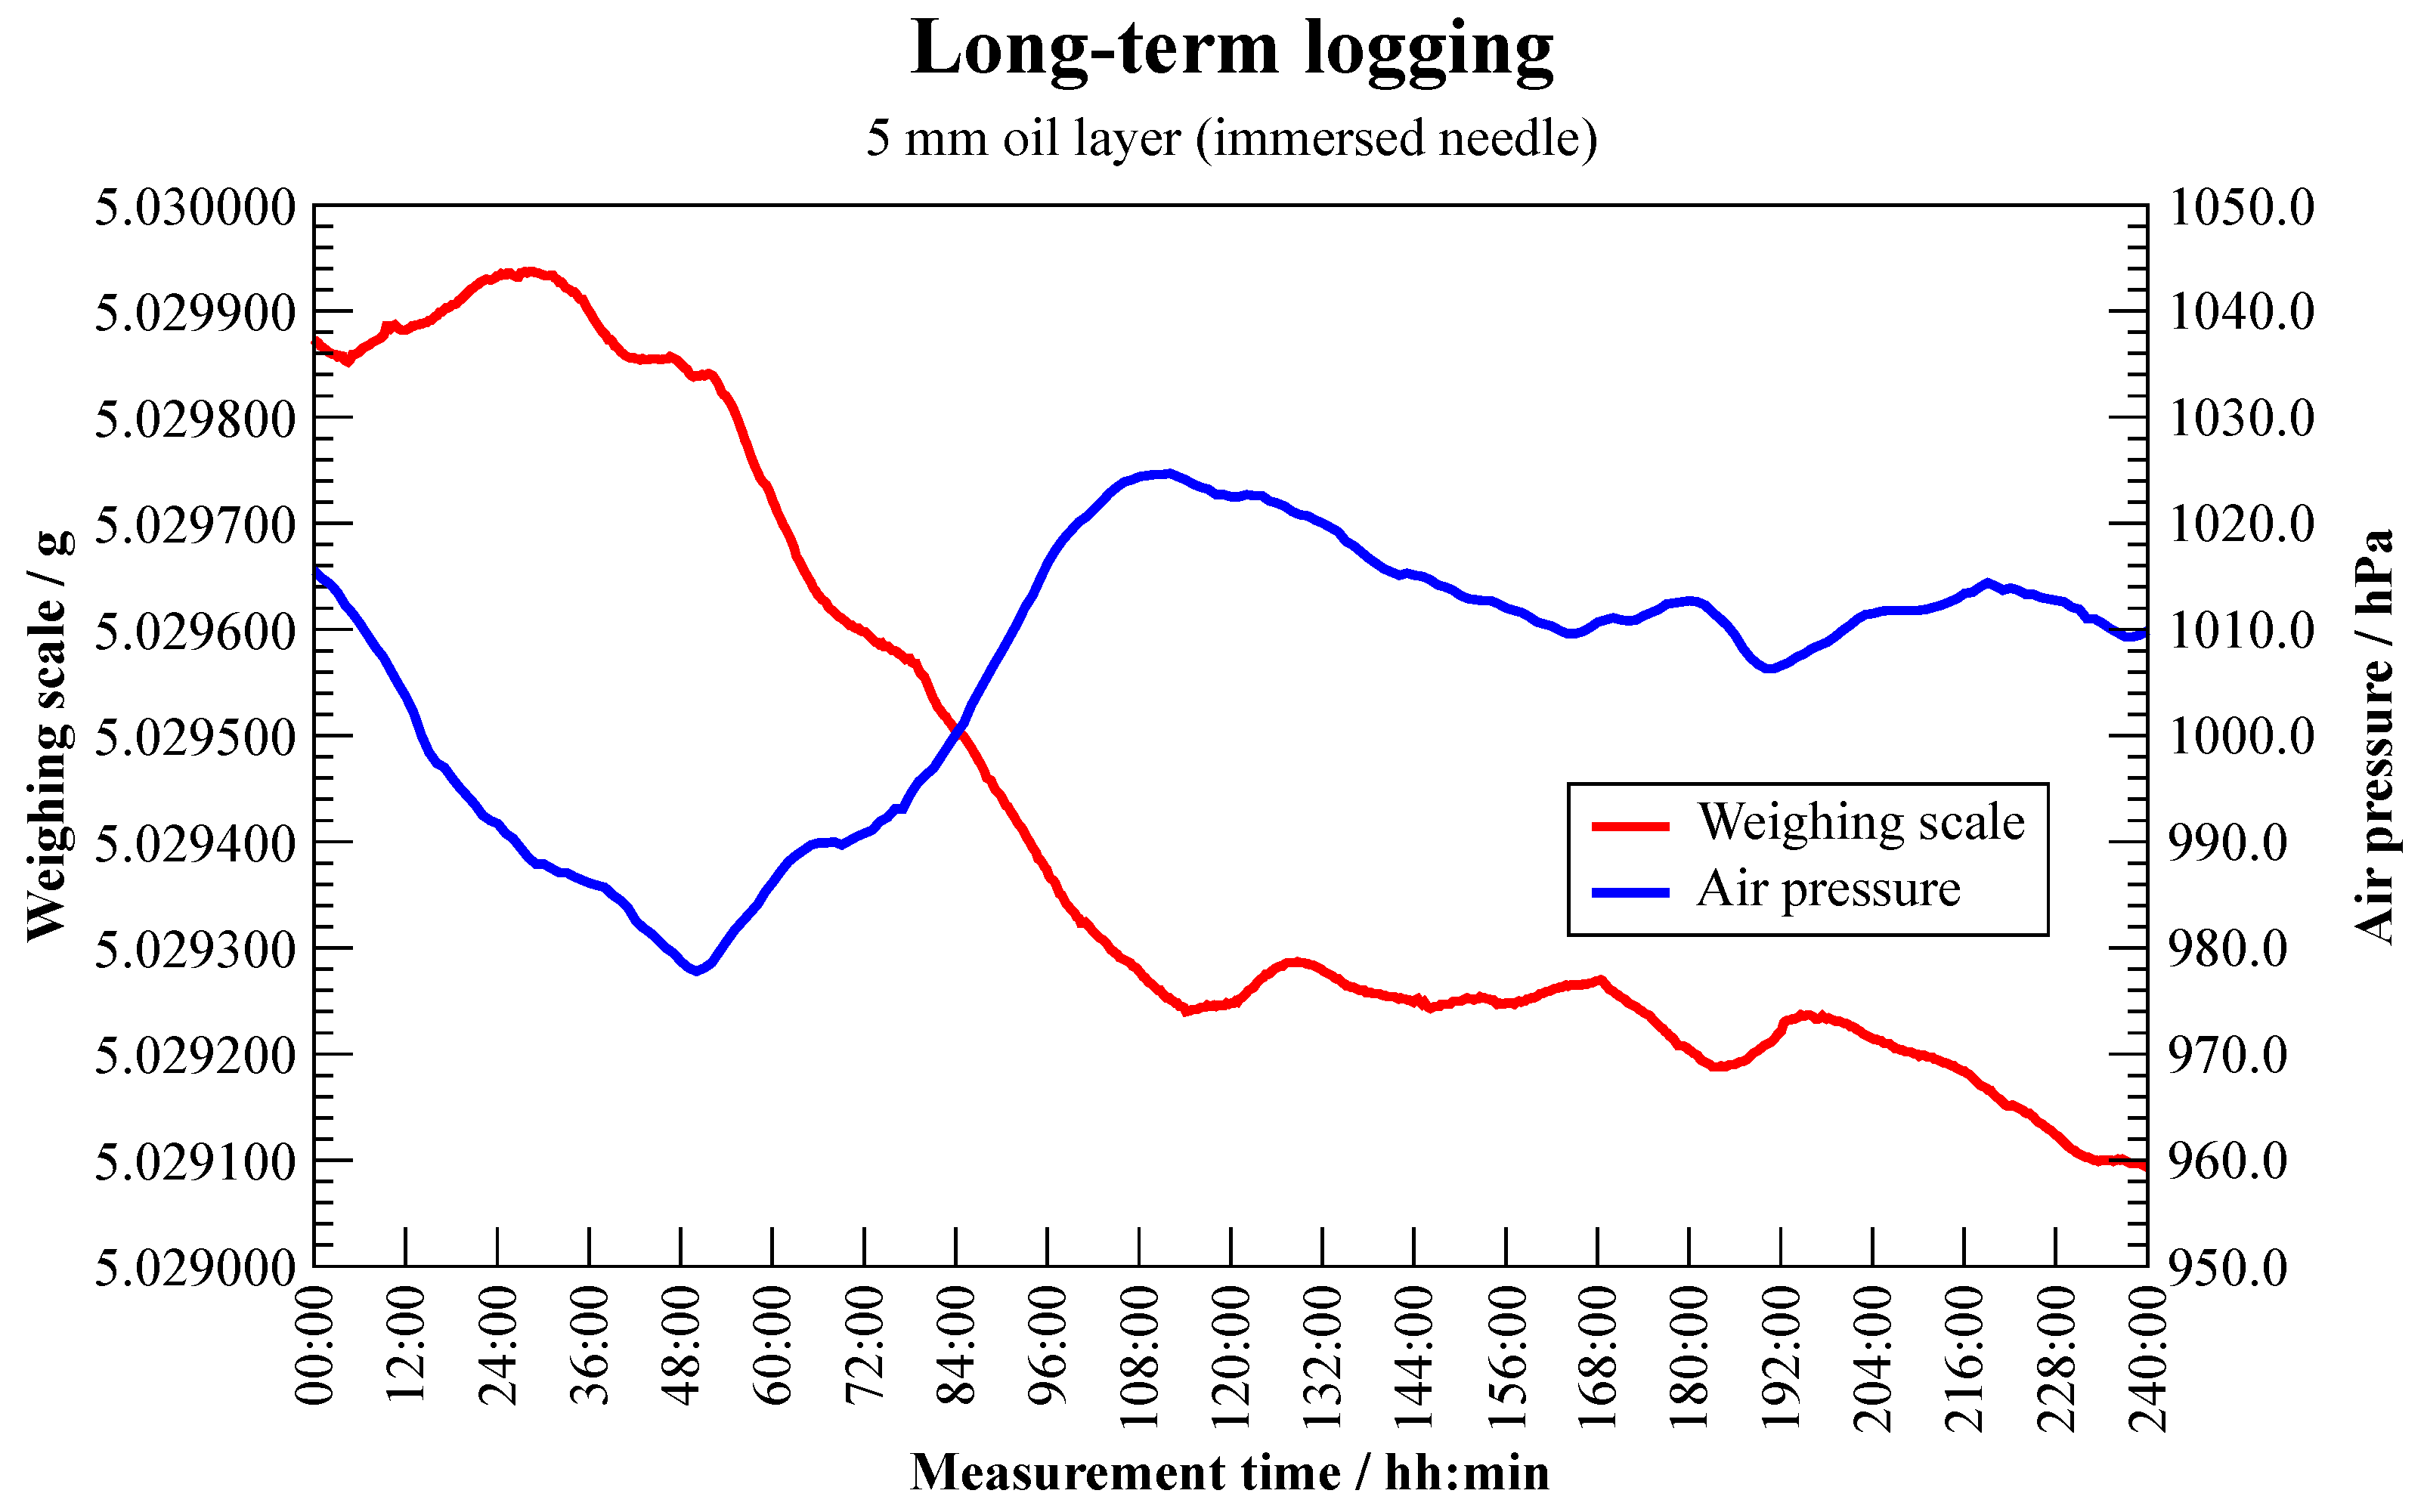
Water Collection (Evaporation)

Measurement uncertainty studies on syringe pumps and insulin pumps have shown that evaporation is one of the biggest factors influencing measurement uncertainty [14,15]. The influence of evaporation increases at the lower flow rates. For this reason, special attention was paid to this influencing factor when designing the test facilities.
To keep the influence of evaporation as small as possible, various methods have been investigated before the actual measurements. The AAMI technical information report (TIR) TIR101:2021 [16] gives recommendations to minimise evaporation. A sufficiently thick layer should be used over the test solution, which has a lower density than the test liquid, is immiscible and is non-evaporative, such as liquid paraffin or mineral oil. Alternatively, an evaporation trap can be used. An initial step was to fabricate an aluminium evaporation trap at RISE Central Workshop (Figure 5).
The first method examined was the METAS method described by Bissig et al. [17]. Here, a purpose-made glass filter was inserted into the beaker and the outlet needle was positioned about 20 μm to 50 μm above the glass filter. The capillary force sucks the water into the filter before a droplet can form on the surface. The water flows through the glass filter and is collected either in water-absorbing foam or directly in the beaker. Depending on the flow rate, glass filters with different porosities are available. The experiments carried out have shown that the evaporation rate with this method was in the range of the lowest flow rate despite the use of the evaporation trap. Although it is possible to correct the measurement results for this value, the evaporation rate itself was not satisfactory.
The second method studied was the approach when the needle is immersed in water. Here, the forces on the scale were reduced during filling, but in contrast to the previous method, there is the disadvantage that the buoyancy of the needle must be taken into account as the water level in the beaker rises. With the help of the evaporation trap, it was tried to keep the surroundings of the scales in a saturated environment. This method also worked quite well, but as expected, the evaporation rate was similar to the first method. As a final method, a method very similar to the second method was used, but with an additional oil layer as an evaporation barrier above the water surface in the beaker. Various tests were carried out with different oil layer thicknesses between 1 m m and 5 m m . At first, there was hardly any positive effect with the lower layer thicknesses, and there were also additional effects that could be interpreted as water creeping up the needle and falling back into the beaker after a while. The results only improved significantly starting at an oil layer thickness of 4 m m . This is not meant to be a generally valid statement. There are probably other effects that occur on the needle, or on the wall of the beaker, depending on the materials and the dimensions of the beaker and the needle. Since there are most likely material-dependent capillary effects on the beaker wall and on the needle, an oil layer of 4 m m may not be sufficient in other configurations. Thick oil layers are always possible, but this limits the usable capacity of the weighing scale. For the applications shown, the 5 m m oil layer is a good compromise. No further investigations were carried out in this regard.
Long-term tests were carried out for 10 days each, with a 5 g reference weight (no change in weighing data) and the beaker filled with 10 m m water and 5 m m oil layer, with and without immersed needle. Here, the largest changes in the weighing data occurred in the latter case (Figure 6).
As can be seen from the obtained weighing data, there is a dependence on the air pressure. Increasing air pressure leads to decreasing weight values. A comparison of values at the same air pressure results in an (oil and/or water) evaporation rate of about 0.055 nL min 1 ( 0.055 μg min 1 ), which is an acceptable value. Because of time constraints, the idea was to carefully refill the syringe with the water from the beaker after a measurement, as described by Bissig et al. [12,17]. For this purpose, the aspiration flow rate was adjusted so that, depending on the syringe (volume) used, refilling takes about one hour. This means that the entire measurement set-up would be ready for further measurements after roughly one hour. This procedure is no longer used so often after measurements at RISE Chemistry department showed that the water in the syringe already contained 4% paraffin oil after one refilling. The new approach, especially for more critical measurements, is to prepare the beaker again when it is full. This means that when the beaker is full, its content is disposed of and the base layer of water and paraffin oil is prepared again. Consequently, this requires a lot more effort (preparation time and stabilisation time). All measurements shown later were carried out according to this arrangement.

2.2.5. Measurement Uncertainty

Both measurement facilities are based on dynamic weighing as reference, which is a special type of the gravimetric method. However, most flow generators or devices under test generate and measure volume flow rate. The mass flow rate of a liquid is measured by taking the mass measured by the weighing scale as a function of time. The volume flow rate is then determined as the mass flow rate divided by the temperature-dependent density of the test liquid. Since the density of the test liquid must be known, most tests are carried out with water according ISO 3696 standard [18] or ultra-pure and degassed water, as water is one of the best determined liquids [19]. In addition, efforts are made to keep the ambient temperature as constant as possible and thus the density as constant as possible. This not only has a positive influence on density, but also on the entire process. Ideally, the measurements should be carried out in a climate-controlled room where the temperature is kept at (20 ± 0.5   C ) and the relative humidity between 45% and 60%. It should at least be ensured that the room is temperature-controlled. The absolute temperature plays a subordinate role, it is more important that the temperature can be kept constant at ± 1.0 C over time. In this case, especially because of the weighing scale, the relative humidity should not be less than 30% and not more than 80%.
Weighing scales have the great advantage that they are relatively stable over time and therefore need to be calibrated less frequently. Traceability is routinely performed by the National Laboratory for Mass at RISE. As the calibration intervals for analytical balances are relatively long with one year, the linearity is regularly checked with the internal control weights of the balance. There are many references [14,15,20,21,22] that address the measurement uncertainty budget of the dynamic gravimetric method in microflow. All these approaches are very similar. In addition to the influencing variables mentioned, other influencing variables associated with the dynamic weighing method (e.g., evaporation, buoyancy), the measurement setup (e.g., dimension of the weighing vessel (beaker) and the tubing) and ambient conditions (air pressure, air density, humidity) are also taken into account. As part of the EMPIR JRP 18HLT08 MeDDII, a technical report [23] was prepared which shows in general terms, using an exemplary flow point in the microflow range, how the measurement uncertainty of the dynamic gravimetric method can be calculated.
If these guidelines are applied, the following measurement uncertainties as a function of flow rate are obtained for the Nanoflow test facility at RISE (Table 2). The expanded measurement uncertainty of the Microflow test facility is stated as U ( k = 2 ) 0.5% over the entire flow range. In a recently completed inter-comparison [24] within the EMPIR JRP 18HLT08 MeDDII in the flow rate range from 5 n L min 1 to 1500 n L min 1 , the given values were confirmed, at least for the lower flow rate range of the Nanoflow test facility.

3. Measurement Results

3.1. Tests of Medical Devices

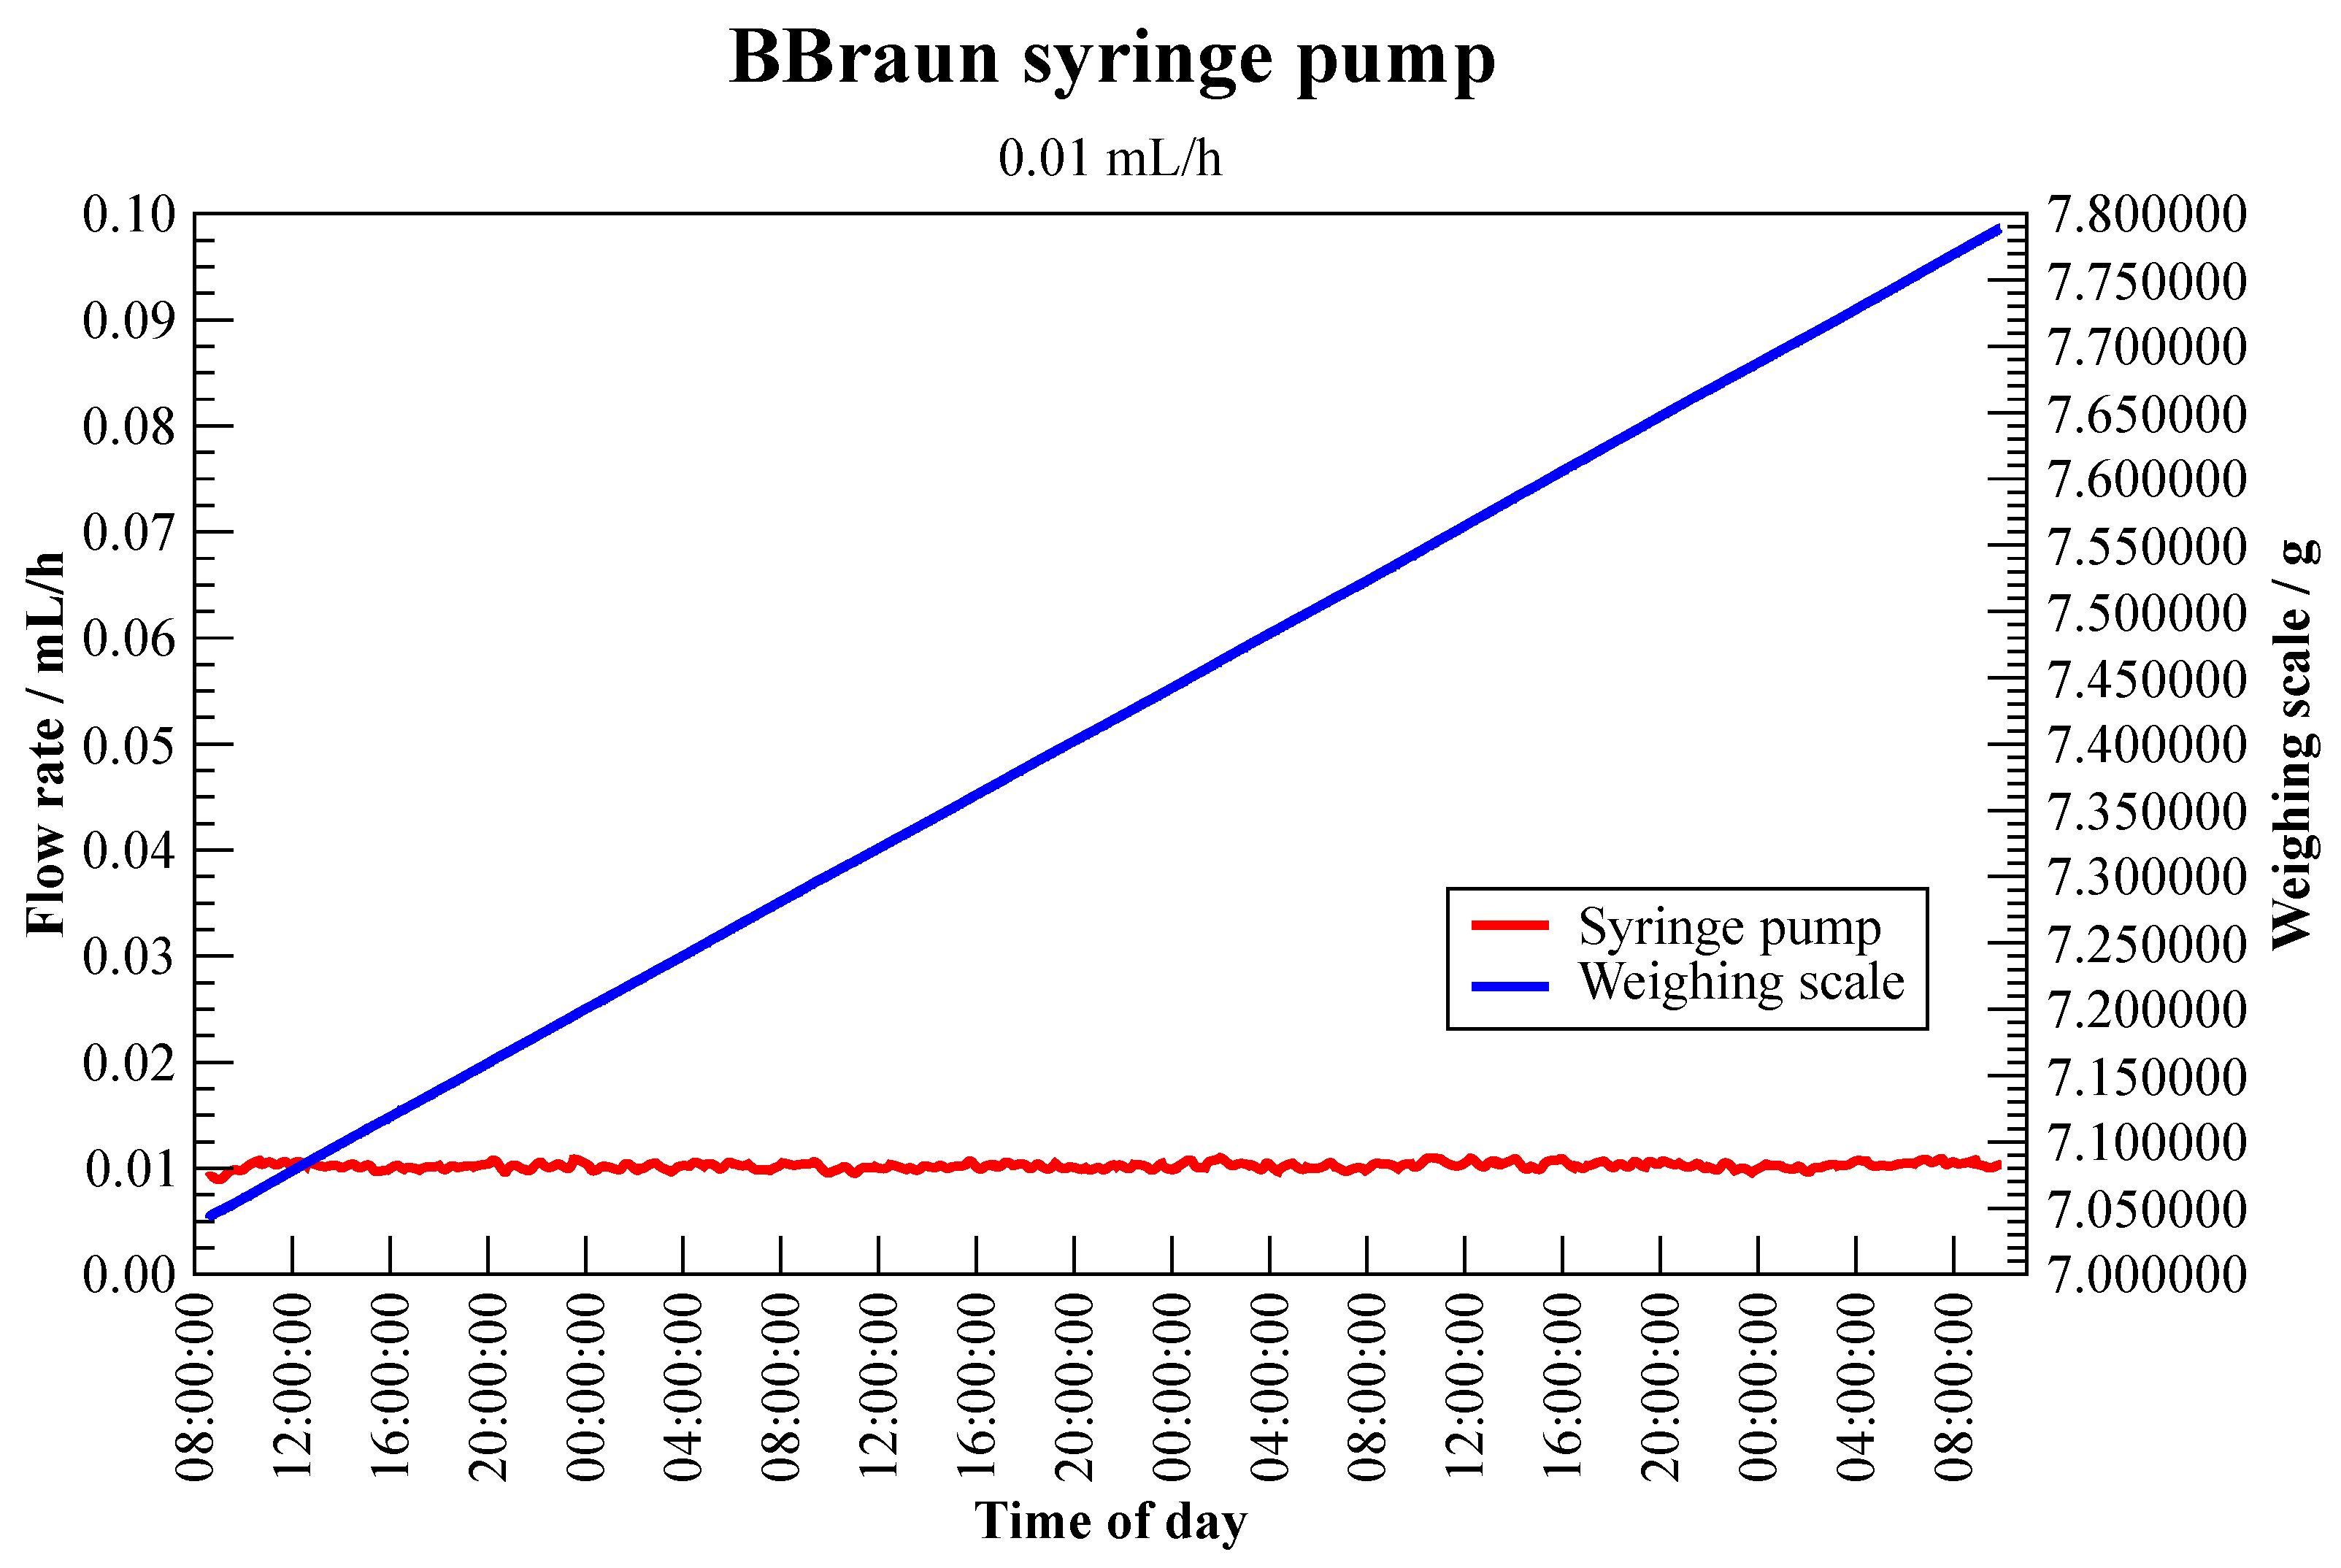
3.1.1. Syringe Pump—BBraun Perfusor Space

Smaller quantities of drugs are administered via syringe pumps. The operating principle is that a pusher block on a threaded rod is driven by an electronically controlled stepper motor. The pusher block (plusher holder) moves the plunger, or more precisely, the thumb rest, and thus delivers the desired amount of volume drug per unit of time. Most syringe pumps have a pressure sensor built into the plunger holder. If a set pressure (occlusion pressure) value is exceeded during the advance of the syringe plunger, the syringe pump stops, and an alarm is triggered. At that moment, the plunger retracts slightly to release the pressure. The BBraun Space is a modular infusion system. The BBraun Perfusor Space syringe pump is designed for intermittent or continuous administration of parenteral fluids, enteral fluids, medications, blood and blood products in adults, children and neonates. For the tests, a pump was used that had been modified by the manufacturer in terms of software, so that it was possible to measure at 0.01 mL h 1 . Normally, the smallest possible flow rate value is limited to 0.10 mL h 1 .
Figure 7 shows the measurements with the BBraun Perfusor Space syringe infusion pump at a set flow rate of 0.01 mL h 1 and a measurement period of about 3 days. The syringe used was a BBraun Omnifix 10 m L , which is probably too large for this low flow rate. From these measurements, the performance of the syringe pump at extremely low flow rates can be derived. The manufacturer specifies a flow rate accuracy of ± 2 % according to IEC/ISO 60601-2-24 [11]. Added to this is the uncertainty of the 10 m L disposable syringe used, which according to standard ISO 7886-2:2020 [25] results in a maximum permissible tolerance for the ID of ± 1 %, leading to a tolerance of ± 2 % for the flow rate. The measurement deviation obtained with this configuration were within the manufacturer’s specifications. In addition, the figure shows a typical measurement as required for the analysis of the short-term variability of the flow rate. Furthermore, such a measurement can be used for the analysis of the short-term variability of the flow rate according to standard IEC/ISO 60601-2-24 (trumpet curve) or the AAMI technical information report (TIR) TIR101:2021 [16] (PK-CV curve). Both methods are similar but different. While the trumpet curve focuses on the variation of the pump flow rate, the CV-PK describes the drug consumption of a patient in a simplified way using a single-compartment pharmacokinetic (PK) model. The result is thus the variation (coefficient of variation, CV) of the drug level in the patient’s body.

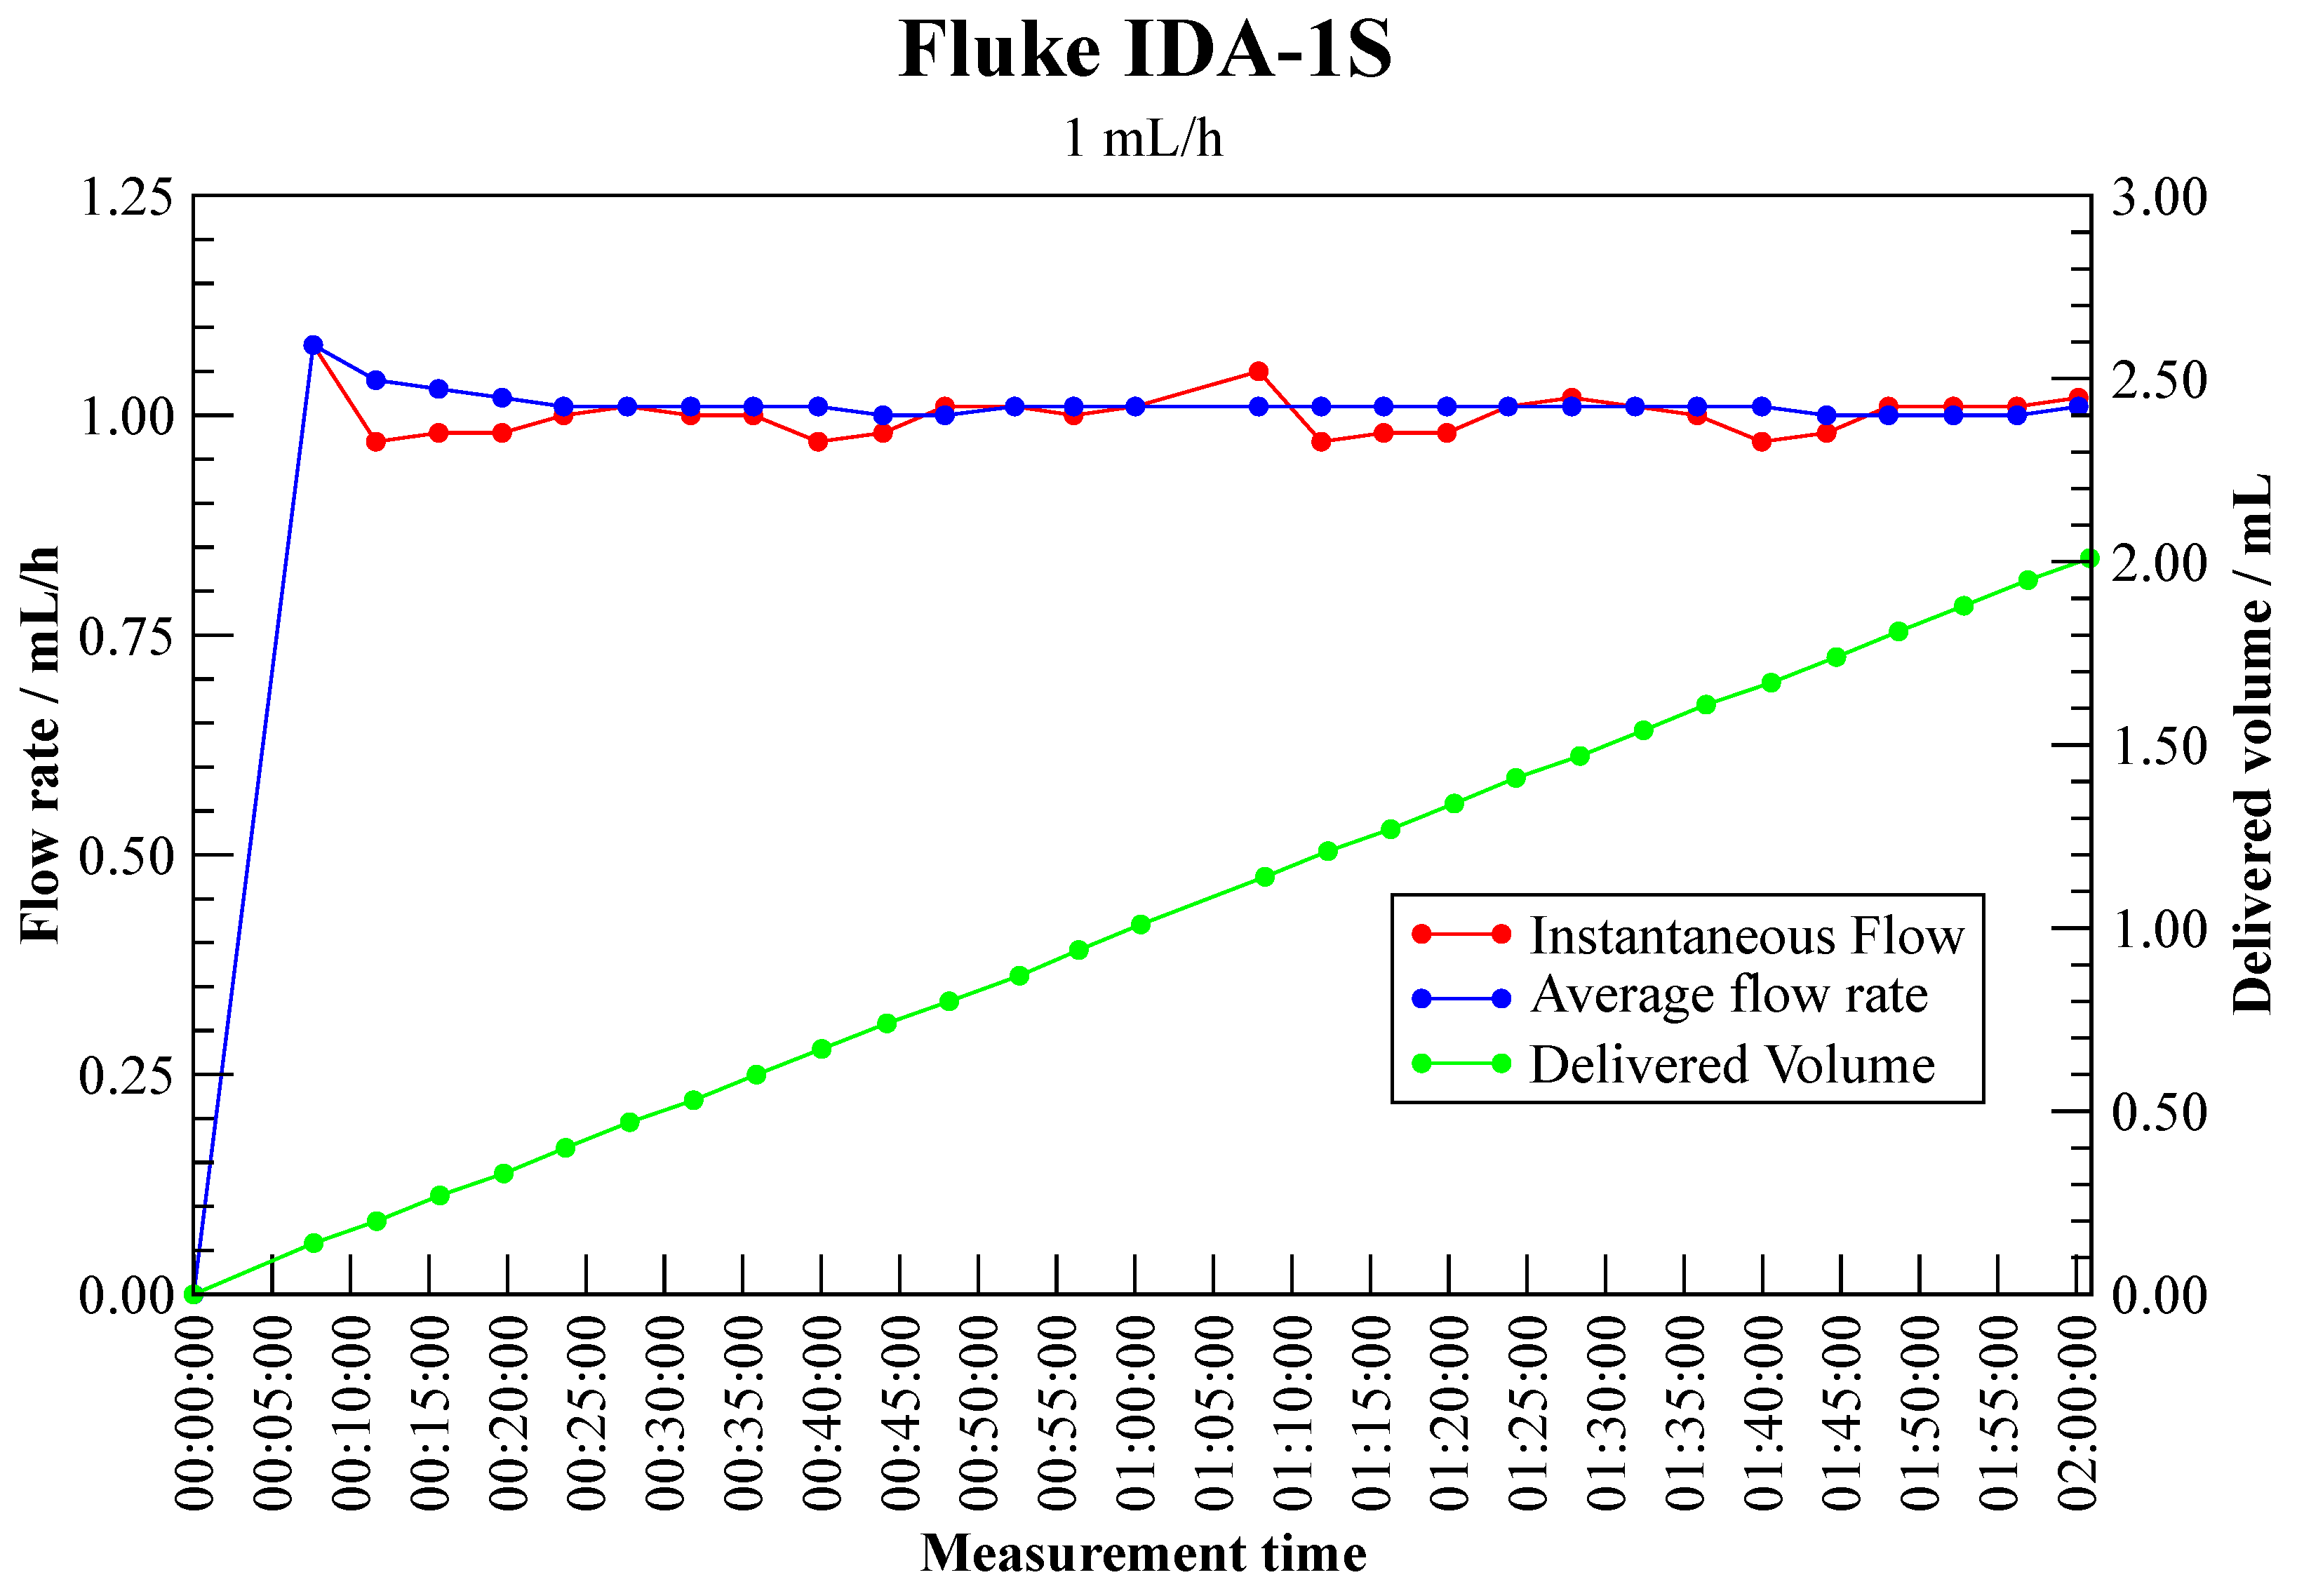
3.1.2. Infusion Device Analyser—Fluke IDA-1S

The investigated Fluke IDA-1S a portable battery-powered (on-the-go) analyser that allows straightforward measurement of infusion pump performance. This device is used in hospitals, for example, to calibrate the large number of syringe pumps. With the IDA-1S it is possible to perform flow tests and occlusion pressure tests in a very simple way. The IDA-1S operates in a flow range from 0.5 mL h 1 to 1000 mL h 1 and a volume range from 0.06 m L to 999 m L . Furthermore, it has an occlusion pressure of up to 45 psi (3 bar). The measuring principle is essentially based on a miniature burette with infrared sensors along its length and sophisticated electronics basically track the flow, which is immediately displayed by the device. The manufacturer recommends the use of distilled water for the tests. The additional use of low concentration detergent (Micro-90) reduces the surface tension, which leads to an improved accuracy. During a test, the measurement data is continuously updated and stored in the device. The complimentary software (HydroGraph) allows for operating the unit remotely and storing the data on a computer.
Figure 8 shows a typical graph during a test, which is produced on the computer and displayed in real time by means of the HydroGraph software. The constantly updating graph directly helps to assess the performance of the infusion device under test. It is recommended by the manufacturer to perform tests with a volume delivery of 10 m L or 20 m L depending on the flow rates to be tested. The example shows a measurement at a flow rate of 1 mL h 1 over a period of about 2 h . Despite the much lower volume delivered (2 m L ), the use of a very stable flow generator along with calibrated syringes shows that, in most cases, even shorter measurement times provide sufficiently accurate measurement results.

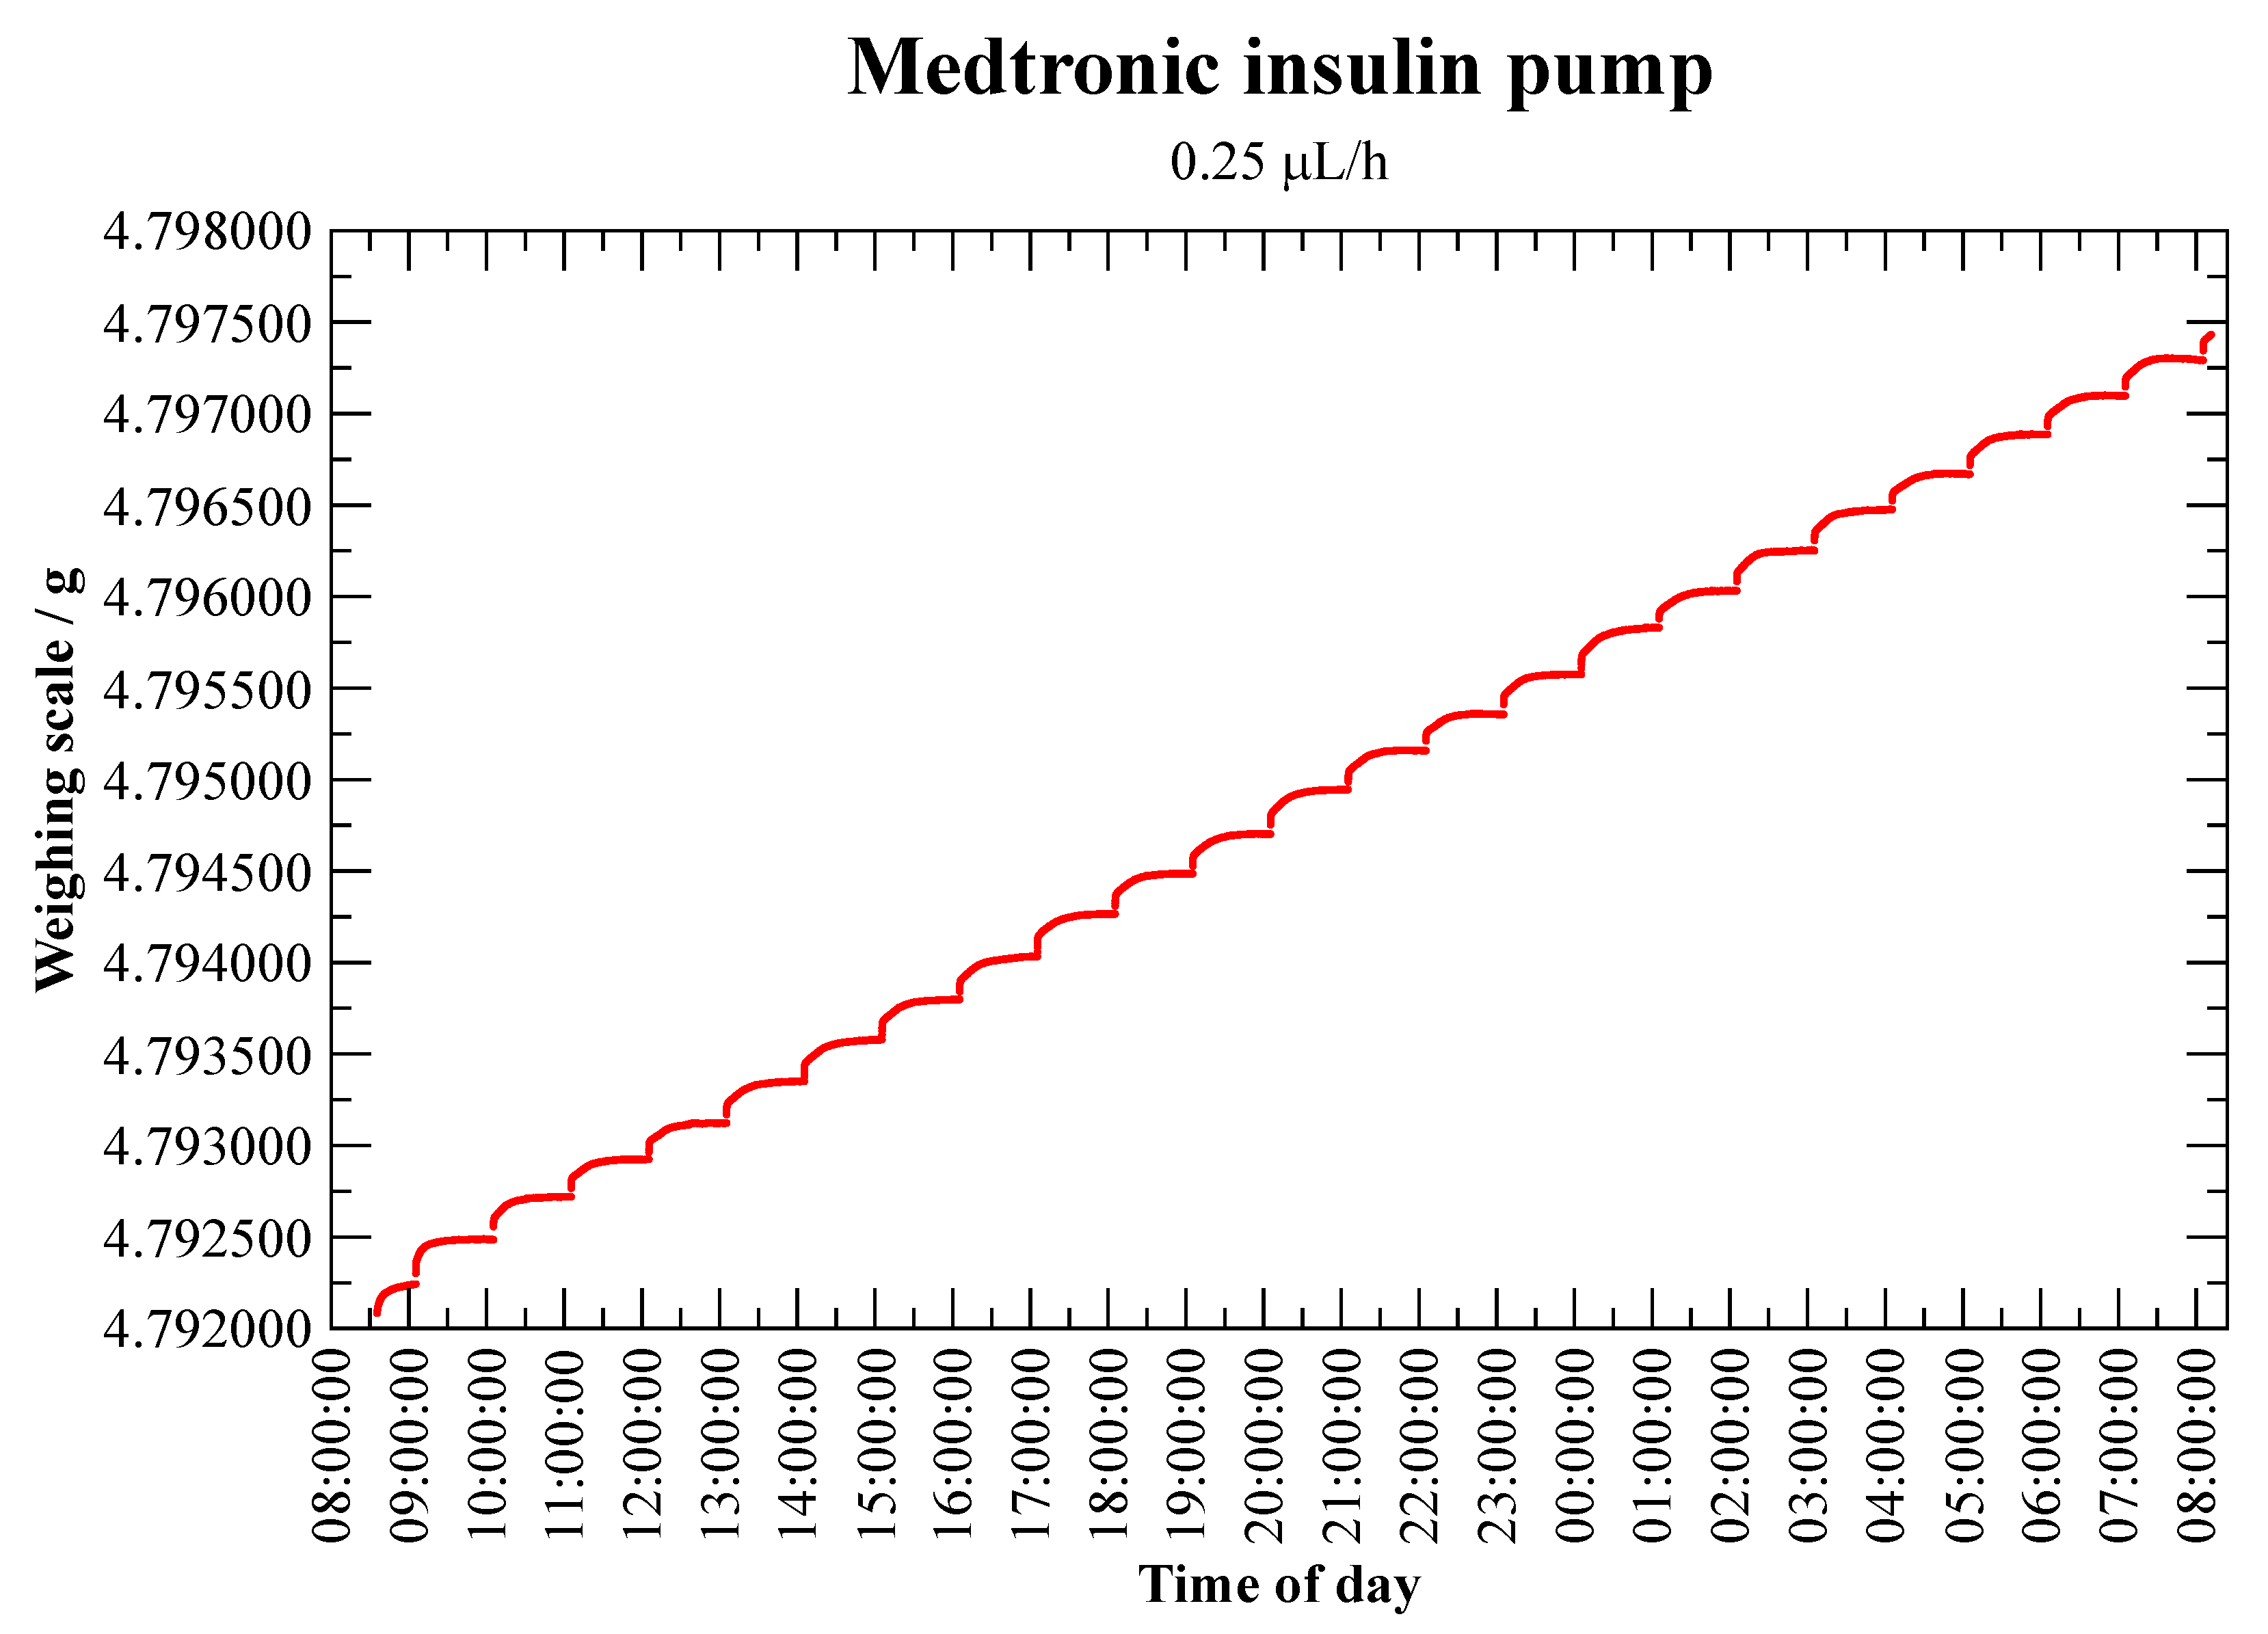
3.1.3. Insulin Pump—Medtronic MiniMed Veo Paradigm 554

The standard therapy for type I diabetes is the administration of insulin. An insulin pump consists of a battery-operated pump that administers insulin directly (patch pumps) or via a catheter and cannula into the patient’s body. The operating principle is similar for all insulin pumps. A small motor (usually a stepper motor, in some cases, also a servo motor) pushes the plunger of an insulin ampoule forward via a threaded rod so that the stored insulin is delivered. Insulin is injected into the patient’s body every few minutes, which means regular start-and-stop operation for the motor. In insulin pump therapy, there are two main classes of insulin, bolus and basal insulin. Bolus insulin is fast-acting insulin that is often used before meals and at moments of extremely high blood glucose. Basal insulin, often referred to as background insulin, is longer acting and helps to keep blood glucose levels constant day and night. A representative of an insulin pump [9,10,26,27] that has been studied is the Medtronic MiniMed Veo Paradigm 554. The pump delivers units (U) of insulin. Here, 100 U of a U-100 insulin correspond to 1 m L . The pump reservoir holds 176 U (around 1.75 m L ) of insulin. Medtronic Paradigm insulin pumps also maintain a patient’s blood glucose targets in two ways, by either delivering a continuous, minimal dose of insulin (basal mode) or a higher dose of insulin (bolus mode) when needed. Both modes can be examined separately. As an example, the basal mode is described in more detail in the following. The pump delivers 0.025 U for basal rates in the range of 0.025 U h 1 to 0.975 U h 1 and 0.05 U for basal rates in the range of 1 U h 1 to 9.95 U h 1 .
Figure 9 shows measurements at a flow rate of 0.025 U h 1 ( 0.25 μL h 1 or 4.167 nL min 1 ), which is probably very close to the lowest limit of the dynamic gravimetric method. The figure clearly shows the pulsed flow rate described by Bissig et al. [28], which represents a constantly delivered volume over a certain time interval. In this case, the pump delivers volume increments of 0.025 U at a flow rate of 0.025 U h 1 , which corresponds to one increment per hour, the smallest possible setting of the insulin pump.

3.2. Further Research

3.2.1. Flow Meter (Static Calibration)—Bronkhorst L01

The Bronkhorst µ-FLOW L01 is a liquid mass flow meter for ultra-low flow rates. In addition, the flow meter has a very low internal volume and provides a fast response flow signal. The µ-FLOW L01 mass flow meter is basically a straight sensor tube without any moving parts or built-in obstructions. The heating/sensor unit works on the principle of heat transfer and is arranged around the pipe. As the flow passes through the flow meter, the temperature difference is determined from the upstream and downstream temperature sensors. The determined temperature difference is a function of the flow rate and the heat capacity of the liquid to be measured. The measured and processed values can be output via the analogue interface or via RS232. Bronkhorst provides its own software for this purpose (FlowDDE for communication with the flow meter and provision of measurement data and FlowPlot for visualisation and communication with FlowDDE). The flow meter is specified for a flow range of 5 m g h 1 to 100 m g h 1 (about 5 μ L h 1 to 100 μ L h 1 for water) with a pressure rating up to 400 bar.
Figure 10 shows a typical calibration measurement at a flow rate of 1000 nL min 1 (60 μ L h 1 ). The red dots are the flow values (around 10 HZ) indicated by the Bronkhorst flow meter and the blue line is the measured weight taken by the weighing scale (1 HZ) over a time period of more than 7 h . At this flow rate, the determined measurement deviation was less than 1.5%.

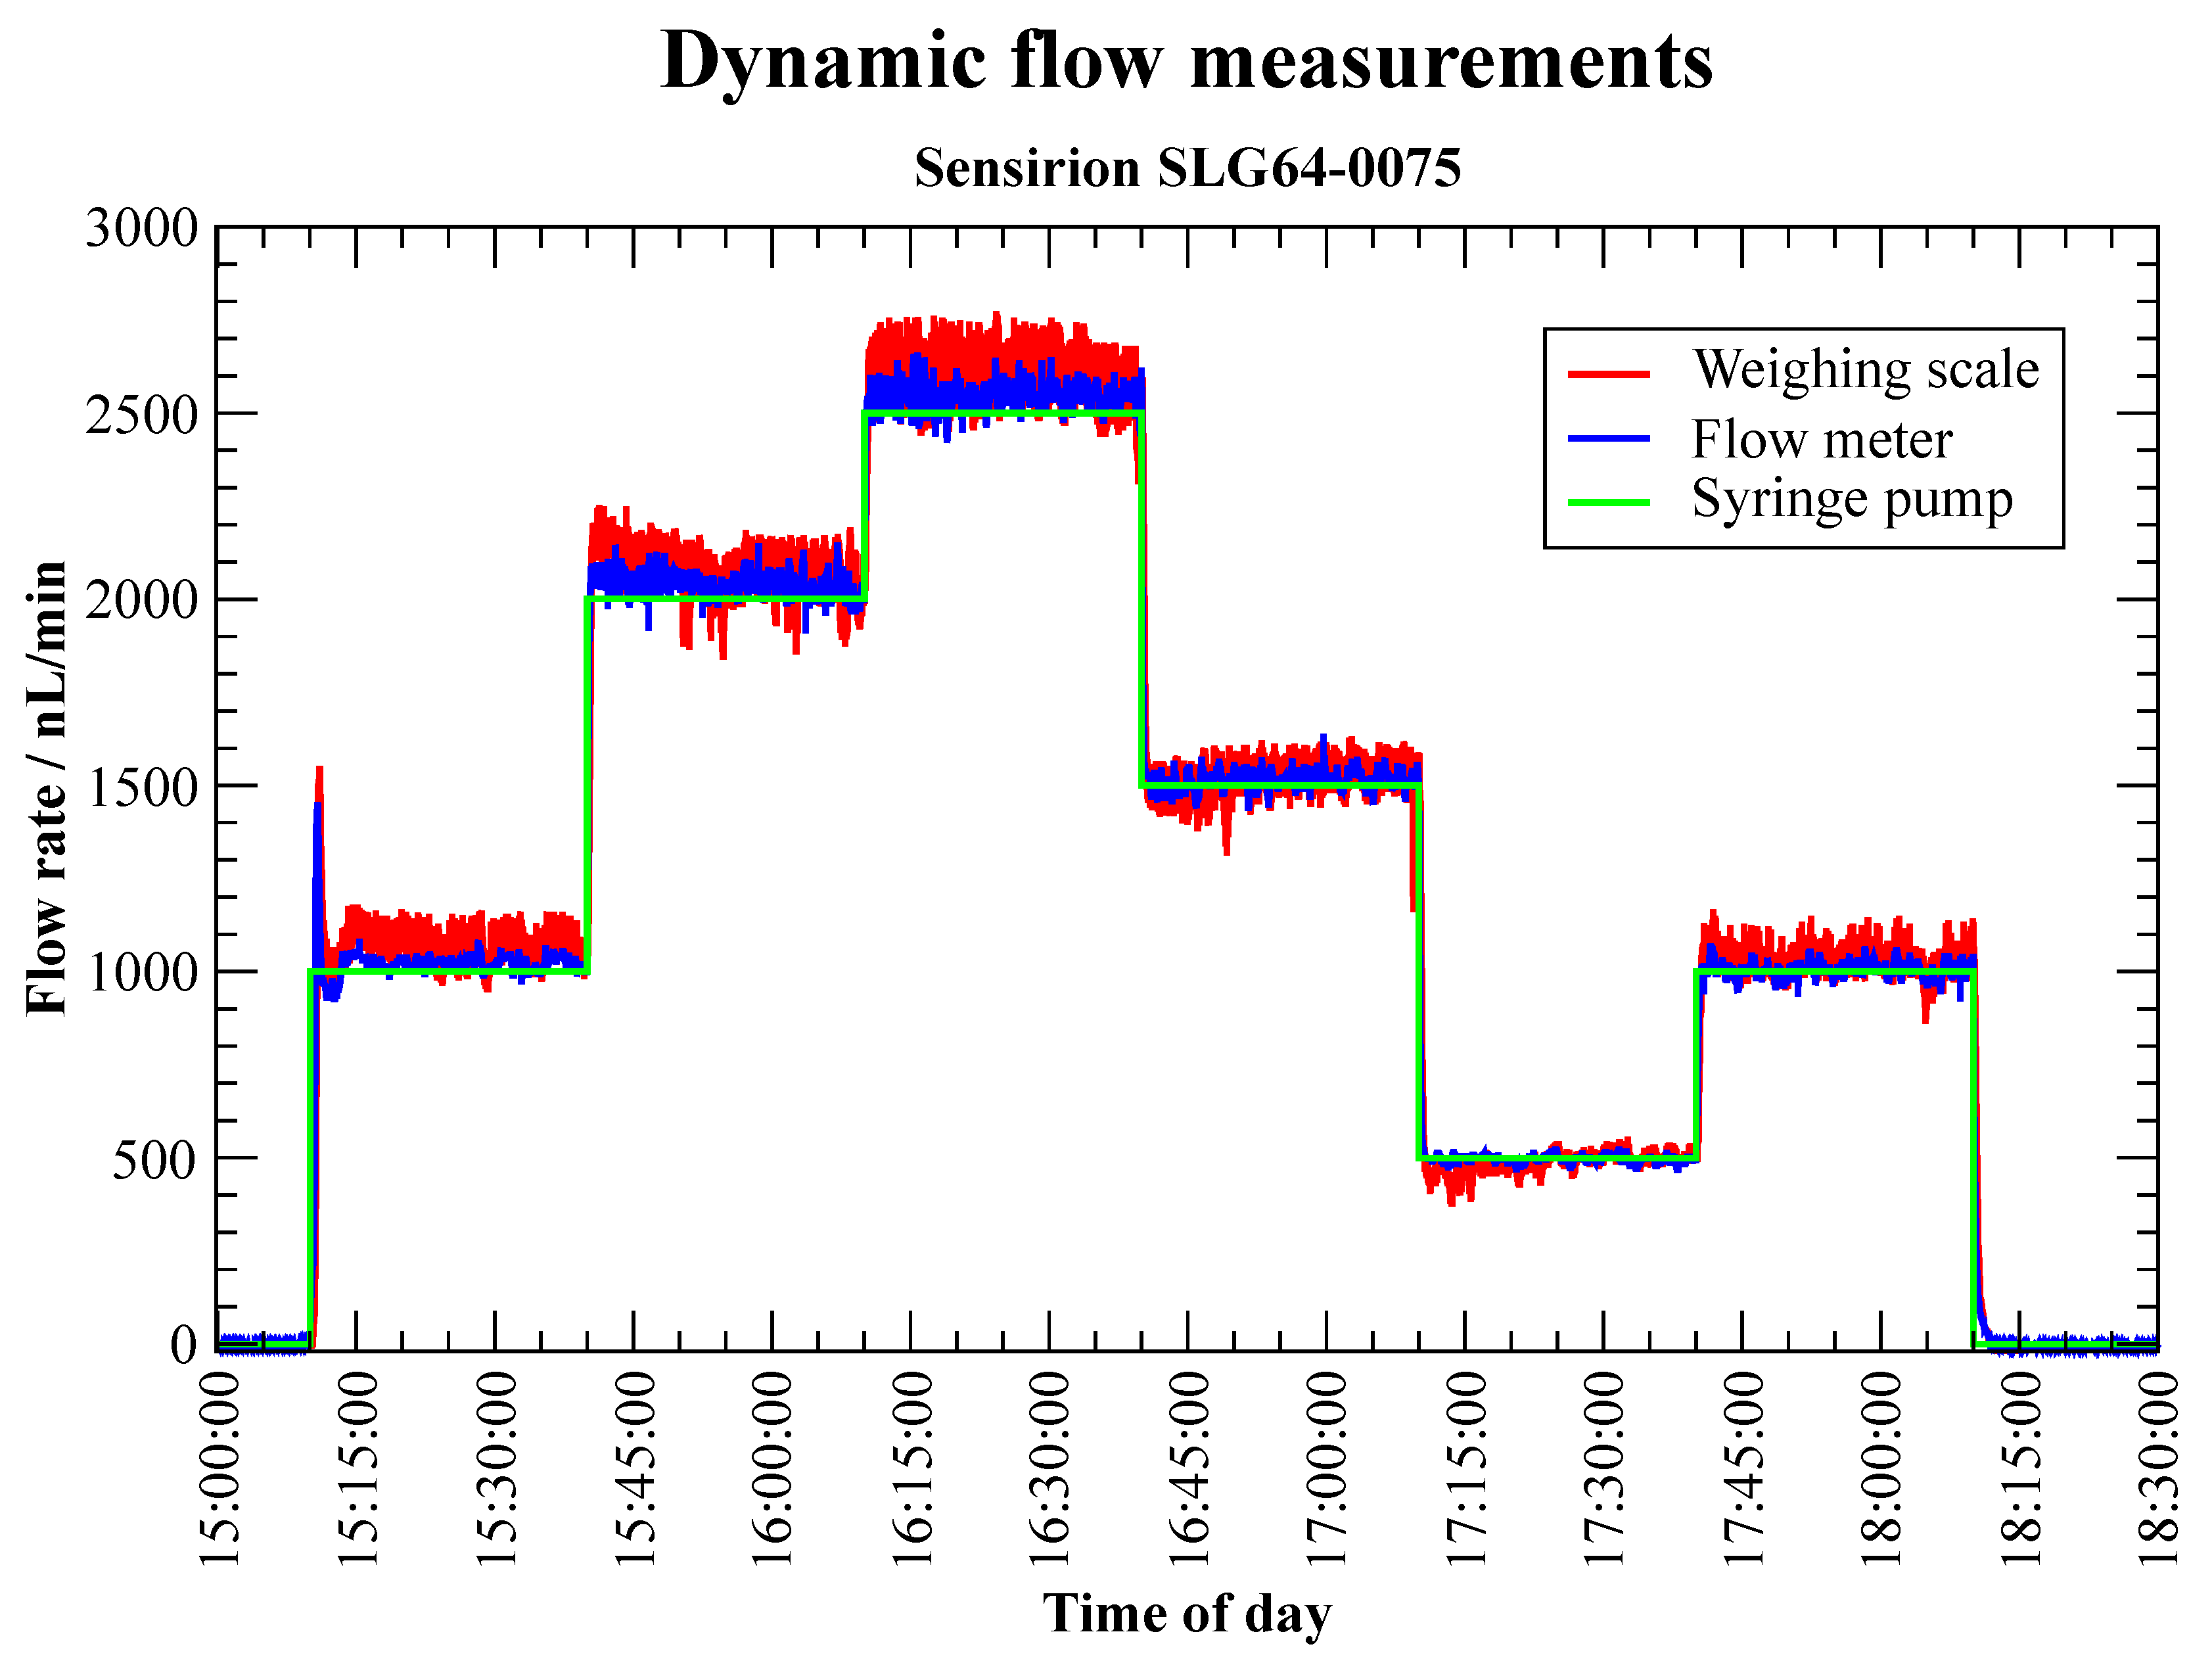
3.2.2. Flow Meter (Dynamic Calibration)—Sensirion SLG64-0075

There are a variety of microfluidic applications that require fast dynamic response and precise control of flow. In this case, the dynamic flows are often measured with flow meters. Flow meters are usually calibrated statically but later used under dynamic flow conditions. When designing the calibration facilities, however, care was taken to ensure that calibrations are also possible under dynamic conditions. At these low flows, Thermal Mass Flow Meters (TMFM) or Coriolis Mass Flow Meters (CFM) are very commonly used. Both types of flow sensors are available without (flow meter) and with control valve (flow controller). In the first case, the dynamic flow profile must be generated by a flow generator; in the second case, the control valve itself can initiate changes in the flow rate.
Figure 11 shows the measurements with the TMFM Sensirion SLG64-0075. Here, the dynamic flow profile described in Table 3 was generated with the help of the Cetoni pump.
The software of the Cetoni pump offers the possibility of conveniently programming such dynamic flow profiles. The green curve in the plot shows the flow rate from the Cetoni pump, the blue curve, the flow rate from the flow meter (DUT) and finally the red curve, the flow rate values from the scale. In this example, the time-resolved weight data of the balance were used to determine the flow rate by means of a moving average over ten values.
It turns out that both the flow meter and the scale can follow the generated dynamic flow profile remarkably well. For both devices, the time for the change from one to the other flow point is below 1 s . If static and dynamic calibrations are compared for the same total volume, both measurements are well within the stated measurement uncertainty range. In further investigations, the times between the flow changes were extremely shortened from 30 min to 30 s and dynamic measurements ( n = 10 repetitions) were compared with static measurements. As in the previous case, the agreement was within the measurement uncertainty range of the flow facility, which indicates a good performance of the flow meter.

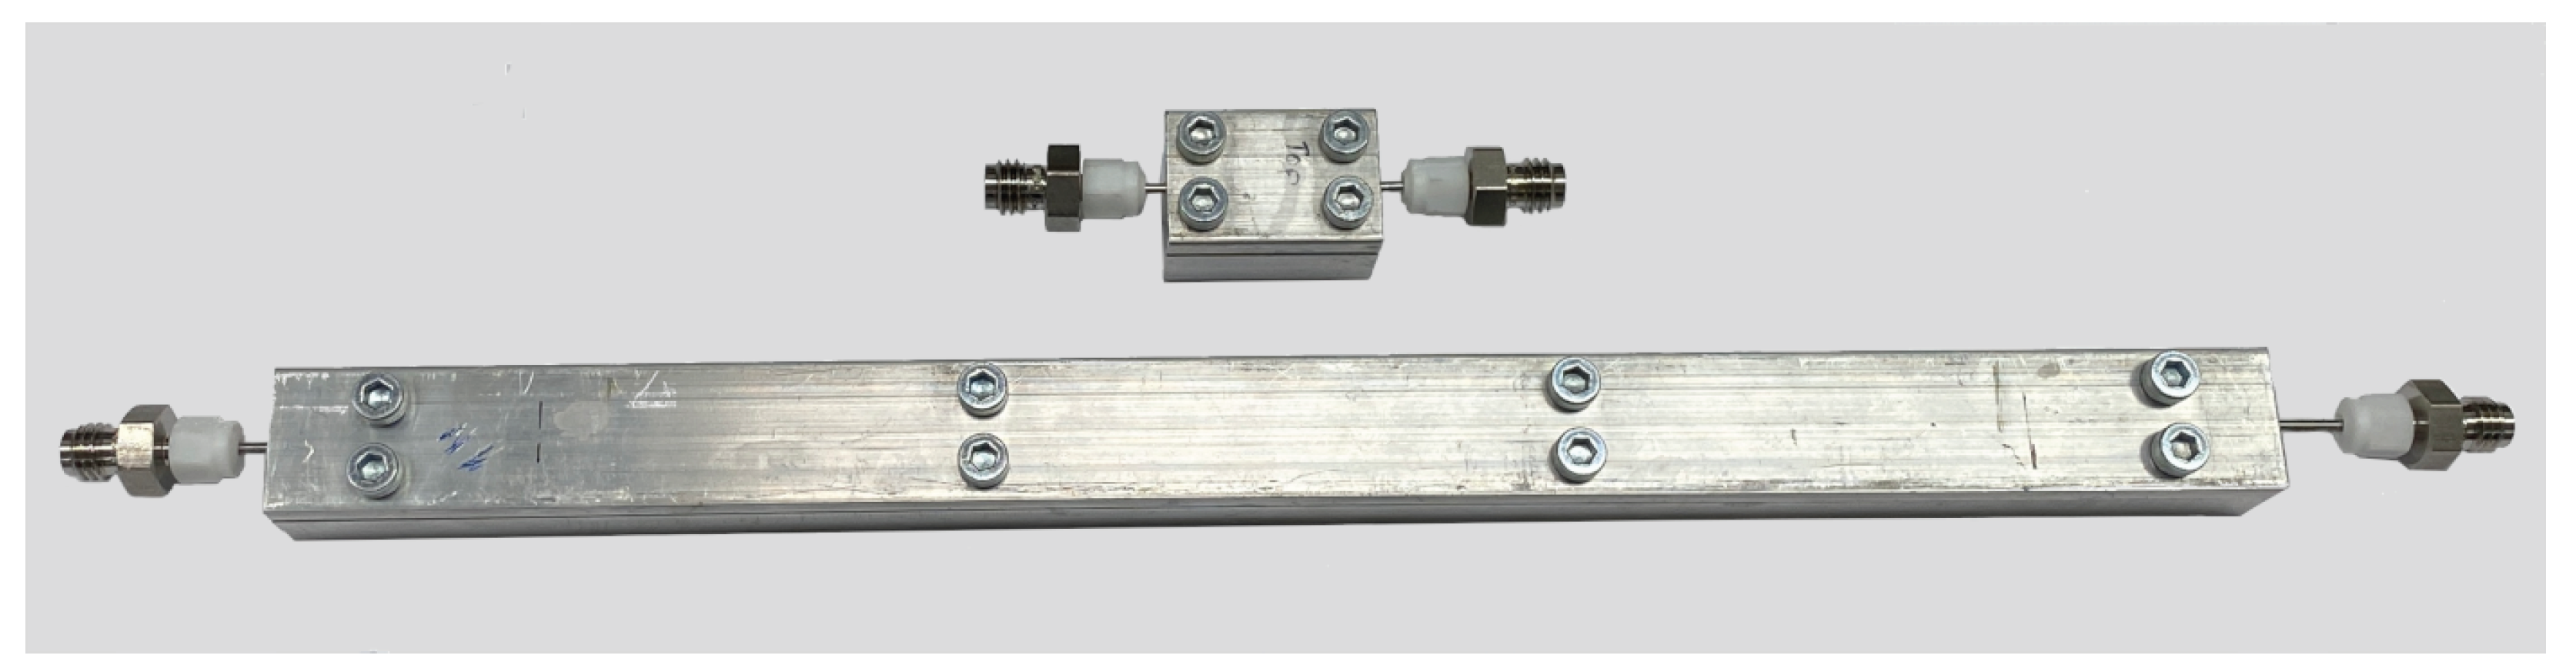
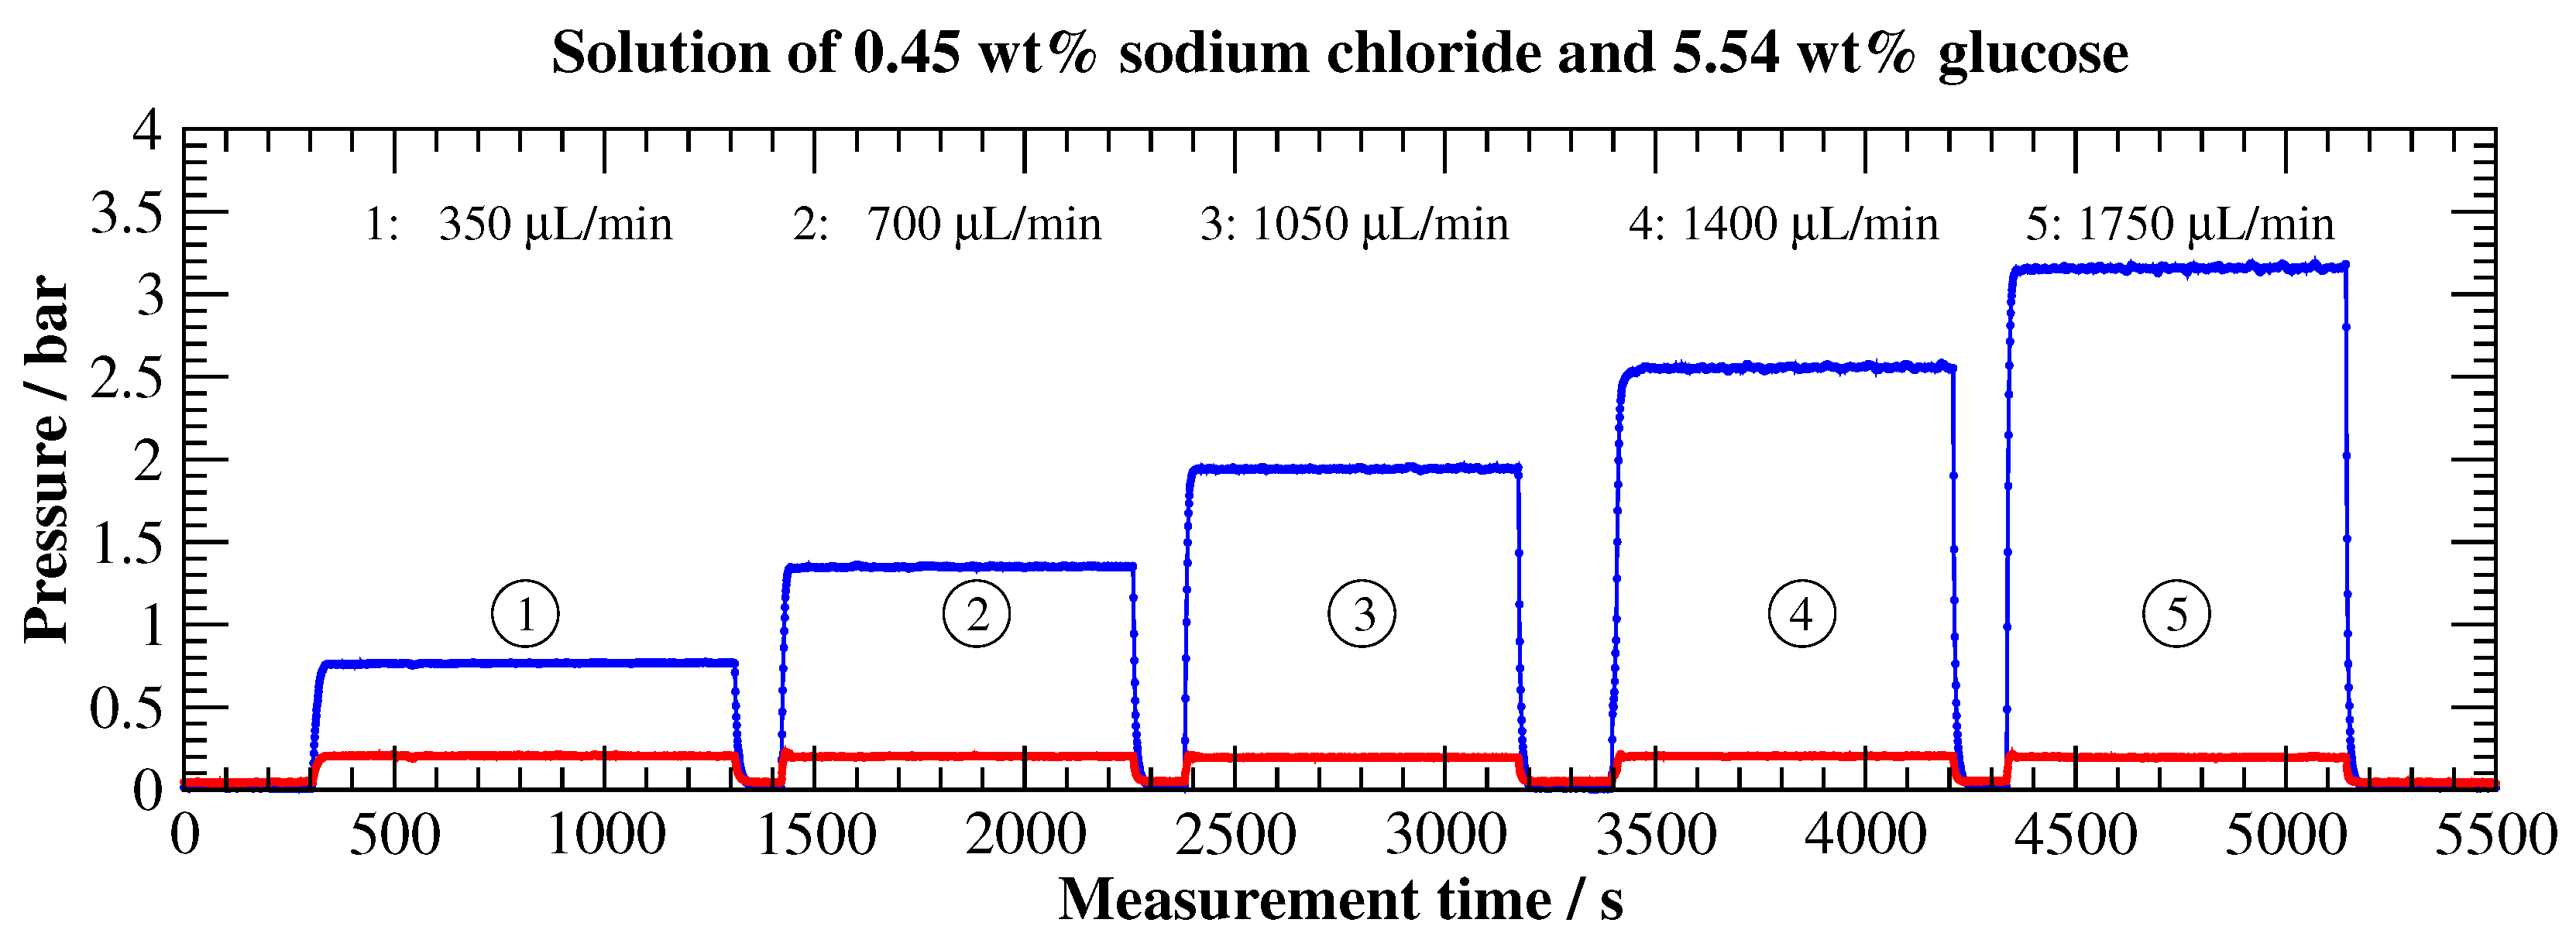
3.2.3. Viscosity Measurement (Pipe Viscometer)

With the measurement facilities it is also possible to carry out traceable inline viscosity measurements of single and multi-component liquids at constant flow rates by means of a pipe viscometer. The pipe viscometer is based on the measurement of the pressure drop over a certain length of a straight tube, the flow rate and the liquid temperature. The pressure, flow rate and temperature can be selected to meet clinical requirements. For laminar flow, the dynamic viscosity is determined according to the Hagen–Poiseuille law.
Q = π × D 4 × Δ p 128 × η × L
In a first step, the diameter of a capillary tube (glass or stainless steel) is determined by measuring the pressure drop across the capillary tube with water or oils of known temperature-dependent viscosity (Equation (1)).
The viscosity measurements at RISE were mainly carried out using a pre-cut stainless steel capillary tube with a length of 300 m m and a nominal ID of 0.18 m m . To get a deeper understanding of the influence of the connections and tubing, additional measurements were carried out with a pre-cut stainless steel capillary tube of 50 m m length with the same ID (Figure 12). The determination of the ID is important because most manufacturers of stainless steel tubing, as used here as capillary tube, give a tolerance of ± 0.05   m m OD and ± 0.025   m m ID for a tubing OD of 1/16 . As soon as the experimentally determined diameter of the capillary tube is known, the (unknown) dynamic viscosity of other liquids can be determined by simply determining the pressure loss ( Δ p = p 1 p 2 ) . It should be noted that, in addition to the viscosity, the capillary properties (length and diameter) are also temperature-dependent and therefore the experiments are carried out under approximately the same conditions as when determining the diameter with the reference liquids. The determined ID with reference liquids at RISE resulted in a value of 0.1904 m m , which is within the manufacturer’s tolerance for pre-cut stainless steel capillary tubes. Within the scope of the MeDDII project, eight Newtonian and two non-Newtonian test liquids with a very wide viscosity range were produced and investigated.
Figure 13 shows a typical dynamic viscosity measurement, i.e., the measurement of the pressure drop at five different flow rates on the example of a solution consisting of 0.45 wt% sodium chloride (NaCl) and 5.54 wt% glucose (C6H12O6) using the 300 mm capillary tube. The measurements resulted in a dynamic viscosity of 1.113 m Pa s at a temperature of 22.0 °C. Compared to reference calibration measurements in viscosity (NQIS/EIM, kinematic viscosity: 1.0952 m m 2 s 1 ) and density laboratories (IPQ, density: 1.0219 g c m 3 ) of project partners at the same temperature, a measurement deviation of −0.55% results. In summary, a target uncertainty U ( k = 2 ) of less than 2.0% was achieved with the pipe viscometer for all test liquids investigated. The uncertainty value was chosen conservatively because it is known that a fluid with normally Newtonian behaviour can show non-Newtonian behaviour in microflow due to high shear rates [29]. With some effort, this value can certainly be halved, especially for Newtonian fluids.

4. Discussion and Conclusions

Infusion devices are one of the largest numbers of medical devices in hospitals and clinics worldwide. These devices are used to control the administration of a variety of drugs, nutrition and blood products. An improperly functioning infusion pump can pose a major health risk to patients, even death. It is therefore critical to test the performance of infusion devices to ensure that they perform according to the specifications of the manufacturers and the expectations of the clinicians. Most infusion pump manufacturers recommend that preventive maintenance be carried out every six months or annually. In addition, it is important to understand the different delivery mechanisms used in infusion pumps to control both the flow rate and the delivered volume. The different operating principles have an impact on the flow rate and flow stability, which in turn affects the measurement used to assess the performance according to the specification of the manufacturer. For some infusion devices, such as syringe pumps and Infusion Device Analysers (IDA), there are standards that describe the procedures according to which these devices should be tested. However, there is often not the infrastructure available in case the syringe pumps should be investigated and characterised more in detail, for example, the behaviour during dynamic bolus flow rate or when doubling the flow rate. It looks even worse when infusion devices such as pain pumps and insulin pumps are to be characterised that mainly deliver very small volume flows over a long period of time, but then also in many cases can perform shorter, often dynamic flow changes. In addition, there are different types of rapid flow changes that these infusion devices can perform. For example, the flow changes may be more stepwise, due to changes in the flow rate in the infusion device (e.g., doubling the flow rate). On the other hand, there are also flow changes, such as those that only provide a short-term delivery of a higher volume (e.g., bolus flow rate) through the infusion device and then return to the original flow rate. Until recently, there was no infrastructure available for this type of investigation that allowed traceable measurements of these small volumes to be carried out at this ultra-low flow rate range. The main objective is to create improved and new calibration procedures for drug delivery devices. These will have a large impact as the increased calibration accuracy will allow a reduction in systematic uncertainty contributions. The systematic contributions can be caused by a coincidence of the measurement principle of the device and the calibration method, which leads to additional deviations. At RISE, the Swedish National Metrology Institute (NMI), infrastructure has now been established to perform such calibrations in a flow range from 0.0003 mL h 1 (5 nL min 1 ) to 100 mL h 1 in a pressure range from 0 bar to 5 bar at ambient temperature. The flow range is covered by two test facilities based on the dynamic gravimetric method. The advantage of the dynamic weighing method used over optical methods is that it is directly traceable and flow changes can be measured and visualised in real time using the weighing values. This direct feedback also makes the method an attractive teaching tool, not least for health professionals such as physicians and nurses. The various infusion devices have different delivery mechanisms and therefore different characteristics in terms of response, delay and stability time, sensitivity, flow rate stability, accuracy, precision, etc. In addition, the associated accessories (fittings, tubes) can also have an influence on the flow rate (dead volume, compliance and push-out effects). The infrastructure for carrying out such investigations and calibrations based on the available standards is now in place and can also be adapted to future standards if required. Another special feature of the two test facilities is that it is not only possible to measure with distilled or ultra-pure and degassed water as the measuring medium, as specified in most standards, but also liquids other than water (non-toxic liquids). If the infusion solution used is a Newtonian liquid, it is possible to measure the dynamic viscosity in addition to the flow rate. The option and combination of measuring dynamic flows and different measurement liquids makes the equipment also interesting for measurements outside the medical sector. There are other areas of work mostly in analytical laboratories, such as HPLC applications, biomedical and environmental applications, but also various industries, such as the chemical industry, semiconductor industry, food and pharmaceutical industry that use flow devices that operate in the micro and nano flow rate range. In this context, flow meters, especially thermal mass flow meters and Coriolis flow meters, which are frequently used in these areas, should be emphasised. With the newly created infrastructure, it is possible to test these devices statically and dynamically over a wide flow rate range, often even with the medium used later in the application.

Author Contributions

Conceptualisation, O.B. and K.S.; methodology, O.B. and K.S.; software, O.B.; formal analysis, O.B.; investigation, O.B. and K.S.; supervision, O.B.; writing—original draft preparation, O.B.; visualisation, O.B.; writing—review and editing, K.S. All authors have read and agreed to the published version of the manuscript.

Funding

The authors greatly acknowledge the financial support of Vinnova (Sweden’s Innovation Agency) project 2014-05078 as a basis for this work. This work was supported by the European Association of National Metrology Institutes (EURAMET) through the European Metrology Programme for Innovation and Research (EMPIR) Joint Research Project (JRP) 18HLT08 Metrology for Drug Delivery (MeDDII). The EMPIR initiative is co-funded by the European Union’s Horizon 2020 research and innovation programme and the EMPIR Participating States.

Institutional Review Board Statement

Not applicable.

Informed Consent Statement

Not applicable.

Data Availability Statement

The data presented in this study are available on request from the corresponding author. The data is not publicly available due to the amount of data and the specific type of storage.

Conflicts of Interest

The authors declare no conflict of interest.

Abbreviations and Nomenclature

Abbreviations

The following abbreviations are used in this manuscript:
AAMIAssociation for the Advancement of Medical Instrumentation
CASChemical Abstract Service
CFMCoriolis Flow Meter
CSVComma-Separated Values
DAQData Acquisition
DDEDynamic Data Exchange
DUTDevice Under Test
ECRIEmergency Care Research Institute
EMPIR       European Metrology Programme for Innovation and Research
ENEuropean Standard
HLPCHigh Performance Liquid Chromatography
HPWHighly Purified Water
IDInner Diameter
IECInternational Electrotechnical Commission
IDAInfusion Device Analyser
IPQPortuguese Institute for Quality
ISOInternational Organisation for Standardisation
JRPJoint Research Project
METASThe Federal Institute of Metrology
MT-SICSMettler Toledo Standard Interface Command Set
NMINational Metrology Institute
NQIS/EIMHellenic Institute of Metrology/National Quality Infrastructure System
ODOuter Diameter
RISEResearch Institutes of Sweden
TMFMThermal Mass Flow Meter
TIRTechnical Information Report

Nomenclature

D(Pipe, tube) diameter[m]
Δ p = p 2 p 1 Pressure drop (pressure loss)[Pa]
L(Pipe, tube) length[m]
p 1 Upstream (inlet) pressure[Pa]
p 2 Downstream (outlet) pressure[Pa]
w t % Mass fraction (percentage by weight)[–]
μ Dynamic viscosity[Pa s]
ν = μ / ρ Kinematic viscosity[m 2 s 1 ]
ρ Density[kg m 3 ]

References

  1. Lee, P.T.; Thompson, F.; Thimbleby, H. Analysis of infusion pump error logs and the ir significance for health care. Br. J. Nurs. 2012, 21, S12–S20. [Google Scholar] [CrossRef] [PubMed] [Green Version]
  2. Heinemann, L.; Fleming, G.A.; Petrie, J.R.; Holl, R.W.; Bergenstal, R.M.; Peters, A.L. Insulin Pump Risks and Benefits: A Clinical Appraisal of Pump Safety Standards, Adverse Event Reporting, and Research Needs: A Joint Statement of the European Association for the Study of Diabetes and the American Diabetes Association Diabetes Technology Working Group. Diabetes Care 2015, 38, 716–722. [Google Scholar] [CrossRef] [PubMed] [Green Version]
  3. Ma, H.; Lovich, M.A.; Peterfreund, R.A. Quantitative analysis of continuous intravenous infusions in pediatric anesthesia: Safety implications of dead volume, flow rates, and fluid delivery. Pediatr. Anesth. 2011, 21, 78–86. [Google Scholar] [CrossRef] [PubMed]
  4. Husch, M.; Sullivan, C.; Rooney, D.; Barnard, C.; Fotis, M.; Clarke, J.; Noskin, G. Insights from the sharp end of intravenous medication errors: Implications for infusion pump technology. Qual. Saf. Health Care 2005, 14, 80–86. [Google Scholar] [CrossRef] [PubMed] [Green Version]
  5. Taylor, M.A.; Jones, R. Risk of Medication Errors With Infusion Pumps: A Study of 1004 Events From 132 Hospitals Across Pennsylvania. Patient Saf. 2019, 1, 60–69. [Google Scholar] [CrossRef]
  6. ECRI Institute. Top 10 Health Technology Hazards for 2017. Excerpted from: Health Devices. 2016. Available online: https://www.ecri.org/Resources/Whitepapers_and_reports/Haz17.pdf (accessed on 1 August 2022).
  7. Batista, E.; Furtado, A.; Pereira, J.; Ferreira, M.; Bissig, H.; Graham, E.; Niemann, A.; Timmerman, A.; Alves e Sousa, J.; Ogheard, F.; et al. New EMPIR project—Metrology for Drug Delivery. Flow Meas. Instrum. 2020, 72, 101716. [Google Scholar] [CrossRef]
  8. Clarkson, D. Accuracy estimations of testing of infusion devices using weighing balances. Med. Eng. Phys. 2002, 24, 229–235. [Google Scholar] [CrossRef]
  9. Jahn, L.G.; Capurro, J.J.; Levy, B.L. Comparative Dose Accuracy of Durable and Patch Insulin Infusion Pumps. J. Diabetes Sci. Technol. 2013, 7, 1011–1020. [Google Scholar] [CrossRef] [PubMed] [Green Version]
  10. Kamecke, U.; Waldenmaier, D.; Haug, C.; Ziegler, R.; Freckmann, G. Establishing Methods to Determine Clinically Relevant Bolus and Basal Rate Delivery Accuracy of Insulin Pumps. J. Diabetes Sci. Technol. 2019, 13, 60–67. [Google Scholar] [CrossRef] [PubMed] [Green Version]
  11. IEC/ISO 60601-2-24:2012; Medical Electrical Equipment—Part 2-24: Particular Requirements for the Basic Safety and Essential Performance of Infusion Pumps and Controllers. International Electrotechnical Commission: Geneva, Switzerland, 2012.
  12. Bissig, H.; Tschannen, M.; de Huu, M. Water collection techniques at very low flow rates including strong capillary effects. Flow Meas. Instrum. 2020, 73, 101744. [Google Scholar] [CrossRef]
  13. Batista, E.; Godinho, I.; Martins, R.F.; Mendes, R.; Robarts, J. Development of an experimental setup for microflow measurement using interferometry. Flow Meas. Instrum. 2020, 75, 101789. [Google Scholar] [CrossRef]
  14. Sousa, J.A.; Batista, E.; Pellegrino, O.; Ribeiro, A.S.; Martins, L.L. Method selection to evaluate measurement uncertainty in microflow applications. J. Phys. Conf. Ser. 2019, 1379, 12033. [Google Scholar] [CrossRef]
  15. Sousa, J.; Batista, E.; Demeyer, S.; Fischer, N.; Pellegrino, O.; Ribeiro, A.; Martins, L. Uncertainty calculation methodologies in microflow measurements: Comparison of GUM, GUM-S1 and Bayesian approach. Measurement 2021, 181, 109589. [Google Scholar] [CrossRef]
  16. AAMI TIR101:2021; Fluid Delivery Performance Testing for Infusion Pumps. American National Standards Institute (ANSI): Washington, DC, USA,, 2021.
  17. Bissig, H.; Tschannen, M.; de Huu, M. Micro-flow facility for traceability in steady and pulsating flow. Flow Meas. Instrum. 2015, 44, 34–42. [Google Scholar] [CrossRef]
  18. ISO 3696:1987; Water for Analytical Laboratory Use—Specification and Test Methods. International Organization for Standardization: Geneva, Switzerland, 1987.
  19. Hemmati-Sarapardeh, A.; Hatami, S.; Taghvaei, H.; Naseri, A.; Band, S.S.; Chau, K.W. Designing a committee of machines for modeling viscosity of water-based nanofluids. Eng. Appl. Comput. Fluid Mech. 2021, 15, 1967–1987. [Google Scholar] [CrossRef]
  20. Bissig, H.; Petter, H.T.; Lucas, P.; Batista, E.; Filipe, E.; Almeida, N.; Ribeiro, L.F.; Gala, J.; Martins, R.; Savanier, B.; et al. Primary standards for measuring flow rates from 100 nl/min to 1 mL/min—Gravimetric principle. Biomed. Eng. Biomed. Tech. 2015, 60, 301–316. [Google Scholar] [CrossRef] [PubMed]
  21. EURAMET. Calibration Guide No. 18—Guidelines on the Calibration of Non-Automatic Weighing Instruments; EURAMET: Braunschweig, Germany, 2015. [Google Scholar]
  22. Batista, E.; Almeida, N.; Godinho, I.; Filipe, E. Uncertainty calculation in gravimetric microflow measurements. In Advanced Mathematical and Computational Tools in Metrology and Testing X; World Scientific Publishing Co. Pte. Ltd.: Singapore, 2015; pp. 98–104. [Google Scholar] [CrossRef]
  23. MeDDII. Report on Calibration Methods for Measuring the Response or Delay Time of Drug Delivery Devices Using Newtonian Liquids for Flow Rates from 5 nL/min to 100 nL/min. EMPIR 18HLT08 MeDDII Deliverable—D1. 2020. Available online: https://drugmetrology.com/wp-content/uploads/2020/10/MeDDII-D1_V1-1.pdf (accessed on 28 June 2022).
  24. MeDDII. Report on the Results from the Inter-Comparison of the Primary Standards and Improved Measurement Facilities for Flow Rates from 5 nL/min to 100 nL/min (with Uncertainty Targets of 1% (k = 2) for Steady Flow and 2% (k = 2) for Fast Changing Flow). EMPIR 18HLT08 MeDDII Deliverable—D2. 2020. Available online: https://drugmetrology.com/wp-content/uploads/2022/02/MeDD_II_D2-Final.pdf (accessed on 28 June 2022).
  25. ISO 7886-2:2020; Sterile Hypodermic Syringes for Single Use—Part 2: Syringes for use with Power-Driven Syringe Pumps. International Organization for Standardization: Geneva, Switzerland, 2020.
  26. Lal, R.; Leelarathna, L. Insulin Pumps. Diabetes Technol. Ther. 2020, 22, 17–31. [Google Scholar] [CrossRef] [PubMed] [Green Version]
  27. Zisser, H. Insulin Pump (Dose-to-Dose) Accuracy: What Does It Mean and When Is It Important? J. Diabetes Sci. Technol. 2014, 8, 1142–1144. [Google Scholar] [CrossRef] [PubMed] [Green Version]
  28. Bissig, H.; Tschannen, M.; de Huu, M. Traceability of pulsed flow rates consisting of constant delivered volumes at given time interval. Flow Meas. Instrum. 2020, 73, 101729. [Google Scholar] [CrossRef]
  29. Colin, S. Introduction to microflows. In Microfluidics; John Wiley & Sons, Ltd.: Hoboken, NJ, USA, 2013; pp. 1–23. [Google Scholar] [CrossRef]
Figure 1. Schematic illustration of a typical measurement setup (Nanoflow test facility) for the calibration of a flow meter as DUT.
Applsci 12 08332 g001
Figure 2. Photo of a typical measurement setup (Nanoflow test facility) for the calibration of a flow meter as DUT.
Applsci 12 08332 g002
Figure 3. Schematic drawing of a typical measurement setup (Microflow test facility) for the calibration of a flow meter as DUT. In this case, the drawing shows the CORI-FLOW M12 from Bronkhorst, which was used as a secondary standard.
Applsci 12 08332 g003
Figure 4. Left: Typical construction of a syringe which works according to the piston principle. Right: Modified syringe that works according to the displacer principle. In the first case, the ID of the barrel determines the flow rate; in the second case, the OD of the plunger.
Applsci 12 08332 g004
Figure 5. (Left) Glass filter that can be placed in the beaker; (Centre) self-made evaporation trap; (Right) evaporation trap and beaker on the scale.
Applsci 12 08332 g005
Figure 6. Long-term test of evaporation over 10 days while the beaker was filled with 10 m m water and 5 m m oil film and the needle was immersed.
Applsci 12 08332 g006
Figure 7. Measurement results of the BBraun syringe pump for measurements over three day (72 h ) for a preset flow rate of 0.01 mL h 1 using a 10 m L disposable syringe.
Applsci 12 08332 g007
Figure 8. Typical calibration curve as produced by the HydroGraph software during a test. The red curve shows the instantaneous flow rate, the blue curve the average flow rate and the green curve the delivered volume.
Applsci 12 08332 g008
Figure 9. Measurement results of the Medtronic insulin pump for measurements over one day (24 h ) for a preset flow rate of 0.025 U h 1 ( 0.25 μ L h 1 ).
Applsci 12 08332 g009
Figure 10. Measurement results of the Bronkhorst flow meter for a set flow rate of 1000 nL min 1 . The red dots show the high-resolution (10 HZ) flow rate values from the Bronkhorst flow meter (DUT) and the blue curve shows the mass increase recorded by the weighing scale (1 HZ) in the same time frame.
Applsci 12 08332 g010
Figure 11. Results of the dynamic flow test. The green curve shows the (predefined) flow rate of the Cetoni pump, the blue curve, the measured data from the Sensirion flow meter (DUT) and the red curve, the flow rate of the scale converted from the mass data.
Applsci 12 08332 g011
Figure 12. Capillary tubes of length 300 m m and 50 m m with matching holders used for viscosity measurements at RISE.
Applsci 12 08332 g012
Figure 13. Determination of the dynamic viscosity for a solution by measuring the pressure loss over a capillary tube at different flow rates. The blue curve shows the pressure at the inlet of the capillary tube (upstream pressure) and the red curve, the pressure at the outlet of the capillary tube (downstream pressure). The pressure at the outlet side is set to 0.20 bar by means of a needle valve regardless of the selected flow rate. This value was also one of the calibration points for the pressure sensor.
Applsci 12 08332 g013
Table 1. Comparison of the two ultra-high precision syringe pumps used as flow generators.
Chemyx Nexus 3000Cetoni neMESYS 290N
Drive mechanismStepper motorStepper motor
Step resolution 0.0120 microns 0.0168 microns
(Advance per step)
Flow rate range 0.012 nL min 1 to 500 m L min 1 0.006 nL min 1 (10 μL syringe) to
(manufacturer information)150 m L min 1 (50 m L syringe)
with gear box 29:1
Syringe size140 m L ; 300 m L (with self-made50 m L (largest manufacturer
holder)holder)
No. of syringes21 (multi-systems available)
Readout / handlingConfiguration of the initialConfiguration of the initial
values (pump and syringe) viavalues (pump and syringe)
keypad or software.exclusively via software. Output
Information during operationof the (current) readings via
only via display.software and in a later log file.
Table 2. Expanded measurement uncertainty U ( k = 2 ) of the Nanoflow test facility at different flow rates.
Measurement
Flow RateUncertainty
U ( k = 2 )
5 n L min 1 5.0 %
20 n L min 1 2.5 %
100 n L min 1 1.0 %
greater than or 0.5 %
equal to 500 n L min 1
Table 3. Investigated dynamic flow profile containing step changes in flow rate.
Start TimeMeasuring PeriodVolume FlowVolumeAccumulated
sminnL min 1 μ LVolume μ L
03010003030
303020006090
6030250075165
9030150045210
1203050015225
15030100030255
Publisher’s Note: MDPI stays neutral with regard to jurisdictional claims in published maps and institutional affiliations.

