Article

Solving the Moment Amplification Factor of a Lateral Jet by the Unsteady Motion Experimental Method

1
China Academy of Aerospace Aerodynamics, Beijing 100074, China
2
Bejing Institute of Astronautical Systems Engineering, Beijing 100076, China
3
China Academy of Launch Vehicle Technology, Beijing 100076, China
*
Author to whom correspondence should be addressed.
Appl. Sci. 2022, 12(16), 8387; https://doi.org/10.3390/app12168387
Submission received: 15 June 2022 / Revised: 4 August 2022 / Accepted: 17 August 2022 / Published: 22 August 2022

Abstract

:
In this paper, unsteady motion tests of a lateral jet adjusting an air vehicle’s attitude are carried out. Curves of pitch moment amplification factors (KM) for a lateral jet versus angle of attack (α) are obtained using a wind tunnel free-flight test technique with a jet and data processing method. This new method overcomes the disadvantage of previous experiments that can study only one unsteady characteristic. The free-flight test technique in the proposed method ensures that the test model can be coupled in real-time with multiple parameters (unsteady flow caused by the jet, unsteady air vehicle aerodynamic force, and unsteady air vehicle motion). This approach simulates an actual air vehicle’s complete jet test process and ensures more authentic and reliable test results. In the new data processing method, continuous data curves are fitted to discrete data points, making it easier to convert the angular displacement versus time curve into the pitch moment versus α curve to obtain KM. The results show that when the pressure of the micro high-pressure gas cylinder is 2.0 MPa, KM is below 1, indicating that the lateral jet does not significantly promote the pitching moment. When the gas cylinder pressure is 4.0 MPa and the angle of attack is 5° < |α| < 16°, KM is greater than 1, and the lateral jet promotes the pitching moment. When 16° < |α| < 20°, KM is less than 1, and the lateral jet does not significantly contribute to the pitching moment. It was further found that KM decreases slowly with increasing α. When |α| > 30°, the influence of the jet on the pitching moment nearly disappears.

1. Introduction

Aerospace vehicles are continually being developed to reach higher speeds and altitudes. Jets provide control forces and have the advantages of simple structure, no influence on the aerodynamic shape, and short response times [1,2]. Moreover, lateral jet control can effectively prevent the adverse effects of local aerodynamic heating of an air vehicle at hypersonic conditions. Compared with the conventional control rudder, an air vehicle using a lateral jet as the reaction control system can still maintain high maneuverability and low response time even in the low-density or low-speed region [3,4,5]. The lateral jet control technique has been applied in many air vehicles because of its good comprehensive performance. At the same time, the amplification factors are important indexes used to evaluate the jet effect and are a key area of jet research.
Scientists have performed significant research on jet control. Hu and Lee [6] conducted a numerical analysis of supersonic lateral jets on a generic missile and a flat plate and verified the results using wind tunnel test data from the perspective of the vortex structure. Zhu et al. [7] proposed a new combined spike–aerodrome and lateral jet strategy for thermal protection and drag reduction. Numerical studies were performed on the hypersonic flow characteristics and structure thermal response. Min et al. [8] studied the supersonic flow around a laterally jet-controlled missile. The case studies covered various jet flow conditions, including jet Mach numbers, jet pressures, and circumferential jet positions. They also compared the normal force and moment distribution in each region. Luo et al. [9] performed wind tunnel testing for a novel supersonic fluidic oscillator to study its characteristics and the conditions for jet oscillation. The experimental results showed that periodic asymmetrical flipping of the supersonic jet appears at certain nozzle pressure ratios.
Meng et al. [10] demonstrated code rationality using experimental results. Comprehensive analyses were conducted on the influences of heat reduction performance and the lateral jet pressure ratio, spike length ratio, and lateral jet location on the drag. Christie [11] compared the numerical results of a flat plate and a missile with four turbulence models. DeSpirito [12] used nine turbulence models derived from standard one- and two-equation models to compare the jet interactions of cold air, hot air, and hot gas jet cases. The jet interactions of a generic missile at several jet conditions were investigated, and the effects of flux functions were compared in a previous numerical study [13].
Brandeis and Gill [14] investigated jet interaction on configurations with lifting surfaces. Under certain circumstances, the presence of the surfaces resulted in large force or moment amplification because of the interaction of the jet-induced flow field with the planar surfaces. The interaction between a lateral jet and the external flow for various missile body geometries was investigated by Graham et al. [15]. In several circumstances, lifting surfaces led to force or moment amplification of the jet interaction with the missile surfaces. Wang and Wu [16] studied the dynamic stall control of a pitching NACA 0012 airfoil. A synthetic jet in a low Reynolds number compressible flow was used to improve its aerodynamic performance.
In a particularly relevant study, Lai et al. [17] numerically studied motion-induced unsteady effects on transverse jet interaction. The potential effects were evaluated by choosing forced oscillation and free-response motion. According to the study, forced pitch oscillation data show negative interaction force amplification factors at a certain angle of attack, while interaction moment amplification factors indicate a pronounced decrease at a relatively high angle of attack.
Researchers have conducted many wind tunnel tests and numerical simulations for jet problems, accumulated rich research experience, and played a guiding role in aircraft design. In addition to the above research on the impact of jets on air vehicles, leading universities have also conducted relevant research on jets. However, these universities focus more on the research aspects and frontiers of jet mechanisms. Research on the impact of jets on air vehicles, including air vehicle motion and aerodynamics, is generally lacking.
Representative research from each leading university is as follows. At the University of Manchester, Xia and Zhong [18] studied the mixing between two liquid flows with the same velocity in a plane mixing channel enhanced by three lateral synthetic jet pairs. The synthetic jet pair operates 180° out of phase and within a specific driving frequency and displacement range. Fairweather et al. [19] at Imperial College proposed the application of a finite difference scheme to solve the hydrodynamic elliptic flow equations for the problem of vertical discharge of a turbulent reactive jet into an unconfined cross flow.
At Nagoya University, Watanabe et al. [20] used direct numerical simulation (DNS) to simulate the time evolution of a plane jet and a turbulent boundary layer by implicit large-eddy simulation (ILES). A plane jet and boundary layer ILES/DNS hybrid method was tested by comparing the results with the complete DNS from the initial laminar flow. At Nagoya University, the utility of the dielectric jet barrier controller was studied by Kozato et al. [21]. A rectangular nozzle (75 × 10 mm) was used with an actuator placed on the longer side of the nozzle outlet. By changing the modulation frequency, duty cycle, and phase difference, unsteady driving of the actuator is realized. Gröschel et al. [22] at the University of Poitiers used computational aeroacoustics to simulate a cold single flow jet at a Mach number of 0.9. Two mixed methods are used to calculate the jet sound field. Large-eddy simulation could be used for the jet flow domain to reduce computational costs. The primary source of cold jet noise in the acoustic perturbation equations system was shown to be the Lamb vector.
However, the purpose of the jet is to make the air vehicle move, and the vehicle’s movement inevitably leads to unsteady changes in the flow field and aerodynamic forces, which in turn lead to further movement of the air vehicle. A force analysis shows that when the air vehicle is flying, it activates the jet control in a relatively balanced state. Five action processes corresponding to ①–⑤ in Figure 1 can be identified by analyzing the jet process. These five processes can be summarized as follows: ① The injection of jet gas causes the variation of the flow field around the air vehicle. Because the flow field is not immediately stable, the flow field around the nozzle must be unsteady for a short time. ② The direct jet force acts on the air vehicle, and breaking its original force balance makes the air vehicle move differently. Because the direct jet force and the change in the flow caused by the jet occur simultaneously, the air vehicle begins to move (including linear motion and angular motion) before the flow is stable. In particular, the change in angle further changes the flow and produces unsteady flow. ③ When the flow around the air vehicle changes, it causes the aerodynamic forces on the air vehicle to change. ④ The original force balance state of the air vehicle is further broken, which again changes the air vehicle motion, including linear and angular motion. ⑤ The air vehicle angular displacement change further changes the flow field.
In summary, the changes in the flow field at the nozzle, the aerodynamic forces on the air vehicle, and the air vehicle motion occur simultaneously. The actual jet process is coupled with various unsteady factors. Past research on jets has been mainly limited to unsteady flow field and unsteady aerodynamics research, while research on the motion caused by the jet is scarce. Using this traditional research approach, in which only the unsteady characteristics of a specific parameter can be studied, must result in differences between the lateral jet influence factors obtained and the actual air vehicle, leading to inaccuracies in the interference factors measured in the pressure test. In the published literature, there is no relevant research on the unsteady flow field coupling characteristics, aerodynamic forces, and unsteady motion caused by the jet, and test methods using unsteady coupling to measure the interference factor are rare. This existing approach produces inadequate research results, and there are knowledge gaps regarding the unsteady coupling effect on actual air vehicle jets.
The wind tunnel free flight test technique is a common research approach to understanding the unsteady characteristics of an air vehicle and differs from other steady (force measurement after model support) and capture trajectory simulation (CTS) methods. It has the unique advantage of no support interference. The test uses high-speed photography and the curves of the six-degrees-of-freedom parameters of the air vehicle model with time can be acquired. Later, the dynamic aerodynamic parameters of the air vehicle can be obtained through data processing. In recent years, Xue et al. [23,24,25,26] have greatly improved the former wind tunnel free-flight test technique and test theory, expanding the research scope and ensuring its accuracy. Meanwhile, Xue et al. [27,28] also conducted exploratory research on jet characteristics.
Model free-flight wind tunnel and traditional jet control test methods each have certain advantages. If these two approaches could be combined and the wind tunnel free-flight test method used to study the KM, the jet’s action could be better understood, resulting in more accurate KM values. For the study of the jet’s influence on the air vehicle, the wind tunnel free-flight test technology is different from previous methods. For example, in Refs. [9,10,17], the air vehicle’s tail is equipped with support rods during the wind tunnel test, preventing the motion of the air vehicle model by the jet force. Each test can only calculate the jet force in a single state or obtain the jet flow field diagram of a single test and is inadequate to produce coupling results and the data shown in Figure 1.
By contrast, the approach explored in this paper uses a wind tunnel and an unsupported free-flight test model with a jet, and the jet force can act on the air vehicle model in real time. Through later data processing, the aerodynamic forces on the air vehicle at different angles of attack can be obtained. The wind tunnel test also uses high-speed photography to capture the interaction between the jet and the external flow field at different angles of attack to fully realize the effects shown in Figure 1. This method ensures that the wind tunnel test is consistent with actual flight conditions. The results of more than a dozen wind tunnel tests in the past are obtained using one test.
The research content of this paper is as follows. For the lateral jet attitude control, KM is obtained. The specific method uses a more realistic six-degrees-of-freedom unsteady test research method employing a wind tunnel free-flight test technique. The air vehicle’s corresponding angular displacement time history is obtained in a completely free state. By deriving a continuous curve and combining the model parameters, the pitching moment of the air vehicle is obtained for different parameter values. Then, according to the jet pitching moment of the air vehicle without wind tunnel airflow, the KM under unsteady conditions is finally obtained. The problem of the error caused by measuring KM using the previous steady test method is avoided to obtain more realistic KM values.

2. Test Model and FD-12 Wind Tunnel

2.1. Test Model

A special rudderless and wingless revolution body is used to test the influence of the lateral jet on the air vehicle moment, as shown schematically in Figure 2. The actual test model, with an overall length of 167 mm, is shown in Figure 3. A high-pressure cylinder (70 mm long) is installed inside the model. The inertia of the model mass in the pitching direction is 6.15 × 10⁻⁴ kg-m2. The reference length is the rear diameter of the revolution body, which is 29 mm. The center of mass is 81.6 mm from the head.
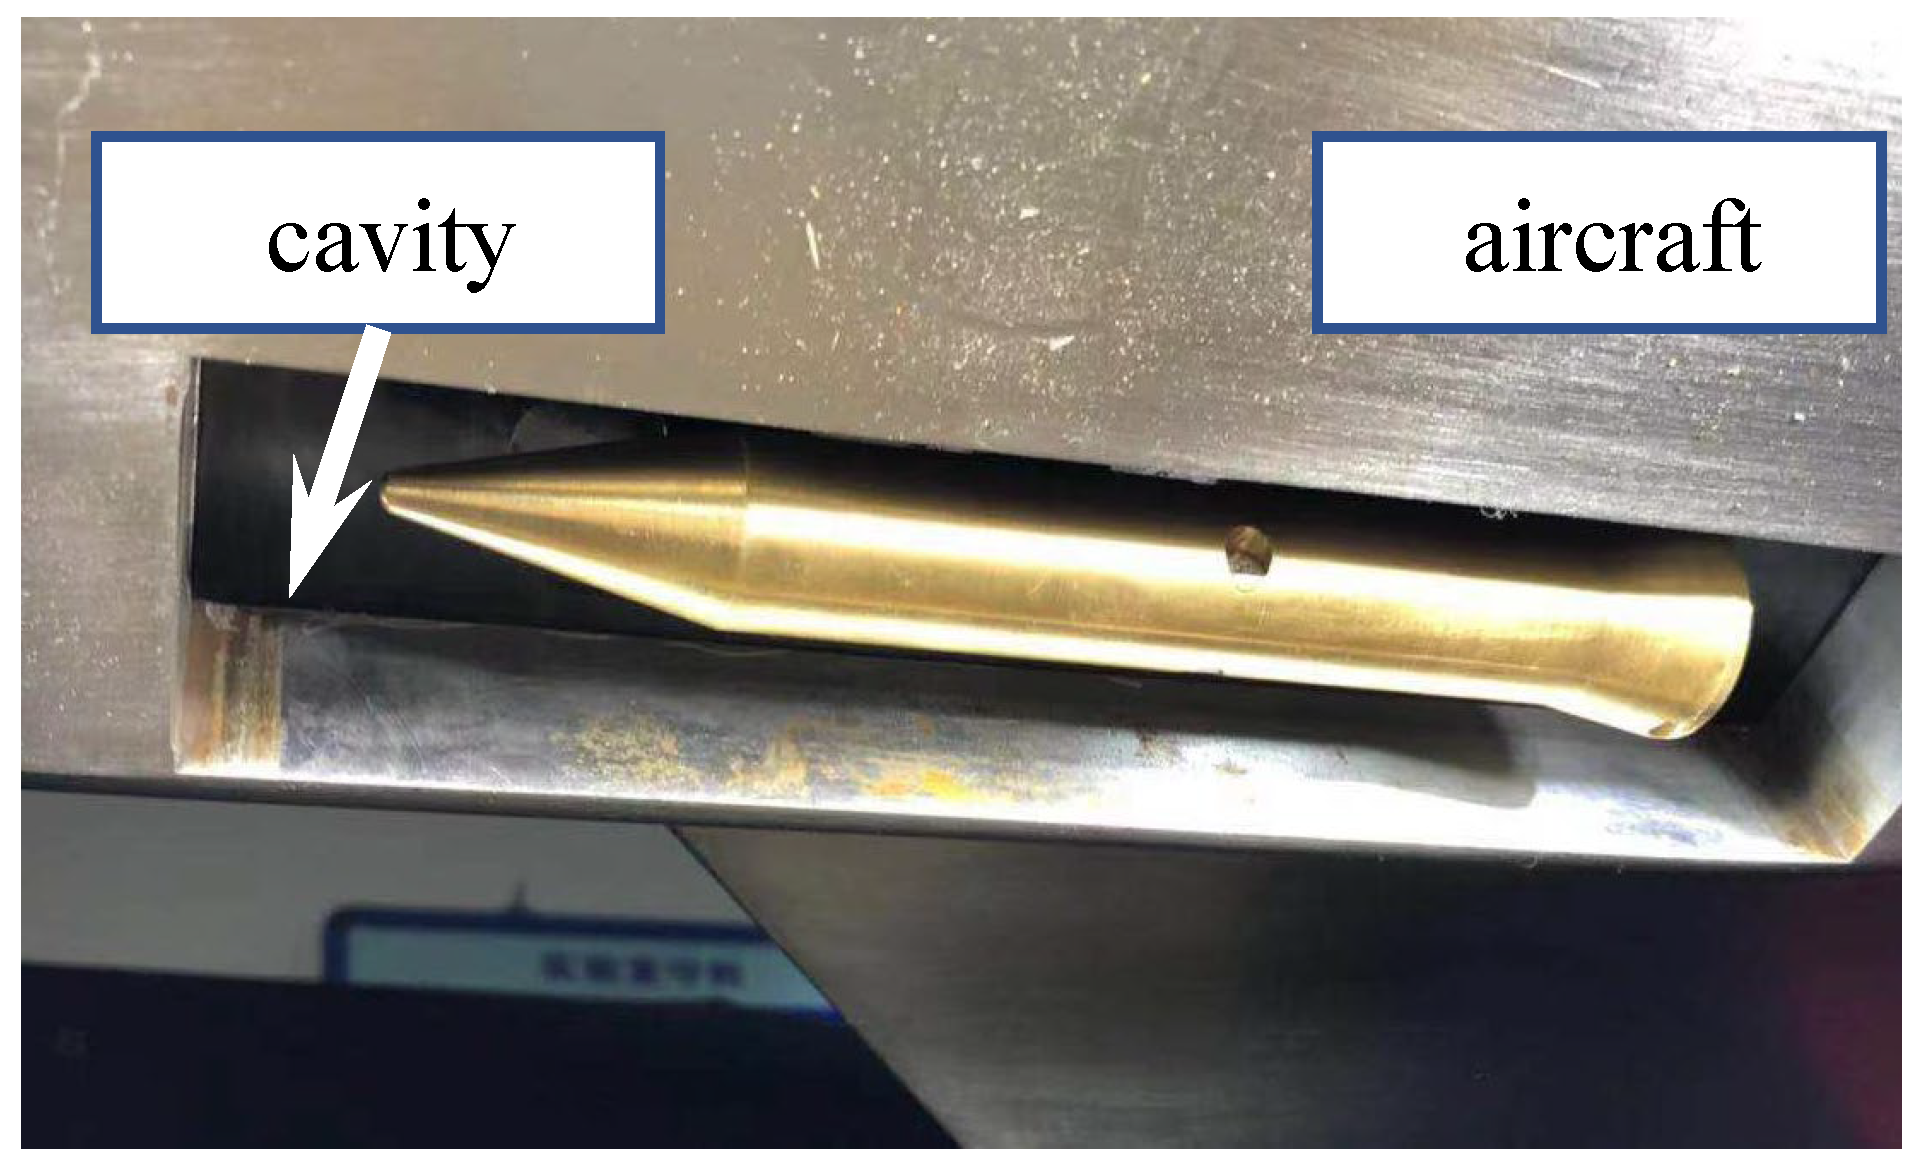
It is well known that the flow pressure is large during the wind tunnel test, and there is strong turbulence during wind tunnel operation. The test model and device are installed in a cavity to avoid damage to the test device and model by turbulence, as shown in Figure 4.
The cavity is beneficial to the test, but the cavity also produces an additional force on the revolution body, which may affect the subsequent data analysis. Two remedial measures are taken in this study to reduce the influence of the cavity on the test body. First, the mass and inertia of the experimental model are increased to improve the anti-interference ability of the revolution body experimental model. Second, data far from the cavity are used to make the data processing results more realistic and further weaken the cavity’s influence on the attitude of the revolution body. In addition, the experimental Mach number is M = 0.6, which ensures that the flow is compressible and that there is no shock wave, which can further weaken the influence of the cavity on the attitude of the revolution body.

2.2. Jet Characteristics

As shown in Figure 5, the model is fixed on the test bench, and particle image velocimetry (PIV) is used to measure the model nozzle velocity. In Figure 4, when the total pressure in the high-pressure cylinder exceeds 2.0 MPa, the outlet gas flow can become supersonic. The camera used in this system is the MegaPlus II ES4020 camera with a pixel resolution of 2048 (H) × 2048 (V), 12-bit gray resolution, and an electronic shutter. The shortest time between two frames is 200 ns.

2.3. FD-12 Wind Tunnel

The FD-12 wind tunnel is a subsonic, transonic, and supersonic three-speed wind tunnel at the China Academy of Aerospace Aerodynamics, with a Mach number range of 0.3–4.0, a Mach number adjustment accuracy of 0.004, and a 1.2 × 1.2 × 3.8 m test section. The Mach number used in this test is 0.6, for the reasons described earlier. The parameters of the FD-12 wind tunnel are shown in Table 1.
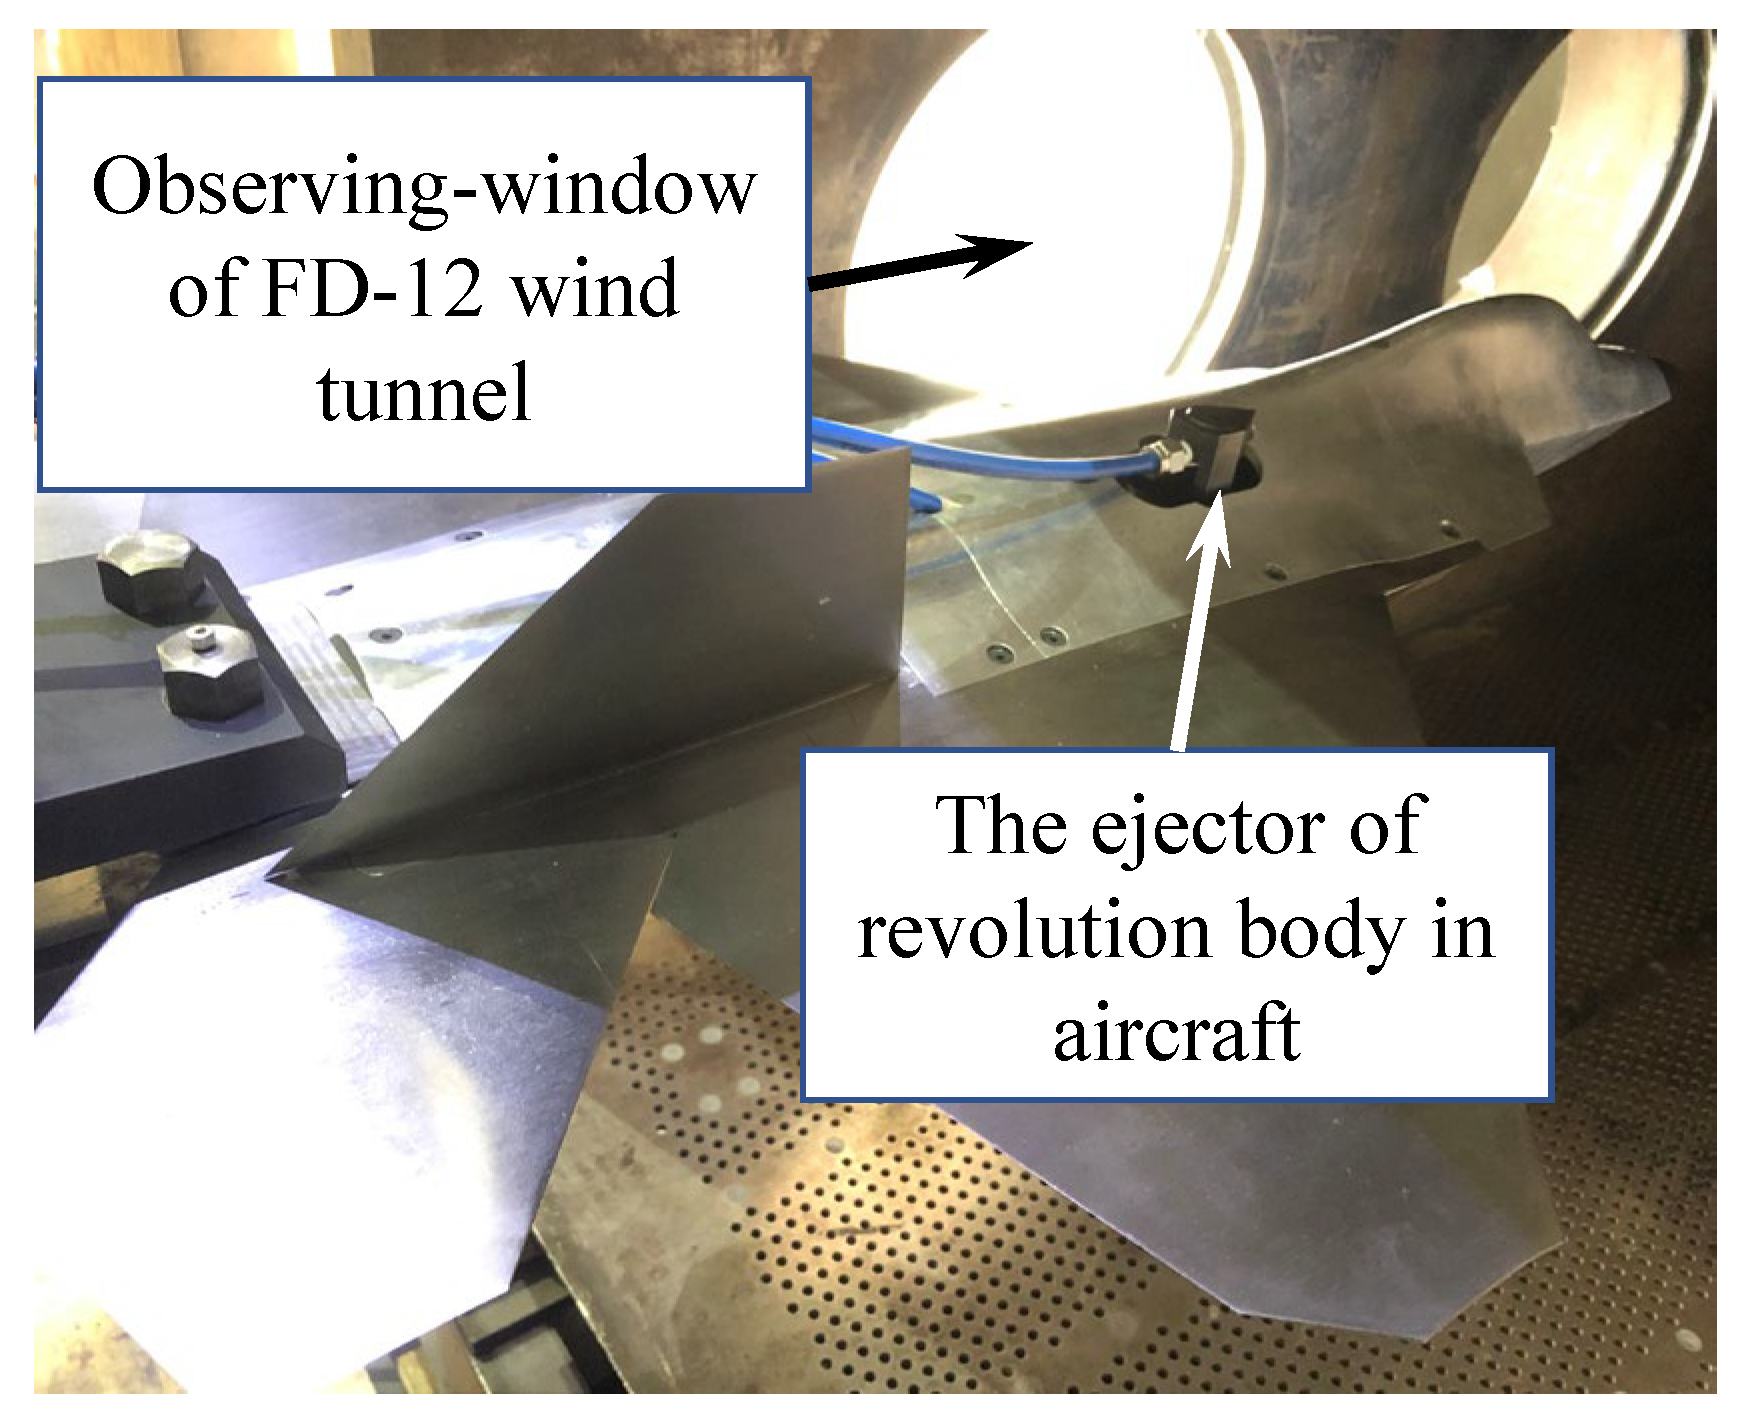
Figure 6 shows a picture of the test aircraft installed in the wind tunnel. The release mechanism of the revolution body is installed inside the aircraft. The revolution body is quickly launched into the flow field using an ejection mechanism, causing it to quickly move away from the aircraft to reach a cleaner flow field area. There is no additional reason for using the aircraft shape to release the revolution body here, but we wished to find a release mechanism with less impact on the flow field, and the initial position is near the observation window, which is convenient for the high-speed photography. We plan to consider installing the ejection mechanism outside the flow field for future wind tunnel tests to further reduce interference.

3. Tests and Results

3.1. Tests without Wind Tunnel Airflow

Compared with the real tests, the tests described in this section only lack an external flow field. Three tests were conducted: jet with 2.0 MPa cylinder pressure, jet with 4.0 MPa cylinder pressure, and with the jet off. This test uses high-speed photography at 2000 Hz with an auxiliary light source for visualization.
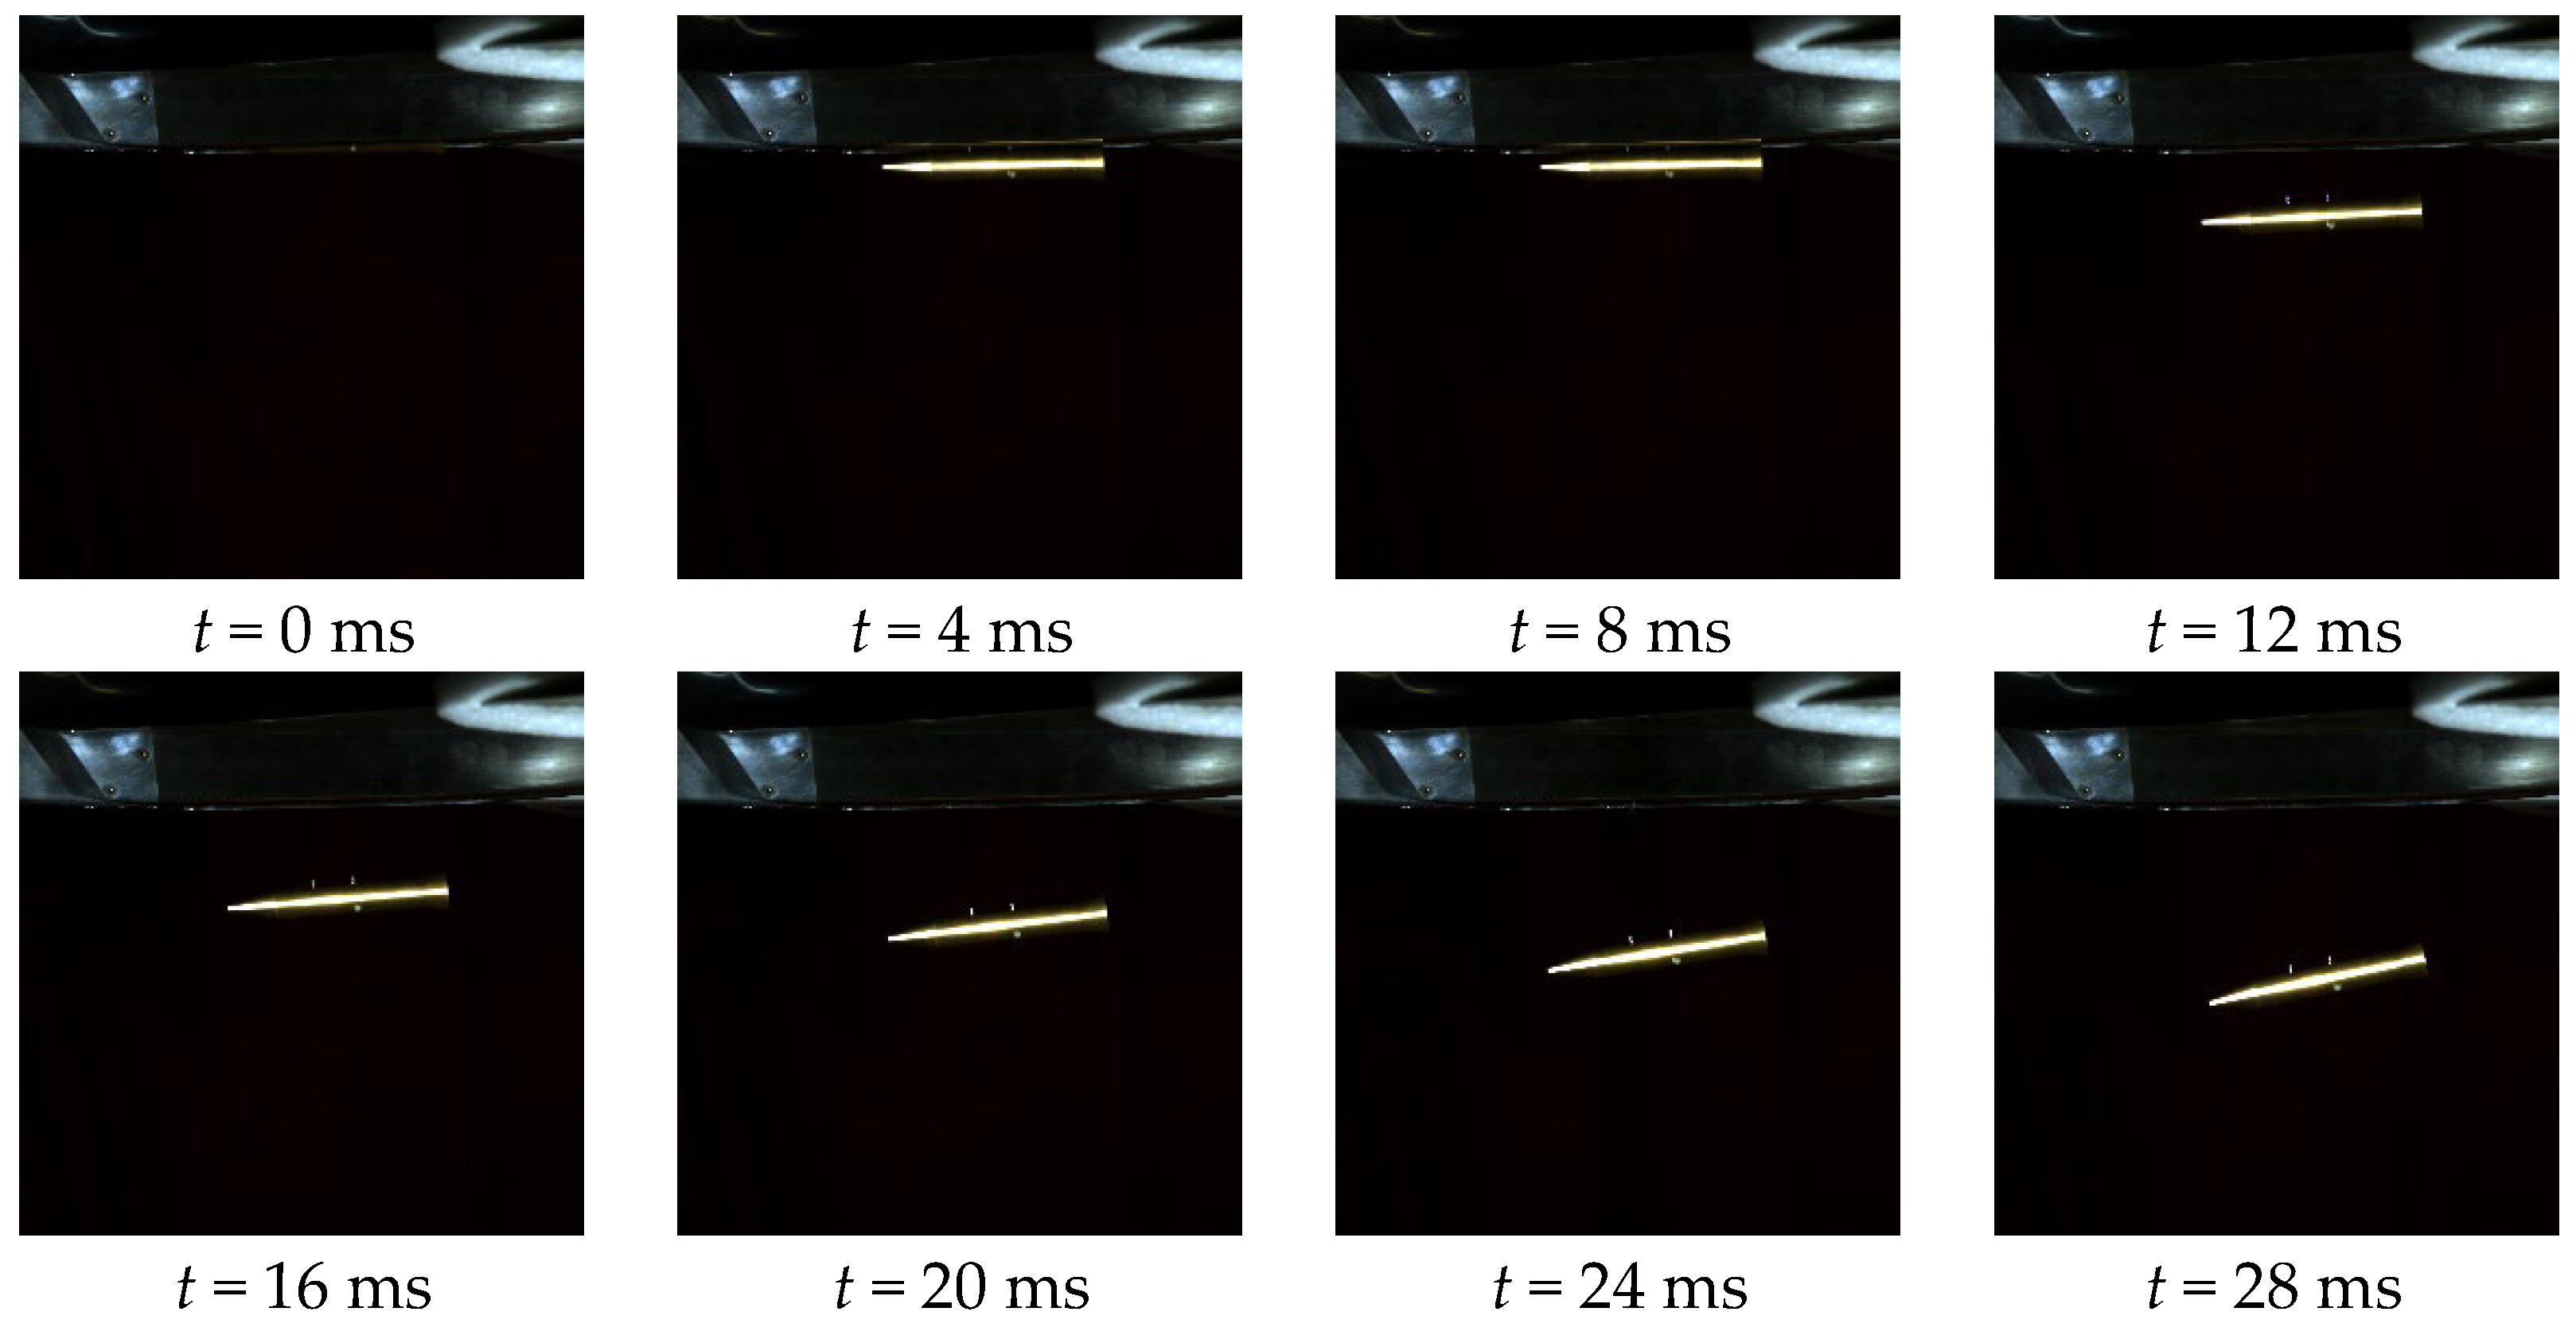
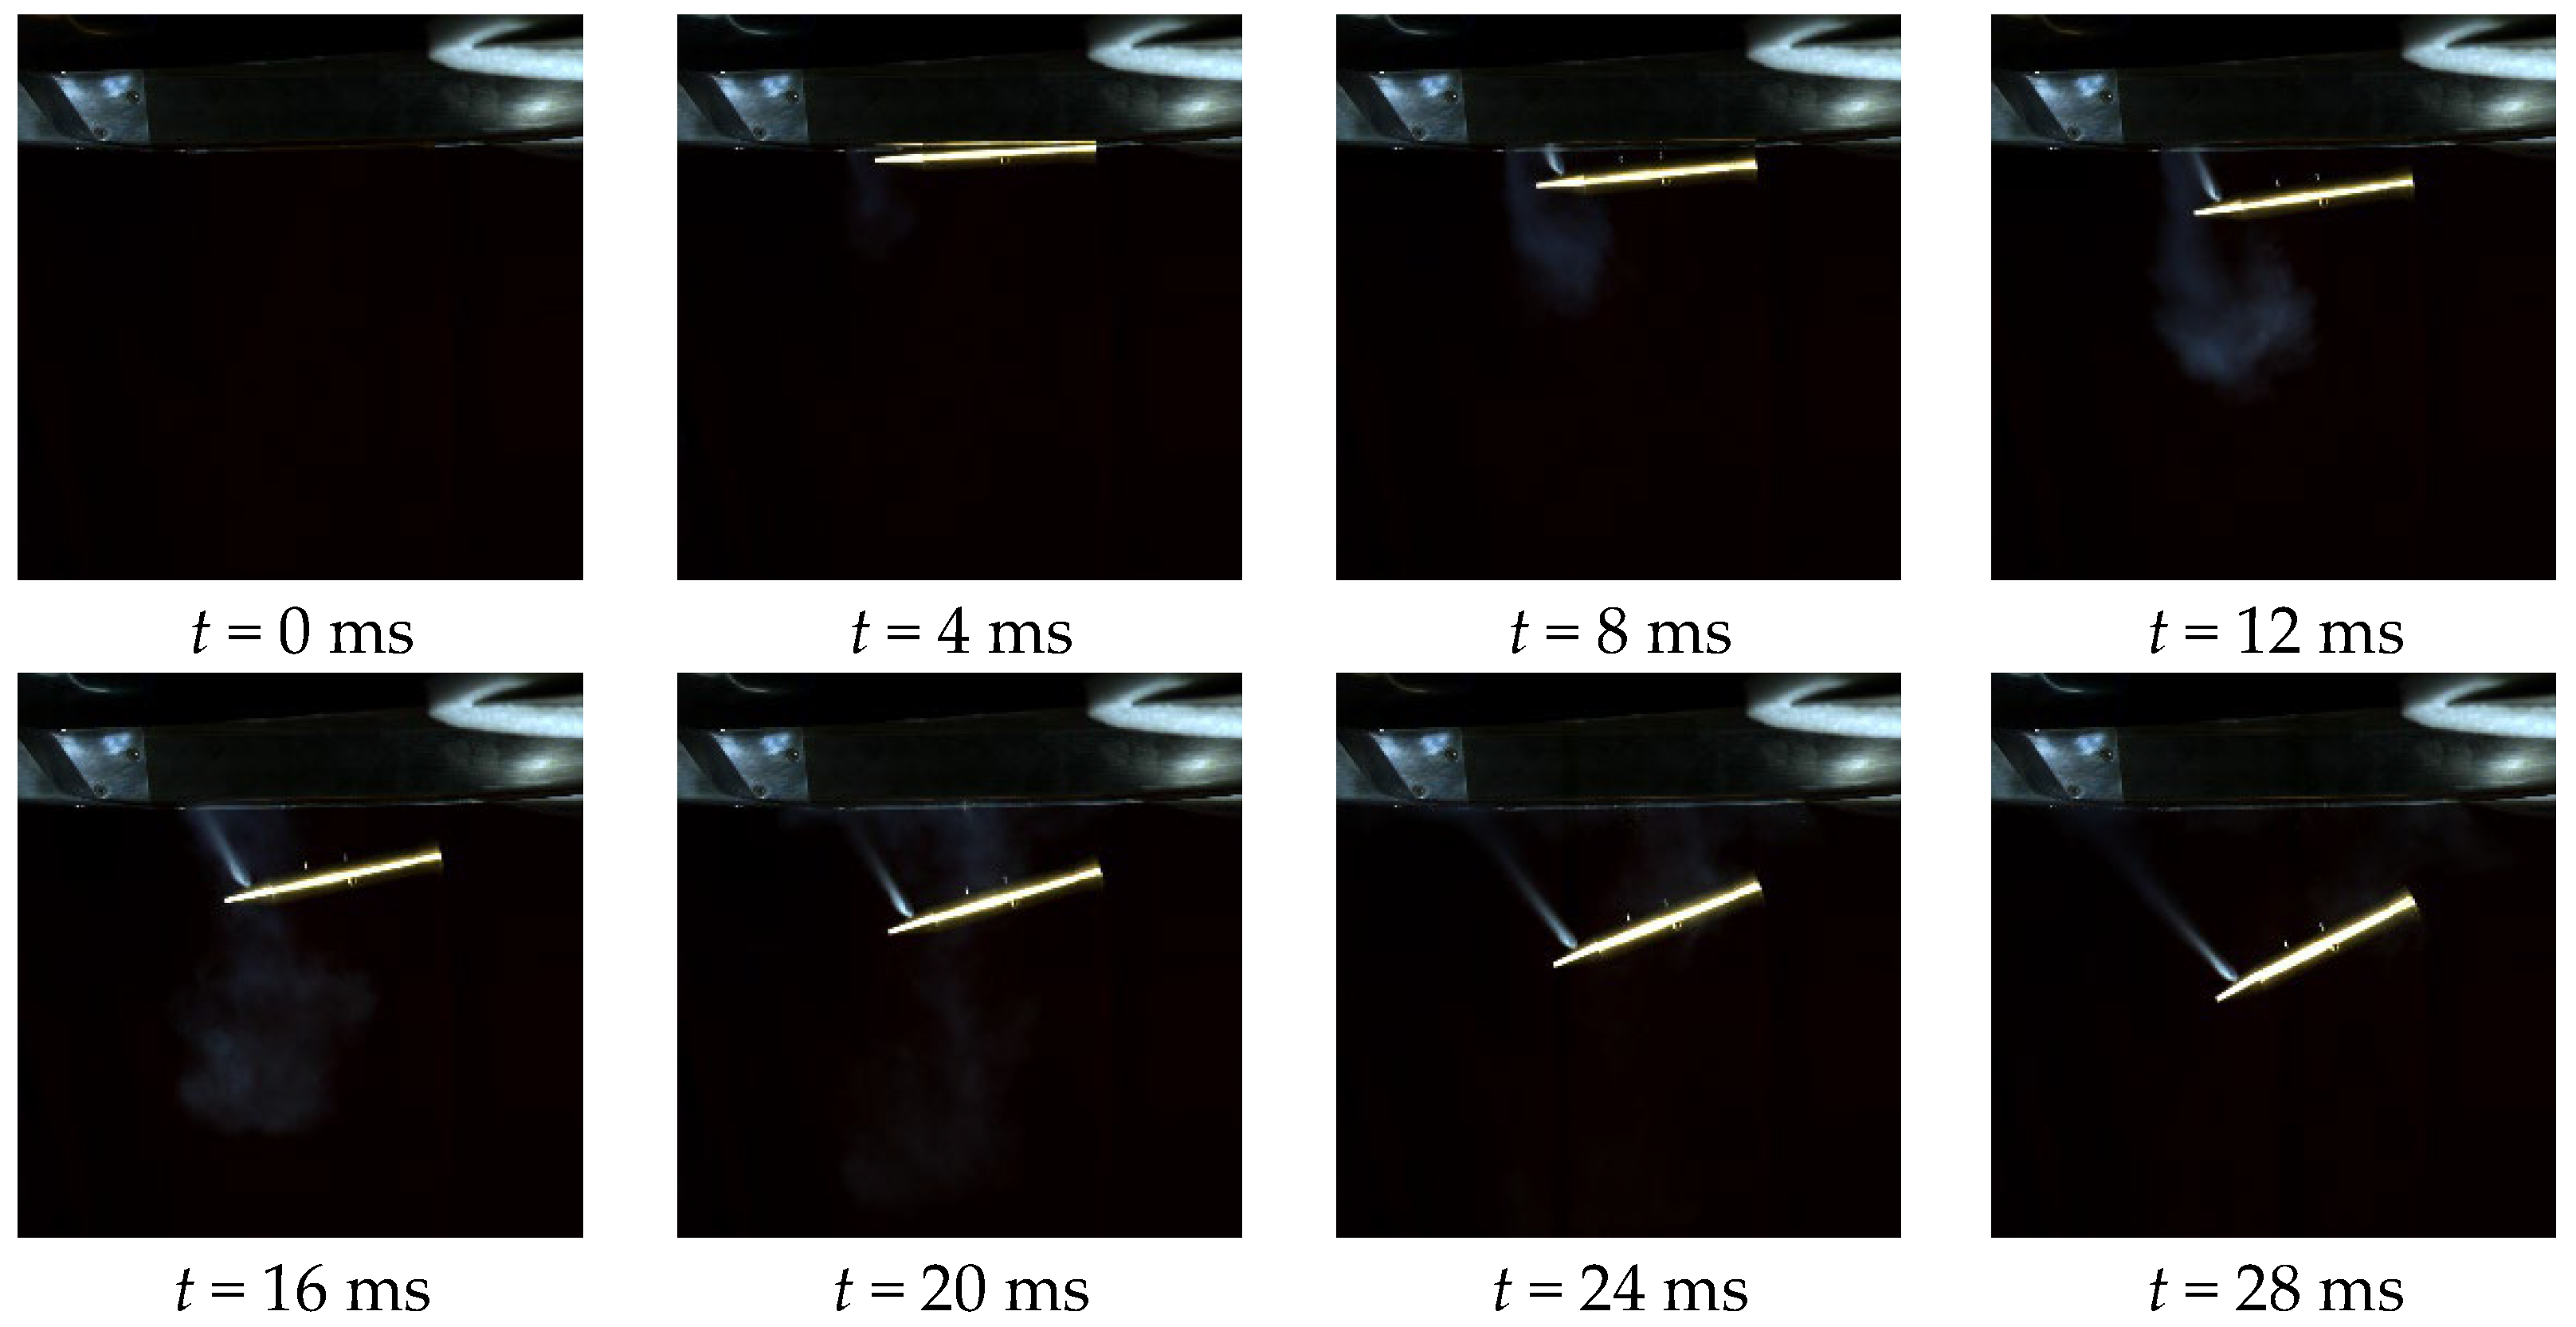
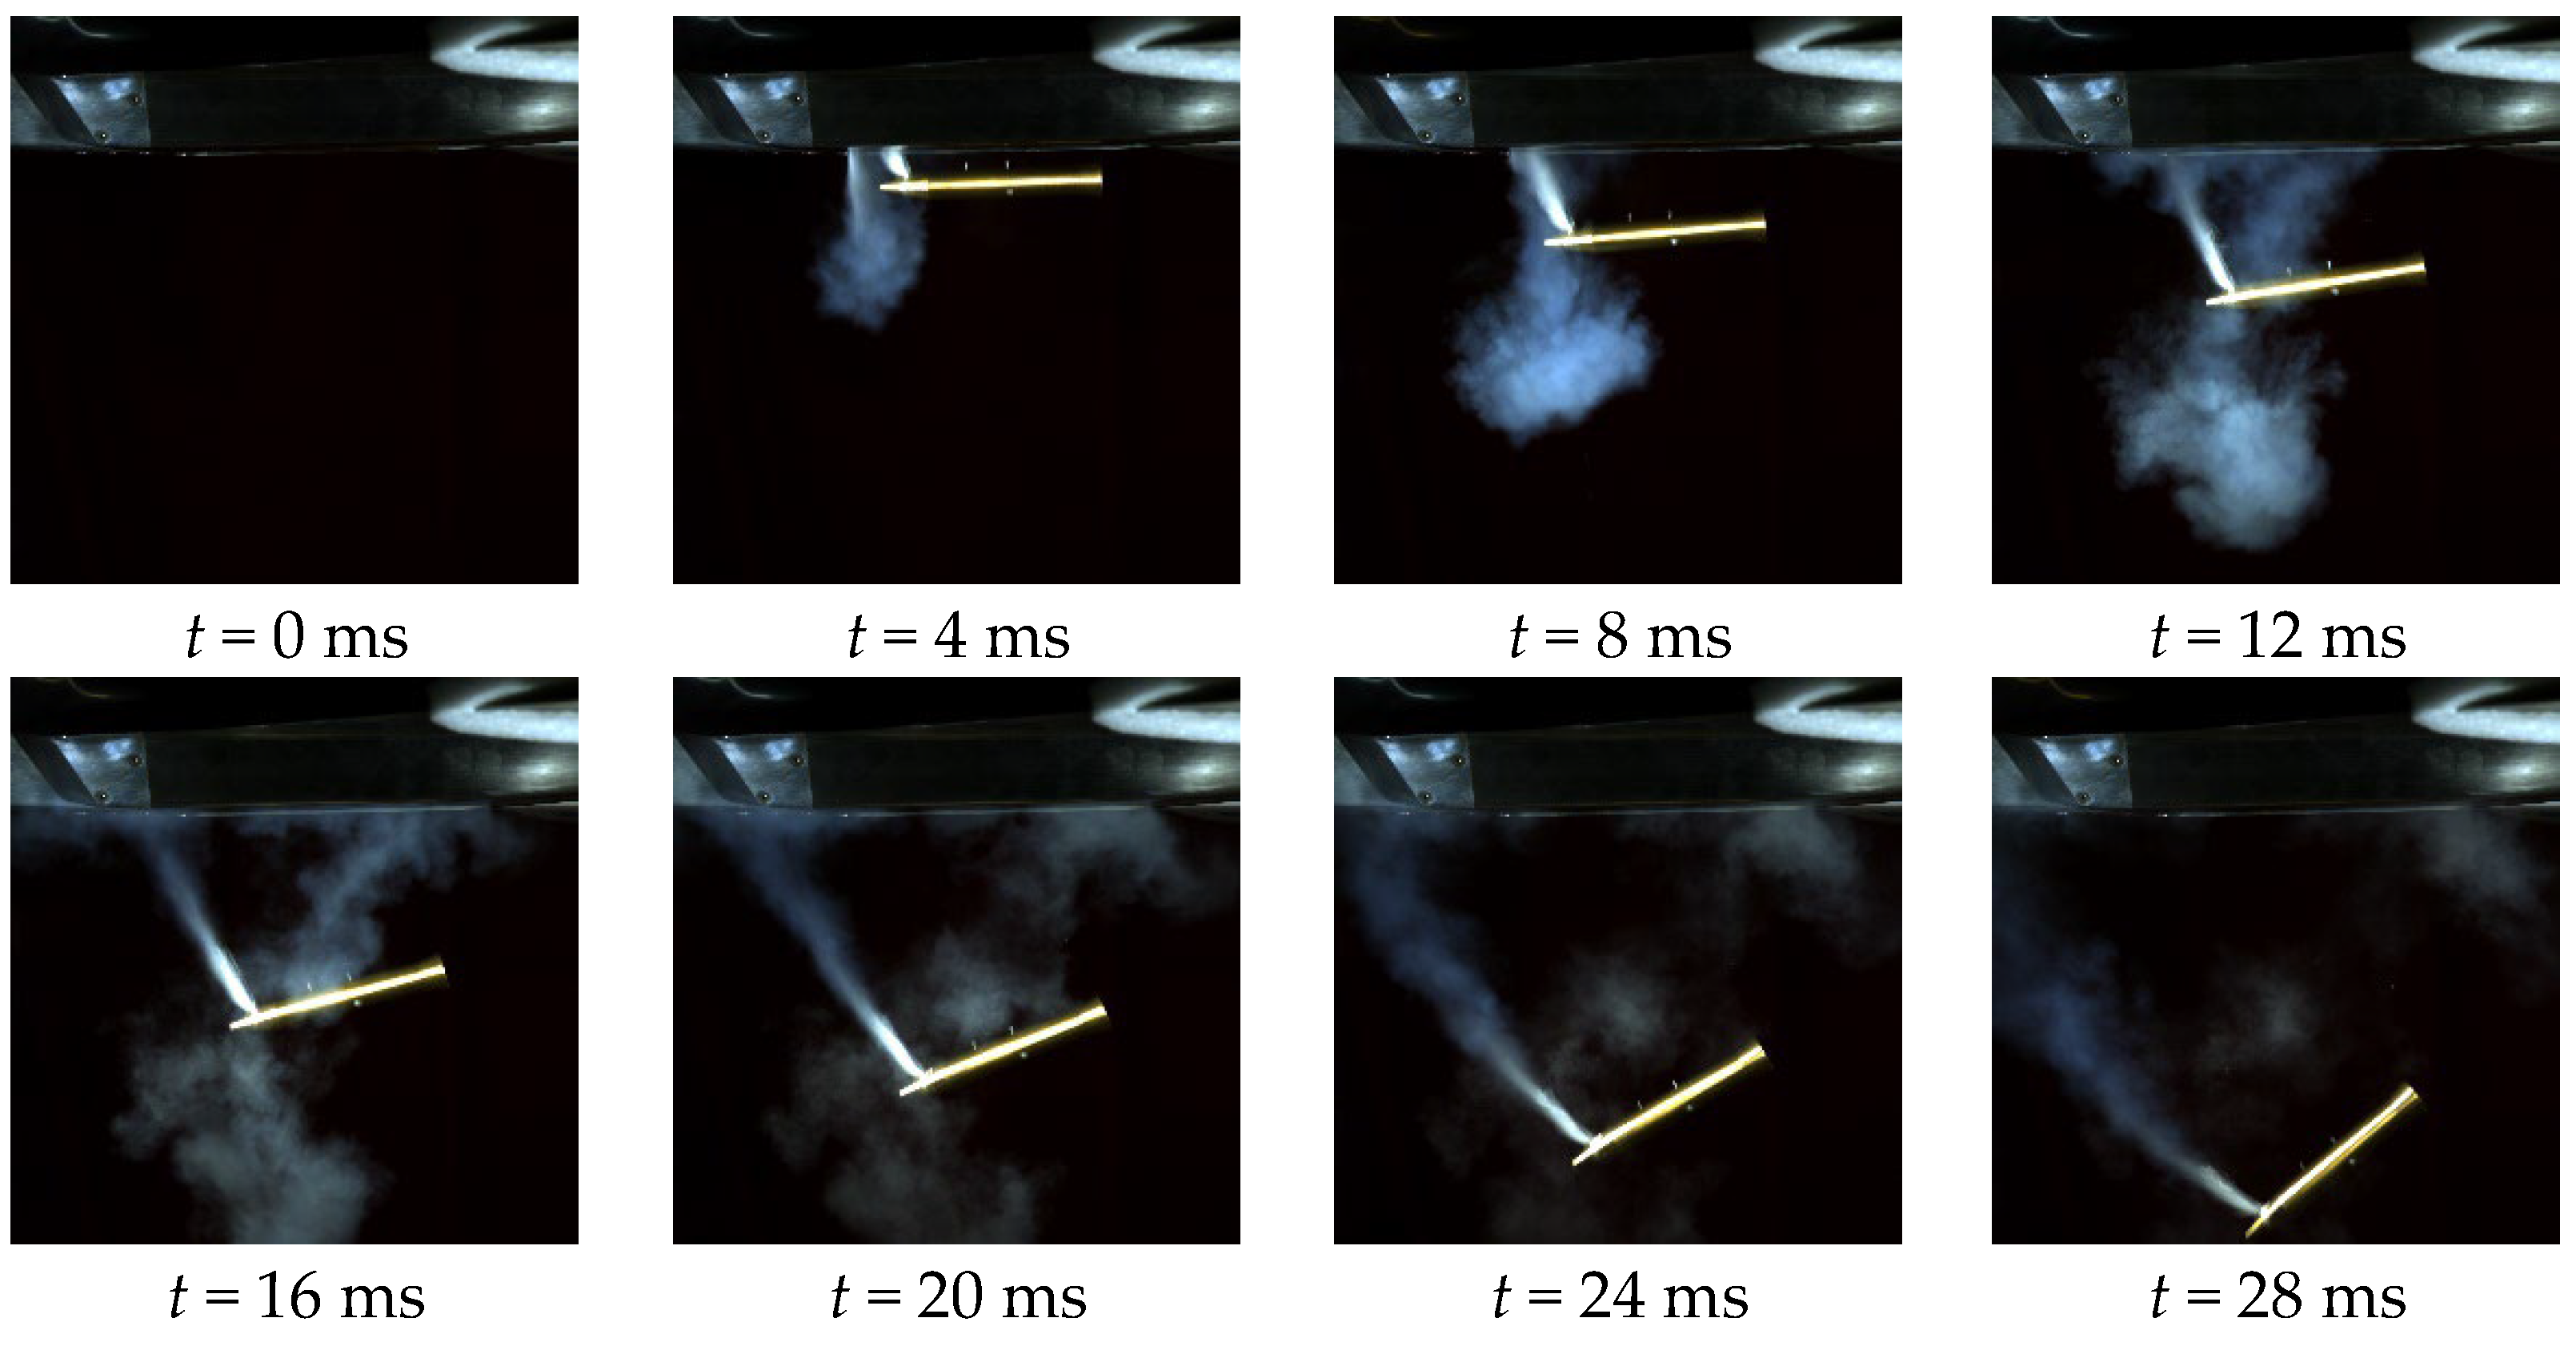
In Figure 7, the revolution body model slowly lowers its bow with no jet or wind. When the revolution body model is free with a 2.0 MPa cylinder pressure jet, as shown in Figure 8, the jet can turn the model over.
In Figure 9, the black curve is without a jet, the blue curve is for a 2.0 MPa jet, and the red curve is for a 4.0 MPa. The angle of attack of the revolution body is α, which is positive when the revolution body head rises. The values in Figure 9 show that the 2.0 MPa jet makes the revolution body turn over more quickly than when the jet is off. At a 4.0 MPa cylinder pressure, the jet can turn the model over even faster.
Figure 10 shows the results for a 4.0 MPa jet with no wind. By processing the pictures in Figure 7, Figure 8 and Figure 10, discrete data for the model’s angle of attack with time under different conditions were obtained (Figure 9). The discrete data points shown in Figure 9 are then fit to obtain equations for the angle of attack versus time [29,30]. After obtaining these equations, the angular acceleration of the revolution body with time can be computed by taking the second time derivative of the pitch angle. The pitch moment Mz of the revolution body can then be calculated by combining the angular acceleration with the pitch inertia of the revolution body, where the moment is positive when it raises the bow of the revolution body. Thus, the variation of the revolution body’s pitching moment with angle of attack is obtained, as shown in Figure 11.
As mentioned earlier, the data at a certain distance from the revolution body are used to minimize the force influence of the cavity on the revolution body, which corresponds to the data for |α| > 5°. At the same time,|α| < 25° is required to reduce the influence of the large angle of attack effect of the revolution body. Therefore, the data shown in Figure 11 span the range 5° < |α| < 25°.
The feasibility of the newly established test technique is verified from the above three tests without wind, shown in Figure 11. This ensures that the wind tunnel test model can carry out the jet test under completely free conditions, meeting the design requirements. At the same time, it also demonstrates the jet’s ability to change the model’s attitude.

3.2. Wind Tunnel Tests without a Jet

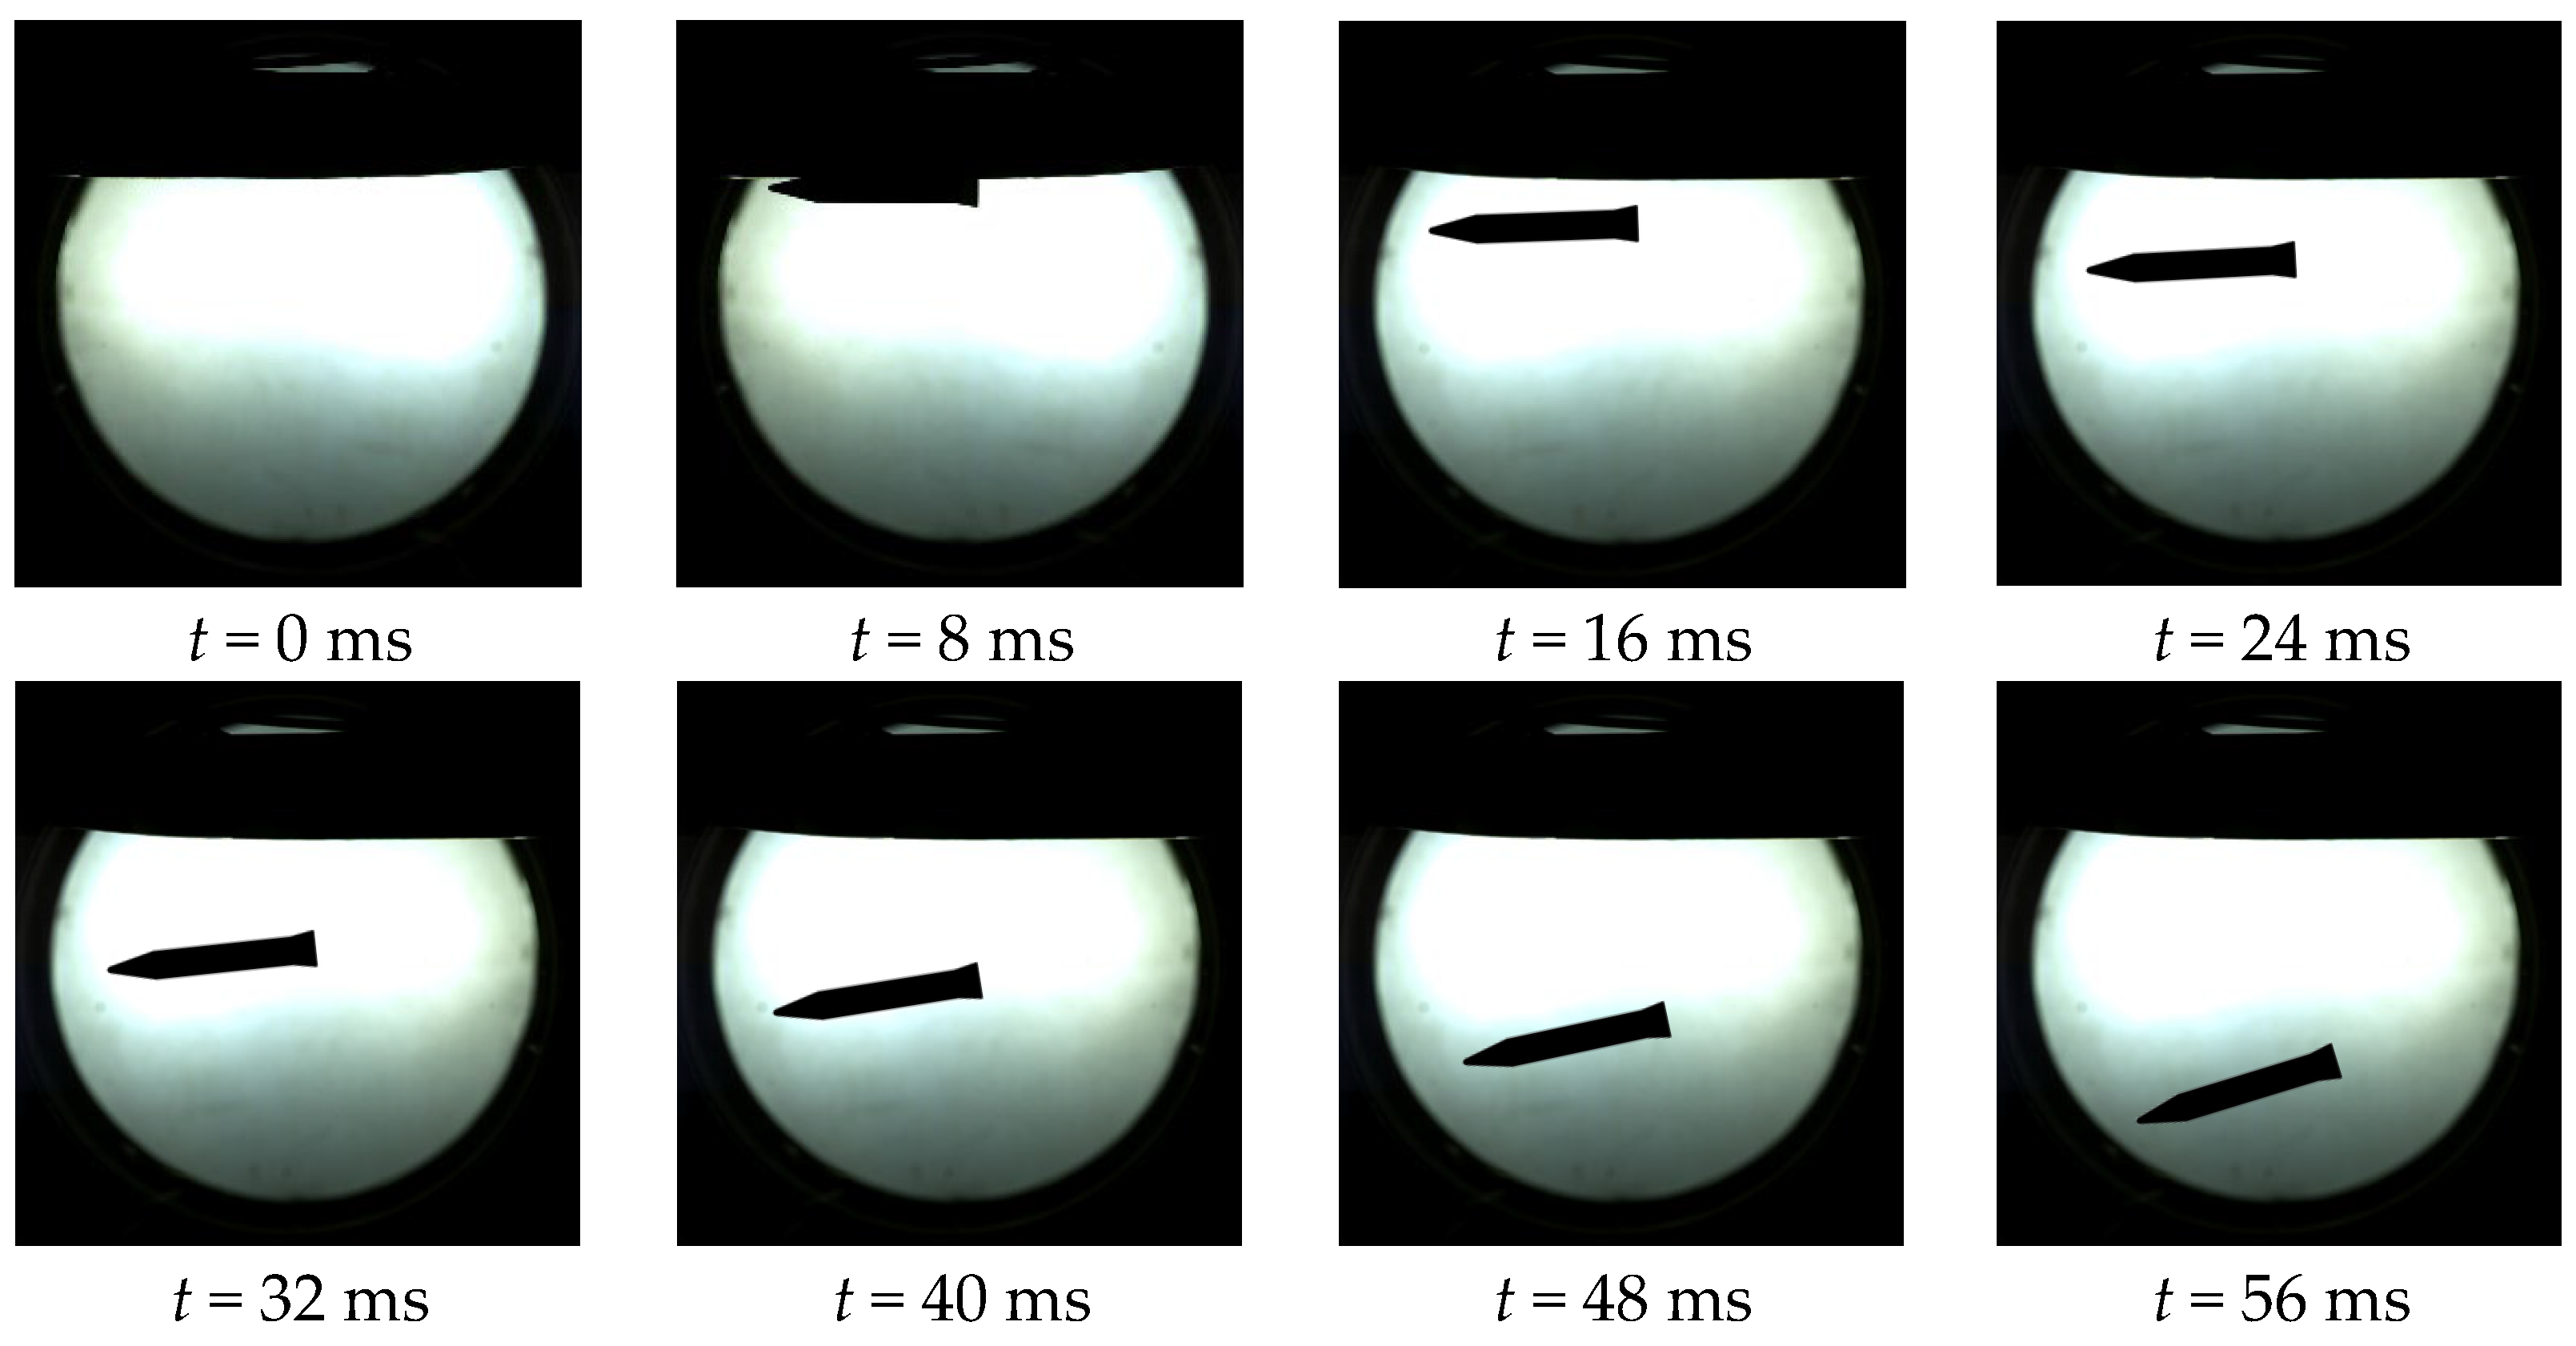
Figure 12 shows the attitude sequence diagram of the revolution body at M = 0.6 without a jet.
The angle of attack curve without a jet is not drawn separately. The following section compares the data curves for the conditions without a jet to those with a jet.
During the tests without a jet, it was found that the background of the picture was too bright. There was a concern that the nozzle airflow would not be seen clearly during the tests with a jet; thus, the background was dimmed in subsequent experiments by placing paper on the observation window.

3.3. Wind Tunnel Test with a Jet at 2.0 MPa

Figure 13 is the test image sequence of the angle of attack change of the revolution body with a jet at 2.0 MPa for M = 0.6. The interaction between the ejected airflow and the flow from the wind tunnel can be seen.
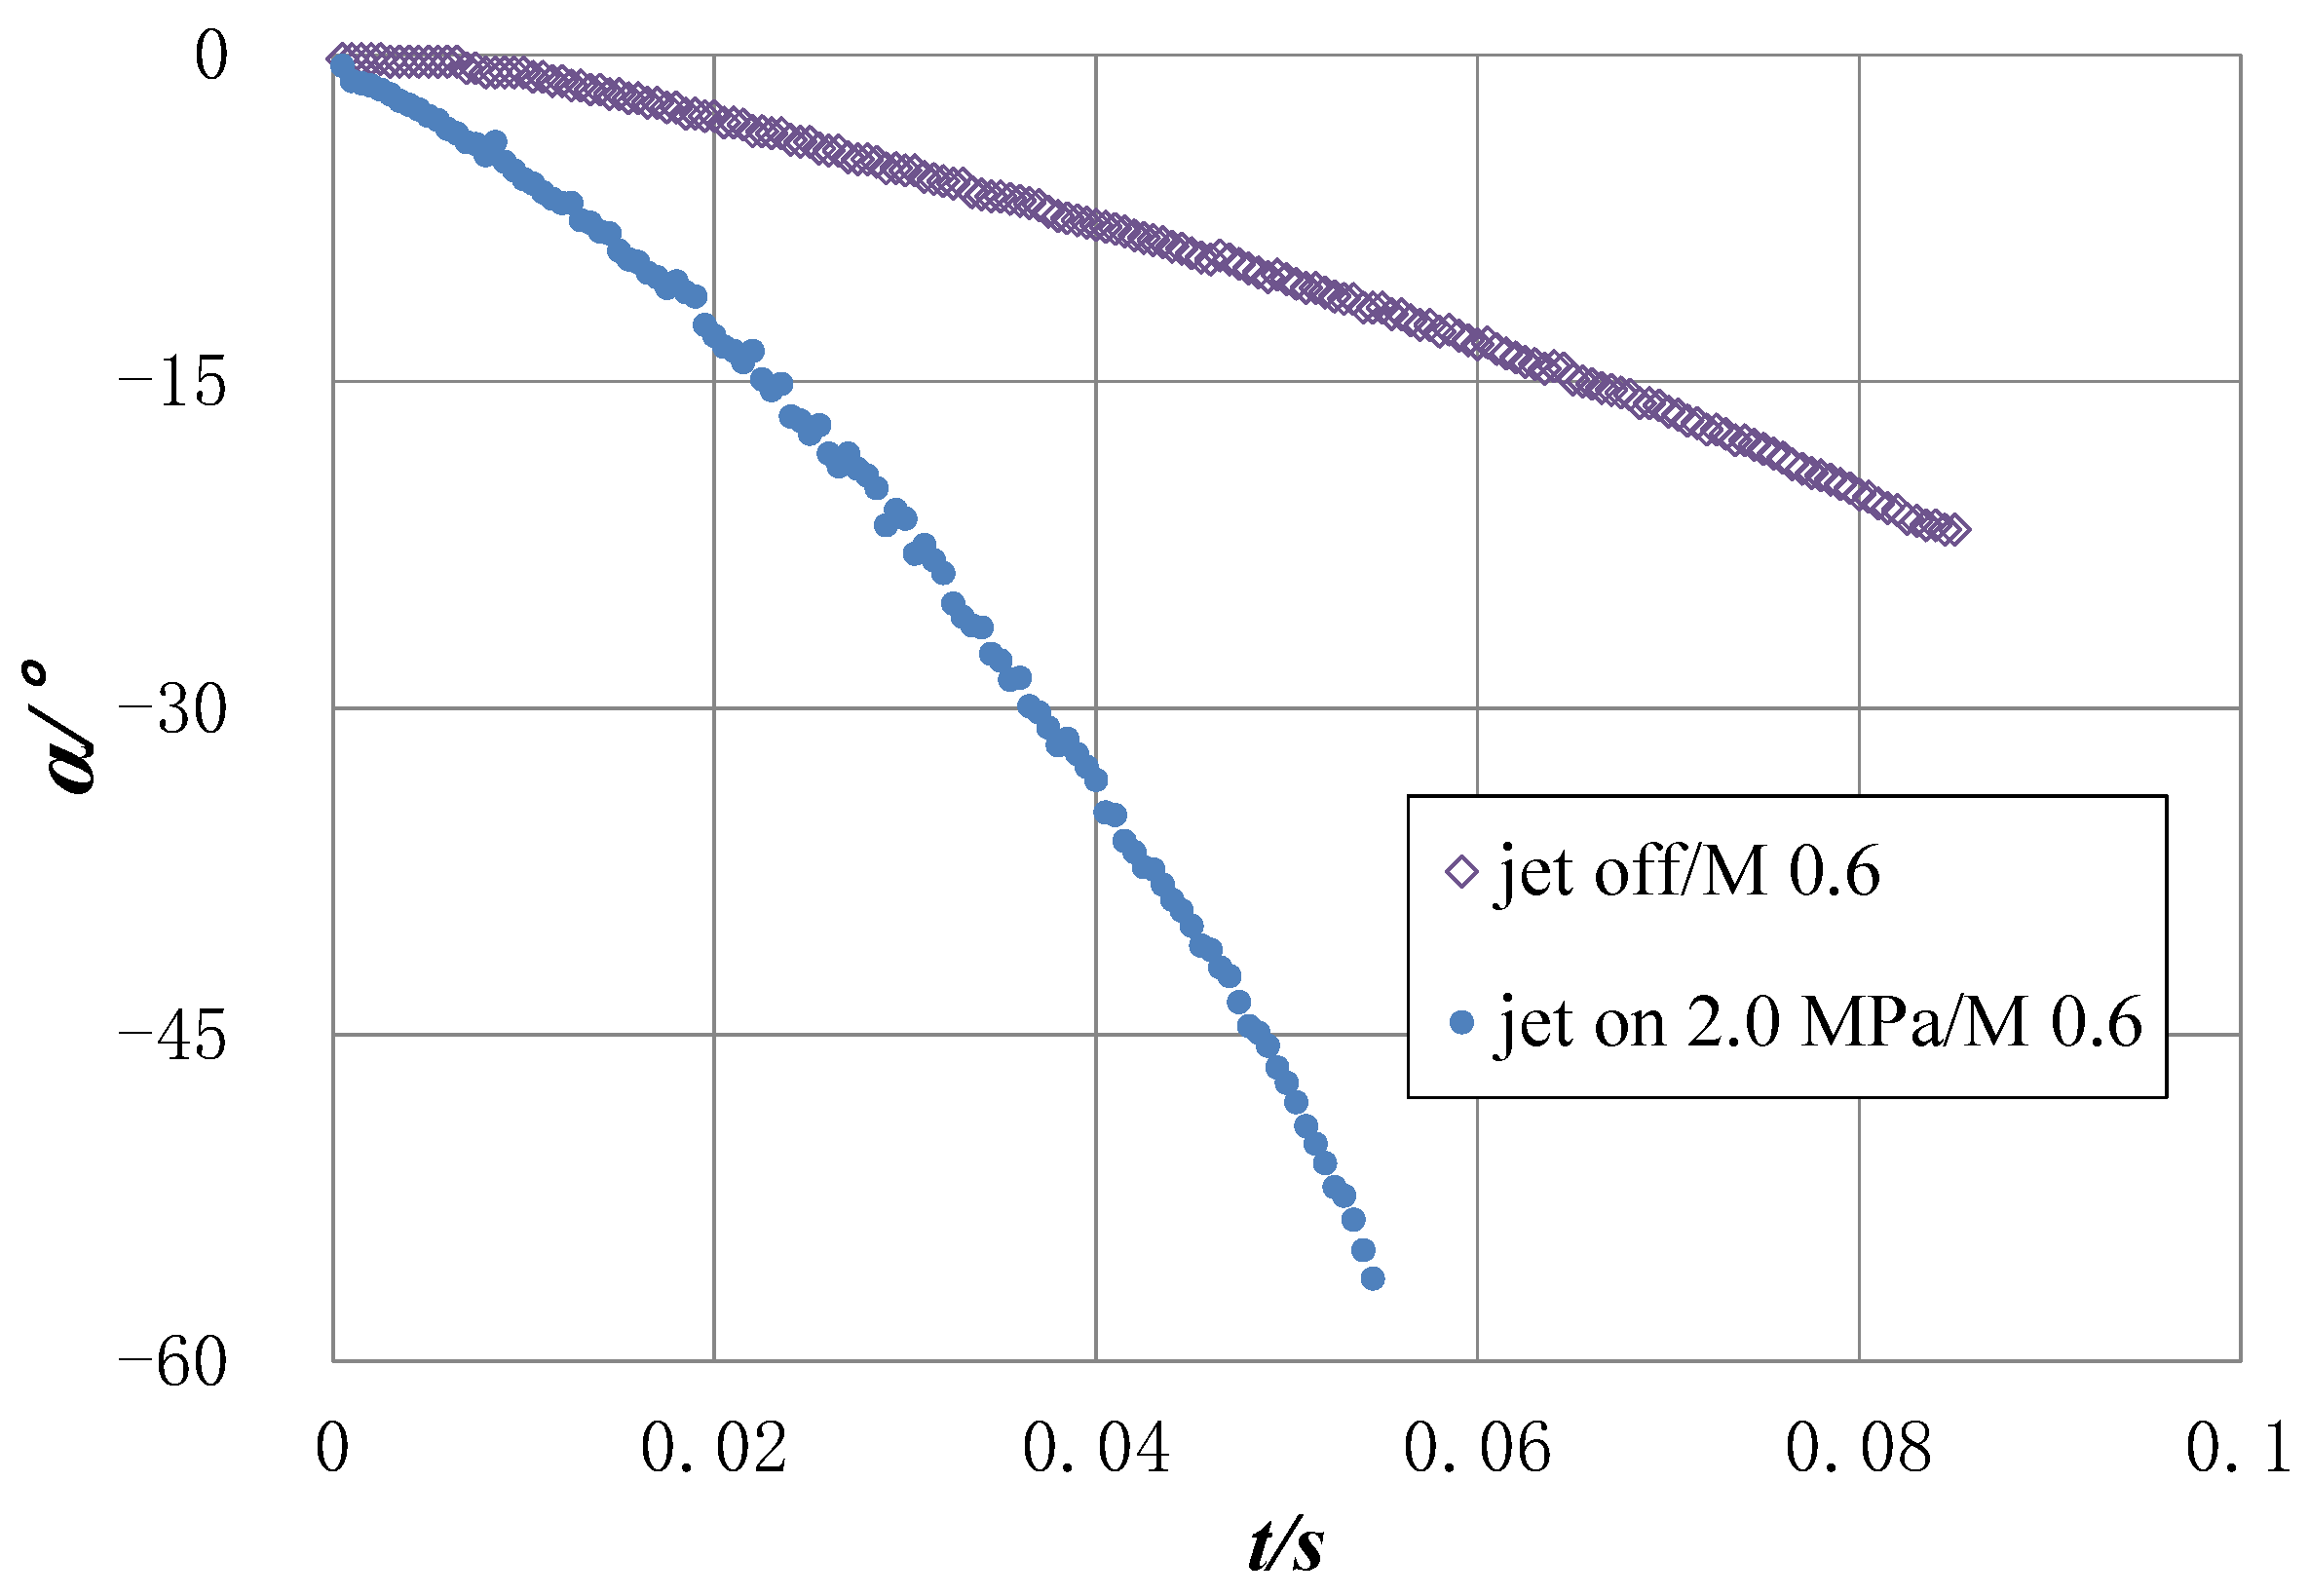
Figure 14 shows the angle of attack curve jet at M = 0.6 with a jet at 2.0 MPa and without a jet. It can be observed that when the jet is present, the attack angle change of the revolution body is more pronounced.

3.4. Wind Tunnel Test with a Jet at 4.0 MPa

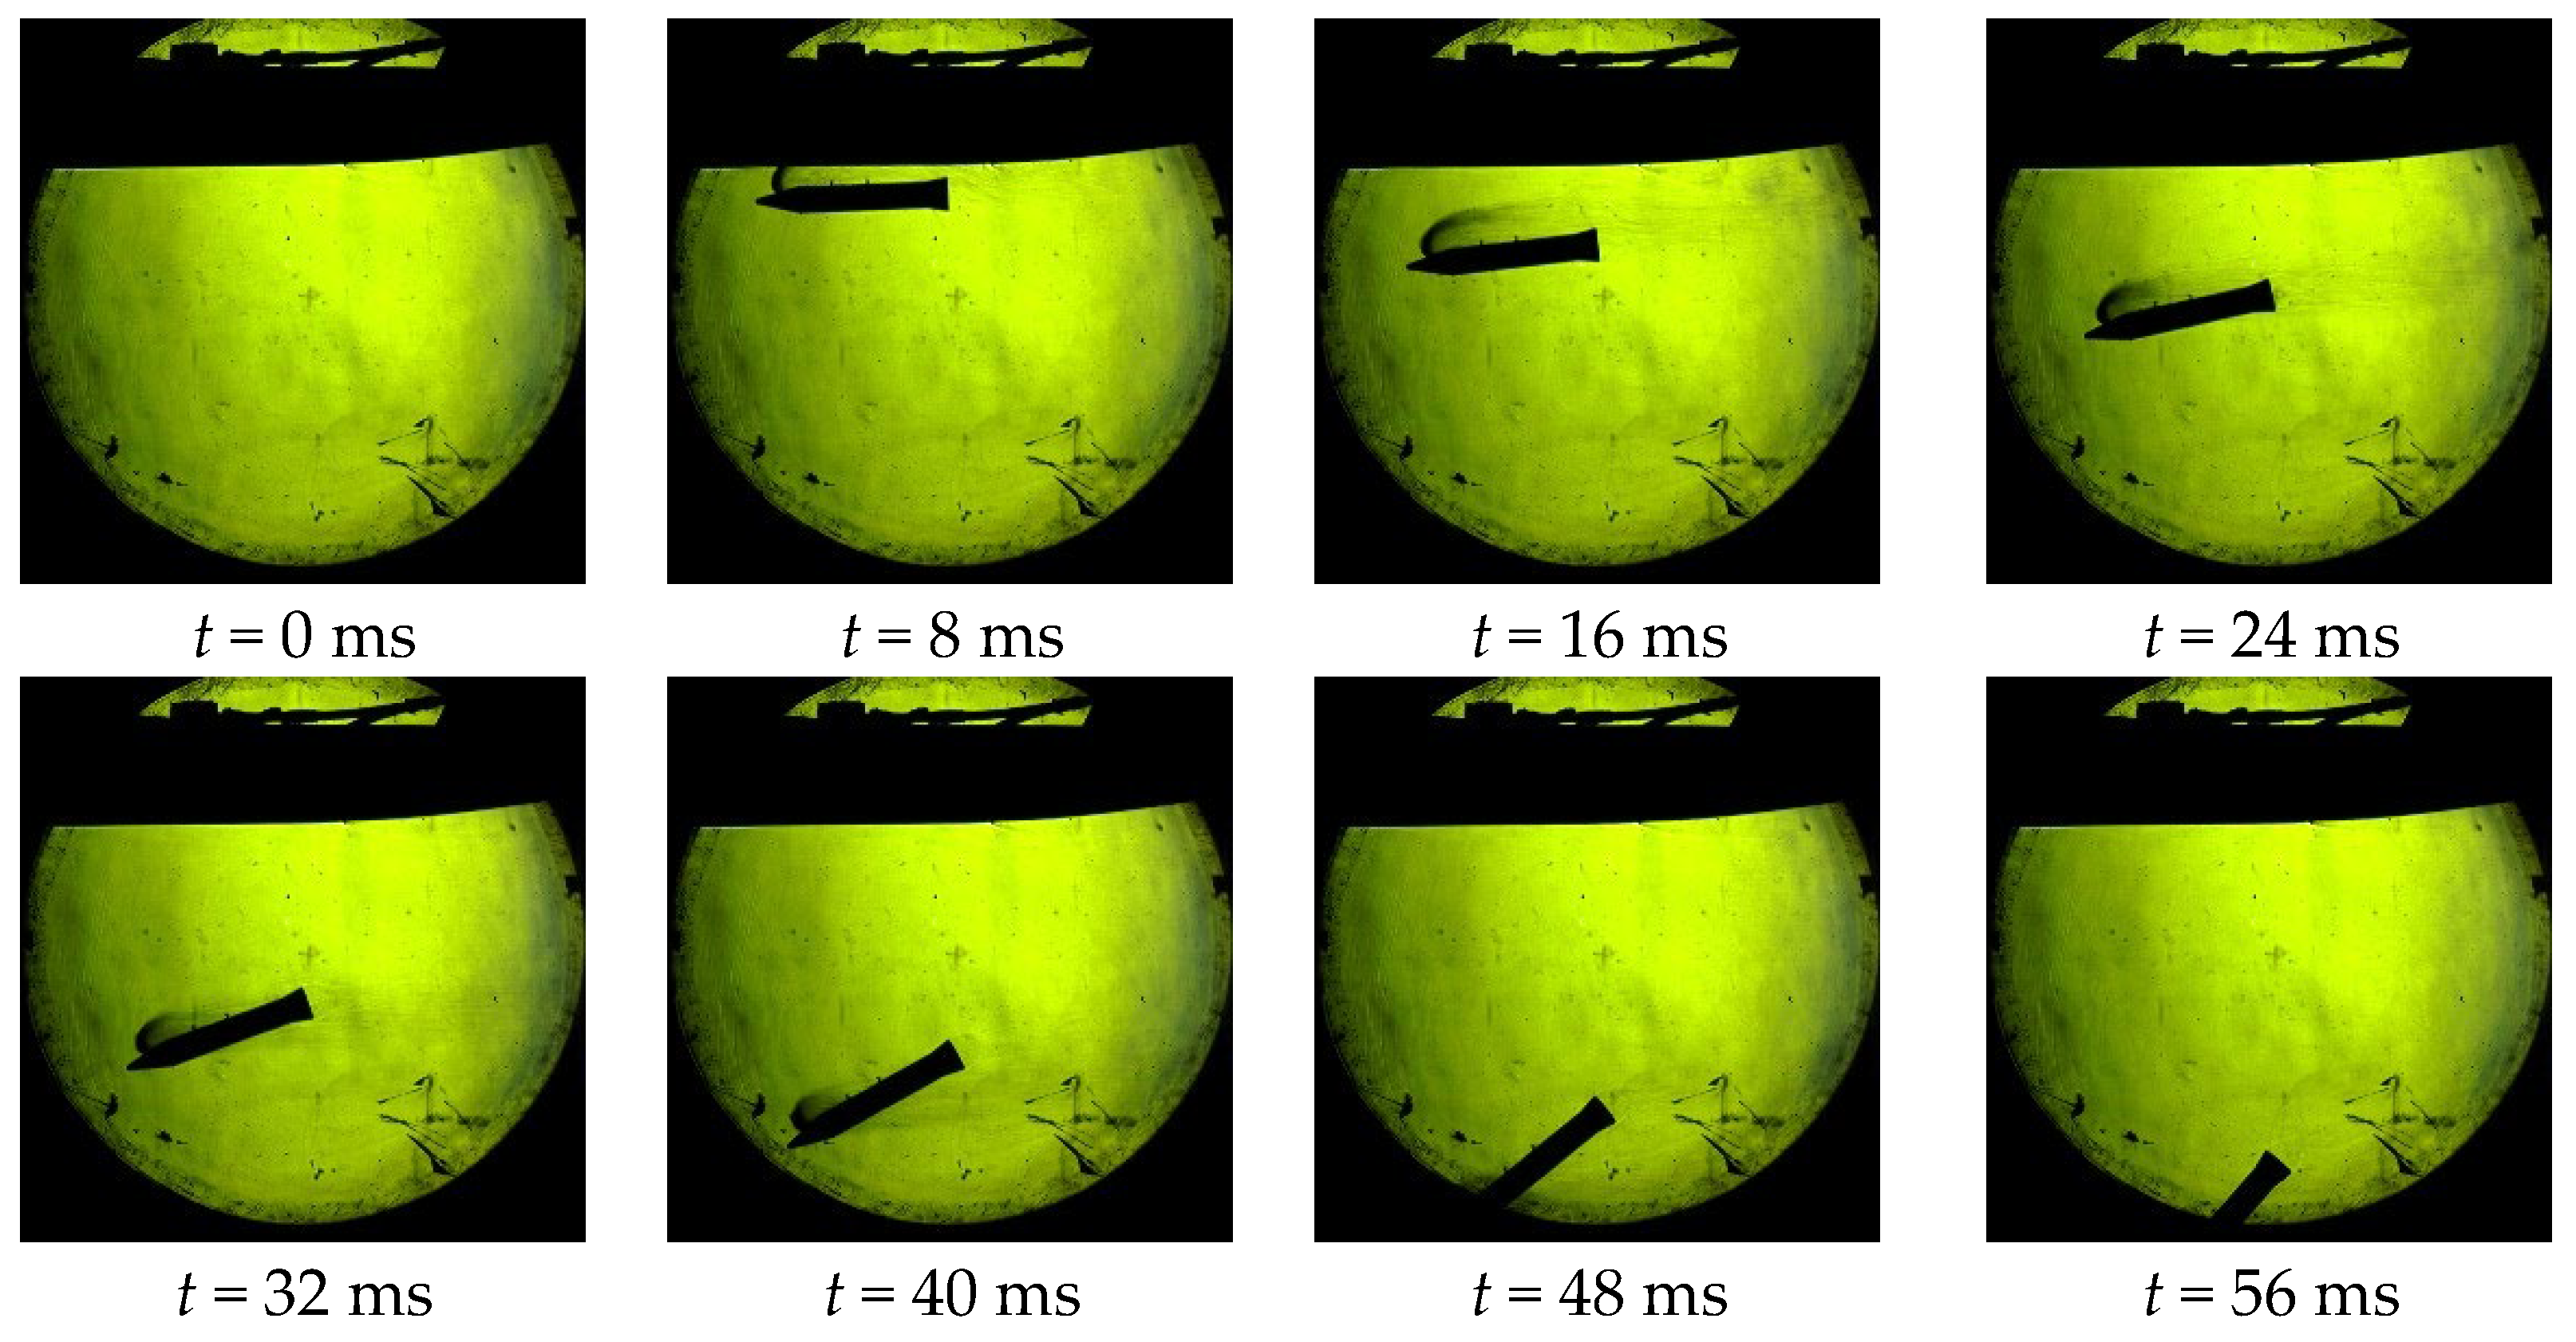
Figure 15 shows the attitude sequence diagram of the revolution body at M = 0.6 with a jet at 4.0 MPa.
Figure 15 shows the test images of the angle of attack change of the revolution body with a jet at 4.0 MPa for M = 0.6. The mutual interaction of the ejected airflow and the flow from the wind tunnel is easily seen, and the jet area and interference area are larger than at 2.0 MPa.
Figure 16 is the angle of attack curve of the revolution body at M = 0.6 with a jet at 4.0 MPa and without a jet. The change in the attack angle of the revolution body is more apparent when the jet is activated.
Figure 17 shows the flow interaction between jet flow, ejected airflow, and incoming wind tunnel flow for different jet cylinder pressures. The gas in the jet flow is different than the incoming flow of the wind tunnel, possibly because the jet flow has a small number of solid impurities that cause it to be visible. The interaction between the jet and incoming wind tunnel flows can be readily observed in the images.

4. KM Solution

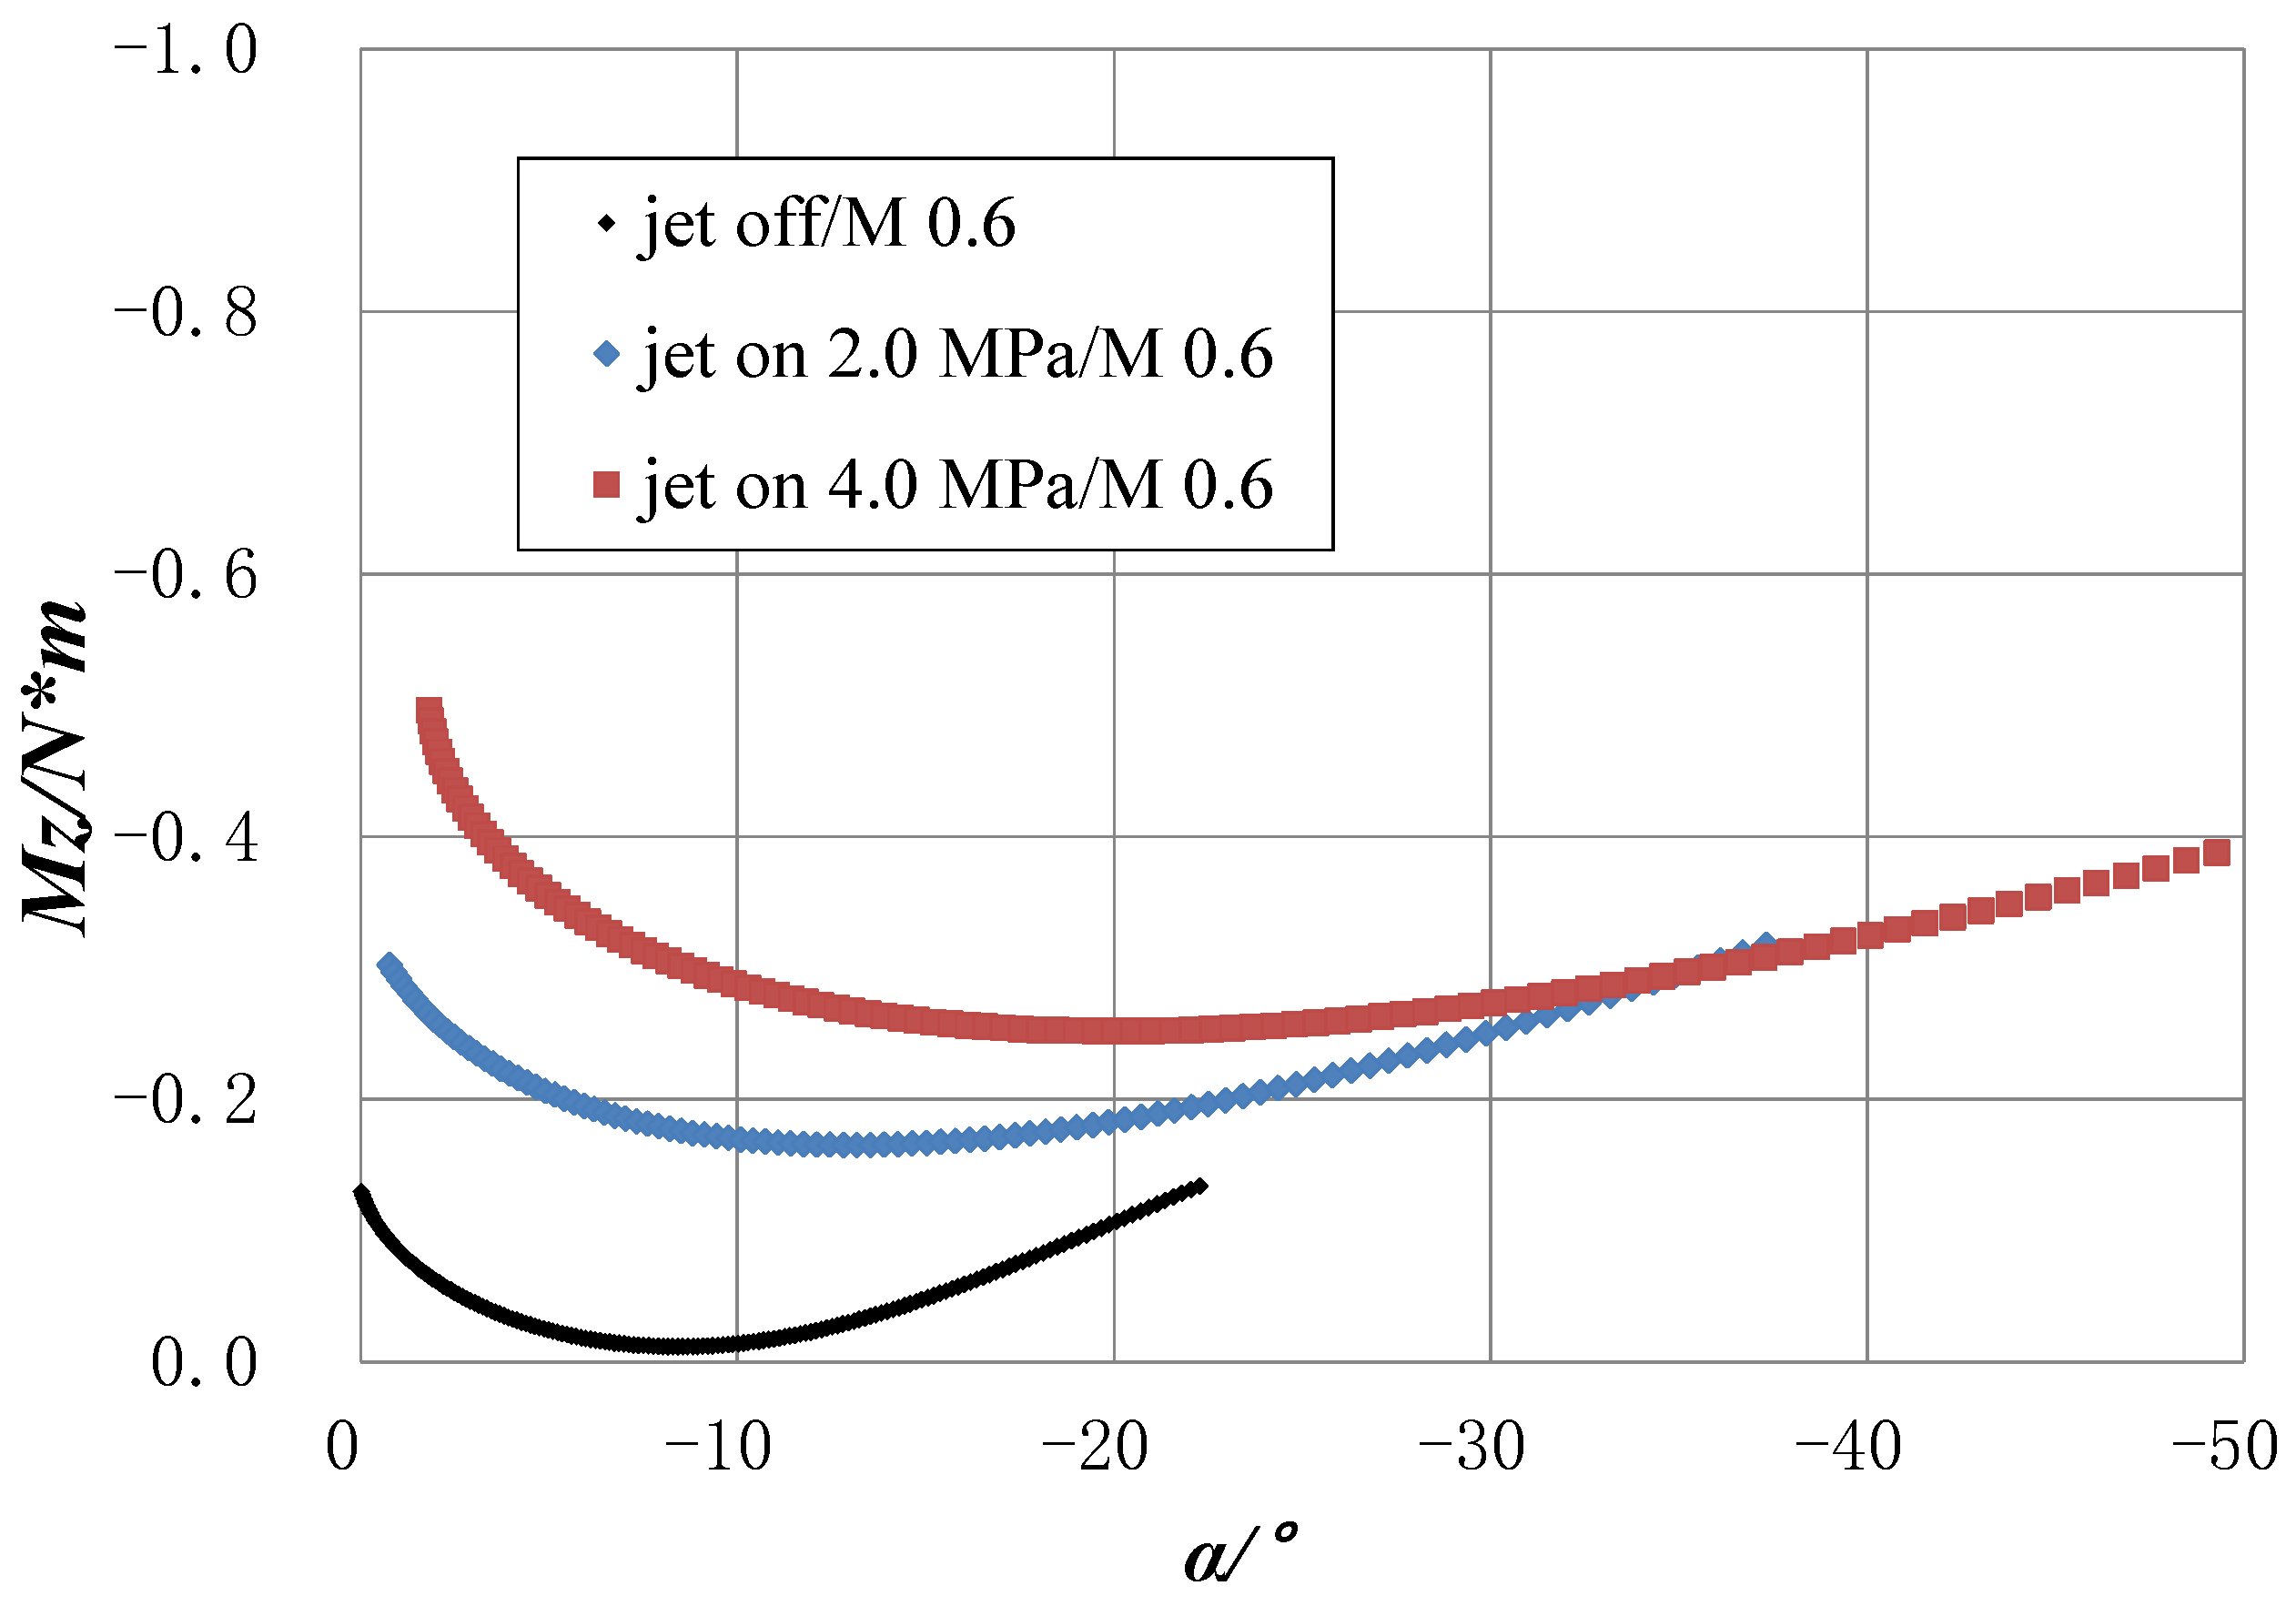
By taking the derivatives of the curves in Figure 14 and Figure 16 with respect to time, the variation of the model’s pitching moment with the angle of attack can be obtained when the jet is on with wind tunnel airflow, as shown in Figure 18.
The range of attack angles considered in solving KM in this paper is 5° < |α| < 25°. However, the moment is also obtained for the data outside this range, and the results are provided in the following curves for reference.
Figure 18 shows the moment curves of the revolution body for three conditions (jet on at 2.0 MPa, jet on at 4.0 MPa, and jet off) at M = 0.6. In Figure 18, the main analysis range is 5° < |α| < 20° to reduce interference and to ensure a more realistic test analysis. As the angle of attack increases, the curves approach each other, indicating that the influence of the jet becomes less significant, especially when the angle of attack is greater than 30°, and the aerodynamic moments for the three conditions tend to be equal. These results show that the influence of the jet is weakened with increasing angle of attack, and the moment generated by incoming flow is dominant. This is also in accordance with physical reasoning, which objectively shows that the data of this test are reliable.
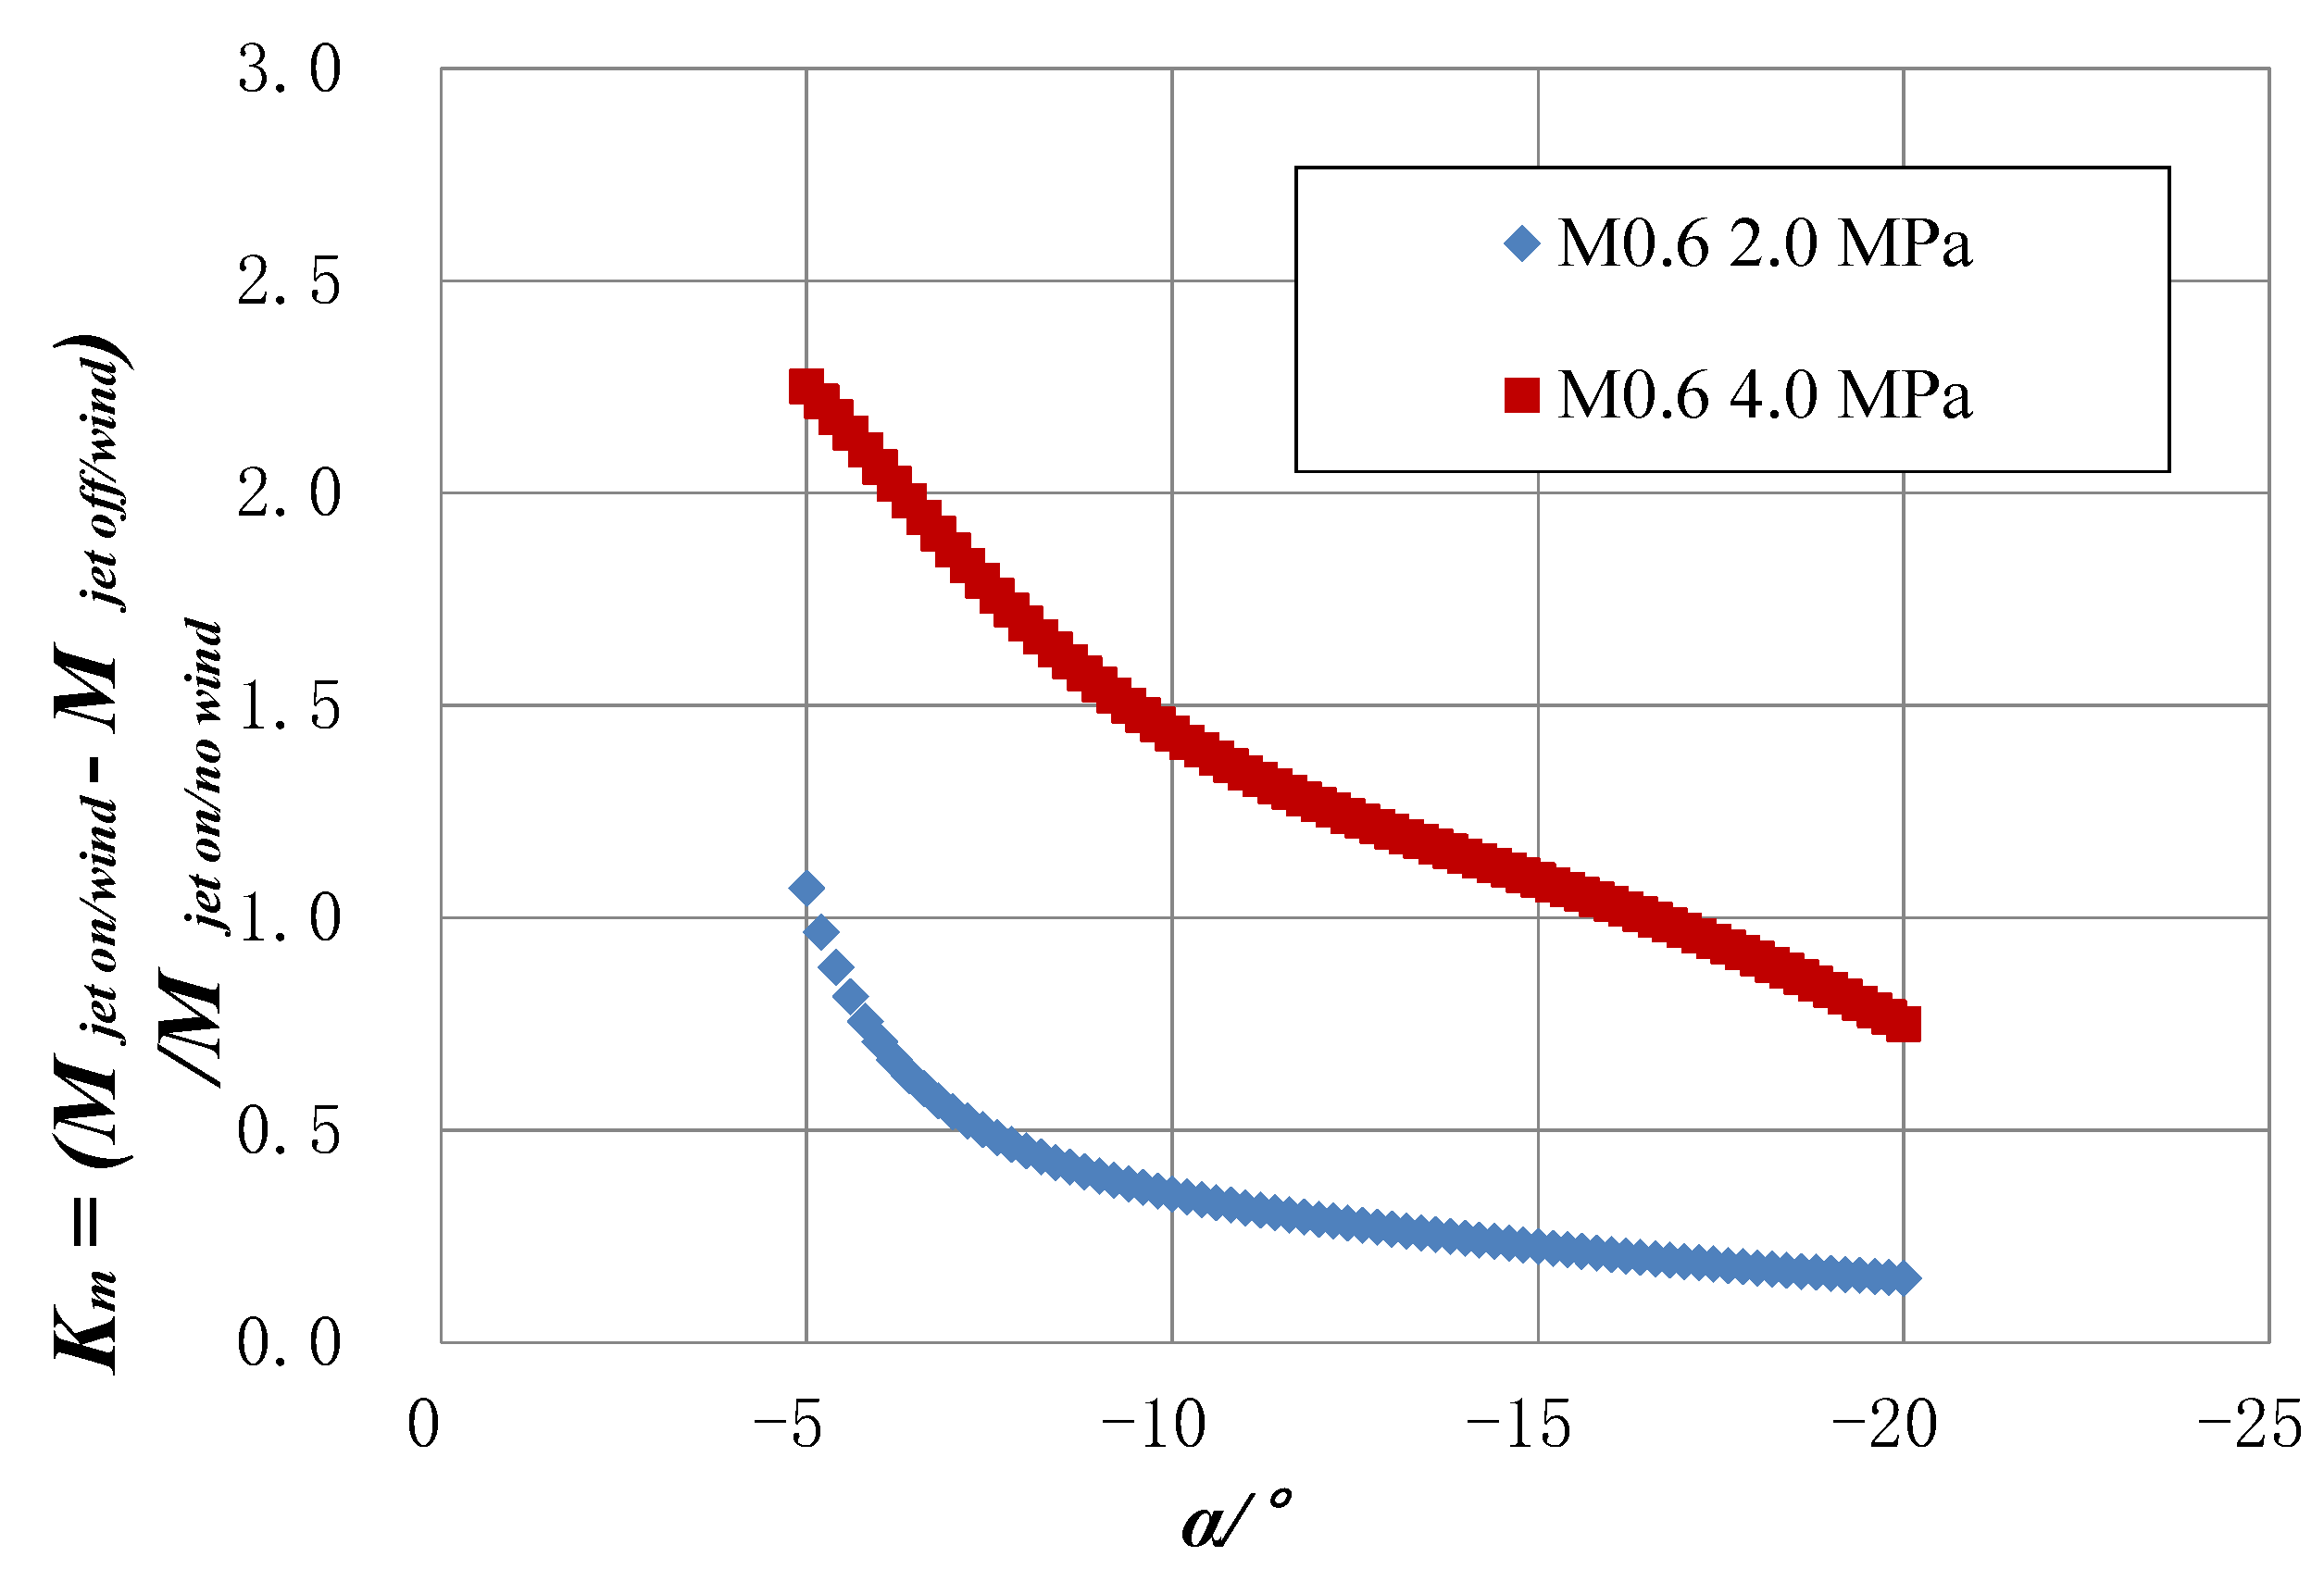
Let KM = (Mjet on/windMjet off/wind)/Mjet on/no wind, where KM is the pitch moment amplification factor of the lateral jet, M jet on/wind is the moment on the revolution body with wind and jet on, Mjet off/wind is the moment on the revolution body with wind and jet off, and Mjet on/no wind is the moment on the revolution body no wind and jet on. The curves corresponding to this paper are Figure 18 for Mjet on/wind and Mjet off/wind, and Figure 11 for Mjet on/no wind. Thus, curves of KM versus angle of attack with the jet on at 2.0 and 4.0 MPa can be obtained.
As seen in Figure 19, when the pressure is 2.0 MPa, KM at 5° < |α| < 20° is generally less than 1, indicating that the pitching moment provided by the lateral jet has no pronounced effect. When the pressure is 4.0 MPa, KM at 5° < |α| < 16° is greater than 1 and even reaches about 2.25 at 5°, indicating that the lateral jet plays a role in promoting the pitching moment. When 16° < |α| < 20°, KM is less than 1, showing that the pitching moment provided by the lateral jet has no significant effect.

5. Conclusions

This paper conducts unsteady motion tests of a lateral jet. By combining jet control with a wind tunnel free-flight test, curves of pitch moment amplification factors (KM) for the lateral jet versus angle of attack (α) are obtained. The method used overcomes the disadvantage of previous experiments that can only study the unsteady characteristics of a single parameter (unsteady flow field, unsteady aerodynamic force, or unsteady motion) at a time. The new method ensures that the test model can be coupled in real-time similar to an actual air vehicle. In particular, the unsteady flow field, unsteady aerodynamic force, and unsteady motion of the air vehicle caused by the jet can ensure the unsteady real-time coupling of the three parameters, ensuring that the test results are authentic.
The primary purpose of this paper is to provide a new test technology and to demonstrate how to obtain more useful and abundant test data to understand the impact of the jet on vehicle movement. The following conclusions can be drawn from these tests. These conclusions summarize these tests and provide reference templates for data analysis by researchers. It is believed that similar phenomena will be observed when using this paper’s test method for jet research on other aircraft.
(1)
The tests in this paper are carried out for typical test conditions, and the results show that when the pressure is 2.0 MPa, KM at 5° < |α| < 20° is generally less than 1, indicating that the pitching moment provided by the lateral jet has no pronounced effect.
(2)
When the pressure is 4.0 MPa, KM at 5° < |α| < 16° is typically greater than 1, even reaching about 2.25 at 5°, which shows that the lateral jet plays a role in promoting the pitching moment. When 16° < |α| < 20°, KM is less than 1, indicating that the pitching moment contribution by the lateral jet has no significant effect.
(3)
It was further found that KM decreases slowly with increasing angle of attack. At 2.0 MPa, 5° is the critical angle of attack (where KM crosses 1), while at 4.0 MPa, the critical angle of attack is 16°. When the angle of attack is above 30°, the influence of the jet on the pitching moment nearly disappears.

Author Contributions

Conceptualization, F.X.; Data curation, Y.Z.; Investigation, N.C.; Software, L.L. All authors have read and agreed to the published version of the manuscript.

Funding

This research was supported by the National Natural Science Foundation of China (U21B2054 and 11772317). This research was also supported by the Open Fund of Key Laboratory of Icing and Anti/De-icing (grant no. IADL20200408).

Data Availability Statement

Not applicable.

Conflicts of Interest

The authors declare no conflict of interest.

References

  1. Brandeis, J.; Gill, J. Experimental investigation of side jet steering for missiles at supersonic and hypersonic speeds. In Proceedings of the 33rd Aerospace Sciences Meeting and Exhibit, Reno, NV, USA, 9–12 January 1995; p. 316. [Google Scholar]
  2. Sebastian, R.; Lürkens, T.; Schreyer, A.-M. Flow field around a spanwise-inclined jet in supersonic crossflow. Aerosp. Sci. Technol. 2020, 106, 106209. [Google Scholar] [CrossRef]
  3. Pourhashem, H.; Kumar, S.; Kalkhoran, I.M. Flow field characteristics of a supersonic jet influenced by downstream microjet fluidic injection. Aerosp. Sci. Technol. 2019, 93, 105281. [Google Scholar] [CrossRef] [Green Version]
  4. Erdem, E.; Kontis, K. Experimental investigation of sonic transverse jets in Mach 5 crossflow. Aerosp. Sci. Technol. 2021, 110, 106419. [Google Scholar] [CrossRef]
  5. Maldonado, V.; Peralta, N.; Gorumlu, S.; Ayele, W. On the figure of merit and streamwise flow of a propulsive rotor with synthetic jets. Aerosp. Sci. Technol. 2021, 113, 106712. [Google Scholar] [CrossRef]
  6. Huh, J.; Lee, S. Numerical study on lateral jet interaction in supersonic crossflows. Aerosp. Sci. Technol. 2018, 80, 315–328. [Google Scholar] [CrossRef]
  7. Zhu, L.; Li, Y.; Chen, X.; Li, H.; Li, W.; Li, C. Hypersonic flow characteristics and relevant structure thermal response induced by the novel combined spike-aerodome and lateral jet strategy. Aerosp. Sci. Technol. 2019, 95, 105459. [Google Scholar] [CrossRef]
  8. Min, B.-Y.; Lee, J.-W.; Byun, Y.-H. Numerical investigation of the shock interaction effect on the lateral jet controlled missile. Aerosp. Sci. Technol. 2006, 10, 385–393. [Google Scholar] [CrossRef]
  9. Luo, X.; Sun, B.; Wang, X. Experimental investigation on a cavity-step-actuated supersonic oscillating jet. Chin. J. Aeronaut. 2017, 30, 274–281. [Google Scholar] [CrossRef]
  10. Meng, Y.; Yan, L.; Huang, W.; Wang, Z.-W. Fluid-thermal coupled investigation on the combinational spike and opposing/lateral jet in hypersonic flows. Acta Astronaut. 2021, 185, 264–282. [Google Scholar] [CrossRef]
  11. Christie, R. Lateral Jet Interaction with a Supersonic Crossflow. Master’s Thesis, Cranfield University, Cranfield, UK, 2010. [Google Scholar]
  12. DeSpirito, J. Effects of turbulence model on prediction of hot-gas lateral jet interaction in a supersonic crossflow. In Proceedings of the 53rd AIAA Aerospace Sciences Meeting, Kissimmee, FL, USA, 5–9 January 2015. [Google Scholar]
  13. Huh, J.; Lee, S. Computations of supersonic lateral jet. In Proceedings of the 30th Congress of the International Council of the Aeronautical Sciences, Daejeon, Korea, 25–30 September 2016. [Google Scholar]
  14. Brandeis, J.; Gill, J. Experimental investigation of super and hypersonic jet interaction on configurations with lifting surfaces. In Proceedings of the 22nd Atmospheric Flight Mechanics Conference, New Orleans, LA, USA, 11–13 August 1997; p. 3723. [Google Scholar]
  15. Graham, M.J.; Weinacht, P.; Brandeis, J. A Numerical Investigation of Supersonic Jet Interaction for Finned Bodies. J. Spacecr. Rocket. 2000, 39, 31. [Google Scholar]
  16. Wang, J.; Wu, J. Aerodynamic performance improvement of a pitching airfoil via a synthetic jet. Eur. J. Mech. B 2020, 83, 73–85. [Google Scholar] [CrossRef]
  17. Lai, J.; Zhao, Z.; Wang, X.; Li, H.; Li, Q. Numerical investigation of pitch motion induced unsteady effects on transverse jet interaction. Aerosp. Sci. Technol. 2020, 105, 106005. [Google Scholar] [CrossRef]
  18. Xia, Q.; Zhong, S. Enhancement of inline mixing with lateral synthetic jet pairs at low Reynolds numbers: The effect of fluid viscosity. Flow Meas. Instrum. 2017, 53, 308–316. [Google Scholar] [CrossRef]
  19. Fairweather, M.; Jones, W.P.; Lindstedt, R.P.; Marquis, A.J. Predictions of a turbulent reacting jet in a cross-flow. Combust. Flame 1991, 84, 361–375. [Google Scholar] [CrossRef]
  20. Watanabe, T.; Zhang, X.; Nagata, K. Direct numerical simulation of incompressible turbulent boundary layers and planar jets at high Reynolds numbers initialized with implicit large eddy simulation. Comput. Fluids 2019, 194, 104314. [Google Scholar] [CrossRef]
  21. Kozato, Y.; Kikuchi, S.; Imao, S.; Kato, Y.; Okayama, K. Flow control of a rectangular jet by DBD plasma actuators. Int. J. Heat Fluid Flow 2016, 62, 33–43. [Google Scholar] [CrossRef]
  22. Gröschel, E.; Schröder, W.; Renze, P.; Meinke, M.; Comte, P. Noise prediction for a turbulent jet using different hybrid methods. Comput. Fluids 2008, 37, 414–426. [Google Scholar] [CrossRef]
  23. Xue, F.; Wang, Y.; Qin, H. Derivation and validation of wind tunnel free-flight similarity law for store separation from aircraft. Aerosp. Sci. Technol. 2020, 97, 105614. [Google Scholar] [CrossRef]
  24. Xue, F.; Wang, H.; Jiang, Z. Derivation and verification of a similarity law for wind-tunnel free-flight tests of heavy-store separation. Acta Astronaut. 2020, 174, 123–130. [Google Scholar] [CrossRef]
  25. Xue, F.; Jin, X.; Feng, P. Optimization and verification of free flight separation similarity law in high-speed wind tunnel. Chin. J. Aeronaut. 2020, 33, 501–507. [Google Scholar] [CrossRef]
  26. Xue, F.; Tang, J.; Wang, H. Optimization and verification of wind tunnel free flight similarity law for the separation of cluster munition. Chin. J. Aeronaut. 2021, 34, 61–70. [Google Scholar] [CrossRef]
  27. Xue, F.; Qin, H.; Wang, Y. Free flight wind tunnel test similarity law derivation for light store separation from aircraft. Adv. Mech. Eng. 2019, 11, 1–7. [Google Scholar] [CrossRef]
  28. Xue, F.; Gu, Y.; Wang, Y.; Qin, H. Research on control effectiveness of fluidic thrust vectoring. Sci. Prog. 2021, 104, 003685042199813. [Google Scholar] [CrossRef]
  29. Xue, F.; Wang, Y.; Bai, P. Investigation of aerodynamics of separator delivery from cavity. Int. J. Mod. Phys. B 2020, 34, 2040104. [Google Scholar] [CrossRef]
  30. Xue, F.; Jin, X.; Wang, Y.; Yang, Y. Wind tunnel test technique on high speed weapon delivery from internal weapons bay. Acta Aeronaut. Astronaut. Sin. 2017, 38, 59–65. [Google Scholar]
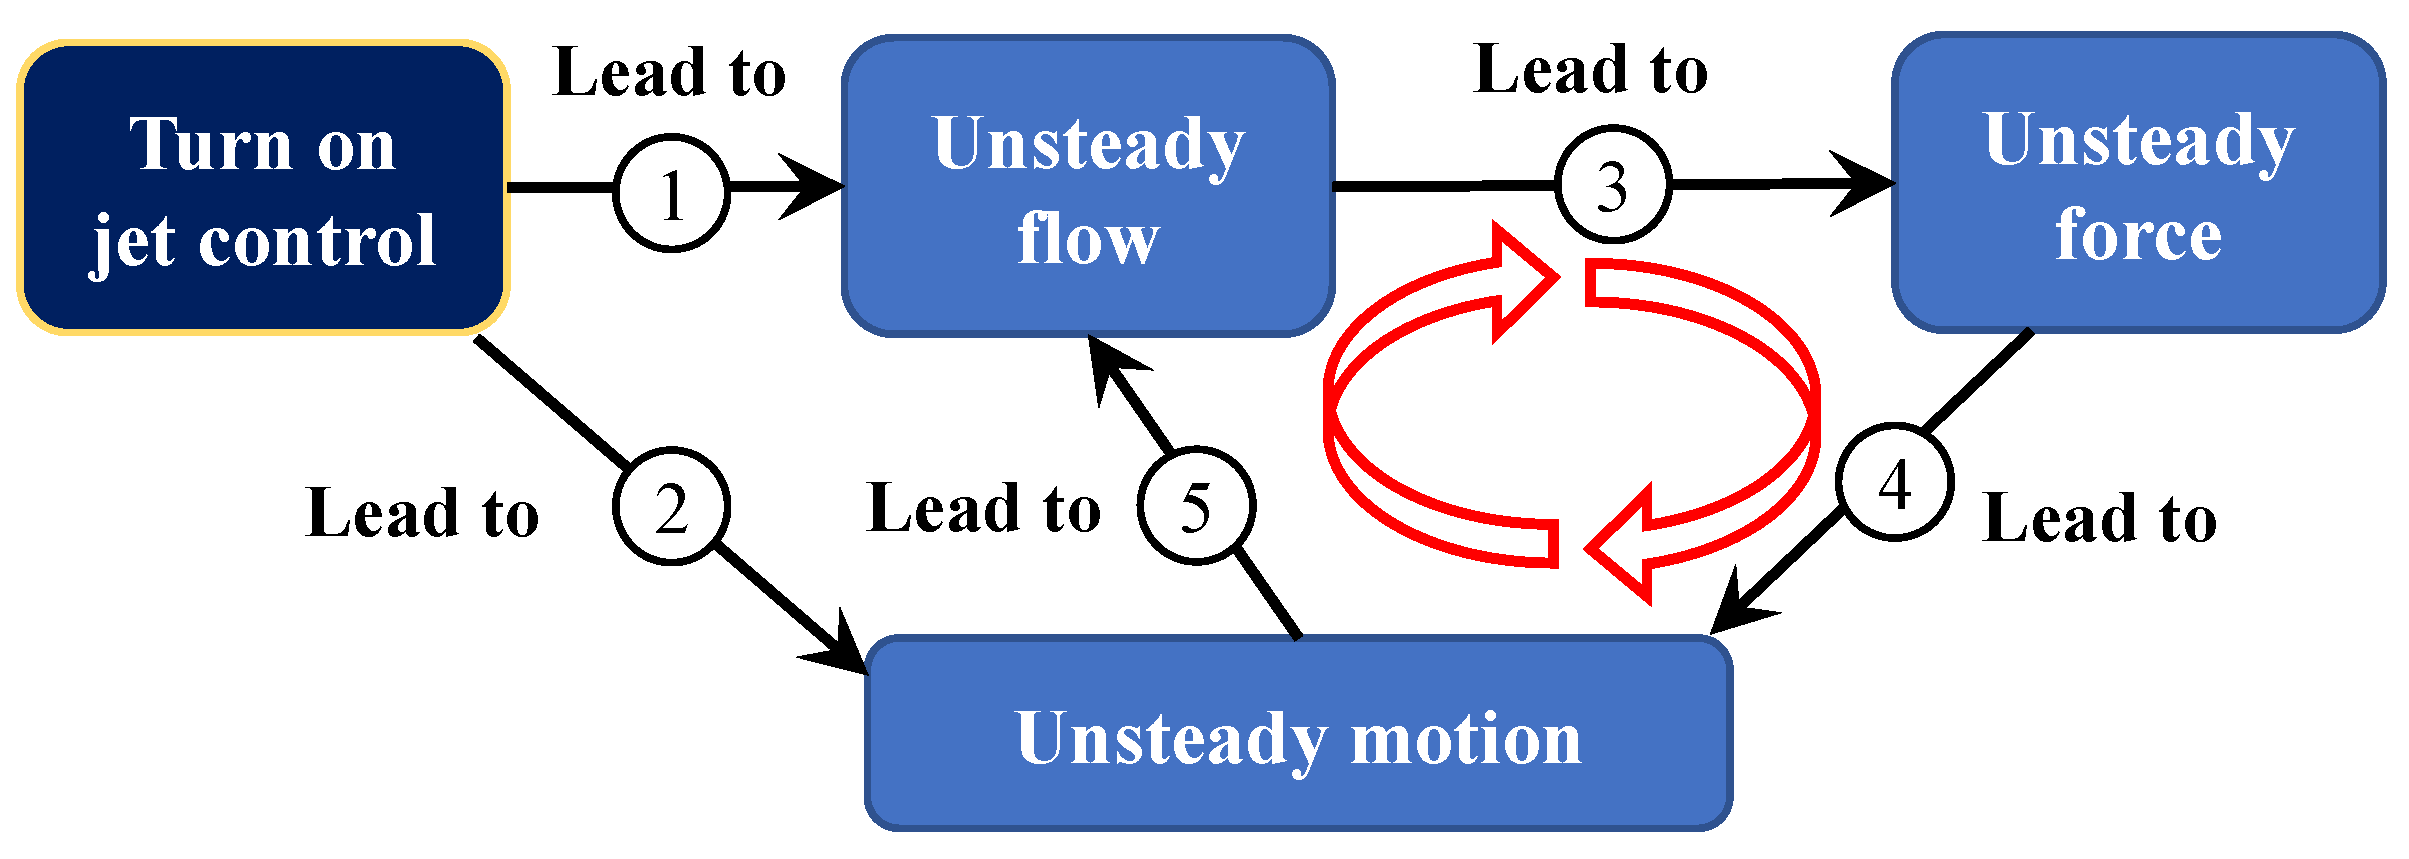
Figure 1. The relationship between the jet, flow field, aerodynamic force, and motion of an actual air vehicle when jet control is activated.
Applsci 12 08387 g001
Figure 2. Geometric dimension diagram of revolution body (dimensions are mm).
Applsci 12 08387 g002
Figure 3. Test model and high-pressure cylinder.
Applsci 12 08387 g003
Figure 4. Test cavity.
Applsci 12 08387 g004
Figure 5. Nozzle velocity measurement.
Applsci 12 08387 g005
Figure 6. Test installation diagram.
Applsci 12 08387 g006
Figure 7. Test results for no jet and no wind.
Applsci 12 08387 g007
Figure 8. Test results for a 2.0 MPa jet with no wind.
Applsci 12 08387 g008
Figure 9. The revolution body pitch for no wind, with and without a jet.
Applsci 12 08387 g009
Figure 10. Test results for a 4.0 MPa jet with no wind.
Applsci 12 08387 g010
Figure 11. Variation of the revolution body’s pitching moment with the angle of attack for three jet conditions with no wind.
Applsci 12 08387 g011
Figure 12. Test image of the revolution body’s angle of attack change without a jet at M = 0.6.
Applsci 12 08387 g012
Figure 13. Test image of the revolution body’s angle of attack change with a jet at 2.0 MPa for M = 0.6.
Applsci 12 08387 g013
Figure 14. Angle of attack curve of revolution body at M = 0.6 with a jet at 2.0 MPa and without a jet.
Applsci 12 08387 g014
Figure 15. Test image of the revolution body’s angle of attack change with a jet at 4.0 MPa for M = 0.6.
Applsci 12 08387 g015
Figure 16. Angle of attack curve of revolution body at M = 0.6 with a jet at 4.0 MPa and without a jet.
Applsci 12 08387 g016
Figure 17. Interaction between jet region, jet flow, and wind tunnel flow at different pressures.
Applsci 12 08387 g017
Figure 18. Moment curves of the revolution body for three jet conditions at M = 0.6.
Applsci 12 08387 g018
Figure 19. Curves of KM vs. angle of attack at M = 0.6, jet on 2.0 and 4.0 MPa.
Applsci 12 08387 g019
Table 1. Parameters of the FD-12 wind tunnel.
Mρ (kg/m3)Ps (Pa)q (Pa)Ts (°C)
0.61.115685,83421,408268.02
Publisher’s Note: MDPI stays neutral with regard to jurisdictional claims in published maps and institutional affiliations.