Article

Experimental and Numerical Investigation for Seismic Performance of a Large-Scale LNG Storage Tank Structure Model

1
School of Civil Engineering, Chongqing University, Chongqing 400045, China
2
Science and Technology Quality Department, Chongqing Design Institute Co., Ltd., Chongqing 400015, China
3
Key Laboratory of Icing and Anti/Deicing, China Aerodynamics Research and Development Center, Mianyang 621000, China
4
Construction Management Department, Construction of Five Investment Management Company, Changsha 410116, China
5
Management Department, Construction of Chongqing High-Tech Building Materials Company, Chongqing 401431, China
*
Authors to whom correspondence should be addressed.
Appl. Sci. 2022, 12(17), 8390; https://doi.org/10.3390/app12178390
Submission received: 18 July 2022 / Revised: 4 August 2022 / Accepted: 12 August 2022 / Published: 23 August 2022

Abstract

:
As special equipment for storing energy, the safety performance of liquified natural gas (LNG) storage tanks under earthquake action is extremely important. To study the dynamic characteristics of the large-scale LNG storage tank structure and the dynamic response under earthquake action, the shaking table test and numerical simulation analysis of the LNG storage tank structure model are carried out. The results of the shaking table test demonstrate that the natural vibration frequency of the tank model is significantly reduced after the isolation measures are taken. The acceleration response of the seismic storage tank increases approximately linearly along the direction of height, and the seismic isolation bearing has a significant seismic isolation effect on the acceleration of the storage tank. The numerical simulation results show that the seismic responses and their spectral characteristic curves of the numerical model and the shaking table test are the same, which verifies the feasibility and rationality of the numerical model. After seismic isolation measures are taken, the seismic responses of large-scale LNG storage tanks, such as base shear force, overturning bending moment and acceleration, are reduced to varying degrees, but the displacement of the storage tank increases to some extent. When carrying out the seismic isolation design of LNG storage tanks, it is necessary to focus on the displacement of the storage tank to prevent damage of the auxiliary pipeline led by excessive displacement.

1. Introduction

The large liquified natural gas (LNG) storage tank is an important energy storage equipment, which is widely used in chemical raw material production and energy supply. Typically, LNG storage tanks are built in coastal areas to receive LNG from maritime transport. However, poor geological conditions in coastal areas, which are prone to suffer from foundation liquefaction [1], result in settlement and inclination of buildings. The safety of large LNG storage tanks is always threatened by earthquakes. Once a severe earthquake comes, large LNG storage tanks will suffer from a tremendous overturning bending moment and dynamic hydraulic pressure, which may lead to damage to the storage tank [2] and buckling failure of the inner tank [3,4]. This can lead to leakage of LNG, which can result in fires and explosions [5,6,7]. It is critical that large LNG storage tanks remain intact during the course of earthquakes. Therefore, it is of great practical significance and engineering value to study the seismic performance of large-scale LNG storage tanks.
Liquid−solid interaction is the most obvious difference between storage tanks and conventional civil structures (such as houses and bridges). Under the external excitation, the liquid will slosh back and forth, which will generate tremendous dynamic hydraulic pressure on the tank wall, which in turn will affect the structure. In order to study the liquid−solid interaction of the storage tank, Housner [8] first proposed a two-particle mass−spring model, which divided the liquid into a rigid component and a convection component. Considering the elastic deformation of the tank wall under load, Haroun and Housne [9] proposed a simplified mechanical model, which takes into account the elastic deformation of the tank wall and the interaction between the liquid and the solid. For the convenience of engineering application, Malhotra et al. [3] proposed a simplified seismic design method, which takes into account the influence of liquid convection and pulsation on the tank wall. Jadhav et al. [10] studied the effect of different isolator parameters on the seismic response of the foundation isolation liquid storage tank. In order to verify the correctness of the simplified model of the storage tank proposed by the above researchers, some researchers [11,12,13] used finite element software to analyze the seismic time history of the storage tank, and compared the calculation results of the finite element and the simplified model; it was found that the difference between the two is not large, which verifies the rationality of the simplified model. Moslemi and Kianoush [14] used ANSYS finite element software to conduct a parametric study on the dynamic behavior of cylindrical storage tanks, and the study illustrated that the current liquid tank design codes of the dynamic hydraulic pressure is too conservative. Saha et al. [15] studied the seismic response of liquid storage tanks isolated by elastomeric bearings and sliding systems under near-fault seismic motion. Kangda [16] reviewed the research status of the finite element method used in the barrier and barrier-free liquid storage tanks, and introduced the method of establishing the finite element model of the liquid storage tank in ANSYS software in detail. However, as storage tanks are being built larger, it is difficult to control the seismic response of storage tanks with seismic measures.
In order to reduce the seismic response of the liquid storage tank, seismic isolation devices are introduced into the liquid storage tank structure, such as friction pendulum bearings, lead-core rubber bearings, etc. In order to study the seismic response of the isolated storage tank under the excitation of near-fault ground motion, Panchal et al. [17,18] selected different isolation bearings for analysis. The research results show that the isolating affection of the variable frequency friction pendulum bearing is better than that of the friction pendulum bearing. Zhang et al. [19] derived the nonlinear restoring force expression of the multiple friction pendulum system, and studied the seismic response of the isolated storage tank on this basis. Tang et al. [20] conducted shaking table tests on storage tanks with different isolation devices. The test results show that the horizontal displacement of the laminated rubber bearing isolated tank is the largest. In comparison, both friction pendulum bearing and variable curvature friction pendulum bearing have good isolation over a wider frequency band. Moeindarbari et al. [21] investigated the multiple level performance of a seismically isolated elevated storage tank isolated with multi−phase friction pendulum bearing, and a mathematical formula involving complex time history analysis was presented for the analysis of a typical storage tank for a multiphase friction pendulum bearing. Seleemah et al. [22] studied the seismic response of liquid storage tanks isolated by elastomeric or plain bearings; it was found that base isolation is quite effective in reducing the earthquake response of liquid storage tanks. The type of site has a significant effect on the seismic response of the storage tank. The foundation of the storage tank was considered as a rigid foundation in previous studies. In fact, the foundation frequently suffers from uneven settlement. Ormeño et al. [23] conducted shaking table tests on rigid-foundation storage tanks and flexible-foundation storage tanks, and the results showed that the axial stress of flexible-foundation storage tanks was reduced compared to rigid-foundation storage tanks. Tsipianitis et al. [24] proposed a detailed numerical framework for seismic analysis of liquid storage tanks considering soil-structure interaction (SSI), and studied the effect of SSI on the seismic performance of storage tanks.
In summary, the current research has made great progress in the field of seismic resistance (seismic isolation) of storage tanks. However, some researchers’ studies are based on simplified mechanical models or numerical simulation models, without conducting a shaking table test to verify their results. A few researchers have carried out shaking table tests, but their studies lack the numerical simulation to prove it. In view of this, this paper analyzes the seismic response of the storage tank model based on the shaking table test and numerical simulation, and studies the seismic isolation effect of the lead-core rubber bearing on the storage tank. On this basis, the dynamic response of a large LNG storage tank of 200,000 cubic meters under earthquake action is analyzed, and the seismic isolation pattern of the storage tank is studied.

2. Shaking Table Test of LNG Storage Tank Model

To reveal the dynamic response mechanism of large-scale LNG storage tanks under earthquake action, a shaking table test was carried out on the structural model of LNG storage tanks in this paper. In the experiment, the dynamic response of a storage tank model was obtained by using the acceleration sensor and the displacement sensor, and the dynamic characteristics of a large LNG storage tank were studied.

2.1. Test Model

This paper takes an actual large-scale LNG storage tank as a reference. Considering the complexity of its structure, a simplification was made when designing the structure model storage tank. It is necessary to ensure that the prototype structure is similar to the experimental structure during the design, but it is difficult to meet this requirement in most cases. Therefore, the storage tank structure model only retains the main structure of large LNG storage tank, such as the outer tank, pile foundation, dome and inner tank, ignoring the structures that do not bear weight, such as the aluminum ceiling, steel dome and auxiliary pipelines.
The geometric dimensions and material parameters of the tank model are as follows. The height of the outer tank wall is 2 m, and the sagittal height of the dome is 0.2 m. The inner diameter of the outer tank wall is 2.5 m, and the thickness of the outer tank wall is 0.2 m. The distance between the outer tank and the inner tank is 0.35 m, the diameter of the inner tank is 0.9 m, the height of the inner tank is 1.5 m, and the wall thickness of the inner tank is 5 mm. There are 13 pile foundations in the model tank. For the seismic storage tank, the pile foundation and the bearing platform of the storage tank are directly connected. For the seismic storage tank, lead−core rubber bearings are arranged between the pile foundation and the bearing platform of the storage tank, as shown in Figure 1a,b. The diameter of the pile is 0.4 m and the length of the pile is 0.3 m. The plans of the seismic storage tank and isolation storage tank are shown in Figure 1. The outer tank is made of C50 concrete with an elastic modulus, Poisson’s ratio and density of 34.5 GPa, 0.167 and 2500 kg/m3, respectively. The inner tank is made of steel with and elastic modulus, Poisson’s ratio and density of 210 GPa, 0.3 and 7800 kg/m3, respectively.
The earthquake shaking table is a three-dimensional horizontal excitation hydraulic drive device. The specific parameters of this device are as follows: the size of the table is 6 m × 6 m; the maximum load capacity is 60 t; the maximum anti-overturning moment is 1800 kN·m; the limit displacement of the table is ± 250 mm. The measurement point layout of the storage tank model is shown in Figure 1. Acceleration sensors and displacement sensors were arranged in the experiment. According to the structural characteristics of the storage tank, acceleration sensors were arranged at the pile foundation, the bearing platform, the height of the center of mass, and the dome, and the displacement sensor was arranged at the bottom of the dome. Figure 2a is the test model of the storage tank, and Figure 2b is the actual layout of the acceleration sensor. The acceleration sensor selected for the test was Endevco 7290E (Endevco Corporation, Irvine, CA, USA); the acceleration range that can be tested was ±10 g. The Endevco 7290E is a rugged, variable capacitance accelerometer with integral electronics for voltage regulation, filtering, and signal amplification.

2.2. Seismic Wave Selection

In the shaking table test, the ground motion is input in the form of base acceleration. In this paper, the prototype of test tank is located in a Class II site. Based on seismic codes for building structures [25] and design codes for large oil storage tanks [26], the selected seismic waves should be close to the natural period of the site where the structure is located to increase the seismic response of the structure. Three natural seismic waves and one artificial wave were selected for experiment, namely the El Centro wave, Taft wave, Wolong wave and Artificial wave, which satisfies the wave selection requirements of seismic waves. The time history curve of the seismic wave is shown in Figure 3. During the experiment, the peak values of seismic wave acceleration were adjusted to 0.1 g, 0.25 g, 0.5 g and 0.75 g, respectively. Since the storage tank model is scaled from a large storage tank, the time of the seismic wave needed to be scaled, and the time interval was compressed to 1/5 of the original seismic record. The test conditions were carried out according to the peak acceleration from minor to large. To determine the changing pattern of the dynamic characteristics of the LNG storage tank, the natural vibration characteristics of the storage tank model were obtained by white noise scanning before the start of the shaking table test and after the application of seismic waves at all levels. The arrangement of test conditions is shown in Table 1.

2.3. Design of Lead-Core Rubber Bearing

Using MATLAB software to analyze the frequency spectrum of the seismic wave after compression time, the predominant periods of the El Centro wave, Taft wave, Wolong wave and Artificial wave were 0.125 s, 0.134 s, 0.078 s and 0.067 s, respectively. In order to avoid the resonance phenomenon of the test tank, the isolation period should be far from the seismic predominant period. A lead-core rubber bearing is arranged between the test tank and the pile foundation, and the parameters of them are shown in Table 2.
The calculation formula of the isolation period is as follows [27]:
T i s o = 2 π M i + M s K i s o
Total stiffness of horizontal isolation layer K i s o is:
K i s o = n k i s o
M i = tanh [ 0.866 ( D / h w ) ] 0.866 ( D / h w ) M l
where: T i s o is the isolation period; K i s o is the horizontal stiffness of the isolation layer; M i is the mass of the liquid that moves with the tank; M s is the mass of the tank; k i s o is the equivalent stiffness of a single lead-core rubber bearing; D is the diameter of the inner tank; h w is the height liquid storage, its value is 0.75 m; and M l is the total mass of the liquid.
Taking the equivalent stiffness of a single isolation bearing in Table 2 into Equation (2), and then from Equation (1), the isolation period can be obtained as 0.967 s, which is distant from the predominant period of the input seismic wave. This preliminarily indicates that it is reasonable to choose lead rubber bearing.

3. Analysis of Test Results

3.1. Natural Vibration Characteristics

The dynamic characteristics of the tank model will change somewhat after being excited by seismic waves subjected to different peak accelerations. By processing the data in the condition of white noise, the natural vibration frequency of the tank model can be obtained, as shown in Table 3.
It can be seen from Table 3 that:
(1)
After seismic isolation measures are taken, the natural vibration frequency of the tank model is significantly reduced. Before the seismic wave is applied, along the X-direction, the frequencies of the seismic storage tank and the seismic isolation tank are 16.8 Hz and 7.0 Hz. After the seismic isolation, the frequency of the storage tank decreases by 9.5 Hz, with a decrease of 56.5%. Along the Y-direction, the frequencies of the seismic storage tank and the isolation storage tank are 16.1 Hz and 7.0 Hz, and the frequency of the storage tank is reduced by 9.1 Hz after isolation, with a decrease of 56.5%. This shows that the isolation bearing has the same effect on the natural vibration frequency of the tank in the X- and Y-directions.
(2)
With the increase of peak acceleration of the seismic wave, the natural vibration frequency of the seismic storage tank and the seismic isolation storage tank decreases gradually. This indicates that the tank was damaged, and that the damage was progressive. After the test, along the X-direction, the natural vibration frequencies of the seismic storage tank and the isolation storage tank decreased by 1.8 Hz and 0.9 Hz, respectively; along the Y-direction, the natural vibration frequencies of the seismic storage tank and the isolation storage tank decreased by 2.5 Hz and 1 Hz, respectively. This indicates that the damage degree of the isolation storage tank is smaller than that of the seismic storage tank.

3.2. Acceleration Response
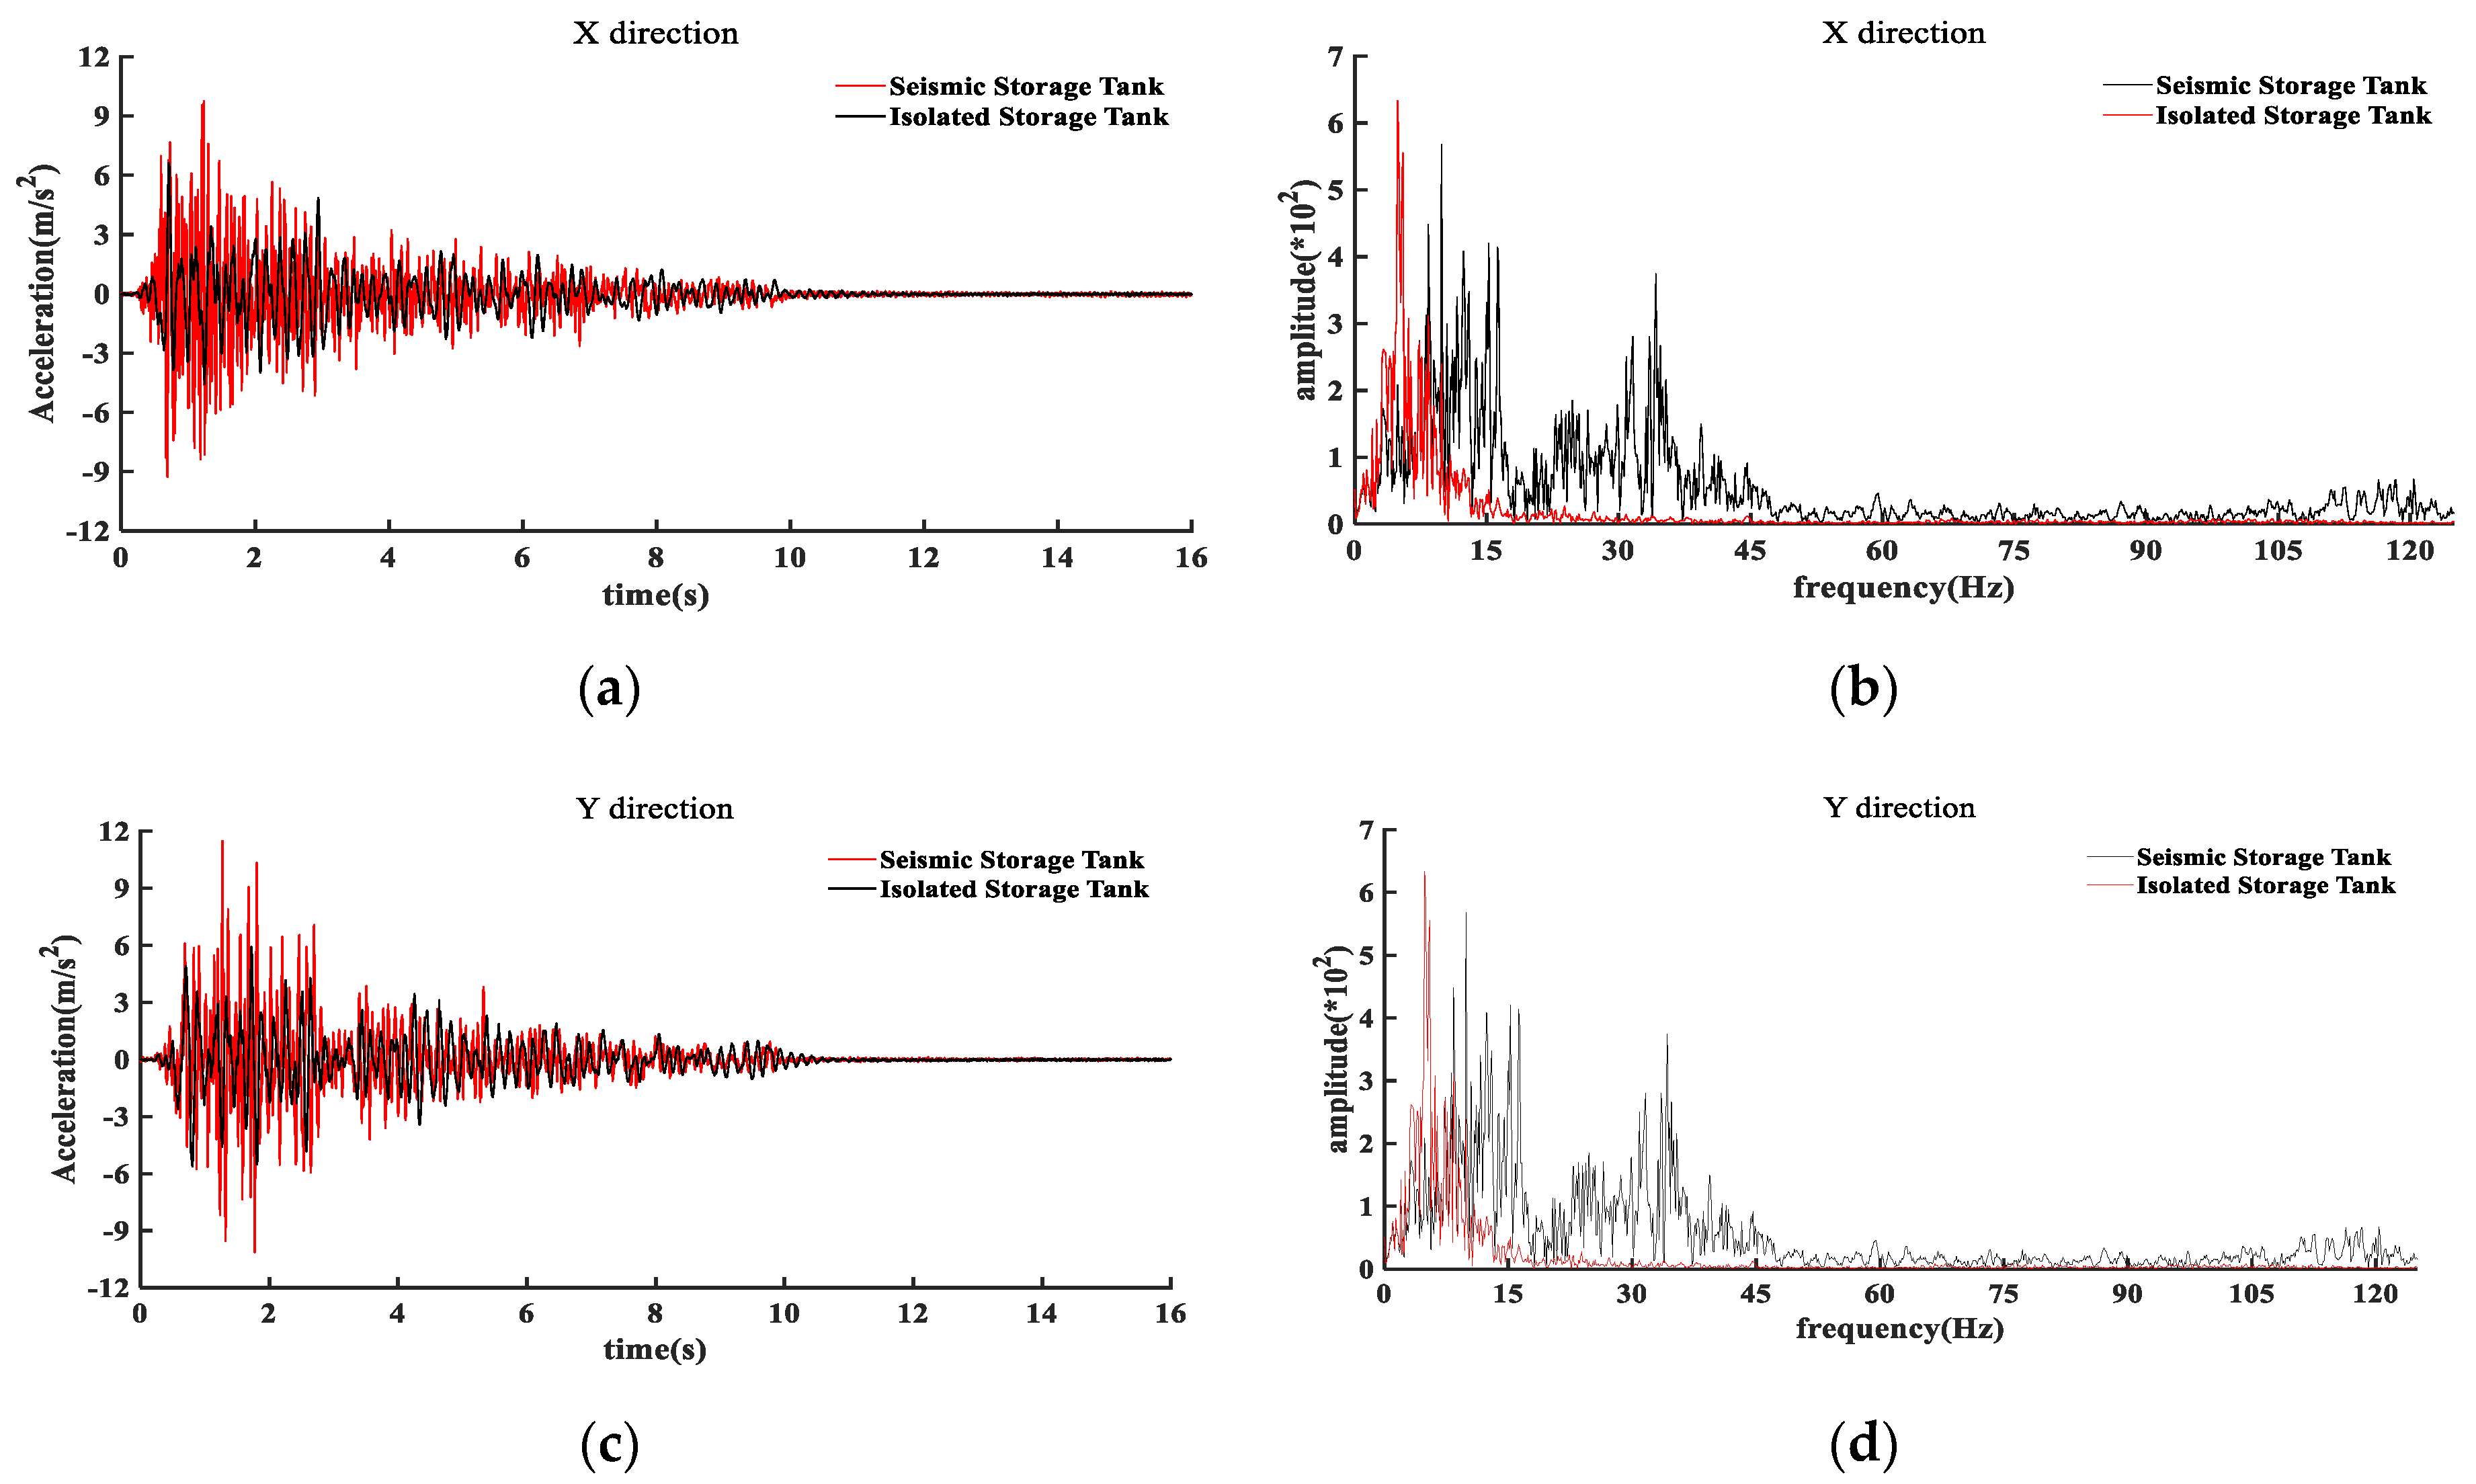
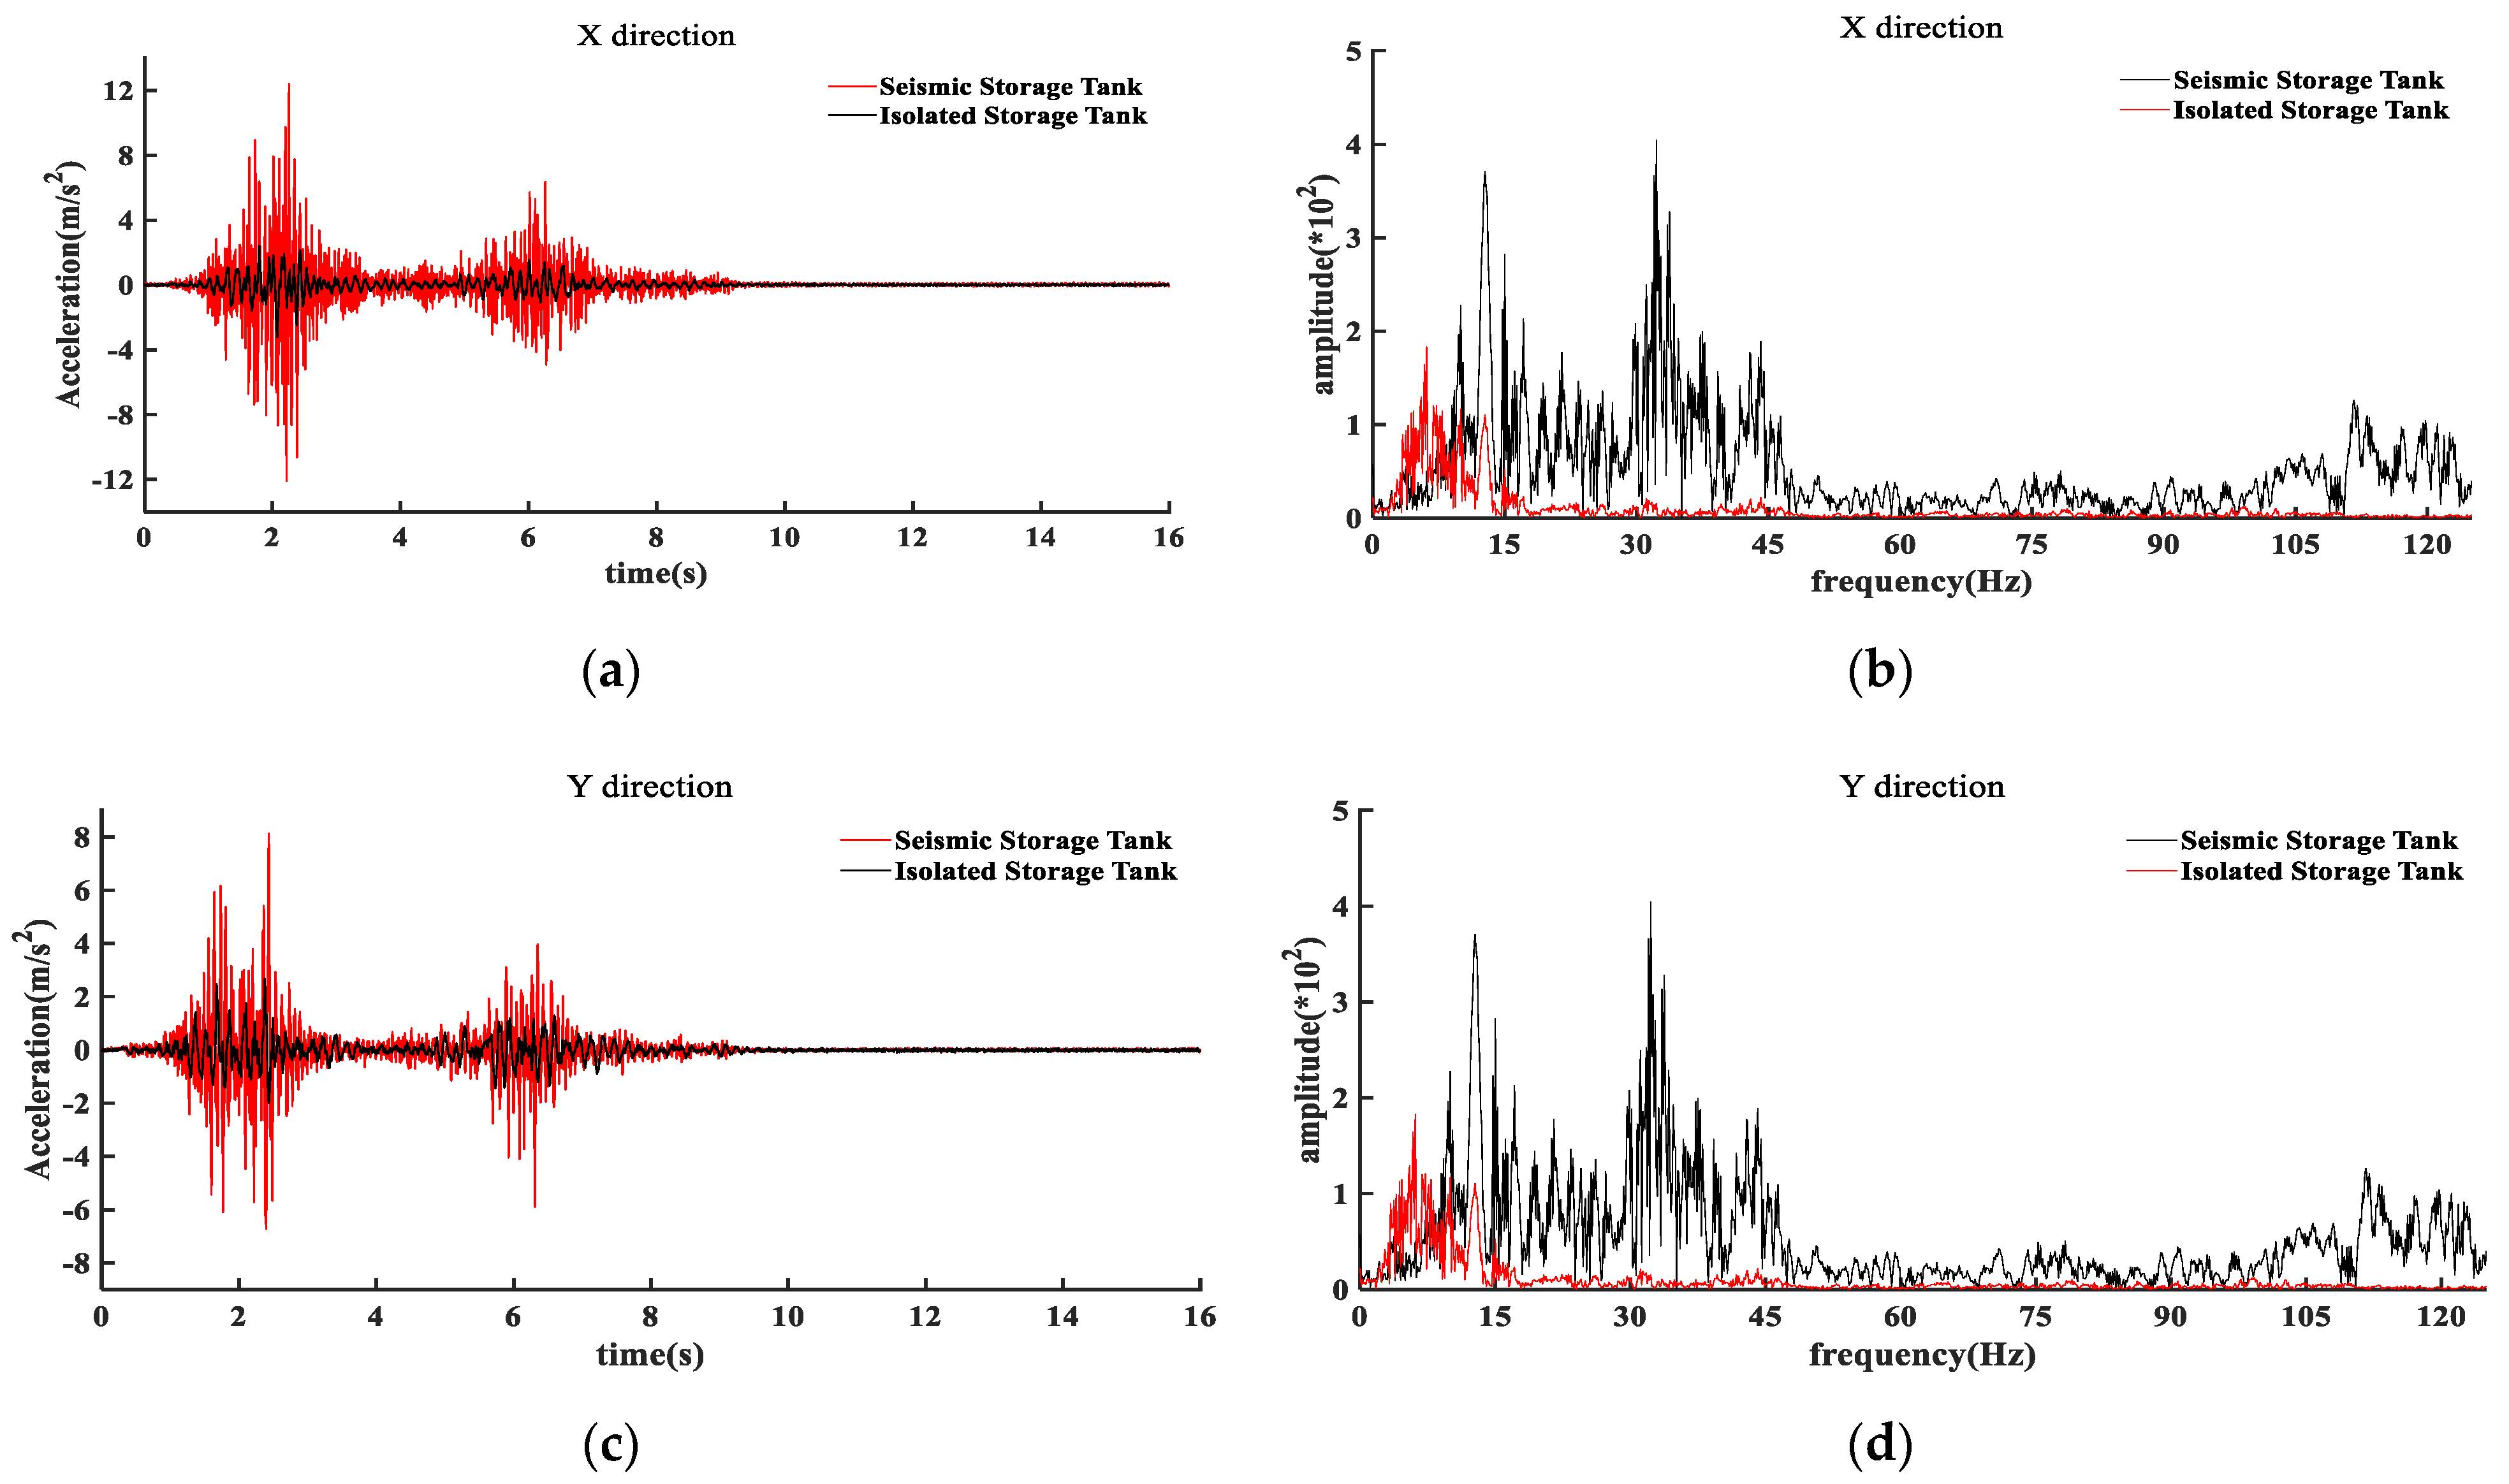
In this paper, the data collected under the action of seismic waves with peak accelerations of 0.5 g and 0.75 g are selected to analyze acceleration responses and their differences between the seismic storage tank and the isolation storage tank. By extracting the peak acceleration of the measurement points, and the results shown in Figure 4 and Figure 5 can be obtained. As can be seen from the figure:
(1)
The acceleration of the seismic storage tank approximately increases linearly along the direction of height, and the acceleration will change abruptly at the dome position, which indicates that the lateral stiffness of the dome position is much lower than that of the tank wall. After the seismic isolation measures are taken, acceleration response of the storage tank is significantly reduced. In the direction of seismic wave action, the isolation effect is particularly obvious. Under the action of the Wolong wave (XYZ, 0.75 g), the maximum acceleration of the seismic storage tank and the isolation storage tank are 20.68 m/s2 and 8.92 m/s2, respectively, and the isolation rate reaches 56.9%.
(2)
With the increase of peak acceleration of the seismic wave, the acceleration of the seismic storage tank and the isolation storage tank also increases. Compared with the Taft wave (XZ direction) condition, when the PGA is 0.50 g, the maximum accelerations of the seismic storage tank and the isolation storage tank are 13.62 m/s2 and 2.25 m/s2, respectively; when the PGA is 0.75 g, the maximum accelerations of the seismic storage tank and the isolation storage tank are 17.93 m/s2 and 4.21 m/s2, respectively. This is because of the arrangement of lead-core rubber bearings in the isolation tank, so the increase of the acceleration of the isolation storage tank is not as obvious as that of the seismic tank.
The above only compares the peak accelerations of the seismic and the isolation storage tanks. In order to visualize how their acceleration changes, the acceleration time history curves of measuring point 5 and measuring point 17 are selected for comparative analysis in the time domain and frequency domain. Figure 6 and Figure 7 are the acceleration time history curve and the corresponding spectrum curve under the action of the Taft wave (XYZ direction, 0.75 g) and the Wolong wave (XYZ direction, 0.75 g), respectively. It can be seen from the comparison of acceleration time history curves that the acceleration response of the isolation storage tank is smaller than that of the seismic storage tank, which indicates that the lead-core rubber bearing has a good seismic isolation effect. Comparing Figure 6a with Figure 6c and Figure 7a,c, it is also found that the seismic isolation effect of lead-core rubber bearing is related to the seismic wave. Under the action of the Wolong wave (XYZ direction, 0.75 g), the isolation efficiency of lead-core rubber bearing is 74.8% (X-direction) and 68.0% (Y-direction), respectively; under the action of the Taft wave (XYZ direction, 0.75 g), the isolation efficiency of the lead-core rubber bearing is 33.2% (X-direction) and 48.5% (Y-direction), respectively.
Comparing spectral characteristics of the acceleration response, it can be seen that the spectral curve of the seismic storage tank has two obvious peaks, while the spectral characteristic curve of the isolation storage tank has only one peak. Under the action of the Taft wave (XYZ direction, 0.75 g), the two peaks of the seismic storage tank are located around 13 Hz and 32 Hz, respectively, and the peak value of the isolation tank is located around 6 Hz. Under the action of the Wolong wave (XYZ direction, 0.75 g), the two peaks of the seismic storage tank are located around 10 Hz and 35 Hz, respectively, and the peak value of the isolation tank is located around 7 Hz. This shows that the lead-core rubber bearing can significantly suppress the high-frequency components in seismic waves.

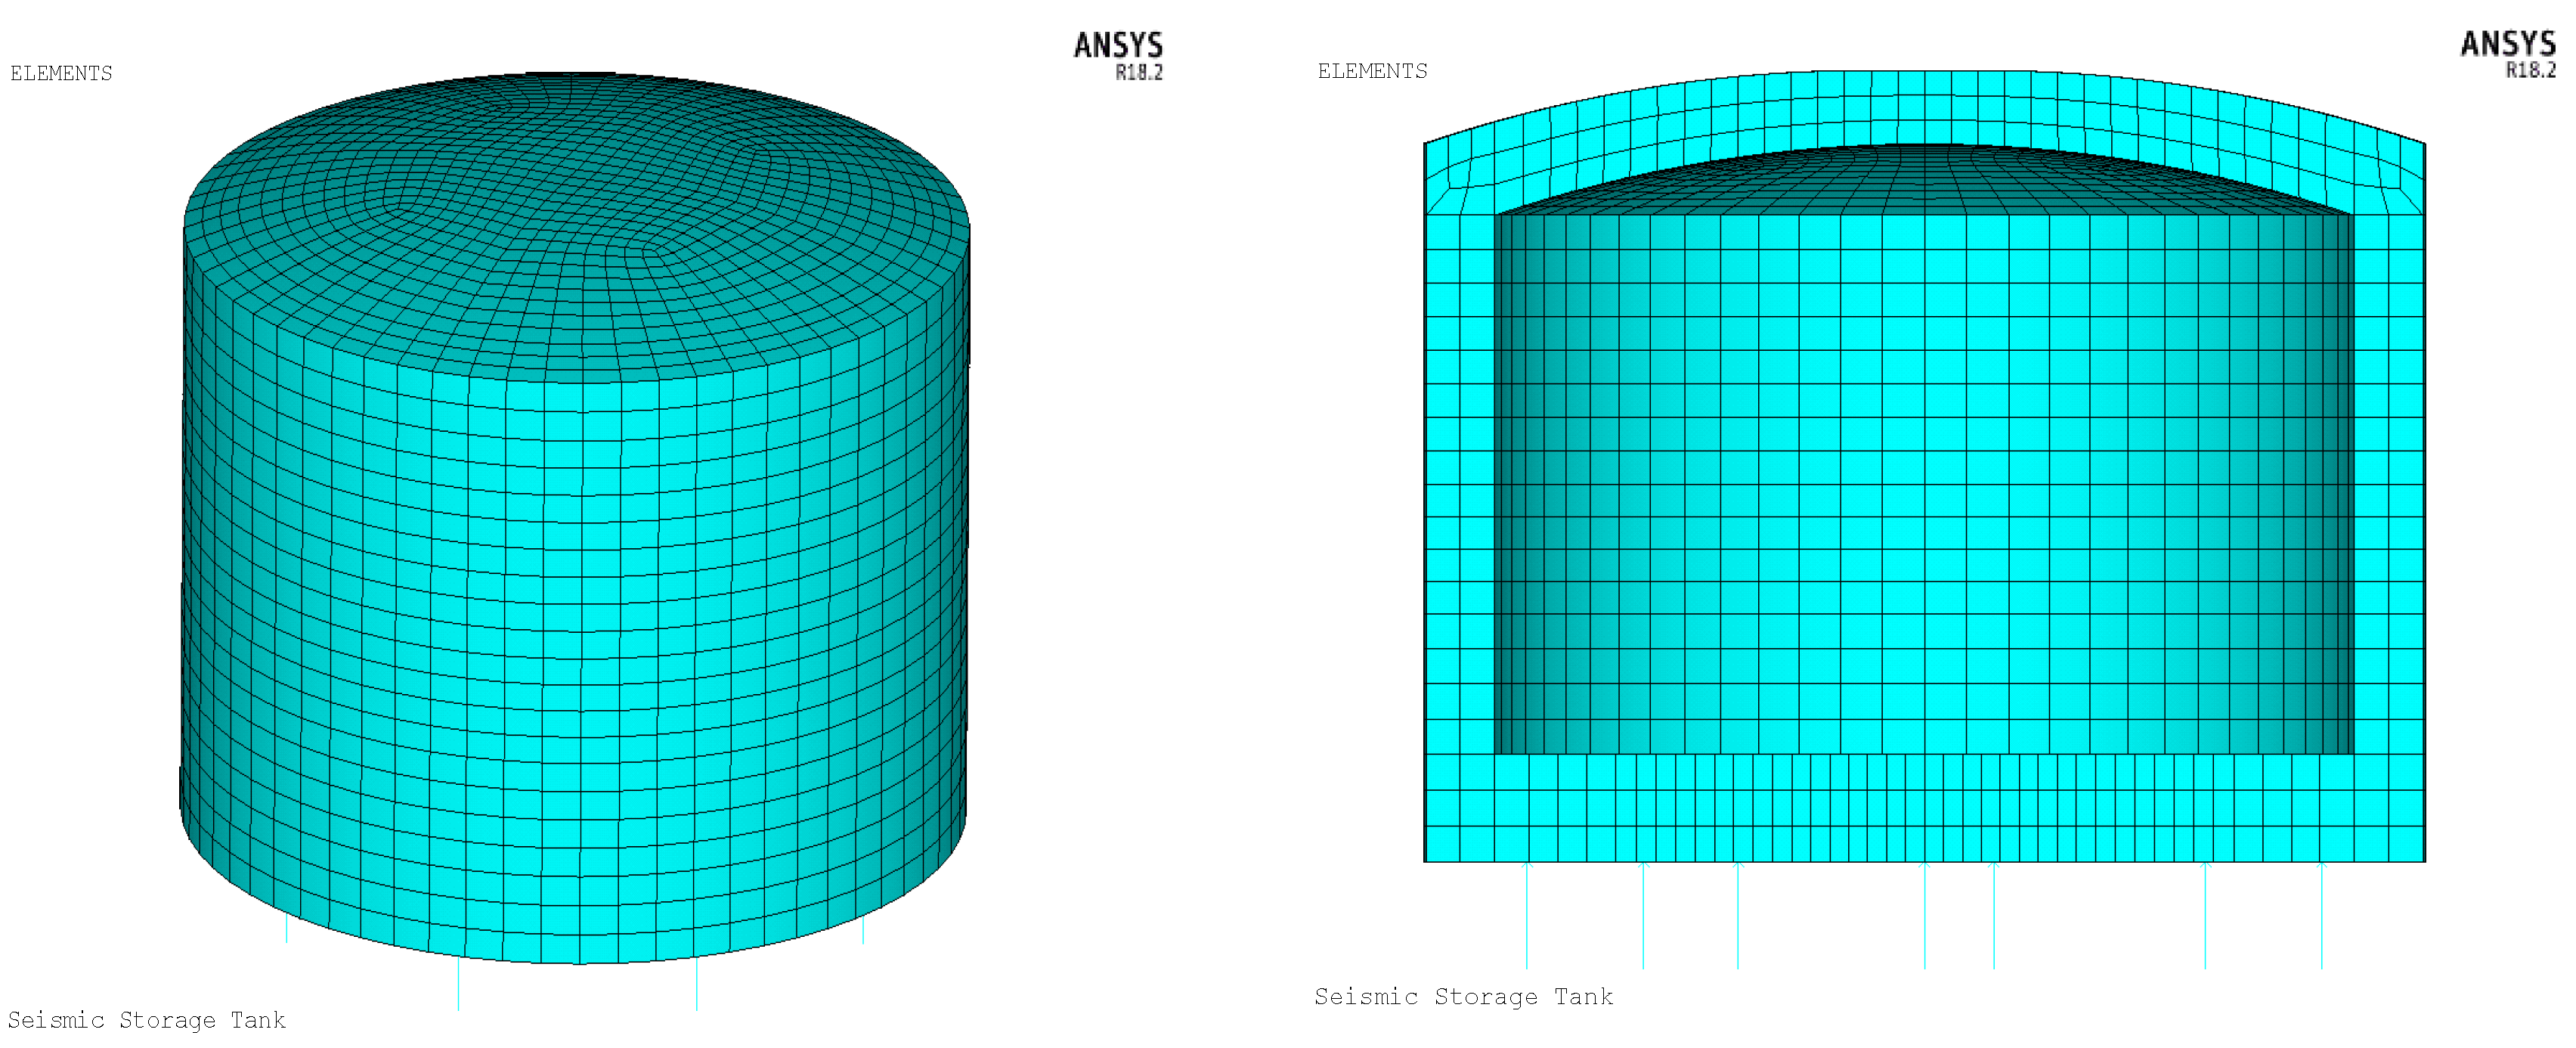
3.3. Numerical Simulation of Experimental Tank Model
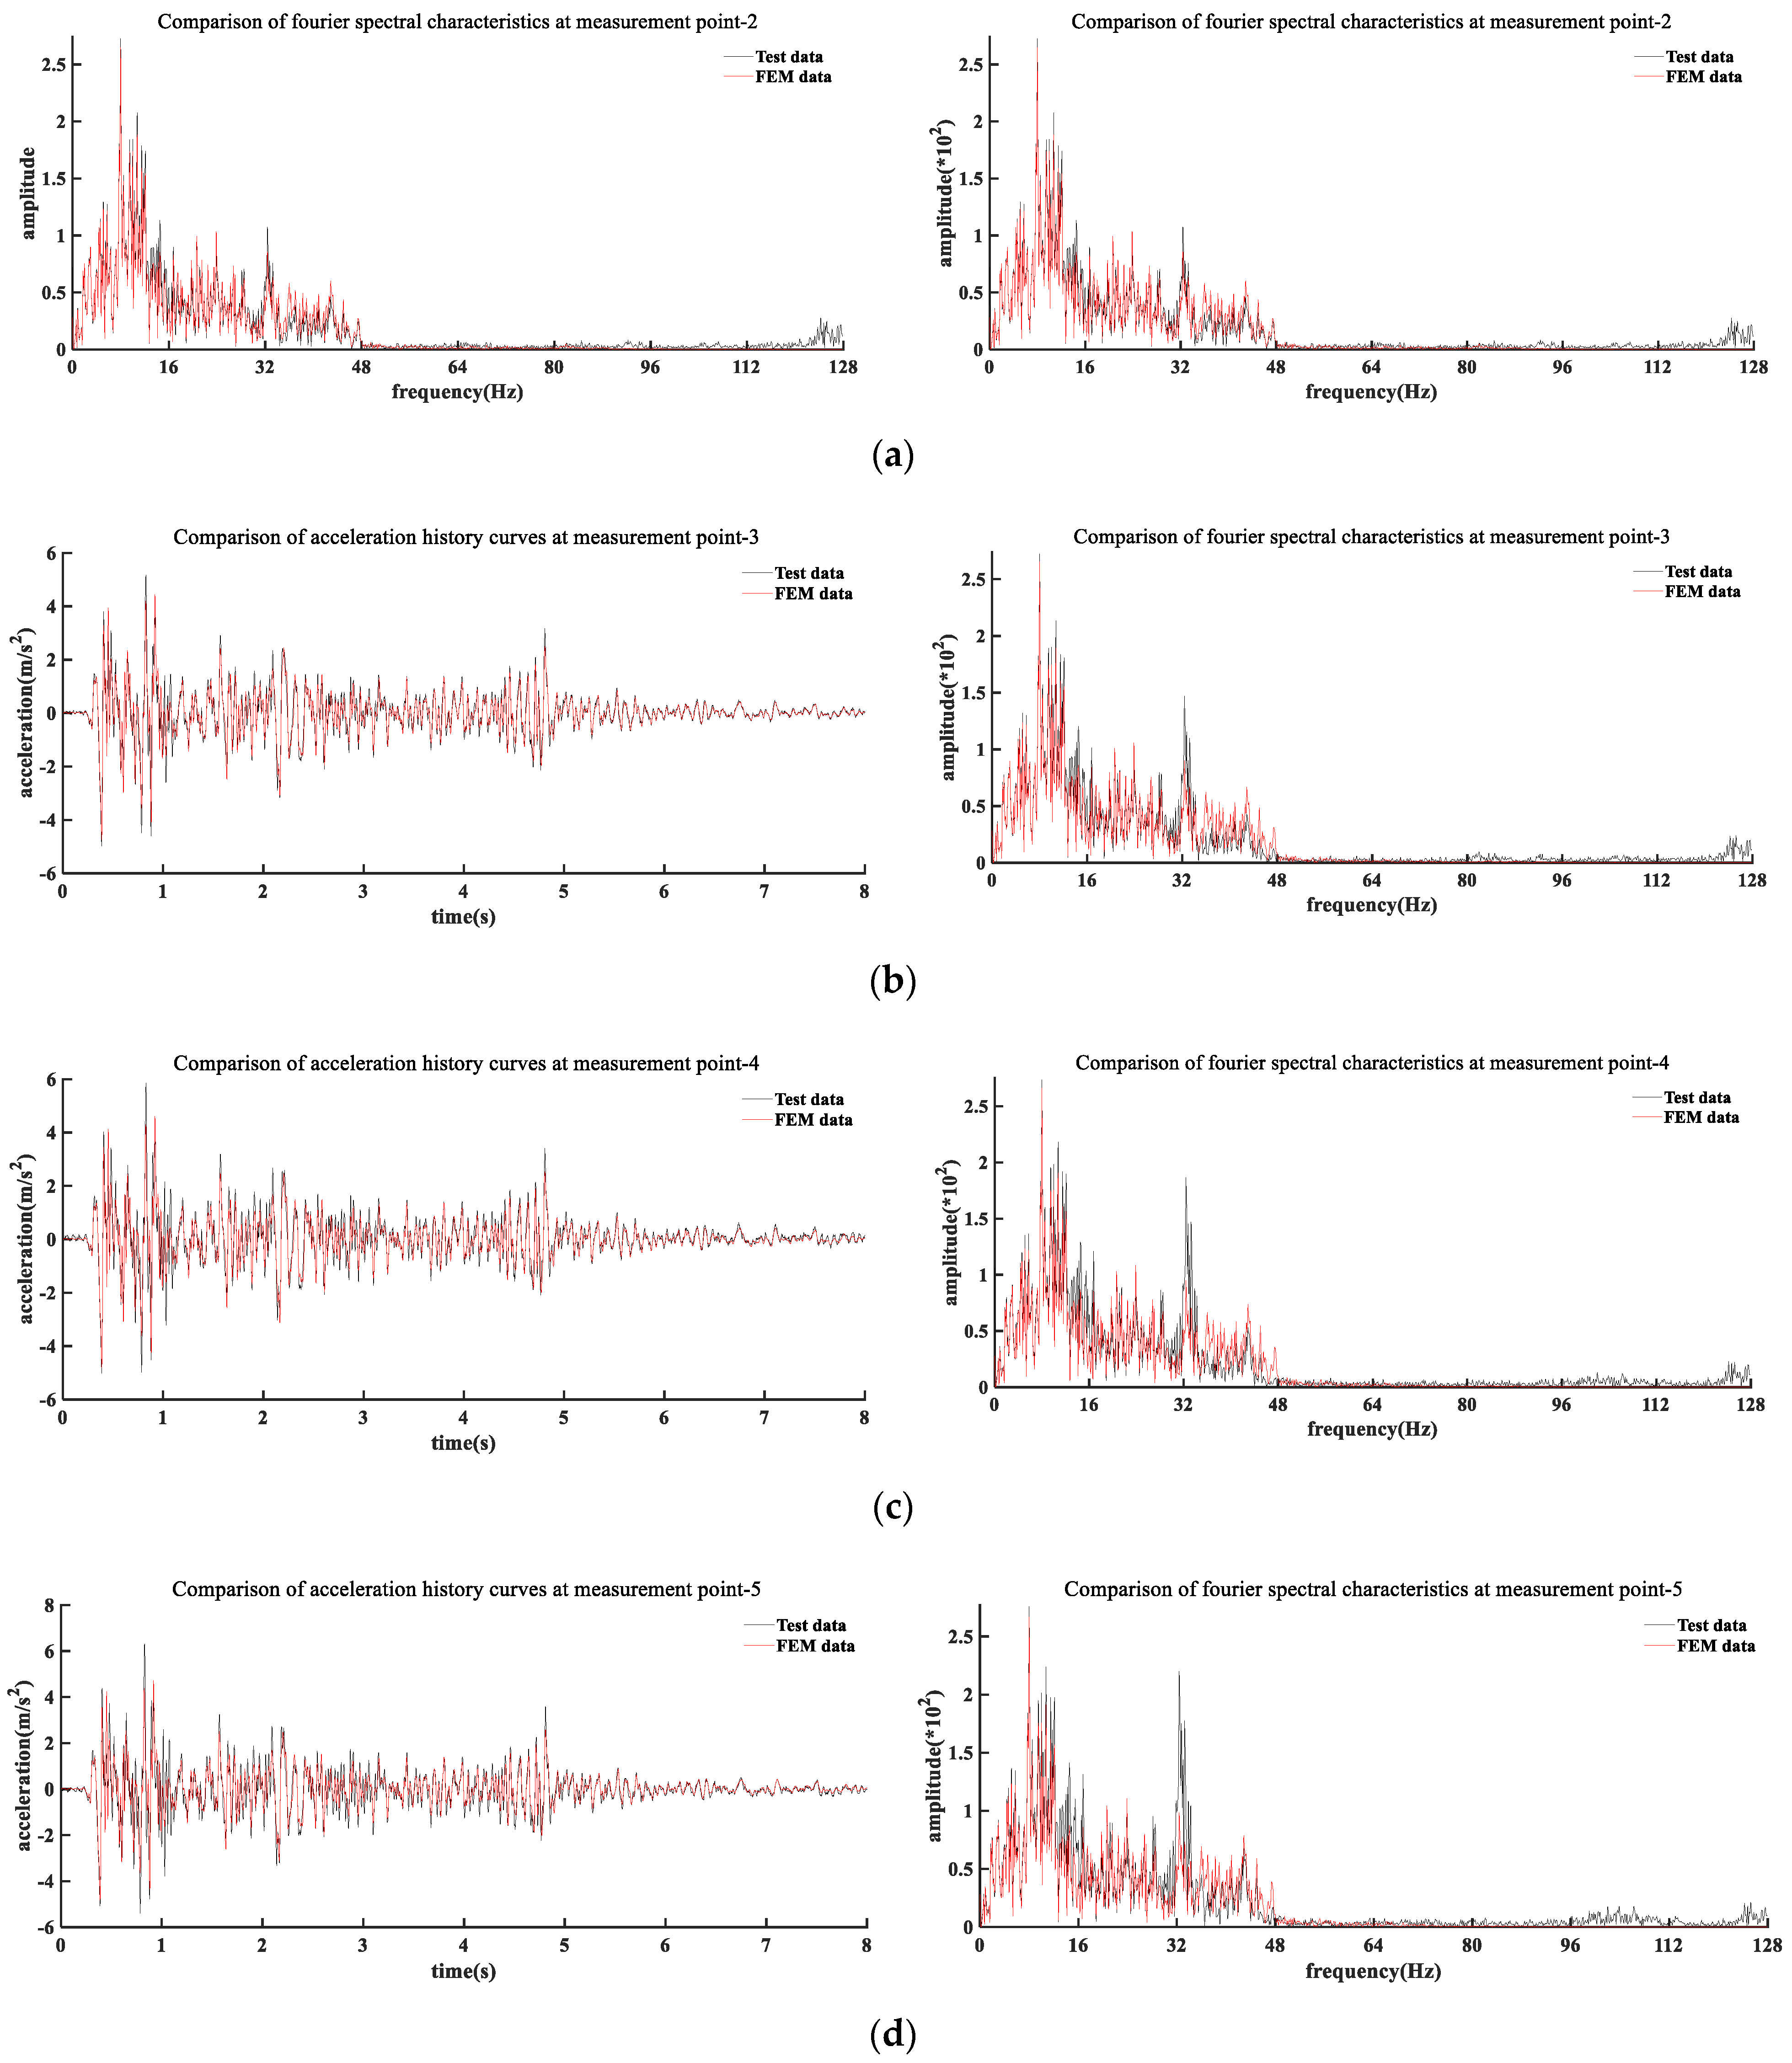
ANSYS software was used to simulate the experimental storage tank model, and the differences between the numerical results and the experimental results are compared to verify the validity and reliability of the finite element model, paving the way for further study on seismic performance of large LNG storage tanks. The bilinear kinematic hardening model was used for the concrete outer tank, dome and pile foundation. The material parameters of the numerical model are based on those of the test tank, and the parameters of the lead-core rubber bearing are shown in Table 2. The storage tank is simulated by the SOLID186 element. The pile foundation is simulated by the BEAM188 element. The contact element is used for connection between the pile foundation and the storage tank. Zhang et al. [12,28,29,30] have conducted in-depth research on the numerical simulation of LNG storage tanks. Their article gives detailed information about the meshing method and mesh element selection. The results show that by dividing two elements along the thickness direction and ensuring that the element shape is a cube as much as possible, the simulated results can have high computational accuracy. Therefore, the finite element model of the LNG storage tank in this paper was divided into 2 elements in the thickness direction, 64 elements in the hoop direction, and 21 elements in the height direction; the mapped meshing method was used for the mesh division. The selected element is SOLID186 element, which is a high-order element with 20 nodes and three degrees of freedom, with a total of 10,169 elements.
In the element library of ANSYS, there is no element that can directly simulate the mechanical properties of lead-core rubber isolation bearings. Therefore, it is necessary to simplify the mechanical properties of the isolation bearing and conduct a reasonable simulation according to mechanical behavior of the isolation bearing. The lead-core rubber bearing has good hysteresis performance and can be simulated by a bilinear model. The mechanical properties of the lead-core rubber bearing in the horizontal and vertical directions are very different. The lead-core rubber bearing will yield in the horizontal direction, but will not yield in the vertical direction. According to this characteristic, nonlinear spring (Combin40) and linear spring (Combin14) are used to simulate the horizontal and vertical performances of the lead-core rubber bearing, respectively.
The basic parameters of lead rubber bearings are: stiffness before yield K1, stiffness after yield K2, yield load Q, and damping ratio. The main real constants of COMBIN40 element are: Ku (stiffness before yielding), C (damping coefficient), M (mass), GAP (gap size), FSLID (shear force at yield), and Kd (stiffness after yielding). COMBIN40 is a two-stage spring. When the limit force (FSLID) is reached, K1 does not work, and the stiffness becomes K2. If there is no K2, it is equivalent to the spring being pulled off, so the COMBIN40 can simulate the bilinear model.
A lead-core rubber bearing consists of three spring elements, COMBIN40 (X-direction), COMBIN40 (Y-direction) and COMBIN40 (Z-direction), where the COMBIN40 element in the X- and Y-directions should consider the bilinear model. When establishing three spring elements, the thickness of the lead-core rubber support can be ignored, and the node positions of the elements can be coincident. Then, the direction of spring element can be specified by changing the key option of the spring element. When the element is established, the nodes of spring element are coupled with the SOLID186 element simulating the bearing platform. The other end nodes of the horizontal spring in X- and Y-directions constrain all the degrees of freedom, and the other end nodes of the Z-direction spring element couple the degrees of freedom with the upper node of the BEAM188 element that simulates pile foundation. The established numerical model of the test storage tank is shown in Figure 8.
In order to make the seismic waves input by the numerical model consistent with the seismic waves input by the test, the acceleration time history record of the shaking table is used as the seismic excitation of the numerical model. Considering that there are many experimental conditions, some experimental conditions are selected for numerical simulation to compare experimental results and numerical calculation results. This paper takes the El Centro wave as an example.
We selected the measuring points located on the side wall of the outer tank to compare the results, namely measuring points 2~5 and measuring points 10~13. Figure 9 shows the comparison of acceleration time history curve and spectral characteristics of the seismic storage tank and the corresponding numerical model, and the following conclusions can be drawn:
(1)
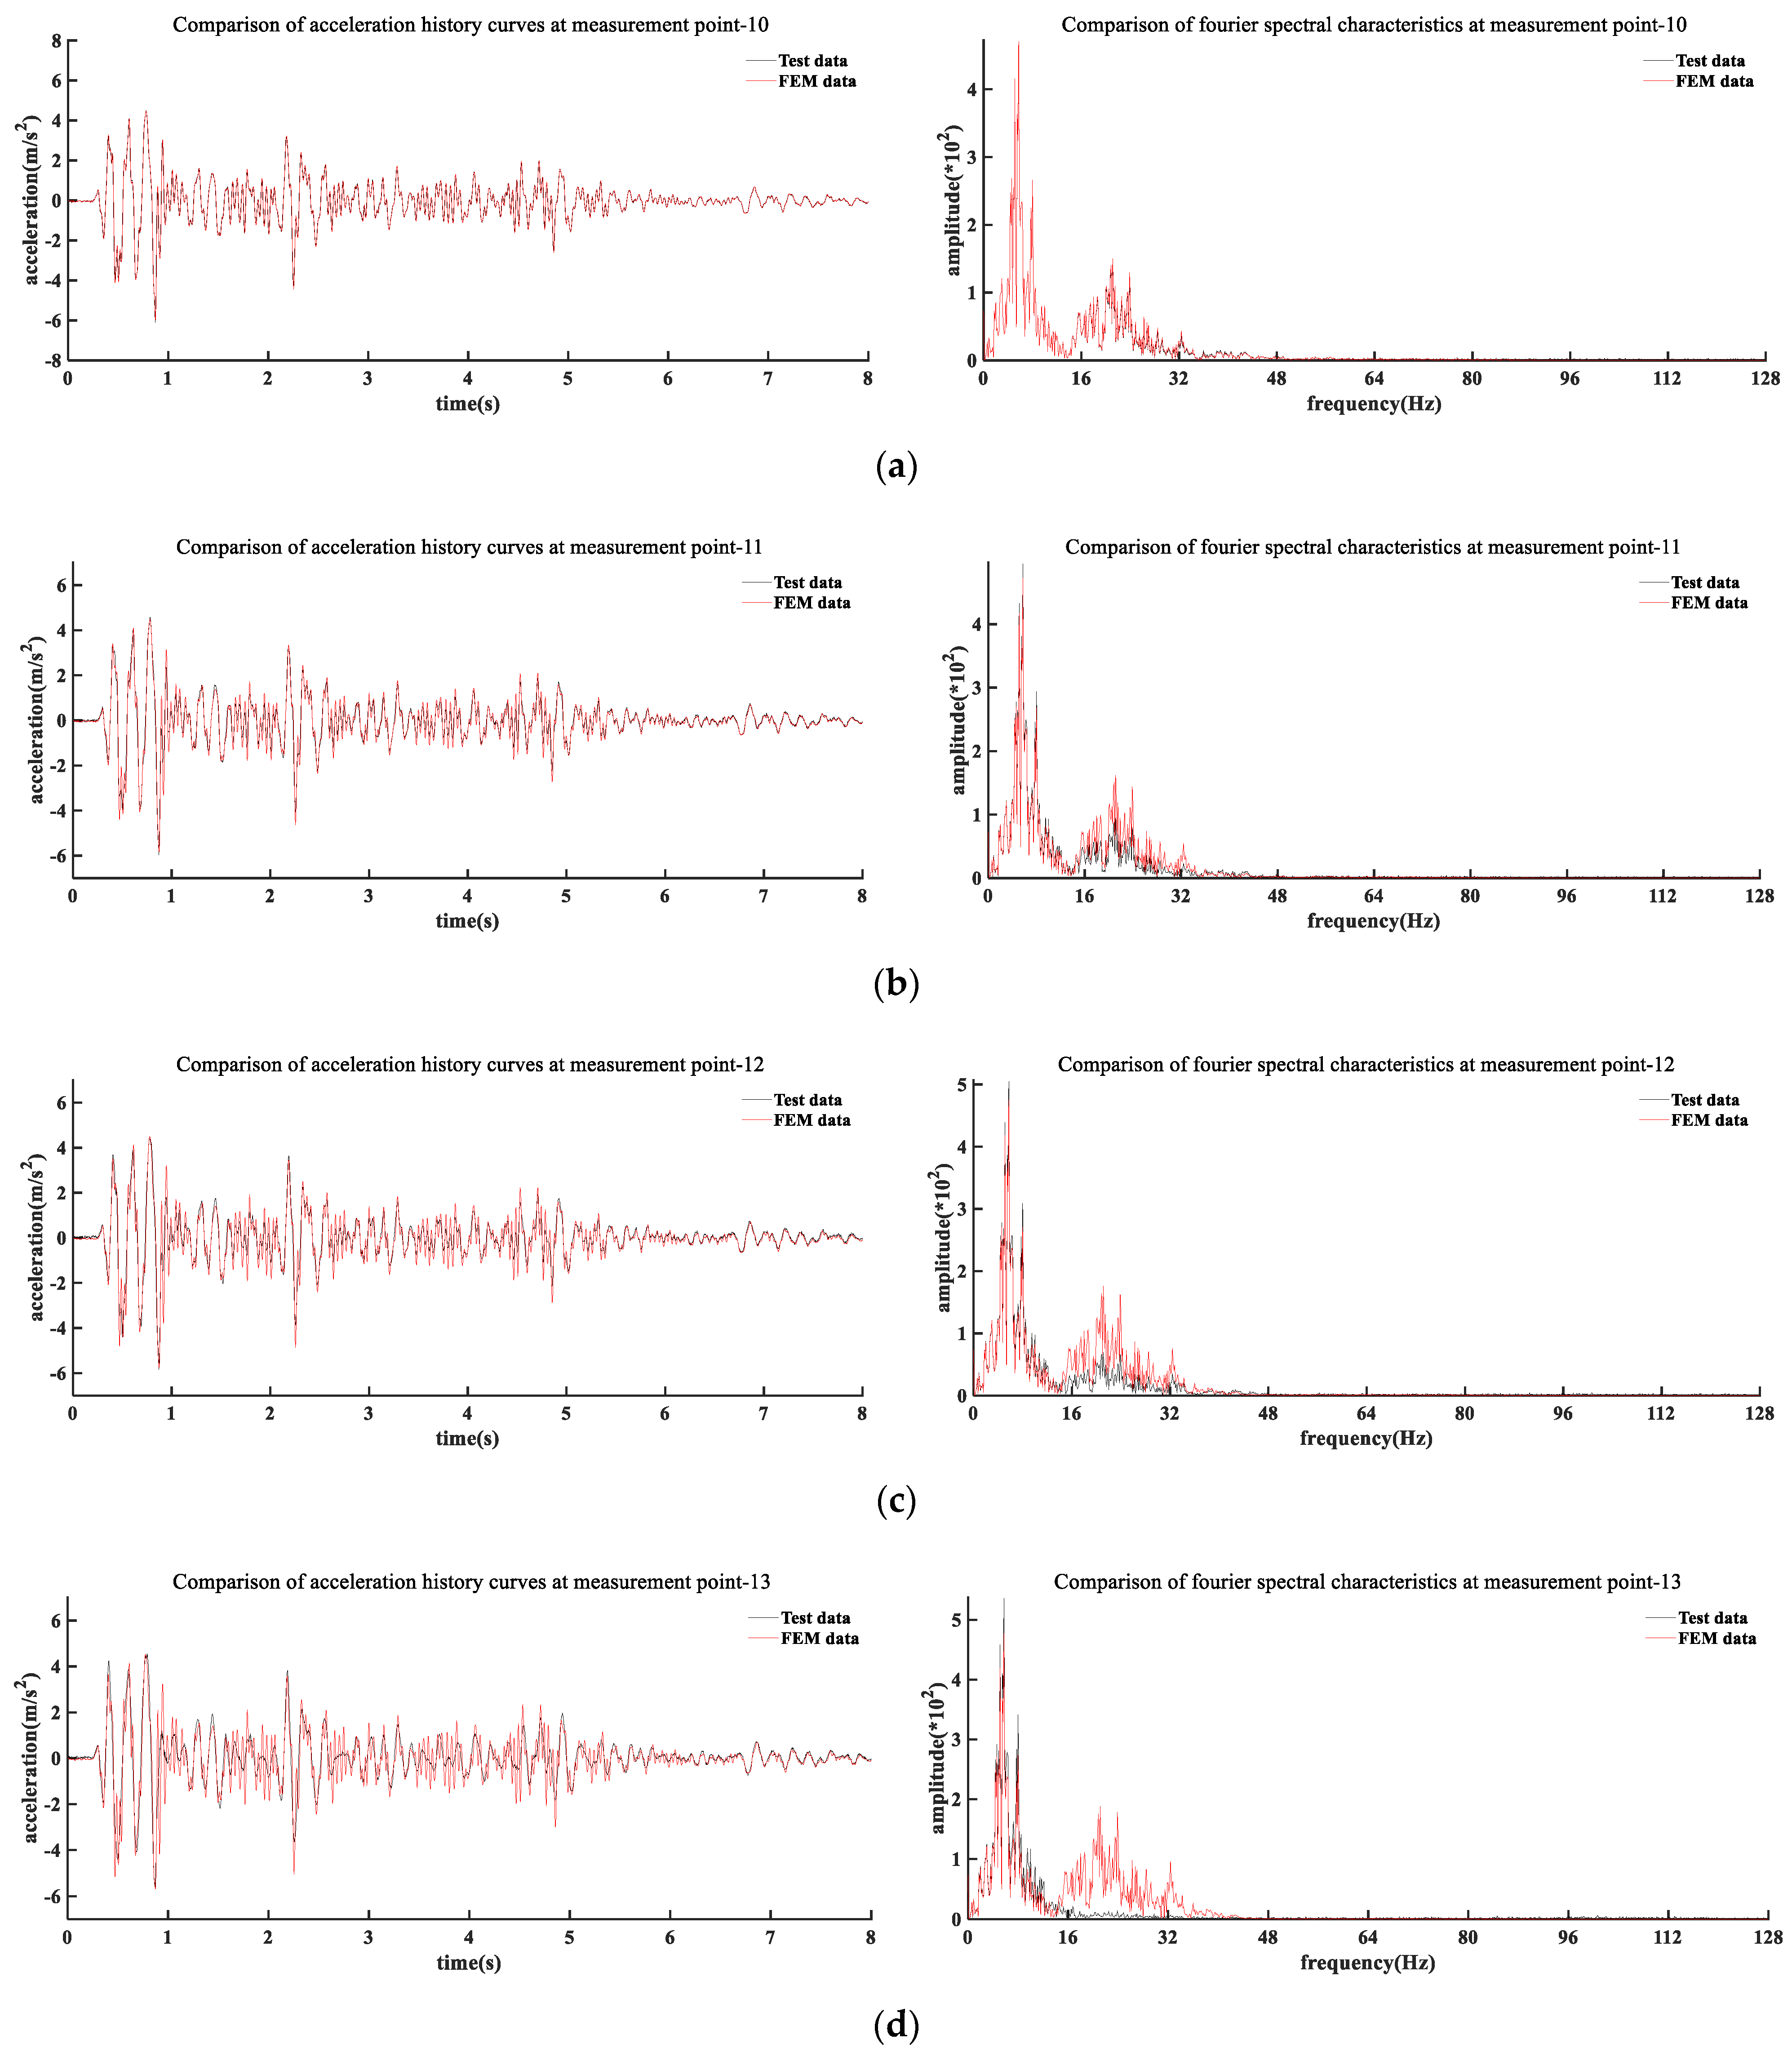
Comparing the acceleration time history curve, it can be seen that the acceleration responses of them are very close. As the height of the measuring point increases, the amplitude difference among the results of them increases, but the changing trend of the acceleration response is consistent. This shows that the calculation results of the numerical model can reflect the acceleration response of the seismic storage tank.
(2)
Comparing the spectral characteristic curves, it can be seen that the spectral characteristic curves of the two are not much different, especially in the range of 0~30 Hz; indeed, the results of the two are almost the same. The spectral characteristic curves of the seismic storage tank and the numerical model have two obvious peaks, and the peak points are located around 8 Hz and 32 Hz, respectively. The first peak corresponds exactly to the predominant frequency of the El Centro wave. Furthermore, as the height of measuring point increases, the second peak becomes more pronounced. From the comparison in the frequency domain, the calculation results of the numerical model can also reflect the spectral characteristics of the acceleration response of the seismic storage tank.
Figure 10 shows the comparison of acceleration time history and spectral characteristics of the isolation storage tank and the numerical model. It is similar to the results of the seismic tank; however, there are some differences, mainly in the spectral characteristics. There are still two obvious peaks in the acceleration spectrum characteristic curve of the seismically isolated storage tank. Compared with the seismic storage tank, the amplitude of the second peak of the isolation storage tank is significantly reduced. This may be due to the introduction of lead-core rubber mounts to the tank, which reduces the high-frequency vibration of the tank.
Based on the numerical simulation analysis of the test tank, it can be confirmed that the seismic response of the numerical simulation results is close to that of the test results, and the fitting degree of their spectral characteristic curves is also very good, which verifies the rationality and effectiveness of the numerical model. The numerical model of this paper can be used for seismic response analysis of large LNG storage tanks.

4. Numerical Simulation Analysis of Large LNG Storage Tank

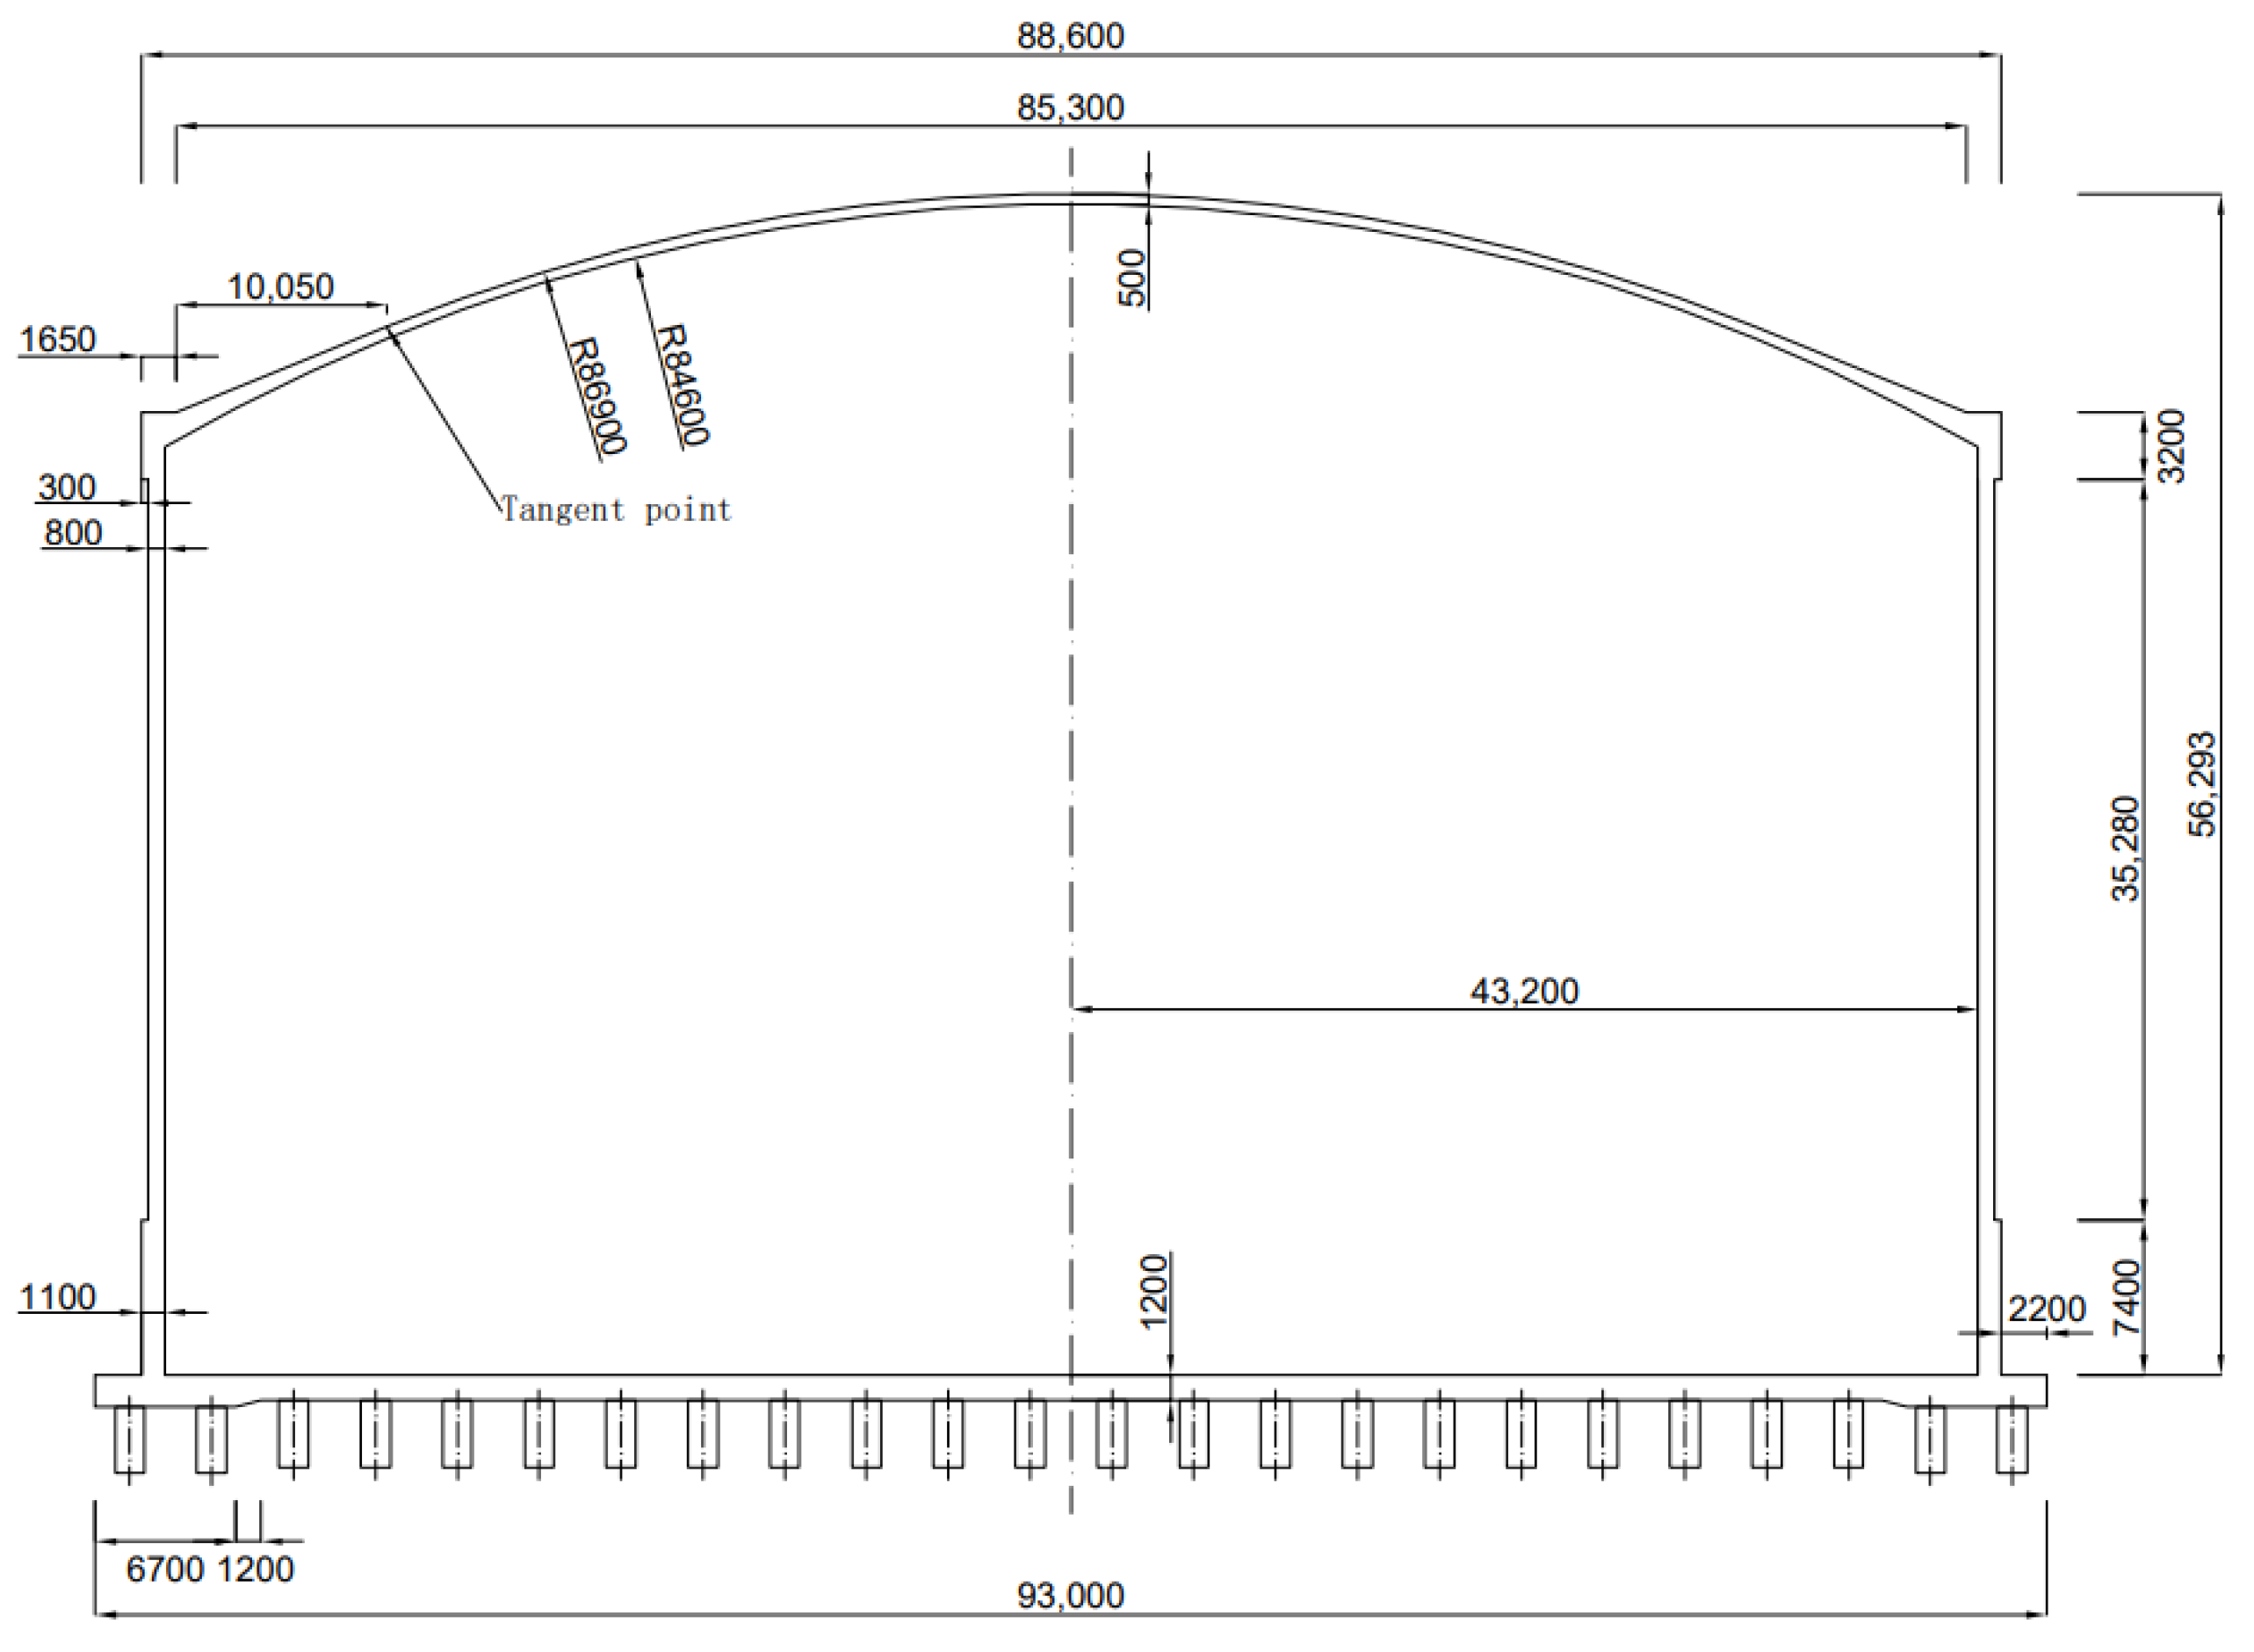
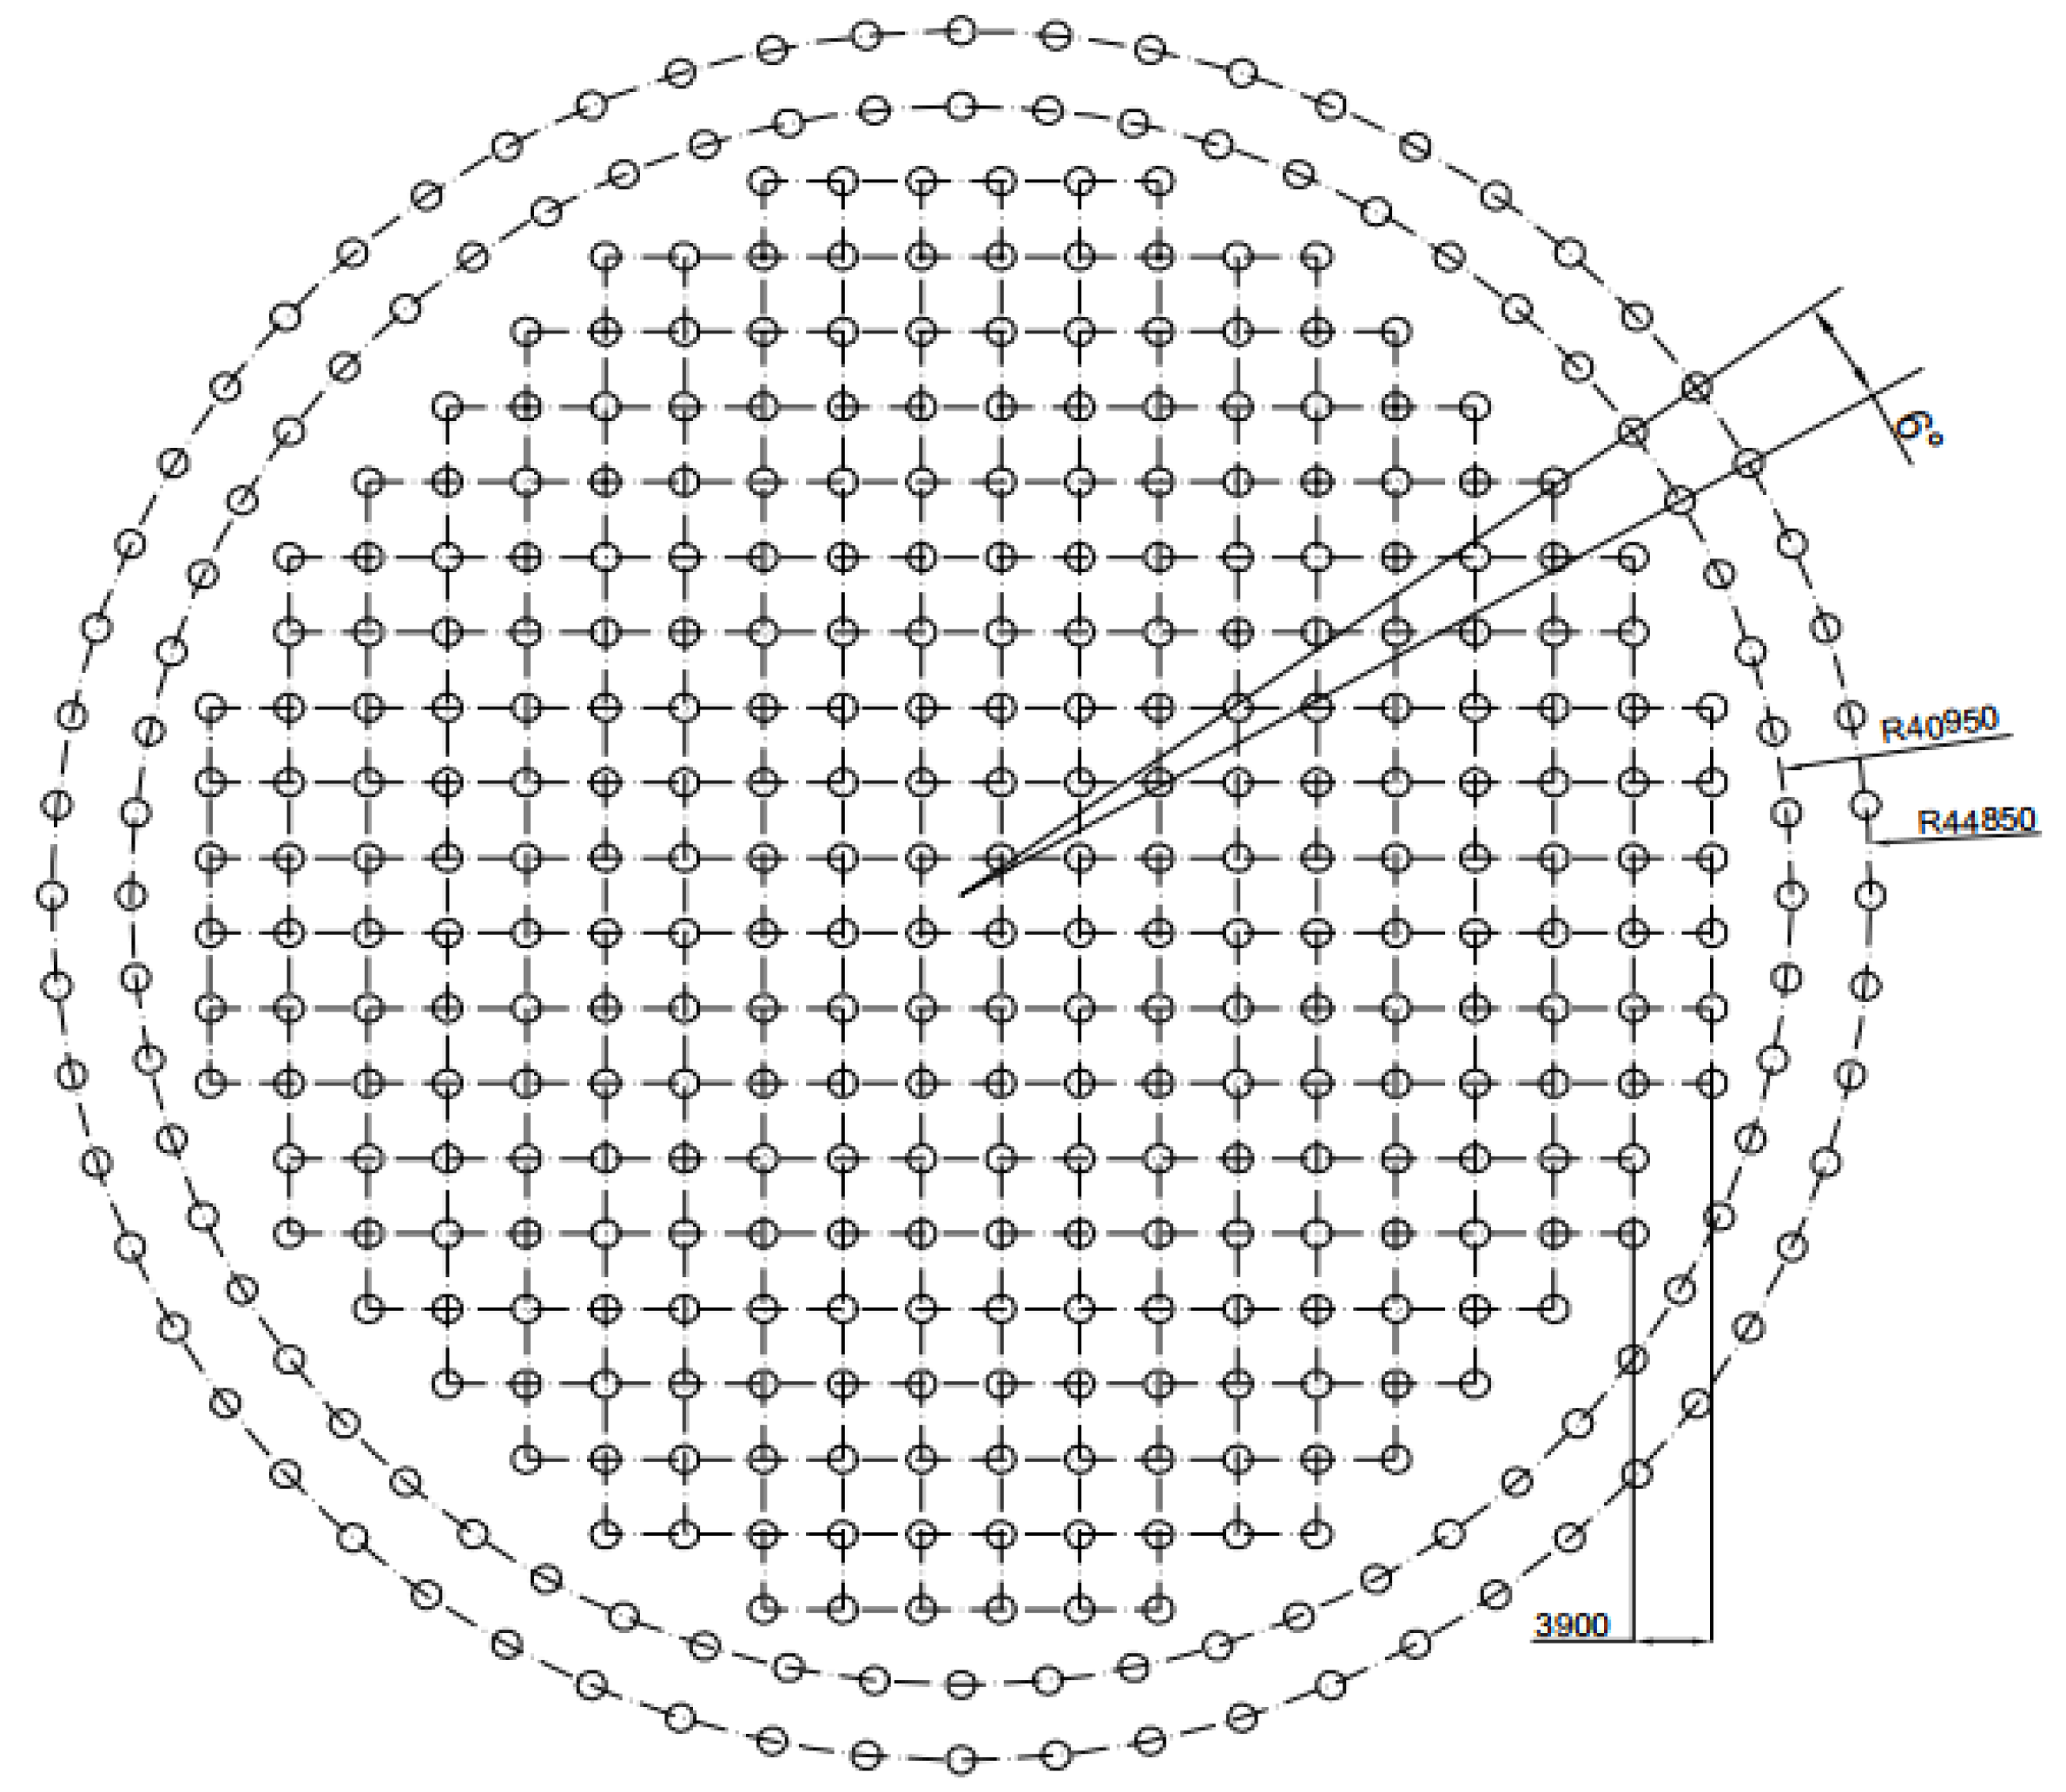
4.1. Introduction of Large LNG Storage Tank

ANSYS software was used to establish a numerical model of a large 200,000 cubic LNG storage tank in this paper. The inner diameter of the outer tank is 86.4 m, the height of the outer tank wall is 42.68 m, the thickness of the bottom and top of the outer tank wall is 1.1 m, and the thickness of the middle part is 0.8 m. The thickness of the dome is 0.5 m, and the arc radius is 86.4 m. The concrete cap has a diameter of 93 m and a thickness of 1.5 m (The thickness in the middle is reduced to 1.2 m). The diameter of the inner tank is 84.2 m, its height is 40.23 m, and the maximum design liquid level is 38.92 m. The inner and outer tanks are filled with thermal insulation material perlite, with a thickness of 1.1 m. The electric heat tracing low-cap pile foundation is adopted, with a radius of 0.7 m and a total of 428 piles. Since the foundation of the storage tank is regarded as a rigid foundation in this paper, the pile length calculated is from the ground to the bottom of the cap. The length of the outer pile foundation is 2 m, and the length of the inner pile foundation is 2.3 m. The cross-sectional schematic diagram of the large LNG storage tank and the layout of the pile foundation are shown in Figure 11 and Figure 12. LRB1100 is used for the isolation bearing, its vertical stiffness is 6374 kN/mm, the equivalent horizontal stiffness is 3507 kN/m, the stiffness after yield is 1892 kN/m, and the yield force is 316.7 kN. The material properties of the LNG storage tanks are shown in Table 4.

4.2. Dynamic Response of LNG Storage Tank

The four seismic waves selected in Section 2.2 were used to analyze the one direction seismic response of the large LNG storage tank. The peak ground acceleration (PGA) of the seismic wave was adjusted to 2.2 m/s. In order to compare the effect of isolation bearings on the seismic response of large LNG storage tanks, numerical models of LNG storage tanks with and without isolation bearings were established, respectively. By comparing the seismic responses of the LNG storage tank, such as acceleration, displacement, base shear force and overturning bending moment, the effect of the isolation bearing was analyzed. The overturning moment is the sum of the bending moment acting on the bottom of each pile foundation.
The isolation rate in Table 5 is defined as Equation (4):
λ = R n o n i s o R i s o R n o n i s o
where R n o n i s o is the seismic response peak value of the seismic storage tank, and R i s o is the seismic response peak value of the isolation storage tank.
We then analyzed the base shear and overturning bending moment of large LNG storage tanks. It can be seen from Figure 13 and Figure 14 and Table 5 that after installing the isolation bearing, the base shear force and overturning bending moment of the LNG storage tank are significantly reduced. Under the action of the Wolong wave, the seismic isolation bearing has the best effect, the seismic isolation rate of base shear force is 81.9%, and the seismic isolation rate of overturning bending moment is 64.2%. Under the action of four kinds of seismic waves, the average damping rate of base shear force is 66%, and the overturning moment is 36.0%. This shows that the ability of isolation bearing to reduce the base shear force is significantly better than the ability to reduce the overturning bending moment.
We then analyzed the seismic response of the outer wall of an LNG storage tank. The displacement and acceleration diagrams of the seismic storage tank and the seismic isolation storage tank are compared, as shown in Figure 15 and Figure 16. It can be seen from the figure that the displacement and acceleration of the seismic storage tank increase with the increase of height, and its change characteristics are mainly realized as “shear type”. The displacement and acceleration of the isolation storage tank hardly change with the increase of height, and the whole shows the characteristics of “rigid body translation”. This is because the displacement mainly occurs in the isolation layer after the introduction of lead-core rubber bearings. After the seismic isolation measures are taken, the acceleration response of the storage tank is significantly reduced. It can be seen from Table 5 that under the action of the Taft wave, the seismic isolation effect of acceleration is the best, reaching 55.8%. Under the action of four kinds of seismic waves, the average isolation rate of acceleration is 47.1%. However, due to the relatively weak horizontal direction of the isolation layer, the displacement of the isolation storage tank is much larger than that of the seismic storage tank. Under the action of four kinds of seismic waves, the displacement of the seismic isolation tank is 5.8 times that of the seismic storage tank on average. Therefore, when selecting the seismic isolation bearing of the storage tank, it is necessary to pay attention to the displacement of the storage tank to prevent the damage of the auxiliary pipeline caused by the excessive displacement of the storage tank.

5. Conclusions

In this paper, we carried out a shaking table test and numerical simulation study of a scaled model of a large LNG storage tank. Firstly, the models of the seismic storage tank and the seismic isolation tank were designed, and the sensors were arranged on the storage tank model. Secondly, the lead-core rubber bearing was designed according to the parameters of the storage tank. Then, four seismic waves were selected as the external excitation for the shaking table test, and the shaking table test was carried out. The numerical model was used to simulate the dynamic response of the seismic storage tank and the isolation storage tank to verify the validity of the numerical model. On this basis, an actual LNG storage tank of 200,000 cubic meters was selected to study its seismic dynamic response and the effect of isolation bearings. The following conclusions are drawn:
(1)
By processing the data in the condition of white noise, the natural vibration frequency of the tank model is obtained. After analysis, it can be seen that the natural vibration frequency of the storage tank model is significantly reduced after the isolation measures are taken. The isolation bearing has the same effect on the natural vibration frequency of the tank in the X- and Y-directions.
(2)
By analyzing the acceleration response of the seismic storage tank and the seismic isolation tank, it can be seen that the acceleration of the seismic storage tank shows an approximately linear increasing trend along the height direction. After the seismic isolation measures are taken, the acceleration response of the storage tank is significantly reduced. With the increase of peak acceleration of seismic waves, the seismic response of the storage tank model also increases, and the increase of the seismic storage tank is more obvious.
(3)
In this paper, the numerical model was used to simulate the dynamic response of the seismic storage tank and the isolation storage tank. By comparing test results and numerical simulation results, it can be seen that the calculation results of the numerical model can reflect the acceleration response of the storage tank model and its corresponding spectral characteristics. This verifies the feasibility and rationality of the numerical model. When studying the seismic dynamic response of large LNG storage tanks, the numerical model in this paper can be used for analysis.
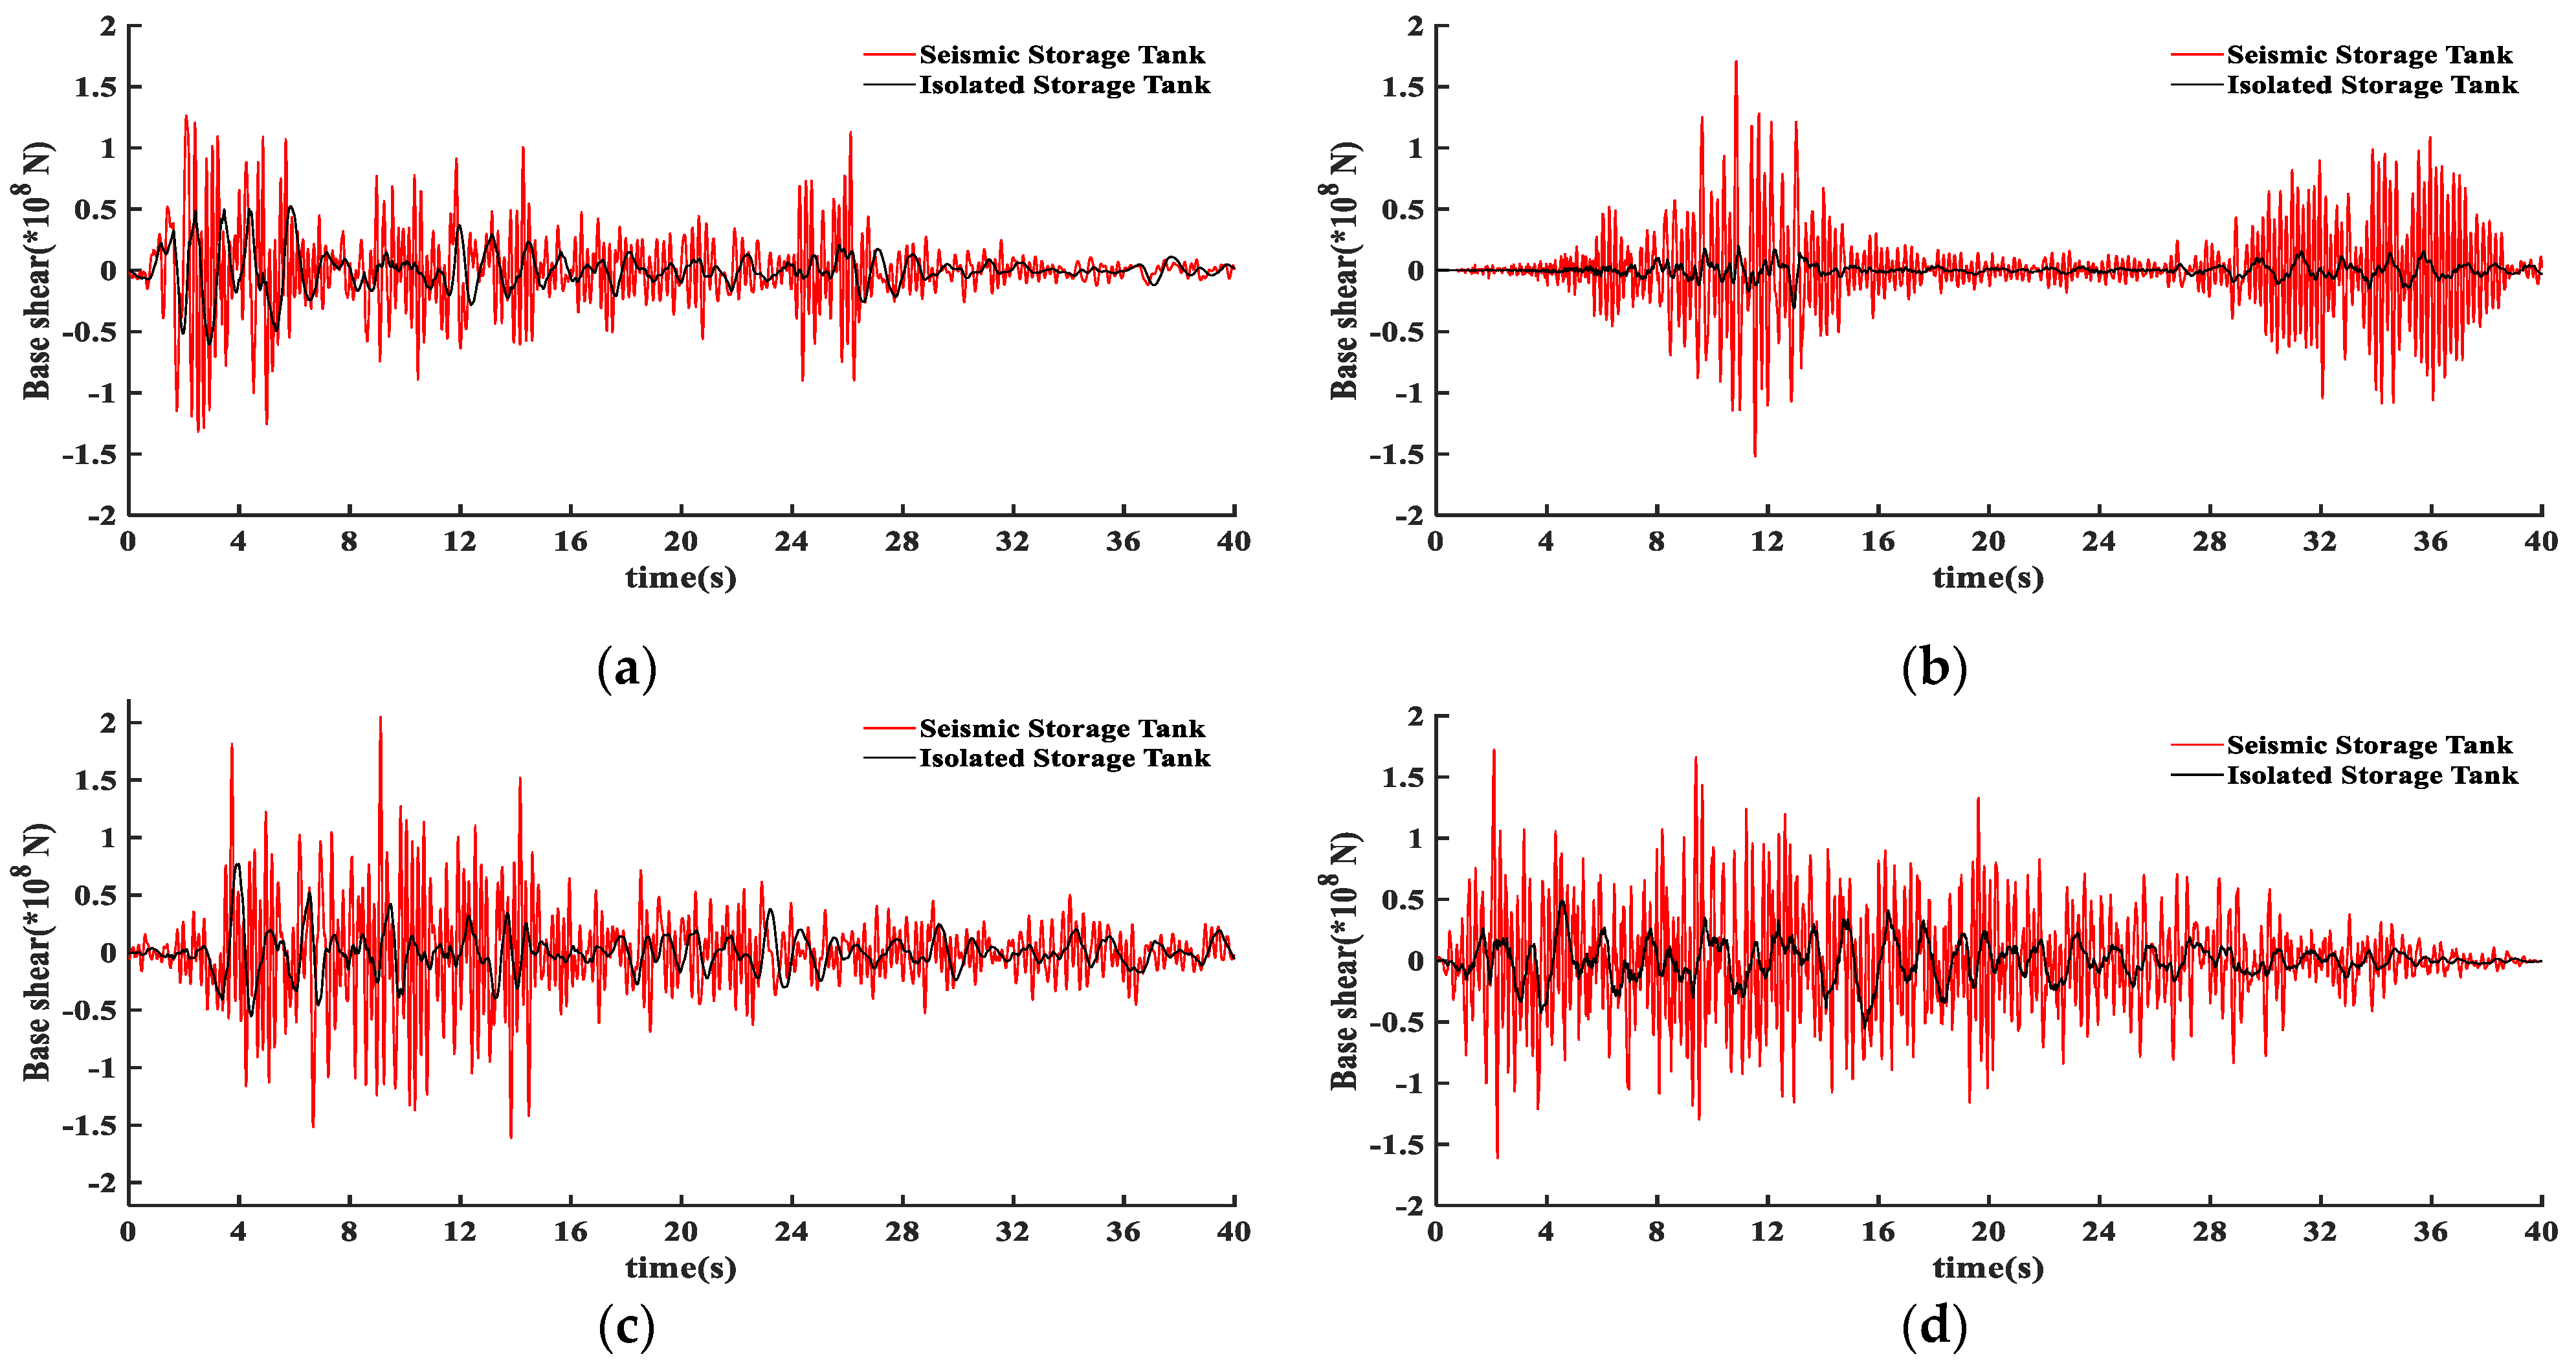
(4)
Based on the numerical analysis results of a 200,000 cubic meter LNG storage tank, the average seismic isolation rates of base shear force and overturning bending moment are 66% and 36%, respectively, and the average seismic isolation rate of acceleration reaches 47.1%. The addition of seismic isolation bearings in the seismic design of LNG storage tanks is beneficial to reduce the construction cost of the storage tanks. However, the displacement of the storage tank will increase significantly after isolation. Therefore, the displacement of the LNG storage tank needs to be strictly controlled after the seismic isolation measures are taken.

Author Contributions

Writing—original draft preparation, Z.C.; writing—review and editing, Z.X.; methodology, L.T. and Z.Z.; software, Z.X., J.F. and T.X.; data curation, T.X.; visualization, Z.Z. and T.X. All authors have read and agreed to the published version of the manuscript.

Funding

The authors appreciate the testing facility, as well as the technical assistance provided by the CLP Power Wind/Wave Tunnel Facility at the Hong Kong University of Science and Technology. The work is funded by the Key Laboratory of Icing and Anti/De-icing of CARDC (Grant No. IADL 20200304), the National Natural Science Foundation of China (Grant No.: 51908090), the Fundamental Research Funds for the Central Universities (Project No.: 2021CDJQY-001, 2022CDJXY-016), the Natural Science Foundation of Chongqing, China (cstc2020jcyj-msxmX0921), the Key Project of Technological Innovation and Application Development in Chongqing (Grant No.: cstc2019jscx-gksbX0017) and the Key Project of Science and Technology Research Program of Chongqing Municipal Education Commission (KJCXZD2020010).

Institutional Review Board Statement

Not applicable.

Informed Consent Statement

Not applicable.

Data Availability Statement

No data were reported in this study.

Acknowledgments

The authors would like to thank the anonymous reviewers for their valuable comments on the manuscript.

Conflicts of Interest

The authors declare no conflict of interest.

References

  1. Bertalot, D.; Brennan, A.J.; Villalobos, F.A. Influence of Bearing Pressure on Liquefaction-Induced Settlement of Shallow Foundations. Géotechnique 2013, 63, 391–399. [Google Scholar] [CrossRef]
  2. Parker, J. In-Service Behaviour of Creep Strength Enhanced Ferritic Steels Grade 91 and Grade 92—Part 2 Weld Issues. Int. J. Press. Vessel. Pip. 2014, 114–115, 76–87. [Google Scholar] [CrossRef]
  3. Malhotra, P. Practical Nonlinear Seismic Analysis of Tanks. Earthq. Spectra 2000, 16, 473–492. [Google Scholar] [CrossRef]
  4. Niwa, A.; Clough, R.W. Buckling of Cylindrical Liquid-Storage Tanks under Earthquake Loading. Earthq. Engng. Struct. Dyn. 1982, 10, 107–122. [Google Scholar] [CrossRef]
  5. Arturson, G. The Tragedy of San Juanico—The Most Severe LPG Disaster in History. Burns 1987, 13, 87–102. [Google Scholar] [CrossRef]
  6. Sezen, H.; Whittaker, A.S. Seismic Performance of Industrial Facilities Affected by the 1999 Turkey Earthquake. J. Perform. Constr. Facil. 2006, 20, 28–36. [Google Scholar] [CrossRef]
  7. Chang, J.I.; Lin, C.-C. A Study of Storage Tank Accidents. J. Loss Prev. Process Ind. 2006, 19, 51–59. [Google Scholar] [CrossRef]
  8. Housner, G.W. Dynamic Pressures on Accelerated Fluid Containers. Bull. Seismol. Soc. Am. 1957, 47, 15–35. [Google Scholar] [CrossRef]
  9. Haroun, M.A.; Housner, G.W. Earthquake Response of Deformable Liquid Storage Tanks. J. Appl. Mech. 1981, 48, 411–418. [Google Scholar] [CrossRef]
  10. Jadhav, M.B.; Jangid, R.S. Response of Base-Isolated Liquid Storage Tanks to near-Fault Motions. Struct. Eng. Mech. 2006, 23, 615–634. [Google Scholar] [CrossRef]
  11. Christovasilis, I.P.; Whittaker, A.S. Seismic Analysis of Conventional and Isolated LNG Tanks Using Mechanical Analogs. Earthq. Spectra 2008, 24, 599–616. [Google Scholar] [CrossRef]
  12. Zhang, R.; Weng, D. Assessment of the Seismic Effect of Insulation on Extra-Large Cryogenic Liquid Natural Gas Storage Tanks. J. Loss Prev. Process Ind. 2014, 30, 9–16. [Google Scholar] [CrossRef]
  13. Krishnamoorthy, A. Finite Element Method of Analysis for Liquid Storage Tank Isolated with Friction Pendulum System. J. Earthq. Eng. 2021, 25, 82–92. [Google Scholar] [CrossRef]
  14. Moslemi, M.; Kianoush, M.R. Parametric Study on Dynamic Behavior of Cylindrical Ground-Supported Tanks. Eng. Struct. 2012, 42, 214–230. [Google Scholar] [CrossRef]
  15. Saha, S.K.; Matsagar, V.A.; Jain, A.K. Earthquake Response of Base-Isolated Liquid Storage Tanks for Different Isolator Models. J. Earthq. Tsunami 2014, 8, 1450013. [Google Scholar] [CrossRef]
  16. Kangda, M.Z. An Approach to Finite Element Modeling of Liquid Storage Tanks in ANSYS: A Review. Innov. Infrastruct. Solut. 2021, 6, 226. [Google Scholar] [CrossRef]
  17. Panchal, V.R.; Jangid, R.S. Seismic Response of Liquid Storage Steel Tanks with Variable Frequency Pendulum Isolator. KSCE J. Civ. Eng. 2011, 15, 1041–1055. [Google Scholar] [CrossRef]
  18. Panchal, V.R.; Jangid, R.S. Behaviour of Liquid Storage Tanks with VCFPS under Near-Fault Ground Motions. Struct. Infrastruct. Eng. 2012, 8, 71–88. [Google Scholar] [CrossRef]
  19. Zhang, R.; Weng, D.; Ren, X. Seismic Analysis of a LNG Storage Tank Isolated by a Multiple Friction Pendulum System. Earthq. Eng. Eng. Vib. 2011, 10, 253–262. [Google Scholar] [CrossRef]
  20. Tang, Z.; Hong, Y.; He, L.; Li, Z. Seismic Performance of Storage Tank Isolated by Different Isolators Through Real-Time Hybrid Simulation. Int. J. Str. Stab. Dyn. 2021, 21, 2150190. [Google Scholar] [CrossRef]
  21. Moeindarbari, H.; Malekzadeh, M.; Taghikhany, T. Probabilistic Analysis of Seismically Isolated Elevated Liquid Storage Tank Using Multi-Phase Friction Bearing. Earthq. Struct. 2014, 6, 111–125. [Google Scholar] [CrossRef]
  22. Seleemah, A.A.; El-Sharkawy, M. Seismic Analysis and Modeling of Isolated Elevated Liquid Storage Tanks. Earthq. Struct. 2011, 2, 397–412. [Google Scholar] [CrossRef]
  23. Ormeño, M.; Larkin, T.; Chouw, N. Experimental Study of the Effect of a Flexible Base on the Seismic Response of a Liquid Storage Tank. Thin-Walled Struct. 2019, 139, 334–346. [Google Scholar] [CrossRef]
  24. Tsipianitis, A.; Tsompanakis, Y. Improving the Seismic Performance of Base-Isolated Liquid Storage Tanks with Supplemental Linear Viscous Dampers. Earthq. Eng. Eng. Vib. 2022, 21, 269–282. [Google Scholar] [CrossRef]
  25. Ministry of Housing and Urban-Rural Development of China. Code for Seismic Design of Buildings GB 50011-2010; Ministry of Housing and Urban-Rural Development of China: Beijing, China, 2010.
  26. API. Welded Steel Tanks of Oil Storage; American Petroleum Institute: Washington, DC, USA, 2009. [Google Scholar]
  27. ACI. Seismic Design of Liquid Containing Concrete Structures (ACI 350. 3-01) and Commentary (ACI 350. 3R-01); American Concrete Institute: Farmington Hills, MI, USA, 2001. [Google Scholar]
  28. Luo, D.; Liu, C.; Sun, J.; Cui, L.; Wang, Z. Liquefied Natural Gas Storage Tank Simplified Mechanical Model and Seismic Response Analysis. Soil Dyn. Earthq. Eng. 2021, 141, 106491. [Google Scholar] [CrossRef]
  29. Kim, M.K.; Lim, Y.M.; Cho, S.Y.; Cho, K.H.; Lee, K.W. Seismic Analysis of Base-Isolated Liquid Storage Tanks Using the BE–FE–BE Coupling Technique. Soil Dyn. Earthq. Eng. 2002, 22, 1151–1158. [Google Scholar] [CrossRef]
  30. Sun, J.; Cui, L.; Li, X.; Wang, Z.; Liu, W.; Lv, Y. Design Theory and Method of LNG Isolation. Earthq. Struct. 2019, 16, 1–9. [Google Scholar] [CrossRef]
Figure 1. The plans of the storage tank: (a) seismic storage tank; (b) isolation storage tank (units: mm).
Applsci 12 08390 g001
Figure 2. (a) Test model of the storage tank; (b) layout of the acceleration sensor.
Applsci 12 08390 g002
Figure 3. Time history of seismic wave acceleration: (a) El Centro wave; (b) Taft wave; (c) Wolong wave; (d) Artificial wave.
Applsci 12 08390 g003
Figure 4. Comparison of peak acceleration in the X-direction of the seismic storage tank: (a) Taft wave (XZ direction, 0.50 g); (b) Artificial wave (XYZ direction, 0.50 g); (c) Wolong wave (XYZ direction, 0.75 g); (d) Taft wave (XZ direction, 0.75 g).
Applsci 12 08390 g004
Figure 5. Comparison of peak acceleration in the X direction of the isolation storage tank: (a) Taft wave (XZ direction, 0.50 g); (b) Artificial wave (XYZ direction, 0.50 g); (c) Wolong wave (XYZ direction, 0.75 g); (d) Taft wave (XZ direction, 0.75 g).
Applsci 12 08390 g005
Figure 6. Taft wave (XYZ direction, 0.75 g): (a) acceleration time history curves in the X-direction; (b) spectrum characteristic curve in the X-direction; (c) acceleration time history curves in the Y-direction; (d) spectrum characteristic curve in the Y-direction.
Applsci 12 08390 g006
Figure 7. Wolong wave (XYZ direction, 0.75 g): (a) acceleration time history curves in the X-direction; (b) spectrum characteristic curve in the X-direction; (c) acceleration time history curves in the Y-direction; (d) spectrum characteristic curve in the Y-direction.
Applsci 12 08390 g007
Figure 8. Finite element model of the LNG storage tank.
Applsci 12 08390 g008
Figure 9. Comparison results of the seismic storage tank under El Centro (X, 0.5 g): (a) measuring point 2; (b) measuring point 3; (c) measuring point 4; (d) measuring point 5.
Applsci 12 08390 g009
Figure 10. Comparison results of the isolation storage tank under El Centro (X, 0.5 g): (a) measuring point 11; (b) measuring point 11; (c) measuring point 12; (d) measuring point 13.
Applsci 12 08390 g010
Figure 11. The cross-sectional schematic diagram of the large LNG storage tank (units: mm).
Applsci 12 08390 g011
Figure 12. The layout of the pile foundation (units: mm).
Applsci 12 08390 g012
Figure 13. Base shear force: (a) El Centro wave; (b) Wolong wave; (c) Taft wave; (d) Artificial wave.
Applsci 12 08390 g013
Figure 14. Overturning bending moment: (a) El Centro wave; (b) Wolong wave; (c) Taft wave; (d) Artificial wave.
Applsci 12 08390 g014
Figure 15. Acceleration cloud diagram of storage tank: (a) seismic storage tank; (b) isolation storage tank.
Applsci 12 08390 g015
Figure 16. Displacement cloud diagram of storage tank: (a) seismic storage tank; (b) isolation storage tank.
Applsci 12 08390 g016
Table 1. Arrangement of test conditions.
Condition NumberTest ConditionExcitation
Direction
Peak
Acceleration (g)
1White noiseX, Y, Z0.05
2–5Wolong, ArtificialX, Z; X, Y, Z0.1
6White noiseX, Y, Z0.05
7–10Wolong, ArtificialX, Z; X, Y, Z0.25
11White noiseX, Y, Z0.05
12–21El Centro, Taft, Wolong, ArtificialX; X, Z; X, Y, Z0.50
22White noiseX, Y, Z0.05
23–34El Centro, Taft, Wolong, ArtificialX; X, Z; X, Y, Z0.75
35White noiseX, Y, Z0.05
Table 2. Lead-core rubber bearing parameters.
ItemParameterItemParameter
typeLRB300height150 mm
effective outer diameter300 mmshear modulus0.392 MPa
outer diameter of bearing320 mmrubber standard elastic modulus1.5 MPa
lead diameter60 mmsecond shape factor5.77
side length of sealing plate400 mmeffective area70,685.8 mm2
sealing plate thickness11 mmbearing area160,000 mm2
rubber layers26 layerhardness correction coefficient0.9
layers of sheet steel25 layervertical stiffness887 kN/mm
thickness of rubber layer3 mmequivalent horizontal stiffness821 kN/m
thickness of steel plate3 mmyield force22.6 kN
total thickness of rubber78 mmpost yield stiffness469 kN/m
total thickness of steel plate50 mmequivalent damping ratio30.9%
Table 3. Natural vibration frequency of tank model under white noise excitation (Hz).
Condition NumberExplanationSeismic Storage TankIsolation Storage Tank
XYXY
1before test16.816.17.37.0
6after 0.10 g earthquake15.715.77.06.9
11after 0.25 g earthquake15.715.76.96.5
22after 0.50 g earthquake15.214.06.56.3
35after 0.75 g earthquake15.013.66.46.0
Table 4. Material parameters of LNG storage tank.
MaterialElastic ModulusPoisson’s RatioDensity
C40 (outer tank)34.5 GPa0.1672500 kg/m3
C50 (pile foundation)32.5 GPa0.1672500 kg/m3
Prestressed steel strand195 GPa0.37800 kg/m3
Ordinary reinforced200 GPa0.37850 kg/m3
9% Ni steel206 GPa0.37850 kg/m3
Expanded perlite0.9 GPa0.2120 kg/m3
Foam glass brick0.011 GPa0.265 kg/m3
Table 5. Peak seismic response of 200,000 cubic meters of the LNG storage tank.
El CentroTaftWolongArtificial
Base shear force (108 N)seismic1.322.051.711.73
isolation0.610.770.310.55
isolation rate53.8%62.4%81.9%68.2%
Overturning bending moment (108 N·m)seismic2.183.372.822.84
isolation1.922.461.011.68
isolation rate11.9%27.0%64.2%40.8%
Acceleration of the outer tank wall (m/s2)seismic4.925.345.354.04
isolation2.472.362.882.55
isolation rate49.8%55.8%46.0%36.9%
Displacement of the outer tank wall (m)seismic0.00540.00650.00590.0057
isolation0.03800.03220.04940.0174
isolation rate−604%−395%−737%−205%
Effective dynamic stress of outer tank wall (MPa)seismic0.861.011.090.85
isolation0.160.140.210.09
isolation rate81.4%86.1%80.7%89.4%
Publisher’s Note: MDPI stays neutral with regard to jurisdictional claims in published maps and institutional affiliations.

