Article

Femtosecond Laser-Induced Evolution of Surface Micro-Structure in Depth Direction of Nickel-Based Alloy

1
State Key Laboratory of Rolling and Automation, Northeastern University, Shenyang 110819, China
2
Science and Technology on Advanced High-Temperature Structural Materials Laboratory, Beijing Institute of Aeronautical Materials, Beijing 100095, China
*
Author to whom correspondence should be addressed.
Appl. Sci. 2022, 12(17), 8464; https://doi.org/10.3390/app12178464
Submission received: 24 July 2022 / Revised: 17 August 2022 / Accepted: 22 August 2022 / Published: 24 August 2022
(This article belongs to the Special Issue Laser-Based Micro/Nano Manufacturing Technology)

Abstract

:
The surface coating properties of turbine blades are highly dependent on the material’s surface roughness, and the femtosecond laser-induced micro-structure can provide a wide range of roughness with periodicity. However, precise control of femtosecond laser-induced micro-structure is difficult. In this paper, we extend the application of the two-temperature model and combine it with experiments to accurately reveal the evolution law of micro-structure depth at different single pulse energies, as well as the influence of two processing parameters on micro-structure, namely, defocusing amount and scanning speed. The findings of this study provide reliable theoretical guidance for fast and accurate control of material surface roughness and open new possibilities for coating properties.

1. Introduction

Aviation turbine engines must withstand higher temperatures to improve the aircraft’s thrust-to-weight ratio [1,2]. Because of their excellent high-temperature properties, nickel-based single crystal superalloys are frequently used in turbine blades; however, the temperature in the combustion chamber exceeds the melting point of the material [3]. As a result, thermal barrier coatings (TBCs) must be applied to the blade surface to provide insulation [4], implying that the properties of the TBCs have a direct impact on the service life of the turbine blade.
The properties of TBCs are generally related to two aspects. One aspect is the bonding performance of the coating to the substrate. Zhang et al. prepared substrates with different surface roughness by surface sandblasting on nickel-based alloy DD3, investigated the effect of surface roughness on the adhesion state of the coating, and found that the coating performance on different roughness surfaces differed by thermal cycling experiments [5]. The other aspect is the growth morphology of the coating. VanEvery et al. systematically analyzed the growth mechanism of the micro-convexity on the substrate surface leading to the columnar structure of the deposit, and the shape and depth of the micro-convexity played a decisive role in addition to the droplet size [6]. Therefore, all previous studies have shown that the properties of coatings are highly dependent on the micro-nano structure of the substrate surface [7,8,9,10].
Experiments to obtain different surface topography by polishing and sandblasting are simple, but the topography is rather homogeneous, and the preparation of stable and controllable surface roughness on the surface of turbine blades with complex shapes is difficult. Several techniques have been employed over the past decades to prepare micro- and nano-structures on metal surfaces [11,12,13]. Among these, the use of chemical reactions for the preparation of micro-structures allows for more complex surface topography, but the surface area of turbine blades is generally large, and the controllability and integrity of the surface texture are limited. Furthermore, external micro-machining methods are frequently used in preparing metal surface micro/nano-structures, with laser processing being widely used because of their several applications such as in wettability, friction resistance, and trace level explosive sensing [14,15].
In recent years, femtosecond lasers have been rapidly developed as a new technology primarily for coating material surfaces, where femtosecond laser-induced micro-structures can provide other desired functions on the inherent properties of the material, such as surface wettability, friction and wear properties, and particle filtration [16,17,18,19,20,21]. Different shapes of micro/nano-structures serve different purposes, with the difference between the peak and trough of the micro-structure directly determining the surface roughness of the material [22]. More importantly, the femtosecond laser-induced micro-structures are almost entirely periodic, and the surface morphology is more refined. As a result, using a femtosecond laser, it is possible to induce periodic micro-structures with varying roughness on the substrate and then perform coating properties tests, with better engineering significance for turbine blade applications.
However, femtosecond laser-induced surface micro-structure is a complicated process. Barada K. et al. investigated the effect of laser fluence, gas environment, and other factors on the wave-peak-valley difference of micro/nanostructures [23]. Craig A. et al. observed the evolution of micro-structure depth, width, and other properties by varying the number of pulses and scans [24]. However, only qualitative relationships between the evolution of micro-structures and parameters can be obtained experimentally, making precise control difficult. Using a two-temperature model, Huagang Liu et al. highlighted the phenomenon behind the larger diameter of micro-hole on a material surface at high laser fluence [21]. Unfortunately, the model can only qualitatively describe the process, and it is difficult to quantitatively explain the evolution of micro-hole. This study, however, provides us with an intriguing example. Yang et al. quantified the process of femtosecond laser ablation of nickel-based alloys by establishing a relationship between single pulse energy and the ablation pit depth using a two-temperature model [25]. However, the femtosecond laser-induced micro-structure differs from that of a single pulse, and there is a certain overlap rate between multiple pulses. Furthermore, as the number of laser scans increases, the material is ablated as a whole, and the relative spatial position of the material surface to the pulse energy changes, posing a significant challenge for numerical simulation. Nonetheless, formulas in the two-temperature model, such as for the spatial distribution of laser energy, can provide a better theoretical basis for establishing the relationship between laser energy and the location of the material surface in space. These formulas can help to achieve the prediction of the evolution pattern of micro-structures in the depth direction. Then, various roughness values can be obtained. Therefore, they can bring more possibilities for the properties testing of TBCs.
As a result, in this study, the application of the two-temperature model is extended for the femtosecond laser-induced depth direction change of the surface micro-structure, and the evolution model of the micro-structure depth direction is established in conjunction with the experiment. The model more accurately reveals the change law of micro-structure depth direction within a certain number of scans and gives the effect of different scanning speeds and defocusing amount on the micro-structure depth, which provides reliable theoretical guidance for controlling the surface roughness of materials.

2. Experimental Methods and Results

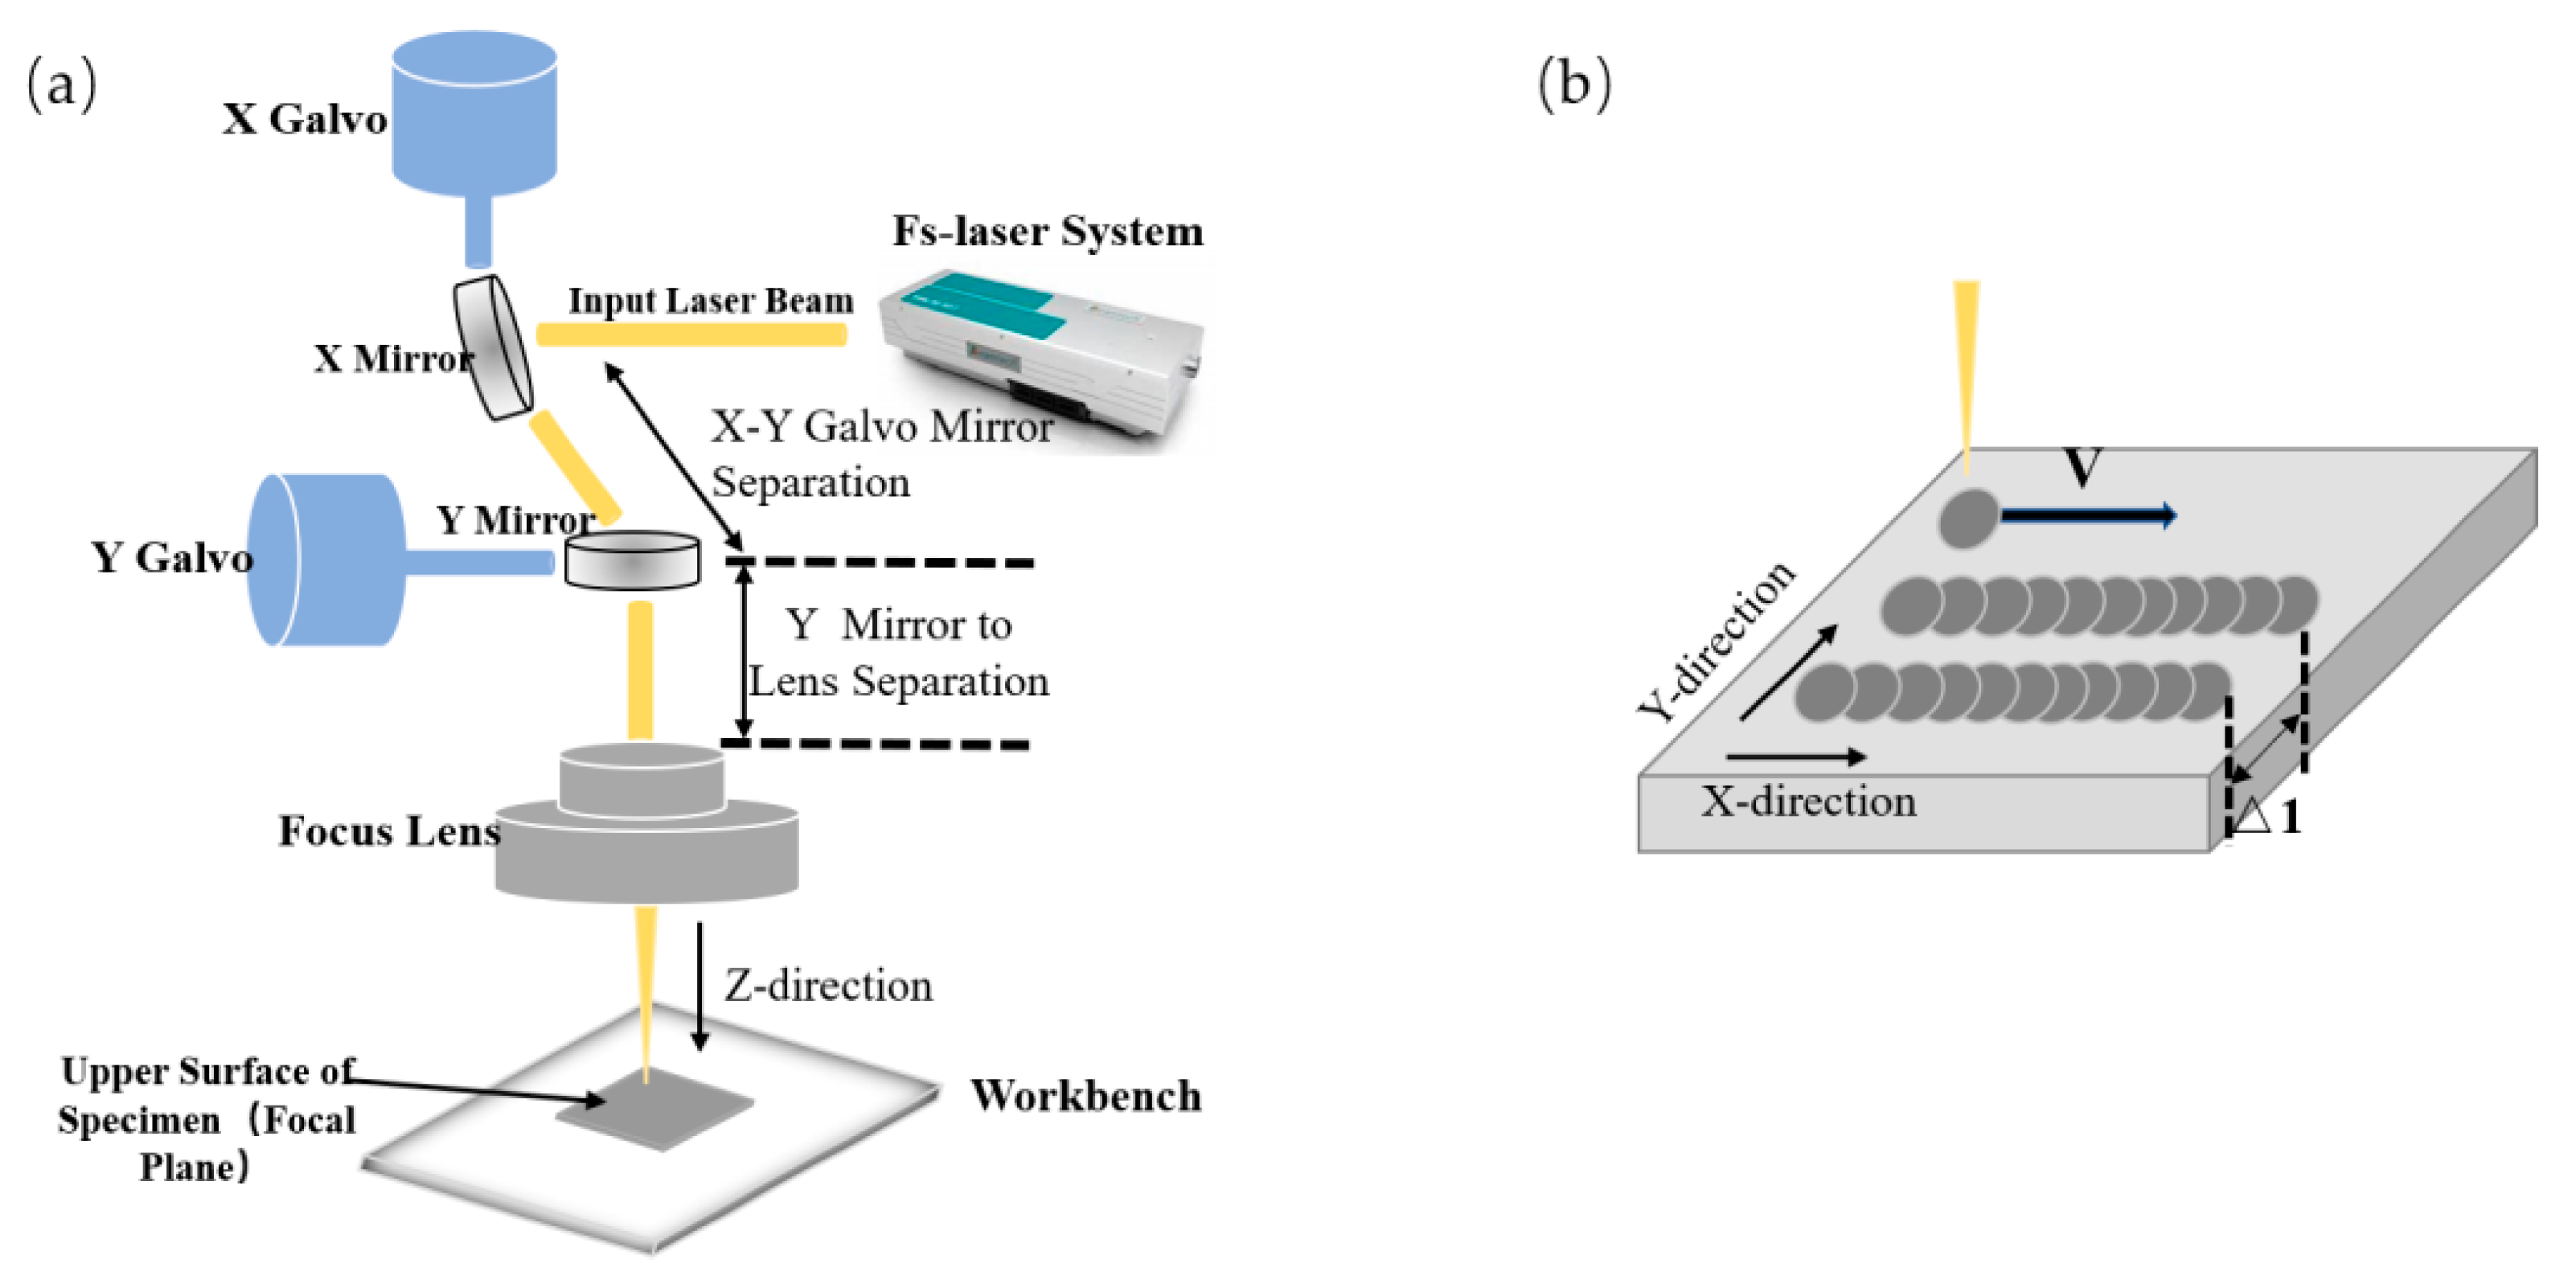
2.1. Experimental Method

In this experiment, a laser with a pulse width of 300 fs and a wavelength of 1030 nm was used. The laser beam has a gaussian spatial distribution and was focused on the upper surface of the sample to be processed by a focusing mirror with a beam radius of 5 µm at the focal point. The laser beam in this system was moved in a specific area by adjusting the galvanometers in the x and y directions, as shown in Figure 1a. The number of pulses received at each point on the sample surface is determined by the following relationship between the laser repetition frequency, scanning speed, and beam radius:
n = 2 · ω 0 · f v
where ω 0 denotes the beam radius, f denotes the repetition frequency, and v denotes the laser beam scanning speed.
The nickel-based single crystal high-temperature alloy DD15 was employed in this study. The experimental sample is 3 mm thick to ensure that an observable micro-structure is obtained on the material’s surface. The laser was moved with velocity v along the x-direction and was set at Δ1 = 40 µm along the y-direction. A series of experimental explorations revealed that the evolutionary pattern of the microstructure is most evident at 40 μm. Therefore, a 40 μm spacing was chosen to illustrate the connection more clearly between experiments and simulations. The scanning area is 1 mm2. One scan is defined as the completion of the motion of the beam within this area, and the process is then repeated continuously within this area, as shown in Figure 1b. All samples were surface polished to achieve an acceptable roughness. Following that, the samples were ultrasonically cleaned in acetone to remove any potential surface adhesion. Scanning electron microscopy (SEM) was used to observe micro-structural organisational features, while a Laser scanning confocal microscope (LSCM) was used to observe micro-structural morphological features, with the number of scans m being recorded by the equipment.
LSCM was used in this study to measure the distance in the depth direction of the micro-structure. The depth value is calculated by taking the difference between the highest and lowest points of any five lines in the measurement area. The device determines the number of scans and stops automatically when the value is reached. During the process, an auxiliary blowing system is used to remove the material dynamically.

2.2. Experimental Results

A single pulse energy of 120 μJ was used in this experiment, and the laser beam scanned the same area several times at a scanning speed of 500 mm/s. The laser operation is shown in Figure 1b. The laser beam is first scanned in the x-direction, and then it does not stop and keeps the original speed of moving to the next line in the y-direction until the whole area is scanned. Therefore, the time between two scan lines is 8 × 10⁻⁵ s. After completing a scan, the laser beam returns to the starting point along the outer contour of the scanned area and repeats the motion of the previous scan until the set number of times is reached and the device stops. So, the time between two passes is 2 × 10⁻³ s. Figure 2a–d depicts the surface morphology of the micro-structure as scanned by SEM at various times. The surface morphology was scanned five times, as shown in Figure 2a. The nanoscale stripes are the most studied laser-induced periodic surface structure (LIPSS), while the micron-scale stripes have been found in related studies, and the depth between the micron-scale stripes is significantly deeper in this study. The dual-scale stripes produced various undulating states on the material surface, which influenced the subsequent laser action. At ten scans, a micro-hole appears in the scanned area, and the smaller diameter micro-hole begins to appear within two adjacent micron-scale stripes, and then new micro-hole continues to be induced around them, causing the micro-hole to appear in clusters. As the laser continues to scan, the entire scanned area is covered with micro-hole after 20 scans, but the size of the micro-hole varies in diameter and the undulating state at the pores is ununiform. Previous research linked the formation of microstructures to the Marangoni effect, which was caused by the surface melt flow and re-solidification process, so there would be some undulation on the material surface at the start of micro-hole formation [21]. At 30 scans, the micro-hole in the scanned area touch with a certain periodicity, as shown in Figure 2d, and the diameter of the micro-hole tends to be uniform, and the undulation at the pores in the area is more consistent. The depth difference between the pores and the bottom of the pores directly determines the roughness of the material surface, which directly determines the coating properties in the coating application of turbine blades. As a result, it is critical to be able to precisely control the depth of the pore opening and the pore bottom when the material’s surface undulation is stable after the micro-hole generation.

3. Simulation Results and Discussion

3.1. Simulation Method

Previous experimental procedures have demonstrated that micro-hole formation is closely related to the process of femtosecond laser ablation of materials, and thus precise control of micro-hole depth is desired due to the physical nature of femtosecond laser ablation of metals. As a traditional physical model, the two-temperature model can describe the heat transfer process inside the material very well.
The two-temperature model considers the electron and lattice as two separate systems, with two separate equations describing the process of changing their temperatures as follows [26]:
C e T e t = k e 2 T e 2 g T e T l + S z
C l T l t = k l 2 T l z 2 + g T e T l
where g denotes the energy of the electron coupling coefficient [27]. The subscripts e and l denote the parameters of the electron and lattice, respectively, T denotes the temperature, and k denotes the thermal conductivity. Here, ke varies with the ratio of the electron temperature to the lattice temperature as shown in Equation (4), while kl is only related to the lattice temperature [28].
k e = k 0 T e T l
where k0 denotes the electronic thermal conductivity [27].
In Equations (2) and (3), C denotes the heat capacity, and Cl is considered as a constant [21]. Ce = γTe denotes the electron heat capacity, and γ denotes the electron-specific heat coefficient [29]. In Equation (2), S(z) is the energy source of the system. In this model, only the energy change in z-direction is studied. The equation is as follows [25]:
S z = 1 R L p · F · ω 0 2 ω 2 z
where R denotes the reflectivity of the material [30], Lp denotes the depth of ballistic transport [31], ω 0 denotes the beam radius, and ω (z) denotes the variation of the beam radius in the z-direction, given by Equations (6) and (7) [32]:
ω z = ω 0 1 + z 2 L R 2 1 / 2
L R = u · π · ω 0 2 λ
where LR denotes the Rayleigh length and λ denotes the femtosecond laser wavelength taken as 1030 nm, u is the refractive index and can be assumed to be 1 [32]. F in Equation (5) denotes the laser fluence and the relationship between the single pulse energy E is as follows [33]:
F = 2 E π · ω 0 2
The laser device directly controls the single pulse energy in this study. The equations are solved using the finite difference method. The initial temperature of the lattice and electrons is assumed to be the ambient temperature (300 K). The lattice temperature is raised above the evaporation temperature (3003 K), and the material is removed to calculate the laser’s ablation depth [34]. The enthalpies absorbed by the solid metal fusion and vaporization are recorded as ΔQ. In the calculation, ΔQ is converted to temperature to correct for the original temperature of each simulation grid. This method treats the latent heat absorbed when the metal fusion and vaporization as a correction for the temperature of each simulation grid. It should be clarified that, to improve the computational speed and scale, the change of the beam radius with depth on the length scale of the ballistic electron transport is ignored in this simulation. Table 1 and Table 2 show the physical parameters of the target material as well as the processing parameters used. All calculations in this study were performed using nickel, the main element in DD15.

3.2. Simulation Process

Figure 3a depicts the relationship established by the two-temperature model between the depth of femtosecond laser ablation of the target material and the laser fluence. The results show that the ablation depth increases rapidly when the laser fluence reaches a critical value for the ablation of the material and then gradually increases. It indicates that even at higher energy, the deeper the ablation depth appears unattainable, and the ablation rate is a matter of the efficiency of the industrial application of femtosecond laser, the efficiency of which has been questioned. The energy at the bottom of the micro-structure is difficult to process efficiently due to the defocusing effect and reflection loss, and a similar phenomenon is observed in laser drilling.
Because the pulse energy in this experiment is roughly Gaussian, Equation (5) shows that energy in the z-direction decays from the focal plane (z = 0) to both sides. Figure 3a it can be seen shows that the same pulse has different ablation depths for the material at different z-directional positions. As shown in Figure 1, the focal plane coincides with the upper surface of the specimen at the start of the experiment, and the part that interacts with the material is all below the focal plane. As a result, the z-directional distance involved in the following model is below the focal plane, and the distance above the focal plane is ignored. Based on our findings, the surface of the femtosecond laser-induced material primarily exists in the form of a neatly formed micro-hole. Figure 3b depicts the spatial position relationship between the simplified femtosecond pulse and the micro-hole to investigate the evolution law of the micro-hole depth direction. The diagram depicts the ablation of the material by pulses with a predetermined overlap rate, with the position of the pulse in the z-direction remaining constant as the number of scans increases. The depth of the micro-hole is calculated as the difference between the bottom position Z2 and the orifice position Z1.
In addition to the above calculation results, the initial positions of the orifice and bottom of the micro-hole must be entered into the model for calculation. Three different single pulse energies of femtosecond laser processing experiments were performed at 80, 100, and 120 μJ, as shown in Figure 4, to validate the model’s applicability. As previously stated, the coating properties are positively influenced when the material’s surface undulations stabilise after micro-hole generation, and based on previous experimental results, 40 scans were chosen as the initial state for the simulation calculation, and the laser confocal microscope was used to measure the initial hole location and the micro-hole depth. Table 3 shows the information presented above. The initial depth is the depth of the micro-hole for 40 scans of three different single pulse energies. Additionally, during the continuous scanning of the laser, the material is always ablated, which leads to a certain distance between the orifice and the original surface even at 40 scans, called the absolute distance. Given that the structure is applied to a turbine blade, the undulation of the material surface is too large to affect the blade’s service life, so 320 scans are chosen as the termination state.

3.3. Simulation Results

3.3.1. Effect of Single Pulse Energy on the Ablation Depth of Different Micro-Structures

To calculate the effective ablation depth at each Z position for the pulses with a given repetition rate in Figure 3b, we first calculate the peak fluence of a single pulse in the z-direction. Figure 5a depicts the variation of peak fluence with distance from the focal plane for three different single pulse energies. The fluence at the focal plane is maximum for all three pulses and rapidly decreases along the z-direction away from the focal plane. As can be seen from Equation (6), the beam radius becomes larger as Z increases. Therefore, since the pulse energy is constant, the fluence decreases accordingly (Equation (5)), a phenomenon known as the defocusing effect [35]. When the distance reaches approximately 600 μm, the laser injection volume gradually decreases. The ablation depth at different laser fluences combined with Figure 4 demonstrates that the laser injection volume is insufficient to ablate the material after a certain distance away from the focal plane. Moving away from the focal plane changes the beam radius as well as the peak fluence, as shown in Equation (6). Because the change in single pulse energy has no effect on the change in the beam radius, the trend of diameter change is the same at all three single pulse energies. Contrary to the laser fluence, the beam radius at the focal plane is the smallest and continues to increase as the z-direction moves away from the focal plane, as shown in Figure 5a. It is clear from this that the energy and beam radius of a single pulse change as it moves away from the focal plane. The decrease in energy also decreases the ablative depth of the material, as shown in Figure 3a. For the same material, the ablative depth is determined solely by the laser fluence if the other laser parameters remain constant. As a result, the ablative depth for a single pulse at different Z positions can be calculated, and the results for three decreasing curves are shown in Figure 5b.
It is worth noting that the calculated ablative depth decreases approximately linearly, which is related to the fact that, as previously stated, the ablation depth does not significantly improve with increasing energy. However, because Equation (1) states that the effective number of pulses is determined by the beam radius with constant scanning speed and repetition frequency, the average effective number of pulses at each position increases as the beam radius in the z-direction increases, as shown in Figure 5b. Unlike the previous study, the pulse overlap in the y-direction is not considered in this experiment because Δ1 = 40 μm, and according to Figure 5a, the beam diameter is not equal to 35 μm at 1000 μm from the focal plane, implying that there is theoretically no overlap of the spot in the y-direction [22]. The effective ablation depth and the number of effective pulses of a single pulse at each Z position can be obtained from the preceding work when processing with three different single pulse energies, and thus the total ablation depth at each Z position can be calculated.
The total ablation depth at that location is then calculated as the product of the ablation depth of a single pulse at the same location in the z-direction and the number of effective pulses at that location. It is well known that the ablation depth increases with the increasing number of pulses [36]. More specifically, Yang et al. calculated the ablation depth over a range of 1000 pulses at different energies using a two-temperature model [25]. The results showed that the ablation depth increased linearly with the number of pulses within the first 200 pulses, and then the increase became slow. In the present study, the scanning speed was 500 mm/s, and there were only about seven pulses at a point of 1000 µm from the focal plane (Figure 5b), which is fully consistent with the linear increase. Figure 5c depicts the total ablation depths of the three different single pulse energies. As one moves away from the focal plane, the total ablation depth increases, resulting in deeper ablation at the bottom of the micro-hole compared to the orifice, and thus the depth of the micro-hole increases. Because the variation of micro-hole depth is directly proportional to the variation in the total ablation depth at each location, the variation of ablation depth is critical for controlling the material’s surface roughness.
As a result, we examined the trend of total ablation depth for three different single pulse energies, and the rate of change is depicted in Figure 5d. The rate of change of the three single pulse energies remains nearly constant at about 120 μm from the upper surface of the specimen, related to the relationship between the energy and the ablation depth, as shown in Figure 3a. Within 120 μm, the abundance of the single pulse energy at 80 μJ peak fluence reaches about 4.4 × 10⁹ J/cm2. In Figure 5a, the energy is approximately linear between the energy and the ablation depth, and the change in the ablation depth for the same pulse energy initially increases and then decreases, which is attributed to the gaussian distribution of the pulse energy. With decreasing energy, the rate of change decreases gradually. The three different single pulse energies show a similar variation trend.
Once the total ablation depth at each Z position is determined, the initial data for the micro-hole at the three different single pulse energies in Table 3 can be substituted for the calculation. The hole and the bottom of the hole are given new Z1 and Z2 values with each laser scan, and the difference between the two (i.e., depth) changes as a result. Figure 5e depicts the experimentally measured and simulated results of the micro-hole depth variation with scan number. The experimental and simulated results at various single pulse energies are found to be in good agreement. The micro-hole depth increases with the number of scans, and at higher single pulse energy, the ablation depth is deeper. The results show that the model is feasible, but more surface roughness control is required to investigate the effect of more femtosecond laser processes on the ablation process. In fact, the pre-processes of microstructure evolution observed experimentally are not considered in the present model, which may risk inaccuracies in the simulation results. However, as mentioned earlier, the model equates the energy at each point, which makes the deposition energy at each location consistent with the experiment. Moreover, the pre-process of microstructure evolution is transient, and the surface morphology stabilizes only after the micro-hole is created, so it is acceptable to ignore this short-term process while ensuring energy consistency.

3.3.2. Effect of Focal Plane Location on the Ablation Depth of Different Micro-Structure

The preceding study is performed during the initial stage of processing when the focal plane coincides with the upper surface of the specimen, which is a more convenient method of processing. However, the processing can be carried out by changing the spatial position relationship between the pulse and the micro-hole in Figure 3b, which in turn changes the total ablation depth at each position. Simulations for positive and negative defocusing amounts were run in this study, and the total ablation depths at each position with different defocusing amounts are shown in Figure 6a. When negative defocusing (the focal plane is below the specimen), the total ablation depth near the surface of the specimen is reduced, implying that the bottom of the micro-hole has shallower ablation than the mouth of the micro-hole. In other words, using negative defocusing, it is possible to ensure material ablation while decreasing micro-hole depth. Figure 6b shows the trend of total ablation depth within 0−600 μm of negative defocusing, as well as the rate of change of total ablation depth at negative defocusing, demonstrating how surface roughness can be precisely controlled over a wide range. The trend of total ablation depth under positive defocusing is like that of zero defocusing, which has been increasing. However, as one moves away from the upper surface of the specimen during positive defocusing processing (for example, at 600 μm), the rate of change of the total ablation depth quickly begins to decrease, as shown in Figure 6b. A slower rate of change enables more precise control of roughness. According to the findings of the preceding study, changing the single pulse energy as well as the amount of defocusing can provide precise control of roughness. However, the efficiency of femtosecond laser processing has been questioned, so it is critical to improving the material removal rate after achieving roughness control, which is important for the engineering application of femtosecond laser processing.

3.3.3. Effect of Scanning Speed on the Ablation Depth of Different Micro-Structure

The total ablation depth in this model is determined by both the energy and the rate of spot overlap. As previously stated, it is difficult to significantly increase the material removal rate by increasing the energy, so it can be investigated by increasing the spot overlap rate. One of the simplest methods, as shown in Equation (1), changes the spot overlap rate by adjusting the scanning speed to change the effective number of pulses at a single spot. Figure 7a depicts the total ablation depth at various scanning speeds. It has been discovered that slowing down the scanning speed can effectively increase the ablation depth at each point, and the ablation of the material can reach more than 8 μm at 100 mm/s, with the ablation depth increasing as one moves away from the upper surface of the specimen. It is demonstrated that slowing down the scanning speed increases the ablation rate and thus the material removal rate. Meanwhile, the rate of change in the total ablation depth, as shown in Figure 7b, indicates that the rate of change is faster at low scanning speed. When a specific roughness is required at a faster rate, we can use a low scanning speed and then adjust the single pulse energy or defocus amount for precise control later.

4. Conclusions

In this study, it was discovered experimentally that femtosecond laser-induced surface micro-structures of nickel-based alloys exist in the form of periodic micro-hole, the depth of which directly determines the material’s surface roughness. To obtain accurate and controllable surface roughness, this study extends the application of the two-temperature model and finds that the ablation depth of a single pulse in the z-direction decreases as one moves away from the focal plane. However, the number of effective pulses at a single-point increases, and they both determine the total ablation depth at different locations. The impacting phenomenon of various processes was investigated to improve surface roughness control. The results show that precise control of micro-hole depth can be achieved through two processes: changing the single pulse energy and the defocusing amount, but the processing efficiency is lower in such a case. In contrast, when processing at a low scanning speed, the ablation rate can be increased, which improves the material removal rate and increases efficiency. The results show that the coupling of multiple processes can provide a reliable theoretical basis for fast and accurate roughness regulation, as well as more possibilities for coating properties.

Author Contributions

Conceptualisation, S.L. and Z.Y.; methodology, S.L. and Z.Z.; formal analysis, S.L. and C.W.; resources, Z.Y.; writing—original draft preparation, S.L.; writing—review and editing, Z.Z. and C.W.; supervision, Z.Y. and C.W.; project administration, C.W. All authors have read and agreed to the published version of the manuscript.

Funding

This research is supported by the Young Elite Scientist Sponsorship Program by Cast (Grant No. YESS20200408) and the National Science and Technology Major Project (J2019-VII-0013-0153). This work was financially supported by Industry-University-Institute Cooperation Program of Aero Engine Corporation of China, China (Grant No. HFZL2020CXY014-1).

Institutional Review Board Statement

Not applicable.

Informed Consent Statement

Not applicable.

Data Availability Statement

The data presented in this study are available on request from the corresponding author.

Conflicts of Interest

The authors declare no conflict of interest.

References

  1. Perepezko, J.H. The Hotter the Engine, the Better. Science 2009, 326, 1068–1069. [Google Scholar] [CrossRef] [PubMed]
  2. McNally, C.A.; Folkes, J.; Pashby, I.R. Laser drilling of cooling holes in aeroengines: State of the art and future challenges. Mater. Sci. Technol. 2004, 20, 805–813. [Google Scholar] [CrossRef]
  3. Pollock, T.M.; Tin, S. Nickel-Based Superalloys for Advanced Turbine Engines: Chemistry, Microstructure and Properties. J. Propuls. Power 2006, 22, 361–374. [Google Scholar] [CrossRef]
  4. Clarke, D.R.; Phillpot, S.R. Thermal barrier coating materials. Mater. Today 2005, 8, 22–29. [Google Scholar] [CrossRef]
  5. Zhang, D.; Gong, S.; Xu, H.; Wu, Z. Effect of bond coat surface roughness on the thermal cyclic behavior of thermal barrier coatings. Surf. Coat. Technol. 2006, 201, 649–653. [Google Scholar] [CrossRef]
  6. VanEvery, K.; Krane, M.J.M.; Trice, R.W.; Wang, H.; Porter, W.; Besser, M.; Sordelet, D.; Ilavsky, J.; Almer, J. Column Formation in Suspension Plasma-Sprayed Coatings and Resultant Thermal Properties. J. Therm. Spray Technol. 2011, 20, 817–828. [Google Scholar] [CrossRef]
  7. Wang, Y.Y.; Li, C.J.; Ohmori, A. Influence of substrate roughness on the bonding mechanisms of high velocity oxy-fuel sprayed coatings. Thin Solid Film. 2005, 485, 141–147. [Google Scholar] [CrossRef]
  8. Staia, M.H.; Ramos, E.; Carrasquero, A.; Roman, A.; Lesage, J.; Chicot, D.; Mesmacque, G. Effect of substrate roughness induced by grit blasting upon adhesion of WC-17% Co thermal sprayed coatings. Thin Solid Film. 2000, 377–378, 657–664. [Google Scholar] [CrossRef]
  9. Amada, S.; Hirose, T. Influence of grit blasting pre-treatment on the adhesion strength of plasma sprayed coatings: Fractal analysis of roughness. Surf. Coat. Technol. 1998, 102, 132–137. [Google Scholar] [CrossRef]
  10. Curry, N.; Tang, Z.; Markocsan, N.; Nylén, P. Influence of bond coat surface roughness on the structure of axial suspension plasma spray thermal barrier coatings—Thermal and lifetime performance. Surf. Coat. Technol. 2015, 268, 15–23. [Google Scholar] [CrossRef]
  11. Xiao, F.; Yuan, S.; Liang, B.; Li, G.; Pehkonen, S.O.; Zhang, T. Superhydrophobic CuO nanoneedle-covered copper surfaces for anticorrosion. J. Mater. Chem. A 2015, 3, 4374–4388. [Google Scholar] [CrossRef]
  12. Su, F.; Yao, K.; Liu, C.; Huang, P. Rapid Fabrication of Corrosion Resistant and Superhydrophobic Cobalt Coating by a One-Step Electrodeposition. J. Electrochem. Soc. 2013, 160, D593–D599. [Google Scholar] [CrossRef]
  13. Qian, B.; Shen, Z. Fabrication of Superhydrophobic Surfaces by Dislocation-Selective Chemical Etching on Aluminum, Copper, and Zinc Substrates. Langmuir 2005, 21, 9007–9009. [Google Scholar] [CrossRef]
  14. Bharati, M.S.S.; Kalam, S.A.; Chandu, B.; Hamad, S.; Venugopal Rao, S. Instantaneous trace detection of nitro-explosives and mixtures with nanotextured silicon decorated with Ag–Au alloy nanoparticles using the SERS technique. Anal. Chim. Acta 2020, 1101, 157–168. [Google Scholar] [CrossRef]
  15. Zhang, H.; Colombier, J.P.; Li, C.; Faure, N.; Cheng, G.; Stoian, R. Coherence in ultrafast laser-induced periodic surface structures. Phys. Rev. B 2015, 92, 174109. [Google Scholar] [CrossRef]
  16. Vorobyev, A.Y.; Guo, C. Colorizing metals with femtosecond laser pulses. Appl. Phys. Lett. 2008, 92, 041914. [Google Scholar] [CrossRef]
  17. Florian, C.; Skoulas, E.; Puerto, D.; Mimidis, A.; Stratakis, E.; Solis, J.; Siegel, J. Controlling the Wettability of Steel Surfaces Processed with Femtosecond Laser Pulses. ACS Appl. Mater. Interfaces 2018, 10, 36564–36571. [Google Scholar] [CrossRef]
  18. Bonse, J.; Kirner, S.V.; Griepentrog, M.; Spaltmann, D.; Krüger, J. Femtosecond Laser Texturing of Surfaces for Tribological Applications. Materials 2018, 11, 801. [Google Scholar] [CrossRef]
  19. Valette, S.; Steyer, P.; Richard, L.; Forest, B.; Donnet, C.; Audouard, E. Influence of femtosecond laser marking on the corrosion resistance of stainless steels. Appl. Surf. Sci. 2006, 252, 4696–4701. [Google Scholar] [CrossRef]
  20. Long, J.; Fan, P.; Gong, D.; Jiang, D.; Zhang, H.; Li, L.; Zhong, M. Superhydrophobic Surfaces Fabricated by Femtosecond Laser with Tunable Water Adhesion: From Lotus Leaf to Rose Petal. ACS Appl. Mater. Interfaces 2015, 7, 9858–9865. [Google Scholar] [CrossRef]
  21. Liu, H.; Lin, W.; Lin, Z.; Ji, L.; Hong, M. Self-Organized Periodic Microholes Array Formation on Aluminum Surface via Femtosecond Laser Ablation Induced Incubation Effect. Adv. Funct. Mater. 2019, 29, 1903576. [Google Scholar] [CrossRef]
  22. Bizi-Bandoki, P.; Benayoun, S.; Valette, S.; Beaugiraud, B.; Audouard, E. Modifications of roughness and wettability properties of metals induced by femtosecond laser treatment. Appl. Surf. Sci. 2011, 257, 5213–5218. [Google Scholar] [CrossRef]
  23. Nayak, B.K.; Gupta, M.C.; Kolasinski, K.W. Ultrafast-laser-assisted chemical restructuring of silicon and germanium surfaces. Appl. Surf. Sci. 2007, 253, 6580–6583. [Google Scholar] [CrossRef]
  24. Zuhlke, C.A.; Anderson, T.P.; Alexander, D.R. Fundamentals of layered nanoparticle covered pyramidal structures formed on nickel during femtosecond laser surface interactions. Appl. Surf. Sci. 2013, 283, 648–653. [Google Scholar] [CrossRef]
  25. Yang, Z.; Ji, P.; Zhang, Z.; Ju, Y.; Wang, Z.; Zhang, Q.; Wang, C.; Xu, W. Fundamental 3D simulation of the femtosecond laser ablation for cooling hole drilling on Ni and Fe based aero-engine components. Opt. Commun. 2020, 475, 126237. [Google Scholar] [CrossRef]
  26. Anisimov, S.I.; Kapeliovich, B.L.; Perelman, T.L.; Physics, T. Electron emission from metal surfaces exposed to ultrashort laser pulses. J. Exp. Theor. Phys. 1974, 66, 375–377. [Google Scholar]
  27. Wellershoff, S.S.; Hohlfeld, J.; Güdde, J.; Matthias, E. The role of electron–phonon coupling in femtosecond laser damage of metals. Appl. Phys. A 1999, 69, S99–S107. [Google Scholar] [CrossRef]
  28. Wang, R.; Duan, W.; Wang, K.; Dong, X.; Fan, Z.; Mei, X.; Wang, W.; Zhang, S. Computational and experimental study on hole evolution and delamination in laser drilling of thermal barrier coated nickel superalloy. Opt. Lasers Eng. 2018, 107, 161–175. [Google Scholar] [CrossRef]
  29. Zhang, Z.; Yang, Z.; Wang, C.; Zhang, Q.; Zheng, S.; Xu, W. Mechanisms of femtosecond laser ablation of Ni3Al: Molecular dynamics study. Opt. Laser Technol. 2021, 133, 106505. [Google Scholar] [CrossRef]
  30. Zhigilei, D. Combined atomistic-continuum modeling of short-pulse laser melting and disintegration of metal films. Phys. Rev. B 2003, 68, 064114. [Google Scholar] [CrossRef]
  31. Zhigilei, L.V.; Lin, Z.; Ivanov, D.S. Atomistic Modeling of Short Pulse Laser Ablation of Metals: Connections between Melting, Spallation, and Phase Explosion. J. Phys. Chem. C 2009, 113, 11892–11906. [Google Scholar] [CrossRef] [Green Version]
  32. Zhang, J.; Chen, Y.; Hu, M.; Chen, X. An improved three-dimensional two-temperature model for multi-pulse femtosecond laser ablation of aluminum. J. Appl. Phys. 2015, 117, 063104. [Google Scholar] [CrossRef]
  33. Mannion, P.T.; Magee, J.; Coyne, E.; O’Connor, G.M.; Glynn, T.J. The effect of damage accumulation behaviour on ablation thresholds and damage morphology in ultrafast laser micro-machining of common metals in air. Appl. Surf. Sci. 2004, 233, 275–287. [Google Scholar] [CrossRef]
  34. Desai, P.D. Thermodynamic properties of nickel. Int. J. Thermophys. 1987, 8, 763–780. [Google Scholar] [CrossRef]
  35. Ho, C.-C.; Chang, Y.-J.; Hsu, J.-C.; Chiu, C.-M.; Kuo, C.-L. Optical emission monitoring for defocusing laser percussion drilling. Measurement 2016, 80, 251–258. [Google Scholar] [CrossRef]
  36. Harilal, S.S.; Freeman, J.R.; Diwakar, P.K.; Hassanein, A. Femtosecond Laser Ablation: Fundamentals and Applications. In Laser-Induced Breakdown Spectroscopy: Theory and Applications; Springer: Berlin/Heidelberg, Germany, 2014; pp. 143–166. [Google Scholar] [CrossRef]
Figure 1. (a) The femtosecond galvanometer scanning system; (b) schematic of laser scanning.
Applsci 12 08464 g001
Figure 2. Femtosecond laser-induced surface micro-structure morphology by SEM at 120 μJ (a) 5 scans; (b) 10 scans; (c) 20 scans; (d) 30 scans.
Applsci 12 08464 g002
Figure 3. (a) Ablation depth variation with laser fluence by TTM; (b) Spatial position between micro-structure and laser pulse.
Applsci 12 08464 g003
Figure 4. Femtosecond laser-induced surface micro-structure morphology by LSCM and SEM: (a) 80 μJ, 40 scans, (b) 80 μJ, 80 scans, (c) 80 μJ, 160 scans, (d) 80 μJ, 320 scans, (e) 100 μJ, 40 scans, (f) 100 μJ, 80 scans, (g) 100 μJ, 160 scans, (h) 100 μJ, 320 scans, (i) 120 μJ, 40 scans, (j) 120 μJ, 80 scans, (k) 120 μJ, 160 scans, (l) 120 μJ, 320 scans.
Applsci 12 08464 g004
Figure 5. (a) Variation of laser fluence (three descending curves) and beam radius (increasing curve) with distance from the focal plane; (b) variation of ablation (three descending curves) and average pulses per point (increasing curve) with distance from the focal plane; (c) variation of ablation depth of single point with distance from the specimen upper plane; (d) variation of the derivative of the effective ablation depth with distance from the specimen upper plane; (e) variation of micro-pore depth with the number of laser scans: simulation and experimental results.
Applsci 12 08464 g005
Figure 6. (a) Variation of ablation depth of a single point with distance from the specimen upper plane; (b) Variation of the derivative of the effective ablation depth with distance from the specimen upper plane.
Applsci 12 08464 g006
Figure 7. (a) Variation of ablation depth of single point with distance from the specimen upper plane; (b) Variation of the derivative of the effective ablation depth with distance from the specimen upper plane.
Applsci 12 08464 g007
Table 1. Physical parameters of the target material.
Physical ParametersSymbolValueReference
Reflectance of the target materialR0.65[30]
Depth of ballistic transportationLP13.5 nm[31]
Coefficient of the thermal conductivity of electronk091 J/(m·K·s)[27]
Heat capacity of latticeCl4.1 × 106 J (m3·K)[21]
Thermal conductivity of latticekl3.496 + 0.026733 × Tl − 1.11803 × 10⁻⁵ Tl2 + 3.60684 × 10⁻⁹ Tl3 + 8.23555 × 10⁻¹⁴ Tl4 J/(m·K·s)[28]
Electron-specific heat coefficientγ188.86 J/(m3·K2)[29]
Electron-phonon coupling strengthg3.6 × 1017 W/(m3·K)[27]
Table 2. Basic processing parameters of femtosecond laser ablation for TTM simulation.
Physical ParametersSymbolValue
Pulse energyE80/100/120 μJ
Laser fluenceF203.8/254.8/305.7 J/cm2
Repetition ratef100 kHz
Scanning speedv100/200/300/400/500/600/700 mm/s
Number of pulses at Z = 0n10/5/3.3/2.5/2/1.7/1.4
Wavelengthλ1030 nm
Beam radius at Z = 0 ω 05 μm
Table 3. Additional processing parameters of femtosecond laser ablation for TTM simulation.
Single Pulse Energy (μJ)Value (μm)
Initial depth8029.4
10040.5
12046.4
Absolute distance8016.1
10020.5
12026
Publisher’s Note: MDPI stays neutral with regard to jurisdictional claims in published maps and institutional affiliations.

