Featured Application
Loop regions in β2AR are critical hot spot regions, likely in other GPCRs, and can be used as potential allosteric drug targets.
Abstract
Two independent 1.5 μs long MD simulations were conducted for the fully atomistic model of the human beta2-adrenergic receptor (β2AR) in a complex with a G protein to investigate the signal transmission in a fully active state via mutual information and transfer entropy based on α-carbon displacements and rotameric states of backbone and side-chain torsion angles. Significant correlations between fluctuations in α-Carbon displacements were mostly detected between transmembrane (TM) helices, especially TM5 and TM6 located at each end of ICL3 and TM7. Signal transmission across β2-AR was quantified by shared mutual information; a high amount of correspondence was distinguished in almost all loop regions when rotameric states were employed. Moreover, polar residues, especially Arg, made the most contribution to signal transmission via correlated side-chain rotameric fluctuations as they were more frequently observed in loop regions than hydrophobic residues. Furthermore, transfer entropy identified all loop regions as major entropy donor sites, which drove future rotameric states of torsion angles of residues in transmembrane helices. Polar residues appeared as donor sites from which entropy flowed towards hydrophobic residues. Overall, loops in β2AR were recognized as potential allosteric hot spot regions, which play an essential role in signal transmission and should likely be used as potential drug targets.
1. Introduction
Allostery is an essential property of all proteins that is accepted to be intrinsic, irrespective of their functional requirements [1,2]. In fact, all proteins are dynamic entities, which sample distinct conformational states, and allostery is manifested as the shift in that conformational ensemble when one site of a protein is triggered by either a bound ligand or a mutation. In some proteins, the catalytic region at a distant site experiences a change in its functional capacity; thus, allostery becomes a critical part of the protein’s functional regulation [2,3,4]. In addition to conformational changes, allostery can also manifest itself as a change in the global dynamics of the protein. Based on Cooper and Dryden’s model proposed almost 30 years ago, allostery arises from the changes in frequencies and amplitudes of thermal fluctuations even in the absence of any conformational change in the backbone [5]. In this entropic model of allostery, there is no redistribution in the preexisting conformational substates. However, there is a change in the depth of the corresponding local minima in which a coordinated fluctuation of residues transmits the change from one site to another distant site [6,7,8].
Another important aspect of allostery is the pathway along which the residues fluctuating in the correspondence are distributed. These so-called “hot spot” residues are essential for site-to-site communication and are valuable for computer-aided drug design studies as they often provide high specificity/selectivity in comparison to orthosteric binding site residues, which are mostly conserved among species [9,10,11,12,13,14]. Over the years, several graph-based algorithms have been developed to estimate this functional allosteric circuit with its constitutive residues [15,16,17]. Here, we used correlated fluctuations between residues to establish an allosteric communication network, which is described in terms of entropy/information transfer from one site to another. Transfer entropy was previously introduced by Schreiber in 2000 as an information-theoretic measure to quantify the exchange of information between two systems [18] and was later used in several MD studies as an analysis tool to understand the effects of various structural changes [19,20,21,22,23].
In our current study, the transfer information of coupled fluctuations was not only based on translational Cα displacements, as often considered in several studies, but also on rotational displacements of backbone and side-chain torsion angles in each residue. The thermodynamic importance of side-chain variability was previously emphasized in calmodulin-ligand binding studies [24,25]. Furthermore, NMR mutational studies demonstrated the contribution of side-chain fluctuations to long-range communication networks [26]. Previously, using Monte Carlo sampling, DuBay and his coworkers demonstrated that allosteric communication in proteins can be transmitted by correlated side-chain fluctuations only [27]. However, they assumed a fixed backbone rotation and quantified the correspondence using a mutual information metric only. Here, our study will be the first to consider both backbone and side-chain rotatable bonds altogether to identify the correlated fluctuations in the rotameric states of these torsion angles. In addition, we will use another information-theoretic measure, the so-called “transfer entropy” to determine the dynamics of information transport, i.e., the direction of the exchange of information from one site to another distant site in the receptor at a future time.
The system under study is a human beta2-adrenergic receptor (β2AR) in complex with G protein representing the active state. It was subjected to two separate 1.5 μs long MD simulations, which amounted to a 3 μs long trajectory. Dynamic cross-correlation analysis based solely on α-Carbon displacements was followed by mutual information and transfer entropy calculations based on fluctuations in both α-Carbon displacements and rotameric state of backbone and side-chain rotatable bonds. A significant amount of correspondence was observed for fluctuations in rotameric states for residues in loop regions. This overlooked information carried via fluctuations within the rotameric well was emphasized for the first time in this study as an important component of allosteric regulation. Furthermore, the information transfer was directed from polar residues located in loop regions towards hydrophobic residues found in the transmembrane regions of the receptor, i.e., fluctuations in rotameric states of polar loop residues dictated the future fluctuations of rotameric states of hydrophobic transmembrane residues. This driver–follower relation between the loop and transmembrane regions of the receptor via polar/hydrophobic residue pairs elucidated for the first time an important allosteric communication network that can be used for allosteric drug design studies.
2. Materials and Methods
System Preparation. The active state of human β2AR in a complex with a Gs complex and bound to agonist BI-167107 with a PDB id of 3SN6 [28] was used as an initial state conformation for MD simulations. Prior to the runs, T4 Lysozyme, nanobody, and the agonist were removed, the missing extracellular (Ala176-His178) and intracellular (Phe239-Phe265) residues were completed via a MODELLER homology modeling tool [29], and the mutations T96M, T98M and E187N, which were used as linkers in crystal structure formation were reverted to their original state via the mutate plugin of the VMD visualization tool [30]. The system was then embedded into a palmitoyloleoyl-phosphatidylcholine (POPC) lipid bilayer using VMD’s membrane plugin tool [30], solvated with TIP3P water molecules, and later ionized with 160 Na+2 and 154 Cl−1 counter ions for neutralization, which is necessary for the Particle-Mesh Ewald summation method. The system with the dimensions of 125 × 125 × 165 Å was prepared with a total of 228,299 atoms, of which 54,707 were water molecules. The CHARMM36 forcefield was used to describe the interaction potential of protein and lipids [31]. Periodic boundary conditions were applied in an isothermal, isobaric NPT ensemble with a constant temperature of 310 K and a constant pressure of 1 bar. Temperature and pressure were controlled by the Langevin thermostat and Langevin piston barostat, respectively [32]. The equations of motion were integrated with a 2 fs time step, and the SHAKE algorithm was used to constrain covalent bonds involving non-water hydrogen bonds with a non-bonded cutoff value of 12 Å.
Two independent 1.5 μs long MD runs were performed via the NAMD v2.13 software tool. Each run was initiated with three steps of initial energy minimizations under flexible cell conditions, including (i) the melting of lipid tails when the rest of the atoms were fixed, (ii) minimization and equilibration when protein was constrained but lipid, water, and ion atoms were released, and (iii) minimization and equilibration with the release of all atoms, which was then followed by equilibrium and production runs under constant area according to the membrane proteins’ simulation protocol of NAMD [33]. The lipid bilayer in the system was continuously monitored in the minimization and equilibration steps until reaching 63.69 Å2 area per lipid ratio, which was in the range of the experimentally reported value of 64.3 ± 1.3 Å2 [34,35].
Dynamic Cross-Correlation. Correlations between atomic fluctuations from average positions of two residues i and j were calculated using the following equation:
The time average of the dot product of and was taken and normalized. and represent the atomic fluctuations of α-Carbons only. If then the fluctuations of atoms i and j are perfectly correlated (fluctuates in the same direction), if then the fluctuations of atoms i and j are perfectly anticorrelated (fluctuates in opposite directions), and if , then the atoms i and j fluctuate independently.
Contact map generation. The cutoff distance () for heavy atoms (C, N, O, S) was taken as 6 Å, below which the atoms were considered to be in contact. The incorporation of all heavy atoms provides a more accurate representation of the contact profile than that of α-Carbons only. The formula used for contact map calculation was defined as:
Contact percentages over the MD trajectory were calculated with and the threshold was set to 75% of the whole trajectory to recognize stable contacts.
Mutual Information (MI). Mutual information based on α-Carbon positional fluctuations between residue pairs i and j was calculated using the following expression:
where represents the joint probability of observing the fluctuation of residue i in state k and that of residue j in state l. Mutual information is a non-negative and symmetric quantity, and zero if the fluctuations of residue i are independent of the fluctuations of residue j. To calculate the probability of occurrence, , the number of states k and l, also described as the number of bins, , were determined for each residue separately using Shannon’s entropy criterion. The number of bins (or states) for each residue was determined as the value for which Shannon’s entropy reaches its maximum. The convergence criterion was expressed as:
where is the Shannon entropy for residue i with . Similarly, mutual information based on fluctuations in backbone and side torsion angles were expressed as:
where denotes the joint probability of observing the joint state of residues i and j. Here, and represent the rotameric states of backbone and side-chain dihedrals in residues i and j, respectively. Based on the distribution of rotameric states, the number of discrete rotameric states (or bins) for backbone dihedrals was set to 3, whereas for side-chain dihedrals, the number of states varied between 0 and 6 according to the rotamer library [36].
Transfer Entropy. Transfer entropy is defined as the reduction in uncertainty in future states of residue at by knowing the states of residue i at time . Based on Shreiber’s work [18], it was defined by Erman et al. [22,23] as;
where is the conditional entropy of residue at time given the values of at time . The second term is the conditional entropy of residue at time given the values of and at time . When entropies are expressed as a function of the probability of occurrences of positional fluctuations , becomes,
A similar expression for transfer entropy was used for rotameric states, where was replaced by , which includes the information of the rotameric state of all rotatable sp3-sp3 bonds in each residue . However, for a residue pair such as Lys-Arg, where both residues include four side-chain rotatable bonds, each having 3 alternative rotameric states, the joint probability is comprised of () different rotameric states. For a protein system with 312 residues, the calculation of the transfer entropy becomes computationally intractable as it exceeds the maximum size an array can hold. Thus, only the first side-chain rotameric state was considered together with two backbone torsion angles, i.e., (), which yielded different states per residue. Finally, the net transfer entropy was determined by taking the difference between TE from to and that from to as,
The source codes for both mutual information and transfer entropy calculations were written by the authors using C programming language and can be provided upon request.
3. Results and Discussion
The active state of the receptor was well preserved throughout the simulation. As all members of the G protein-coupled receptor (GPCR) superfamily, human β2AR shares the 7TM structural motif, which consists of seven transmembrane-spanning alpha helices connected by loop regions at the intra- and extracellular sides of the membrane (See Figure 1a). Among other loop regions, the intracellular loop 3 (ICL3) plays a critical role in the recognition of G proteins [28]. In addition, there exists an allosteric coupling between ICL3 and the extracellular regions of the receptor, which incorporate the orthosteric binding site [37,38,39]. Conformational changes observed at the intracellular part affect the extracellular part, specifically the binding site, which holds key residues such as Asp113 on transmembrane helix 3 (TM3), Ser203, Ser204, Ser207 on TM5, Phe289, Asn293 on TM6, and Asn312 on TM7.
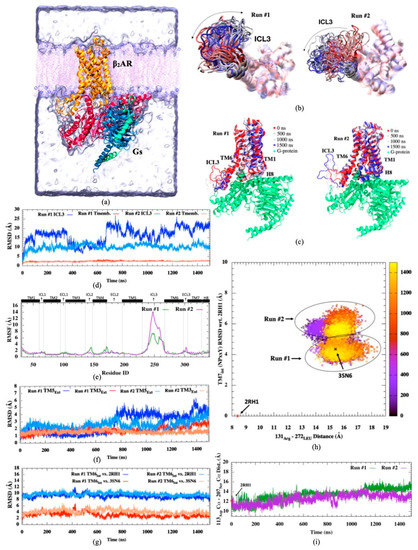
Figure 1.
(a) Representation of human β2AR in a complex with Gs complex in a membrane environment (created via VMD visualization tool [30]), (b) Intracellular views of 20 snapshots of ICL3 (c) side views of β2AR-Gs complex for 4 different snapshots colored from red (initial) to white (intermediate), to blue (final) during simulation (d) RMSD profiles of ICL3 and transmembrane regions, (e) RMSF profiles (f) RMSD profile of extracellular parts of TM3 and TM5 helices, (g) RMSD profiles of intracellular parts of TM6, (h) RMSD of NPxxY motif of TM7 with respect to the inactive state (PDB id:2RH1) versus ionic lock distance (Arg131Cα-Leu272Cα), (i) distance profile for Asp113Cα-Ser207Cα residue pair.
The most important conformational changes observed in two independent runs were summarized in Figure 1. The active state of the receptor was well characterized by an approximately 11 Å outward movement in the cytoplasmic end of TM6, and consequently, the adjoining ICL3 was pushed aside towards the lipid molecules (See Figure 1a–c). This unique conformation of the active state was only preserved in the presence of a G protein, which displaces TM6 and ICL3 outward for easy access to the receptor’s binding cavity. Aligned snapshots of the receptor indicated high mobility in ICL3 in both runs, slightly enhanced in the second run. RMSD profiles of transmembrane helices 3, 5, 6, and 7 (TM3, TM5, TM6, and TM7) indicated that their initial states were well preserved throughout the simulation within the boundaries characterizing the active state of the receptor (Figure 1d–h). On the other hand, the distance between α-Carbons of two key residues at the orthosteric binding site, Asp113, and Ser207, displayed a slight increase from a range of 10–12 Å up to 13–16 Å in both runs, especially more noticeable in Run #1 (See Figure 1i). Our simulations were conducted with no ligand attached at the orthosteric binding site. Thus, the increase in the distance between these two key residues clearly indicated the tendency of the cavity to expand a bit in the absence of any agonist attached, irrespective of the fact that the active state was well preserved throughout the receptor, especially at the G protein binding site.
Previously, we attempted to simulate the active state in its free form, i.e., its G protein partner removed (PDB id: 3SN6), and observed that the initially opened and swept away ICL3 region and its adjoining transmembrane helix 6 (H6) swiftly changed position towards the core of the receptor at the very early stages of the simulation (in the first 50 ns), closed itself towards the core of the receptor, and blocked the G protein binding cavity. Moreover, in a simulation study conducted by Ozgur et al. [37], bond restraints were employed at the orthosteric binding site to preserve certain key distances between TM3 and TM5 within the experimentally reported range that represented the active state. No G protein was attached, yet ICL3 preserved its initial open conformation as if there was a G protein nearby, although the TM6’s upward tilt characterizing the active state was not observed. Clearly, the conformational state of the orthosteric binding site allosterically affects the conformational state of the distant G protein binding site. It might facilitate the opening of the cavity for the initial binding of G protein, yet the fully active state can only be achieved and preserved when there is a G protein nearby interacting with the receptor. In other words, the major conformational shift for the characteristic tilt in TM6 requires an energy boost that a G protein can only provide and thus cannot be achieved in the course of an MD simulation, which is confined to low energy conformational states. Moreover, the absence of an agonist, which is accompanied by only a slight expansion at the unoccupied orthosteric binding site, does not destabilize the active state, which is already securely preserved by a G protein.
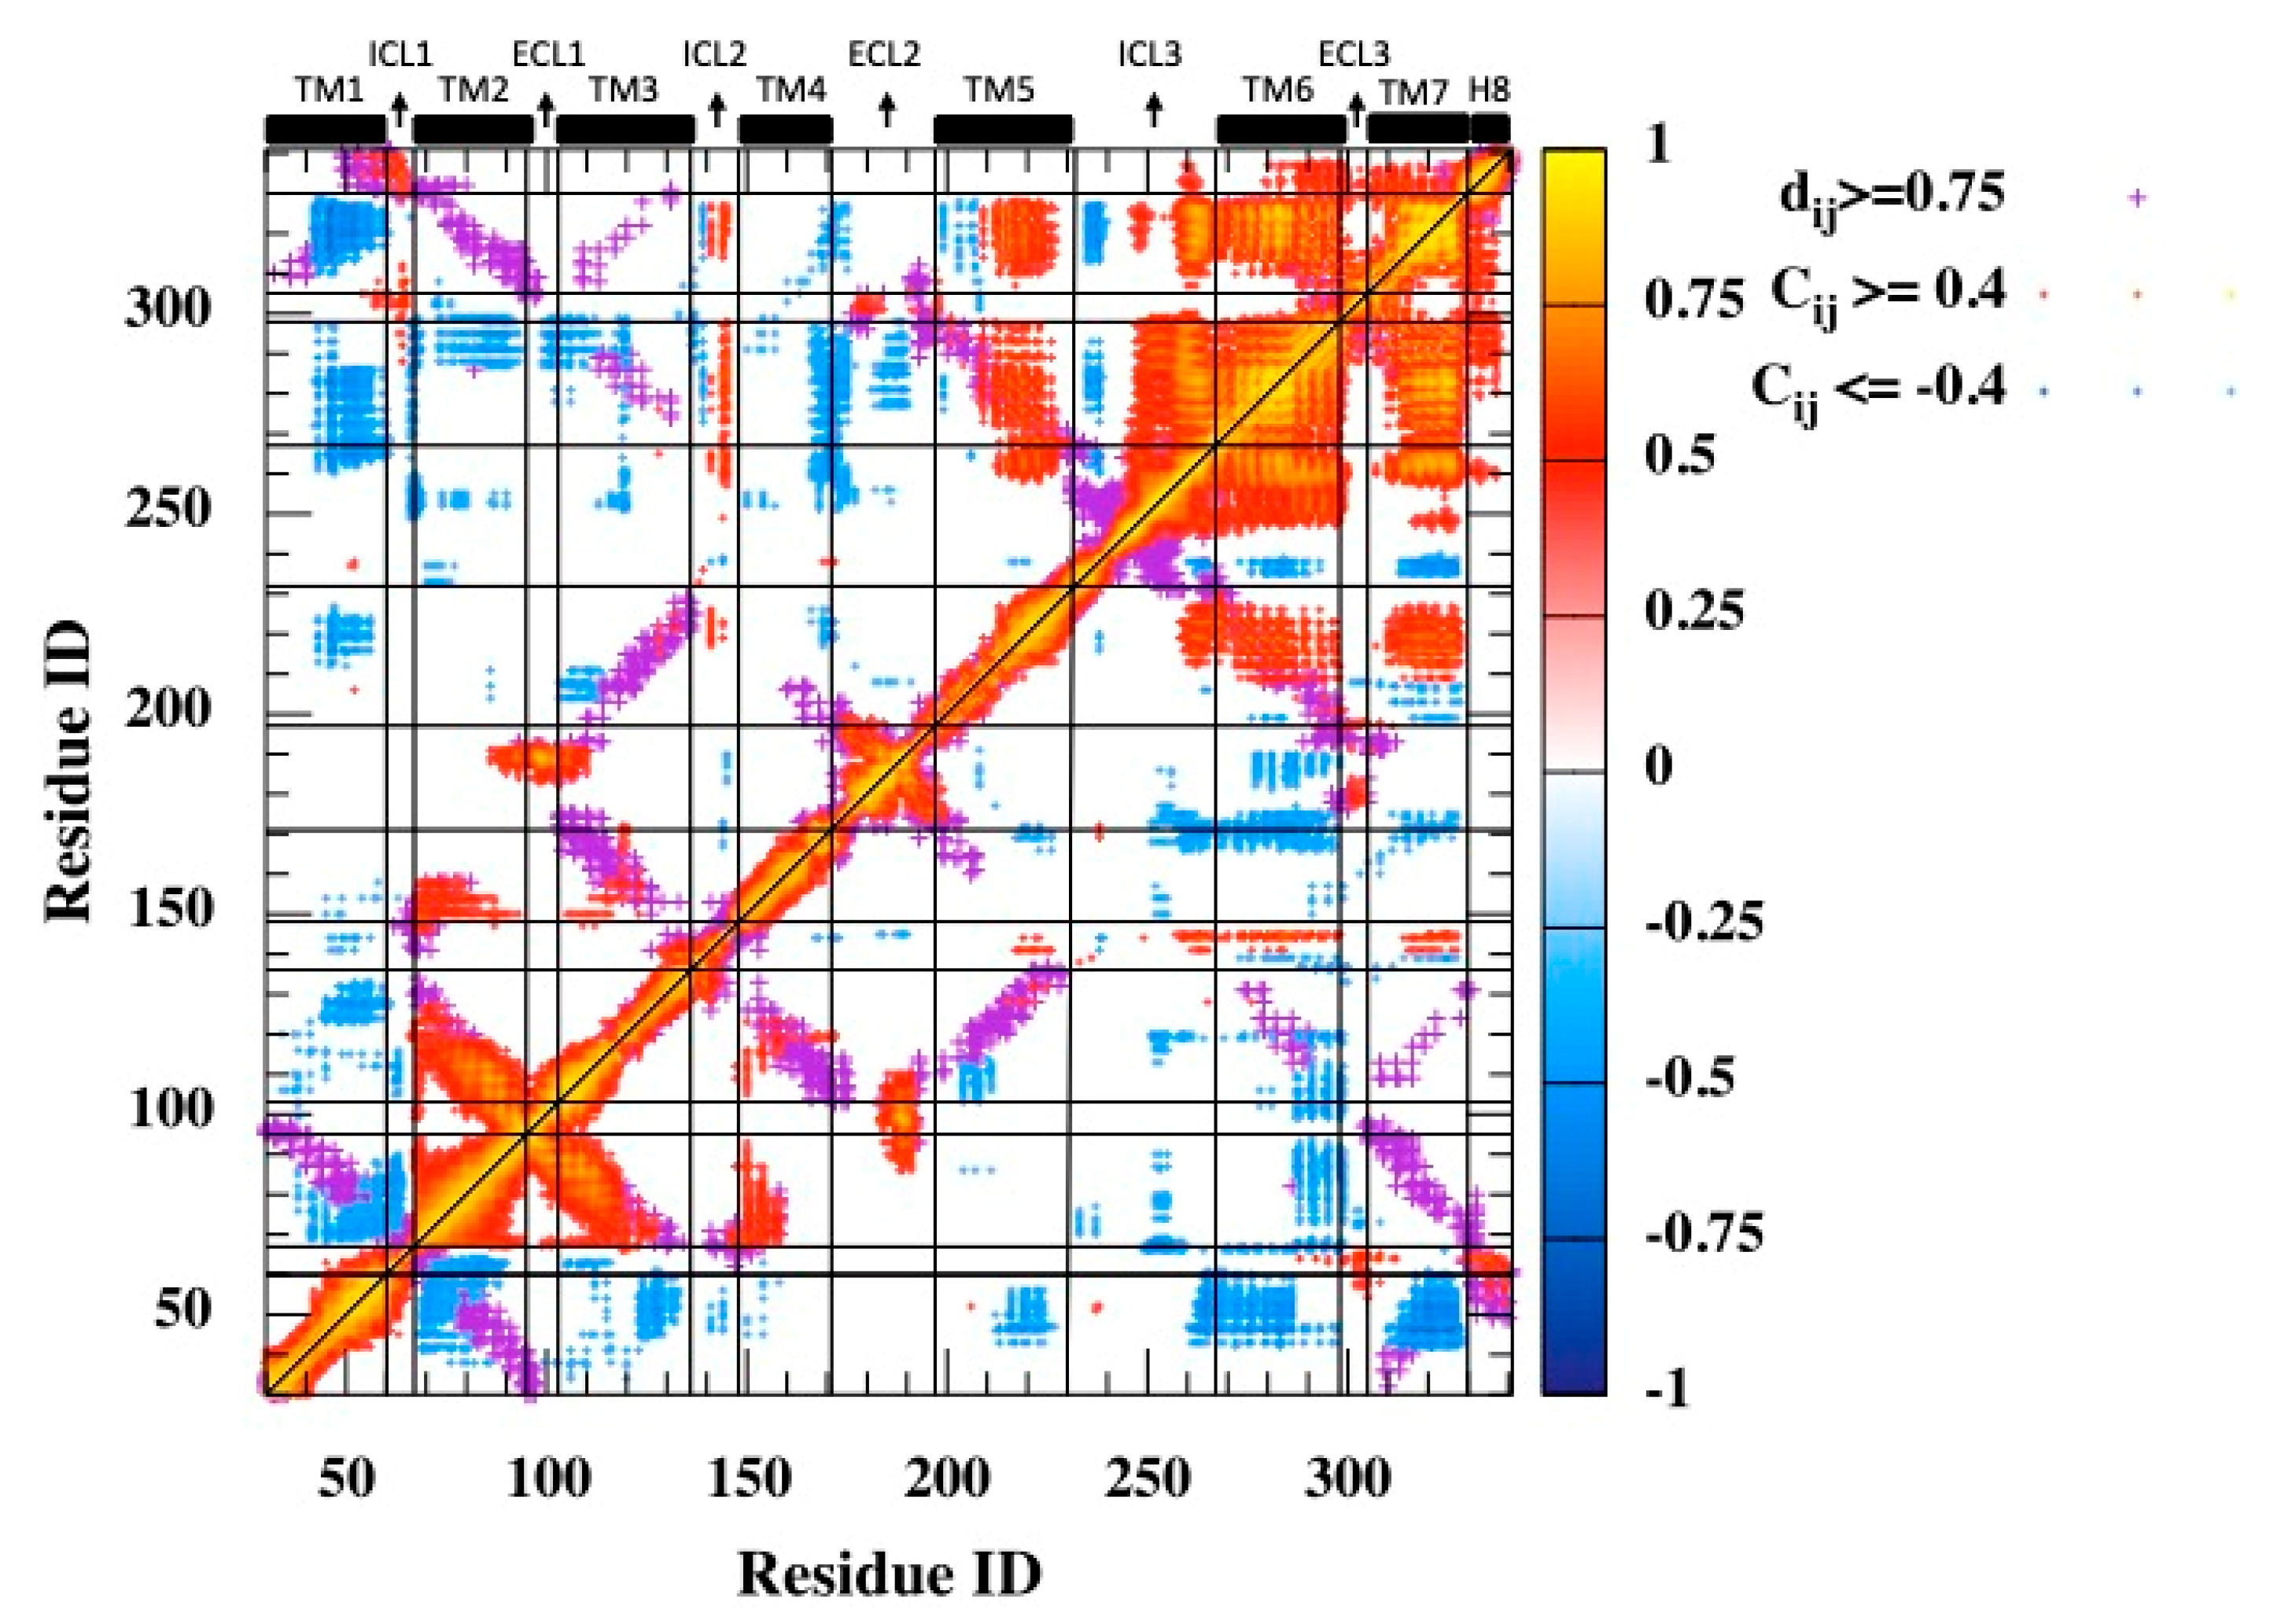
Cross-correlations between α-Carbon displacements disclosed TM6 as the dominating site fluctuating in concert with the rest. It is important to highlight distant regions that display positional fluctuations that are correlated with each other, as they might indicate the presence of some potential sites in communication along the allosteric pathway. Thus, the contact map was overlaid with the residue-pair cross-correlation map, as depicted in Figure 2. The contact map was generated by using the heavy atoms with a threshold distance of 6 Å. Distant and correlated regions were mainly detected in the second half of the receptor composed of TM5, TM6, ICL3, TM7, and its small extension H8, especially TM6, which incorporated most critical sites for binding intracellular G proteins and small extracellular molecules. Especially, Phe289, Asn293 on TM6, and Asn312 on TM7, which are known to be key residues interacting with the ligand at the orthosteric site, fluctuated in the same direction, with ICL3 having correlation values as high as 0.8. Another set of critical residues at the orthosteric binding sites Ser203, Ser204, and Ser207 located at the extracellular part of TM5 negatively correlated with the distant helical segment TM7 with a value of around −0.5. Specifically, it is interesting to observe both Ser203 and Ser207 on one side of the binding cavity fluctuating in opposite directions with Asn312 on the opposite side.

Figure 2.
Residue-pair cross-correlation map for 3 μs MD trajectory. Only and are represented. Magenta dots represent the contact map (threshold distance of 6 Å).
Moreover, ICL2, the second-most important intracellular loop after ICL3, distantly fluctuated in concert with the second half of the receptor (TM5–H8). Finally, the first transmembrane helix TM1, which incorporated the free amino-terminal tail, mostly fluctuated in the opposite direction from the rest of the receptor, especially the distant helices TM6, TM7, and to some extent with TM3 and TM5, which all incorporated critical key residues at the orthosteric binding site.
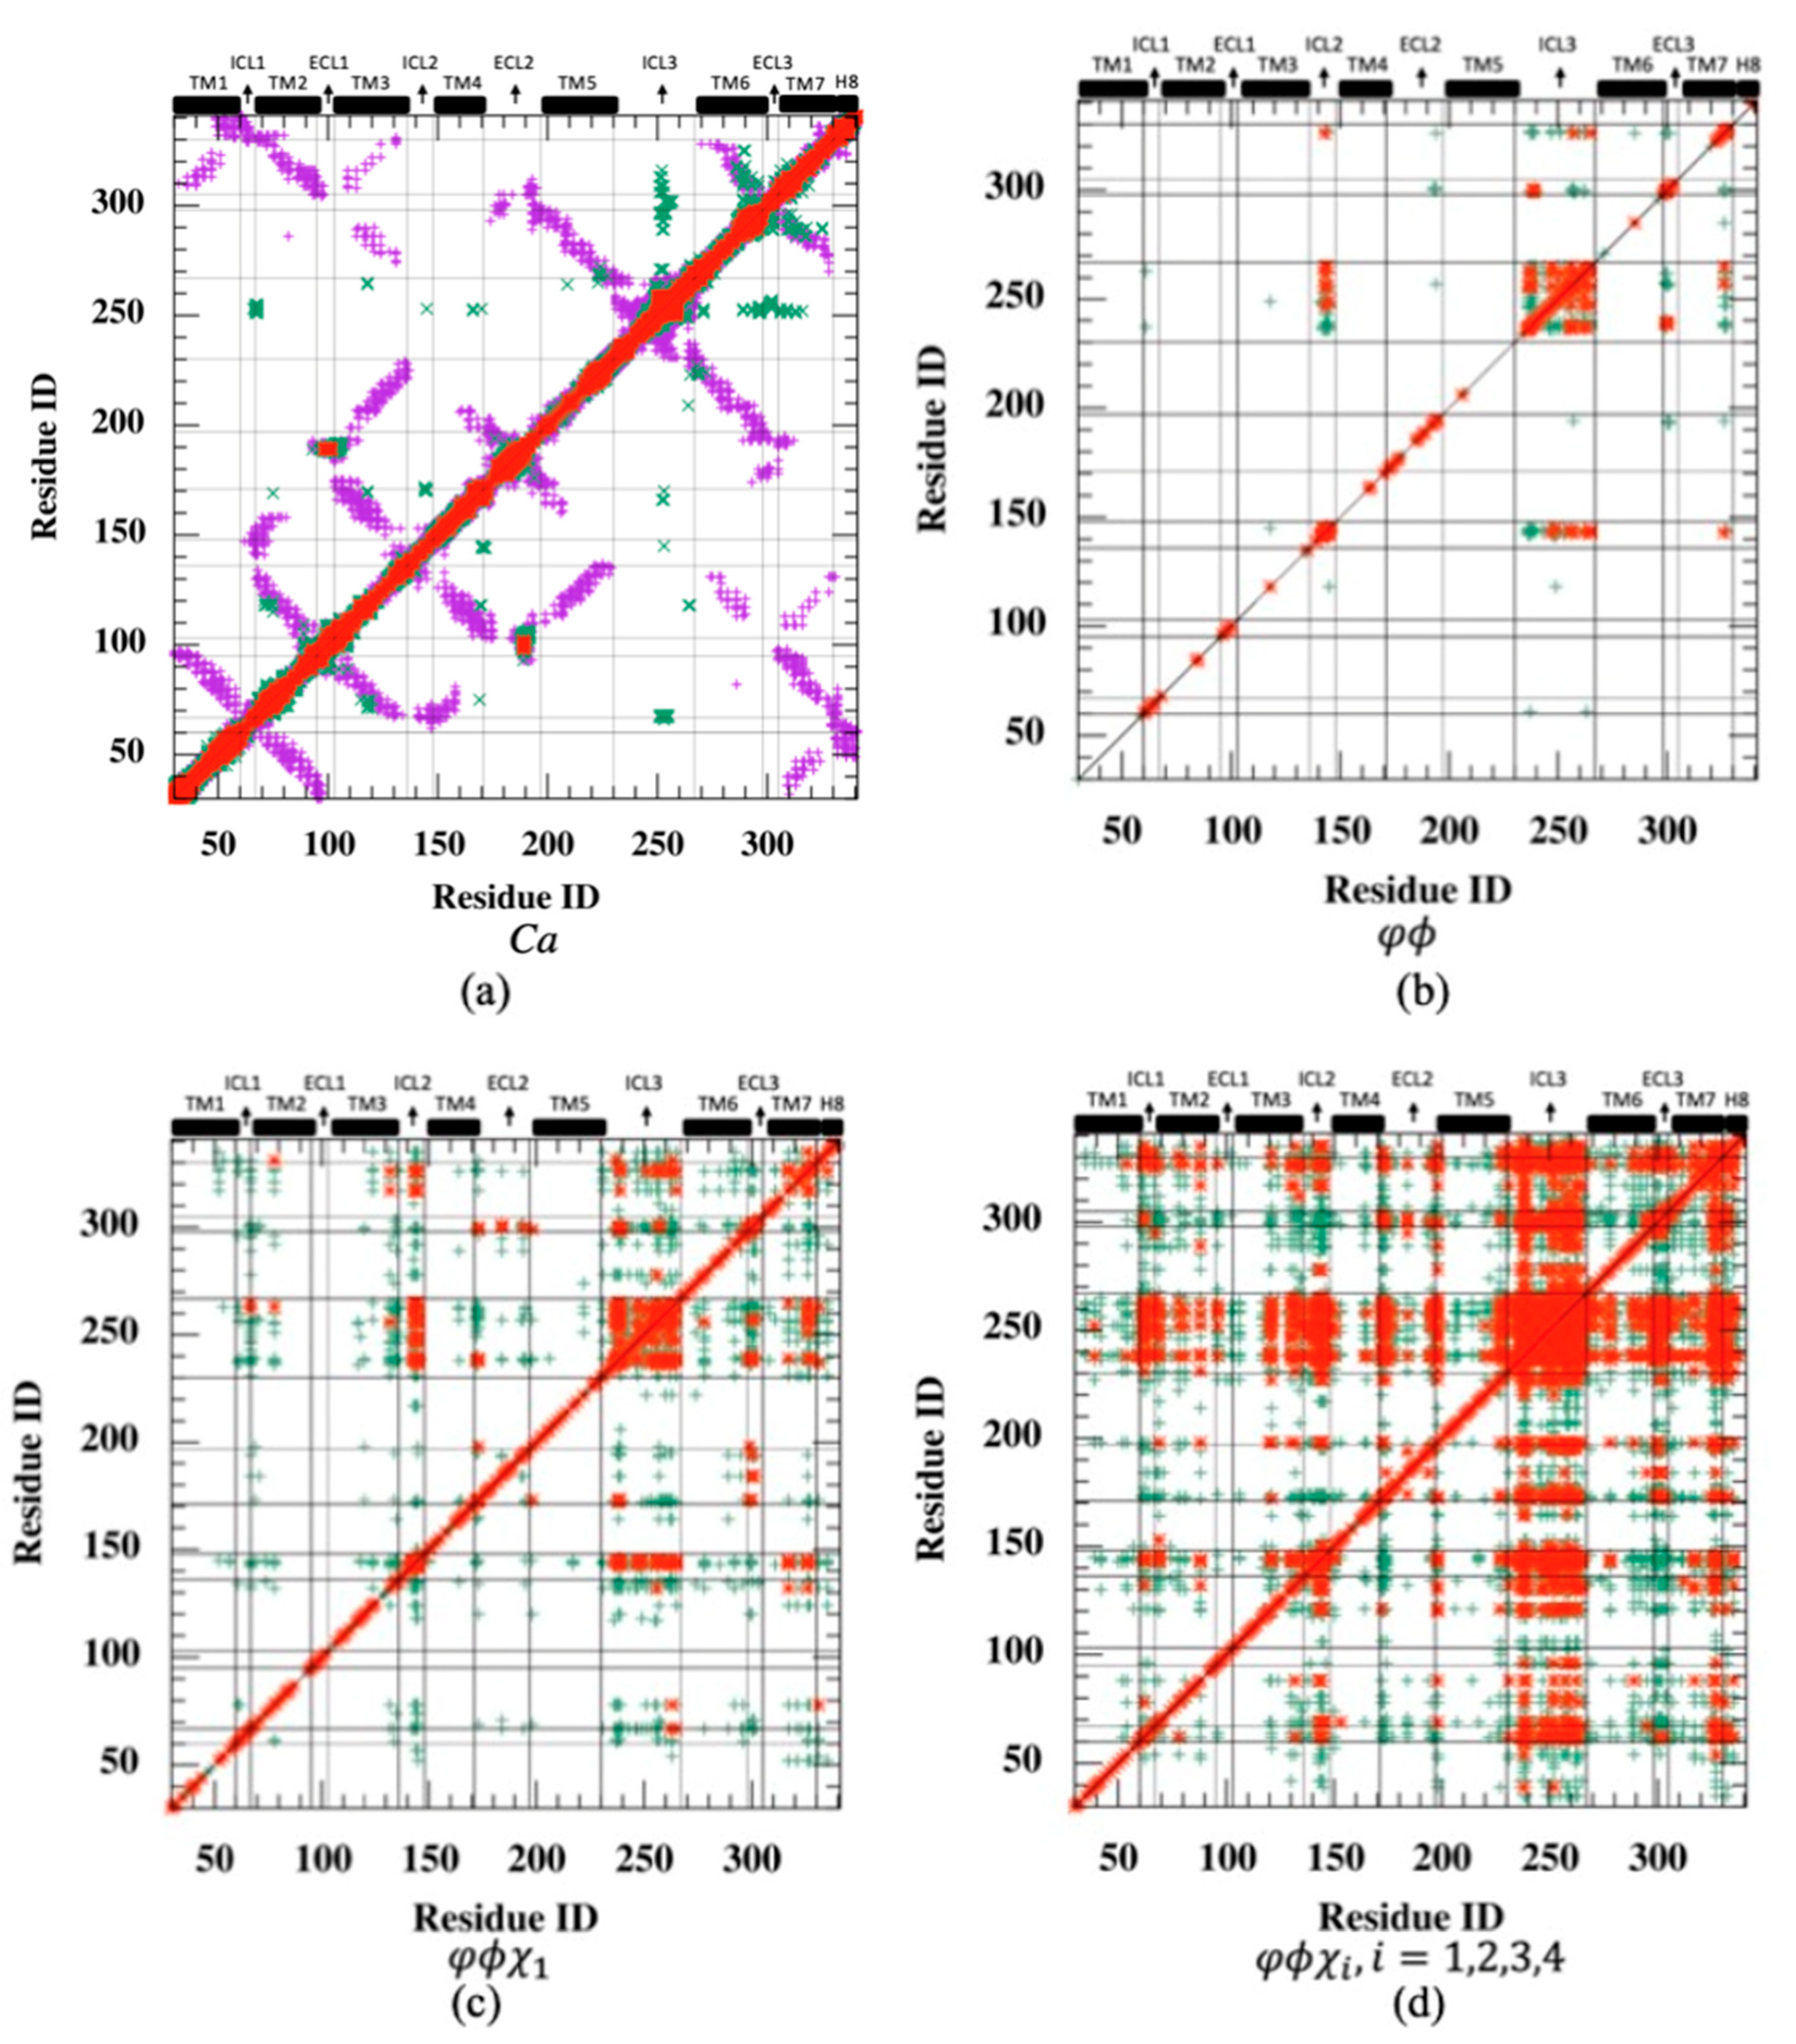
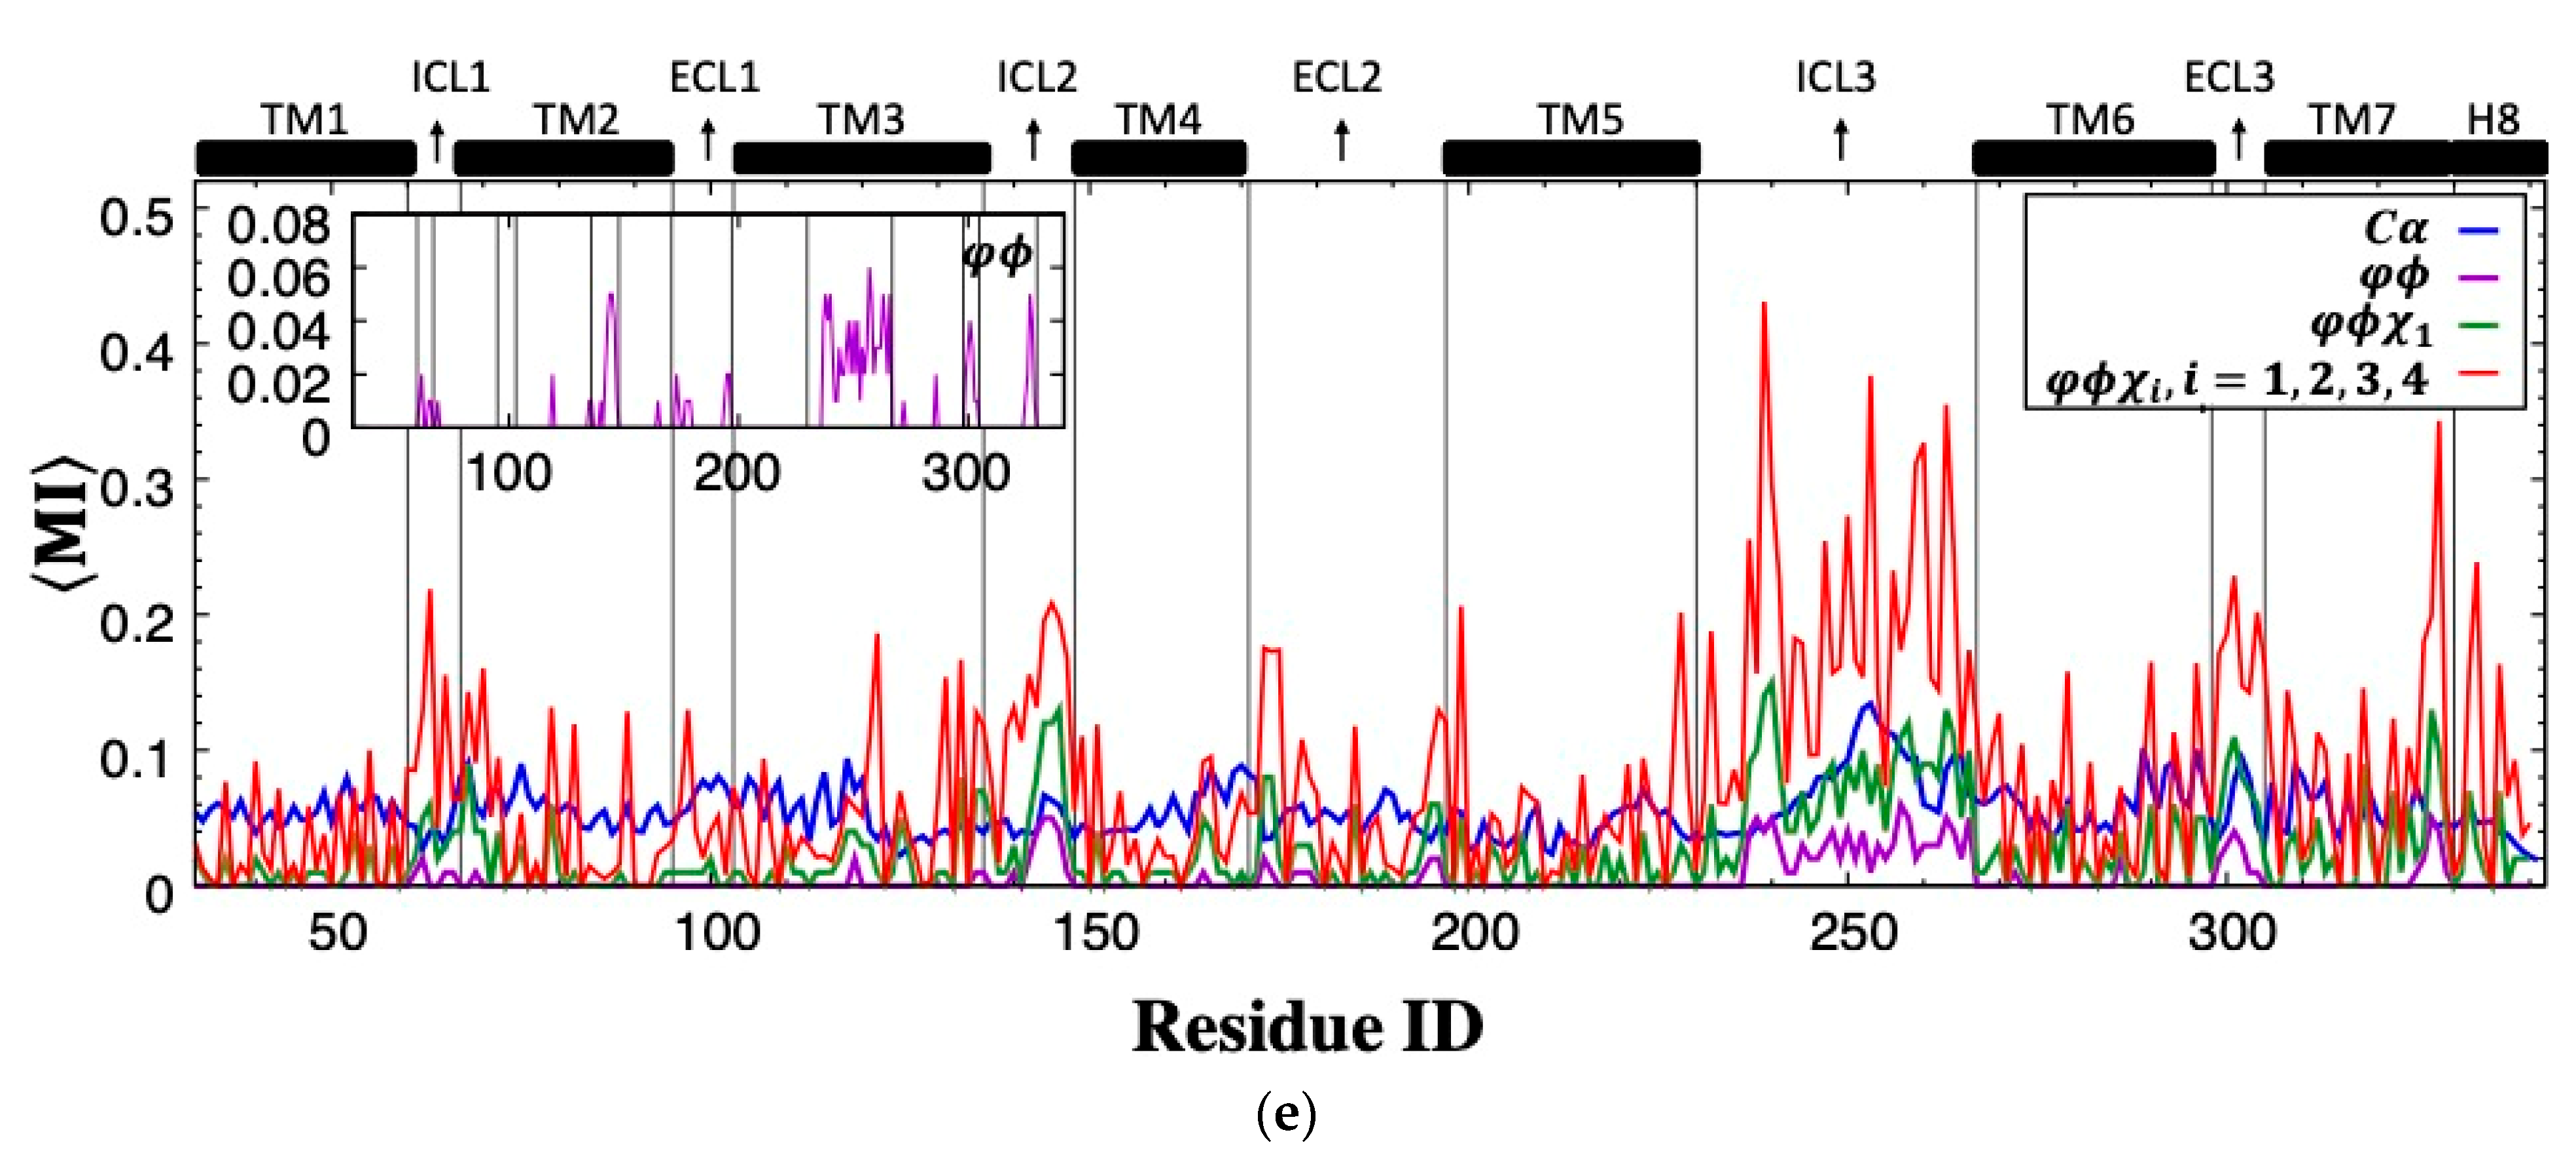
Rotamer-based mutual information is mostly observed between loop regions and shared among polar residues. Cross-correlation is a metric that ignores the correlated motions in orthogonal directions. Therefore, even perfectly correlated motions important for allosteric signaling may be overlooked if the positional fluctuations are perpendicular to one another. On the other hand, mutual information, a metric in information theory, determines the correspondence between fluctuations of residue pairs, irrespective of their directions. MI was first calculated for the positional fluctuations of backbone Cα atoms, and as anticipated, the highest MI values (max. 4.01) were observed for residues close in space (see the diagonal line in Figure 3a). In addition, it is important to recognize high MI values observed between spatially distant residues as they would likely indicate the existence of an allosteric communication network, which is usually characterized by distant regions with a high degree of correspondence. As depicted in Figure 3a, mutual information was plotted together with a contact map to unravel the long-distance coupled motions of the allosteric network (see magenta dots). However, the only significant correspondence in distant Cα fluctuations was detected between a few residues located in ICL3’s midpoint and the distant extracellular parts of TM6, extracellular loop 3 (ECL3), and TM7, which incorporate critical orthosteric binding site residues such as Phe289, Asn293, and Asn312. It is obvious that mutual information between backbone atomic fluctuation was mostly shared by neighboring residues either close in sequence or space. For all MI maps in Figure 3, red dots represent MI values greater than 0.5, and green dots represent MI between 0.25 and 0.5. Any MI less than 0.25 was not displayed. For clarity, the contact map was illustrated in Figure 3a only.
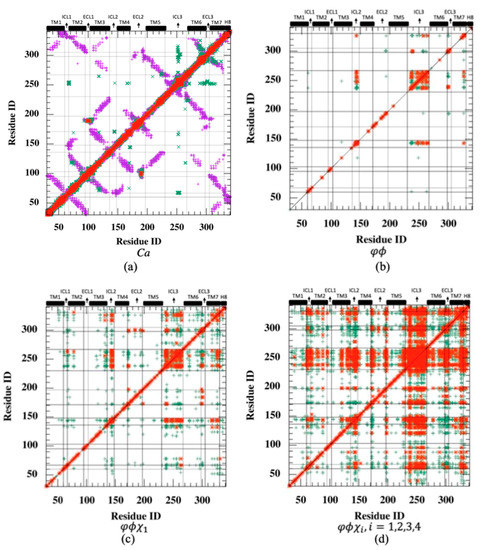

Figure 3.
Residue-pair mutual information (MI) plotted with contact map (threshold: 6.0 Å) for (a) backbone , (b) backbone torsion angles (c) backbone torsion and first side-chain torsion angles , (d) backbone torsion and all side-chain torsion angles . (e) Mean mutual information per residue averaged over the rest of the receptor. (Green dots: 0.25 < MI ≤ 0.5; red dots: MI > 0.5).
The residue-pair MI was next determined for backbone torsion angles and in each residue. Despite low MI values observed almost everywhere in the receptor (highest MI = 2.59), the relatively high correspondence between ICL3 and ICL2 regions is noticeable (See Figure 3b). Conformational degrees of freedom were mostly dominated by torsion angles in loop regions; thus, the correspondence of loop regions was anticipated. However, the amount of such correspondence appeared to be limited to a few loop regions when only backbone torsion angles were incorporated. Hence, the next attempt was to combine the information of backbone torsion angles with that of the first side-chain torsion angle, . Maximum MI was slightly increased to 3.72 from 2.59, and the highest MI values were still observed between ICL3 and ICL2 with increased intensity, as depicted in Figure 3c. Additionally, both ICL3 and ICL2 started to share information with the intracellular part of TM7, and moreover, two distant extracellular loop regions, ECL2 and ECL3, displayed some noticeable correspondence with each other.
The total effect of rotational degrees of freedom on MI values can only be disclosed when all possible side-chain torsion angles were considered together with backbone torsion angles. As illustrated in Figure 3d,e, the increasing trend in MI values between ICL3 and ICL2 was noticeable. Maximum MI reached a value of 6.55. In addition, ICL3 started to share information with the majority of the receptor, including mainly loop regions such as ICL1, ICL2 at the intracellular part, two ends of the extracellular loop ECL2, the entire ECL3, and also the intracellular part of TM7 with its adjacent tail H8. Overall, it is clear that mutual correspondence driven by torsional degrees of freedom mainly existed between loop regions.
It is important to identify residue types most often involved in sharing mutual information, especially among distal ones, as they might point to potential allosteric hub regions. Residue pairs were categorized based on the degree of separation of two residues in the primary sequence, as proximal if 1–4 positions apart and otherwise distal. As illustrated in Figure 4, the highest amount of MI was shared among polar residues, which incorporated Arg predominantly. Moreover, two bulky residues Phe and Tyr, with the highest MI values among hydrophobic residues, also paired with polar Arg to a large extent. On the other hand, no significant correspondence was observed among hydrophobic residues. The dominating feature of polar residues in sharing MI can be attributed to their abundance in loop regions, which displayed a noticeably higher amount of MI than transmembrane regions in addition to their higher amount of rotational degrees of freedom. As illustrated in Figure 4c, the frequency of a residue type in loop regions is slightly proportional to its average shared MI. Almost all polar residues indicated with red dots displayed frequency values above 5%, which represents the random occurrence, whereas only three hydrophobic residues, Gly, Phe and Leu, had frequencies above 5%. On the other hand, two polar residues Ser and Thr, both with hydroxyl groups in their side-chains and frequency values above 7%, displayed low average MI values.
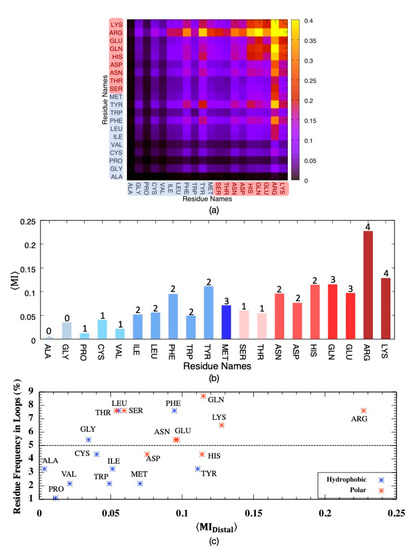
Figure 4.
Mutual information for pairs of distal residues classified as either hydrophobic (blue tones) or polar (pink tones) considering all backbone and side-chain torsion angles , averaged over (a) residue pairs, (b) residue types with the number of side-chain torsion angles and (c) residue frequency in loop regions versus average MI.
Interestingly, Arg and Lys, with four rotatable bonds on their positively charged side-chains, displayed slightly different average MI values with respect to each other; with an average MI of 0.23 ± 3.64, Arg shared twice as much information as that of Lys despite the fact that both residues were found in nearly equal amounts everywhere in the receptor (~7% in loops and ~3% in transmembrane helices, See Supplementary Figure S1). The side-chain of Arg has a positively charged guanidium moiety, which favors π-stacking with aromatic rings and has the potential of forming five hydrogen bonds. As the side-chain of Arg protrudes from the surface of the protein, it has a crucial role in protein–protein interactions. Hence, it is not surprising to see the highest correspondence between Arg and the majority of residues, especially polar ones.
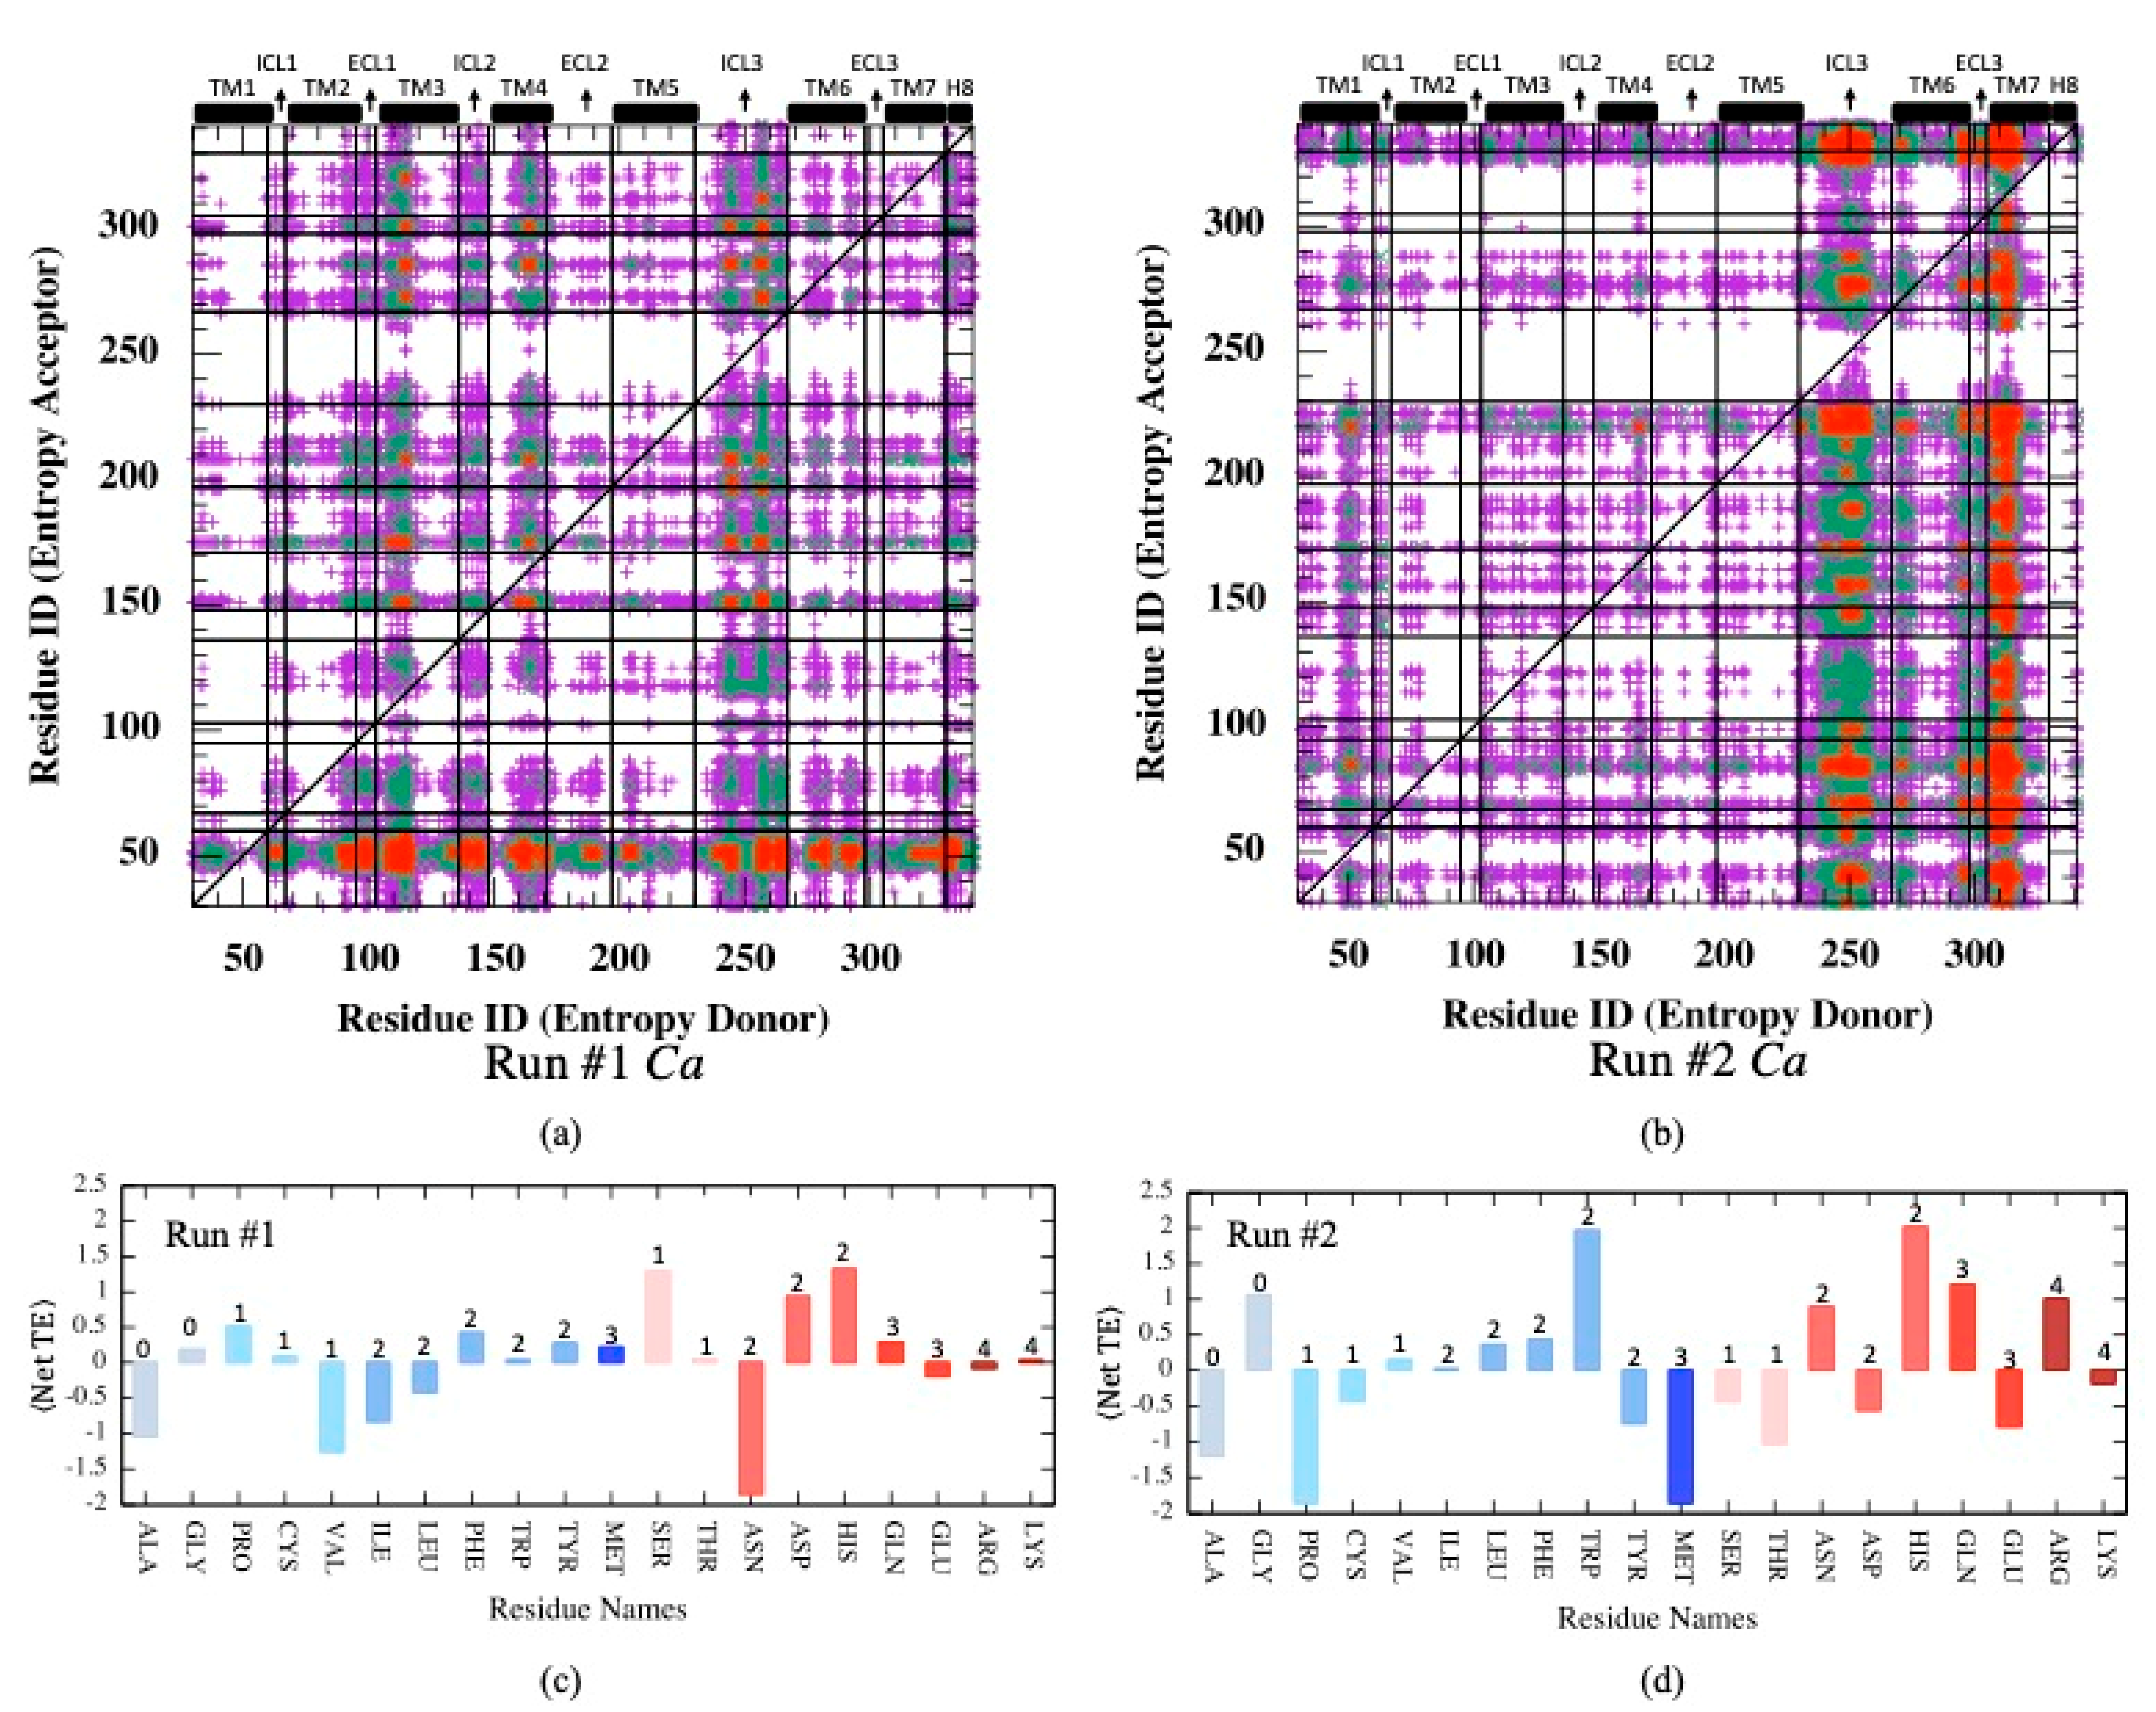
Mutual information is a measure of correspondence between two residues i and j with respect to their dynamic behaviors, such as positional fluctuations (Cα) or torsional changes happening at the exact same moment. Transfer entropy is another important feature that relates the dynamic states of two residues separated by a time lag parameter τ. In other words, transfer entropy measures the amount of information transferred from residue i to residue j at a later time. Knowing the state of residue i, the state of another residue j at a distant site can be predicted if there exists an allosteric communication pathway connecting the two sites. Similar to mutual information analysis, net transfer entropy was first calculated based on the backbone Cα atom’s positional fluctuations (see Equations (7) and (8) in Section 2). As depicted in Figure 5a, in one of two MD runs, the intracellular loops ICL3, ICL2, TM3, and TM4 moderately appeared as entropy donor sites, whereas the intracellular part of TM1 was detected as a dominant acceptor site. The second MD trajectory displayed a relatively different distribution profile for donor/acceptor sites; ICL3, together with the extracellular part of TM7, appeared as two dominant entropy donor sites, whereas no major acceptor site was detected (See Figure 5b). The maximum amount of information transferred was observed as 16.32 in Run#1 and 18.15 in Run#2. These results clearly indicate alternative communication pathways that can be established via positional fluctuations of Cα atoms for the same system in two separate runs.
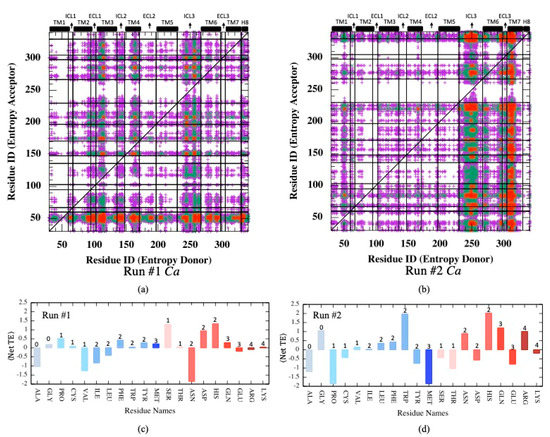
Figure 5.
(a,b) Net transfer entropy from residue
to residue (See Equation (8)) based on Cα fluctuations for two independent MD runs. (c,d) Net transfer entropy averaged for each residue type categorized as either hydrophobic (blue tones) or polar (pink tones) and the number of side-chain torsion angles k indicated at the top of each bar. Color code for (a,b): no display for ⟨netTE⟩ ≤ 4; magenta for 4 < ⟨netTE⟩ ≤ 8, green for 8 < ⟨netTE⟩ ≤ 12
and red for .
Furthermore, net transfer entropy was averaged for each residue type categorized as either hydrophobic or polar, as depicted in Figure 5c,d, where positive and negative values correspond to entropy donor and acceptor residues, respectively. Clearly, no correspondence was detected between the number of side-chain torsion angles and the net entropy in both runs. In addition, there is no clear tendency for polar or hydrophobic residues to display either entropy donor or acceptor features. Furthermore, two runs displayed two completely different donor/acceptor profiles with respect to residue types. This is especially noticeable in maps illustrated for all residue pairs, such as entropy donor versus entropy acceptor depicted in Supplementary Figure S2. Several residues displayed opposite features, e.g., entropy donor in one run and acceptor in the second run, such as Pro, Cys, Val, Ile, Leu, Tyr, Met, Ser, Thr, Asn, Asp, Glu, and Lys. Apparently, fluctuations in Cα displacements were not driven by residue type, which incorporates the information of both polarity/hydrophobicity and the number of degrees of freedom.
Transfer entropy was next determined using backbone torsion angles, . As depicted in Figure 6a, ICL3 appeared as the only source of entropy donor to a few isolated acceptor regions detected on mostly loops such as ICL1, ECL1, ECL2, ECL3 and the intracellular part of TM7 adjacent to segment H8. Maximum TE values were determined as 10.86 and 11.54 for two runs, which are well below Cα-based TE values. Next, the first side-chain torsion angle () was considered together with two backbone angles for identifying the information of the rotameric state transferred from one residue to another in the receptor. As illustrated in Figure 6b, the same loop regions still appeared as entropy donor sites with an increased intensity dominating the future fluctuations of torsional angles everywhere in the receptor. In addition, maximum TE values reached 26.46 and 31.54 in two runs.
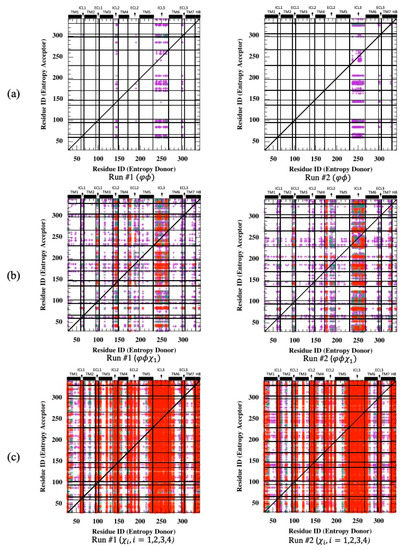
Figure 6.
Net transfer entropy from residue i to residue (see Equation (8)) for two independent MD runs using (a) backbone torsion angles, , (b) backbone torsion angles, and the first side-chain torsion angle ( ) and (c) all possible side-chain torsion angles . Color code for (a,b): no display for ; magenta for , green for and red for .
Unfortunately, the addition of more than one side-chain torsion angle made the computation intractable due to triple joint probability calculations (See Equation (7)), as it roughly required a memory space of ) only for calculating the parameter of the transfer entropy equation between all Arg and Lys pairs, which exceeded the maximum amount available for today’s computer technology. However, the same analysis was conducted for all possible side-chain torsion angles only. As anticipated, information transferred from one region to another site increased significantly, with a maximum TE value reaching 61.34 for Run #1 and 63.38 for Run #2 (see Figure 6c). All intra- and extracellular loops that extended slightly towards the neighboring helices were detected as important entropy donor sites. These results clearly represent that the conformational states of the side-chains at loop regions extensively dominated the future conformational states of side-chain torsion angles everywhere in the receptor.
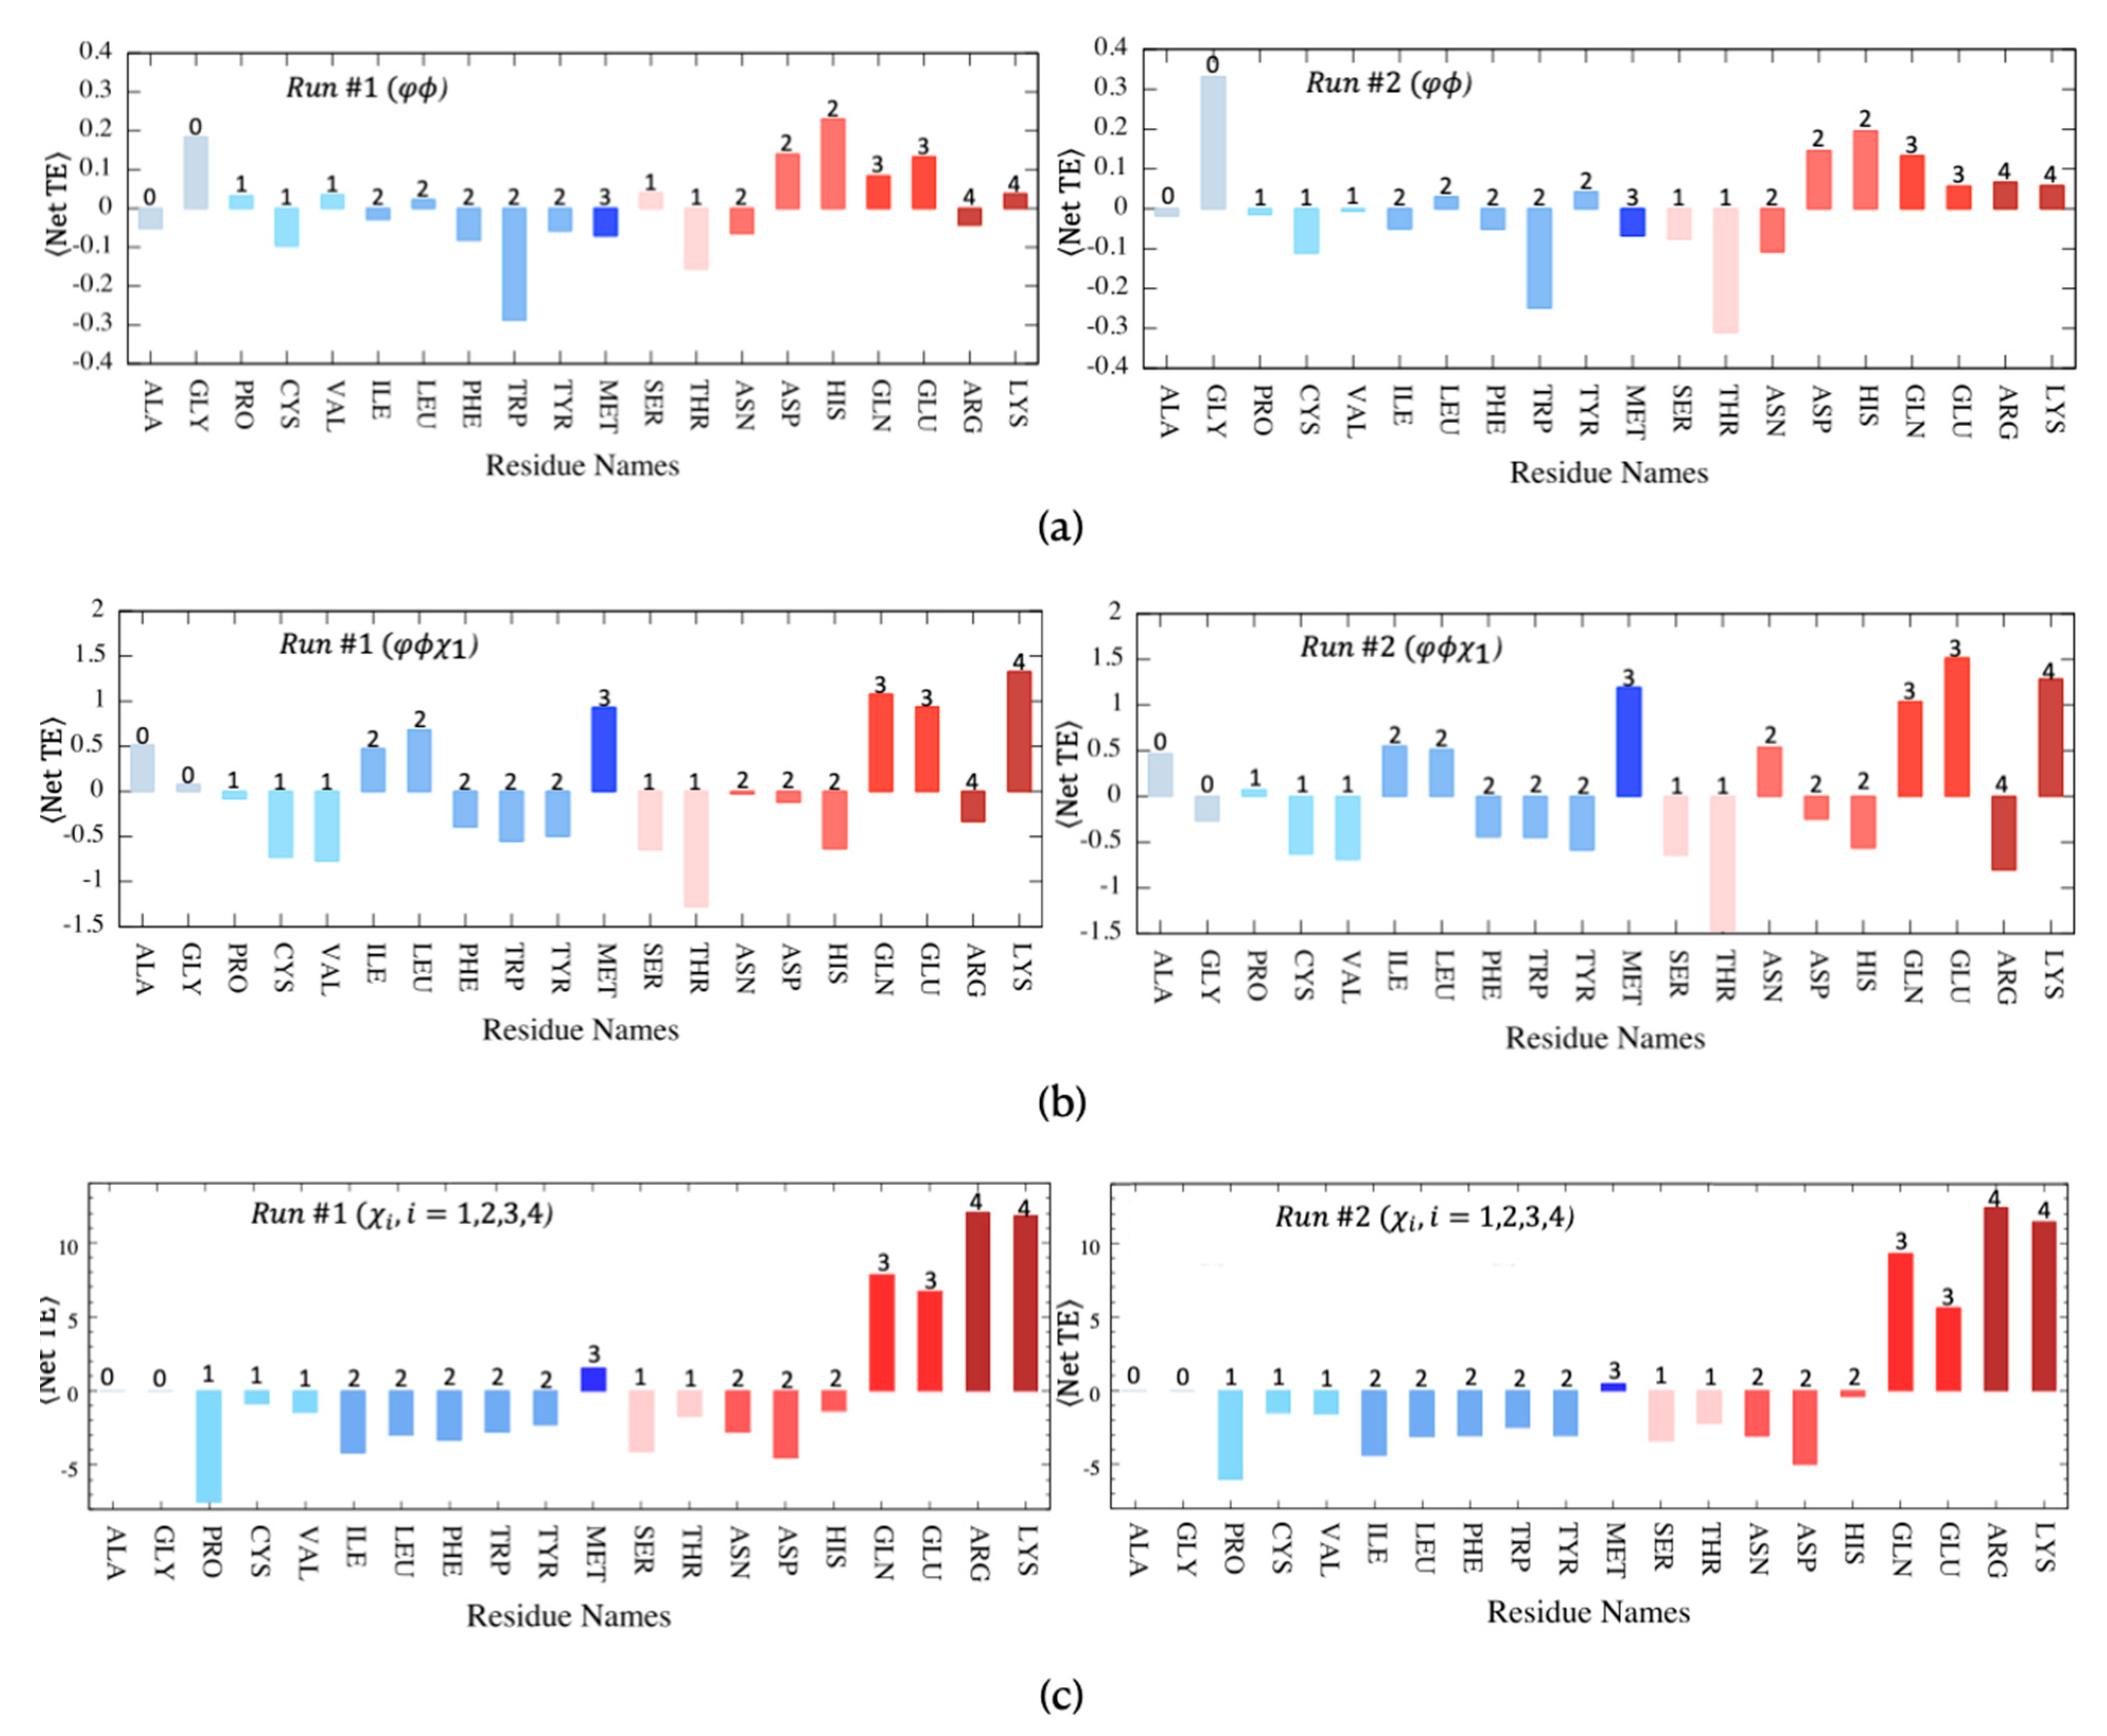
Finally, the net transfer entropy was further decomposed and replotted for each of the 20 residue types, as depicted in Figure 7, using a bar plot to display the average net transfer entropy where the entropy source (donor) and sink (acceptor) residues can be identified by their positive and negative values, respectively. Corresponding plots that display net transfer entropy for a pair of residue types such as entropy donor versus entropy acceptor are provided in Supplementary Figure S3. Further categorization of residues as hydrophobic and polar clearly demonstrated the dominancy of polar residues as entropy donors, whereas hydrophobic ones were most often identified as entropy acceptors. In the case of backbone rotation angles only, Trp appeared as the strongest entropy acceptor site in both MD runs, whereas His displayed the highest positive average net transfer entropy (See Figure 7a). Exceptionally, Gly residue with no side-chain atoms appeared as a strong entropy donor site.
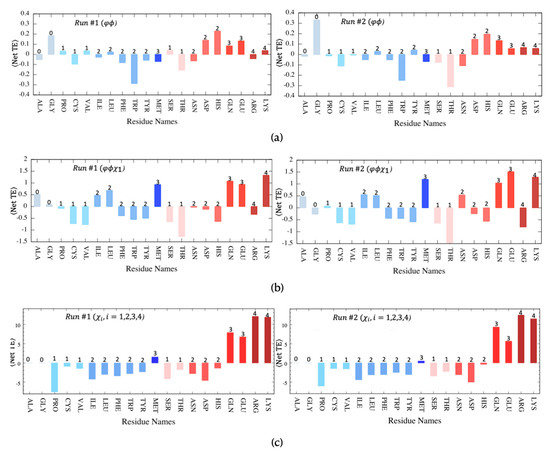
Figure 7.
Net transfer entropy averaged for each residue type categorized as either hydrophobic (blue tones) or polar (pink tones). The number of side-chain torsion angles indicated at the top of each bar is determined for both MD runs using (a) backbone torsion angles, , (b) backbone torsion angles, and the first side-chain torsion angle ( ) and (c) all possible side-chain torsion angles .
Noticeably, the close correspondence between polarity/hydrophobicity and donor/acceptor features was the strongest when all side-chain torsion angles were considered in transfer entropy calculations (See Figure 7c). Most hydrophobic residues, except Met, which is mostly located at the protein’s core region, displayed strong entropy acceptor characteristics, especially Pro, with the lowest average net transfer entropy value of −7.38 calculated so far. Furthermore, on the polar side, Arg and Lys, with a total of four side-chain torsion angles, displayed the highest entropy values exceeding +10. Upon incorporating the first side-chain torsion angle () along with two backbone torsion angles, the profile changed slightly, yet the dominancy of polar residues as entropy donor sites persisted (See Figure 7b). Three polar residues, Lys, Glu, and Gln, displayed the highest positive transfer entropy values in both runs. Interestingly, the two polar Ser, Thr, and the hydrophobic Tyr, which all contain a hydroxyl group in their side-chain, displayed entropy sink (acceptor) features.
4. Conclusions
Two independent 1.5 μs long MD simulations were conducted on the apo form of the active state of human β2AR in a complex with a Gs protein. Throughout both trajectories, the active state of the receptor was well preserved with the characteristic tilt in transmembrane helix 6 and ICL3 towards the lipid bilayer to give Gs full access to the binding cavity at the intracellular part. On the extracellular part, since no ligand was attached at the orthosteric site, a minor expansion was observed because of the slightly distancing motion of TM5 from TM3. However, this slight conformational shift at the extracellular part did not cause any allosteric interference in the intracellular region.
Distant regions fluctuating in the correspondence are critical as they might point to potential sites along the allosteric pathway. In this study, we attempted to use several metrics for that purpose. First, residue-pair cross-correlations were calculated for α-Carbon atomic fluctuations from average positions. Distant and correlated regions were mainly observed within the last three transmembrane helices (TM5, TM6, and TM7), including the longest loop region ICL3 and the small extension H8 adjacent to TM7. Moreover, TM6 and TM7 fluctuated in opposite directions with TM1. As cross-correlation ignores the correlated motions in orthogonal directions, the mutual information metric was next used to identify all possible distant sites in correspondence that might be critical for allosteric signaling. First, only α-Carbon atomic fluctuations were considered. However, not much correspondence was detected in the receptor except between ICL3 and the distant extracellular parts of TM6 and TM7. The next step was to replace α-Carbon fluctuations with rotameric states of backbone torsion angles and in each residue when formulating the mutual correspondence. A considerable change was observed in the profile where ICL3’s rotameric states fluctuated in concert and with respect to ICL2. Incorporating side-chain torsion angles further increased the mutual information transferred between ICL3 and ICL2. In addition, ICL3 started to share information with all the other loop regions, including some limited portions of transmembrane helices, TM3, TM6, and TM7.
When mutual information was further decomposed based on types of residue pairs, polar ones, especially Arg, were identified as the dominating group sharing the highest correspondence with other polar residues. Hydrophobic residues shared the least amount of mutual information, except Tyr and Phe, which paired with polar Arg. The lowest amount of MI was observed among hydrophobic residues. The dominating feature of polar residues was attributed to their higher abundance in loop regions where the highest mutual information was detected. However, despite its low abundance in loop regions, hydrophobic Tyr with two side-chain torsion angles had average mutual information of 0.11, which was comparable with that of other polar residues with two side-chain torsion angles.
Transfer entropy, which is another metric in information theory, relates two states at different times. If the state of residue j in the future time can be predicted knowing the state of residue i at the present time, then two sites might communicate with each other as part of an allosteric signaling network. First, transfer entropy was determined for the information about positional fluctuations (Cα). Different profiles were observed in two independent MD runs. In one run, ICL3, ICL2, TM3, and TM4 moderately appeared as entropy donor sites, whereas the intracellular part of TM1 was detected as a dominant acceptor site. In the second run, ICL3, together with the extracellular part of TM7, appeared as two dominant entropy donor sites, whereas no major acceptor site was detected. Clearly, there is no unique communication pathway for backbone Cα displacements. When the information type was replaced by the fluctuation in the rotameric states of backbone torsion angles , a completely different profile of communication network appeared and persisted in both runs; ICL3 was the only source of entropy donor to a few isolated acceptor regions detected mostly on loops such as ICL1, ECL1, ECL2, ECL3 and the intracellular part of TM7 adjacent to segment H8. The intensity of transferred information was relatively weak, 10.86 and 11.54 for two runs, which were well below Cα-based TE values (16.32 and 18.15). Then, the rotameric states of the first side-chain torsion angle () were combined with those of backbone torsion angles. As anticipated, the intensity of transferred information noticeably increased with a maximum value of 26.46 and 31.24 in two runs. Due to computational limitations, the addition of another side-chain torsion angle was not achievable, yet the increasing trend in transfer entropy was predictable. When only the rotameric states of side-chain torsion angles were used, transfer entropy significantly increased to its highest values (61.34 and 63.38), yet the distribution profile among regions was preserved, i.e., the fluctuations of torsion angles in the loop regions drove the future fluctuations of rotameric states everywhere in the receptor. This result clearly elucidates an important aspect of all GPCRs where both extra- and intracellular loops protruding from the transmembrane bilayer play a major role in the functional regulation. Thus, loop regions can be essential targets for the design of allosteric drug molecules with fewer side effects.
Supplementary Materials
The following supporting information can be downloaded at: https://www.mdpi.com/article/10.3390/app12178530/s1, LIST OF SUPPLEMENTARY FIGURES: Figure S1. Residue frequency (%) of each residue type in loop and transmembrane (TM) regions. Figure S2. (a,b) Average net transfer entropy based on Cα fluctuations for residue pairs classified as either hydrophobic (blue) or polar (pink) for two MD runs. Figure S3. (a,b) Average net transfer entropy for residue pairs classified as either hydrophobic (blue) or polar (pink) for two MD runs based on rotameric states of (a) backbone torsion angles, , (b) backbone torsion angles, and the first side-chain torsion angle () and (c) all possible side-chain torsion angles .
Author Contributions
Conceptualization, E.D.A.; methodology, N.S. and E.D.A.; software, N.S. and E.D.A.; validation N.S. and E.D.A.; formal analysis, N.S. and E.D.A.; investigation, N.S.; resources, E.D.A.; data curation, N.S. and E.D.A.; writing—original draft preparation, E.D.A.; writing—review and editing, E.D.A.; visualization, N.S.; supervision, E.D.A.; project administration, E.D.A.; funding acquisition, N.S. All authors have read and agreed to the published version of the manuscript.
Funding
This research received no external funding.
Institutional Review Board Statement
Not applicable.
Informed Consent Statement
Not applicable.
Data Availability Statement
The data presented in this study are available on request from the corresponding author. The data are not publicly available due to the privacy of the source code.
Acknowledgments
N.S. acknowledges The Scientific and Technological Research Council of Turkey (TUBITAK) for her 2211/C National Ph.D. Scholarship. TOC Graphics were created with BioRender.com.
Conflicts of Interest
The authors declare no conflict of interest.
References
- Gunasekaran, K.; Ma, B.; Nussinov, R. Is allostery an intrinsic property of all dynamic proteins? Proteins Struct. Funct. Bioinf. 2004, 57, 433–443. [Google Scholar] [CrossRef] [PubMed]
- Sun, J.H.; O’Boyle, D.R.; Fridell, R.A.; Langley, D.R.; Wang, C.; Roberts, S.B.; Nower, P.; Johnson, B.M.; Moulin, F.; Nophsker, M.J.; et al. Resensitizing daclatasvir-resistant hepatitis C variants by allosteric modulation of NS5A. Nature 2015, 527, 245–248. [Google Scholar] [CrossRef] [PubMed]
- Hayouka, Z.; Rosenbluh, J.; Levin, A.; Loya, S.; Lebendiker, M.; Veprintsev, D.; Kotler, M.; Hizi, A.; Loyter, A.; Friedler, A. Inhibiting HIV-1 integrase by shifting its oligomerization equilibrium. Proc. Natl. Acad. Sci. USA 2007, 104, 8316–8321. [Google Scholar] [CrossRef] [PubMed]
- Mikulska-Ruminska, K.; Shrivastava, I.H.; Krieger, J.M.; Zhang, S.; Li, H.; Bayir, H.; Wenzel, S.E.; VanDemark, A.P.; Kagan, V.E.; Bahar, I. Characterization of differential dynamics, specificity, and allostery of lipoxygenase family members. J. Chem. Inf. Model. 2019, 59, 2496–2508. [Google Scholar] [CrossRef] [PubMed]
- Cooper, A.; Dryden, D.T.F. Allostery without conformational change—A plausible model. Eur. Biophys. J. 1984, 11, 103–109. [Google Scholar] [CrossRef] [PubMed]
- Tsai, C.J.; Nussinov, R. A unified view of “how allostery works”. PLoS Comput. Biol. 2004, 10, e1003394. [Google Scholar] [CrossRef] [PubMed]
- Motlagh, H.N.; Wrabl, J.O.; Li, J.; Hilser, V.J. The ensemble nature of allostery. Nature 2014, 508, 331–339. [Google Scholar] [CrossRef]
- Popovych, N.; Sun, S.; Ebright, R.H.; Kalodimos, C.G. Dynamically driven protein allostery. Nat. Struct. Mol. Biol. 2006, 13, 831–838. [Google Scholar] [CrossRef]
- Guarnera, E.; Berezovsky, I.N. Allosteric drugs and mutations: Chances, challenges, and necessity. Curr. Opin. Struct. Biol. 2020, 62, 149–157. [Google Scholar] [CrossRef]
- Nussinov, R.; Tsai, C.J. Allostery in disease and in drug discovery. Cell 2013, 153, 293–305. [Google Scholar] [CrossRef] [Green Version]
- Shrivastava, I.H.; Liu, C.; Dutta, A.; Bakan, A.; Bahar, I. Allostery as Structure-Encoded Collective Dynamics: Significance in Drug Design; Structural Biology in Drug Discovery: Methods, Techniques, and Practices; Renaud, J.P., Ed.; John Wiley & Sons: New York, NY, USA, 2020; Chapter 6; pp. 125–141. [Google Scholar]
- Ayyildiz, M.; Celiker, S.; Ozhelvaci, F.; Akten, E.D. Identification of alternative allosteric sites in glycolytic enzymes for potential use as species-specific drug targets. Front. Mol. Biosci. 2020, 7, 88. [Google Scholar] [CrossRef] [PubMed]
- Celebi, M.; Inan, T.; Kurkcuoglu, O.; Akten, E.D. Potential allosteric sites captured in glycolytic enzymes via residue-based network models: Phosphofructokinase, glyceraldehyde-3-phosphate dehydrogenase and pyruvate kinase. Biophys. Chem. 2022, 280, 106701. [Google Scholar] [CrossRef] [PubMed]
- Kurochkin, I.V.; Guarnera, E.; Wong, J.H.; Eisenhaber, F.; Berezovsky, I.N. Toward Allosterically Increased Catalytic Activity of Insulin- Degrading Enzyme against Amyloid Peptides. Biochemistry 2017, 56, 228–239. [Google Scholar] [CrossRef] [PubMed]
- Wang, J.; Jain, A.; McDonald, L.R.; Gambogi, C.; Lee, A.L.; Dokholyan, N.V. Mapping allosteric communications within individual proteins. Nat. Commun. 2020, 11, 3862. [Google Scholar] [CrossRef]
- Amor, B.R.C.; Schaub, M.T.; Yaliraki, S.N.; Barahona, M. Prediction of allosteric sites and mediating interactions through bond-to-bond propensities. Nat. Commun. 2016, 7, 12477. [Google Scholar] [CrossRef] [PubMed]
- Kaya, C.; Armutlulu, A.; Ekesan, S.; Haliloglu, T. MCPath: Monte Carlo path generation approach to predict likely allosteric pathways and functional residues. Nucleic Acids Res. 2013, 41, W249–W255. [Google Scholar] [CrossRef]
- Schreiber, T. Measuring information transfer. Phys. Rev. Lett. 2000, 85, 461–464. [Google Scholar] [CrossRef]
- Kamberaj, H.; van der Vaart, A. Extracting the Causality of Correlated Motions from Molecular Dynamics Simulations. Biophys. J. 2009, 97, 1747–1755. [Google Scholar] [CrossRef]
- Barr, D.; Oashi, T.; Burkhard, K.; Lucius, S.; Samadani, R.; Zhang, J.; Shapiro, P.; MacKerell, A.D., Jr.; van der Vaart, A. Importance of domain closure for the autoactivation of ERK2. Biochemistry 2011, 50, 8038–8048. [Google Scholar] [CrossRef]
- Corrada, D.; Morra, G.; Colombo, G. Investigating allostery in molecular recognition: Insights from a computational study of multiple anti- body–antigen complexes. J. Phys. Chem. B 2013, 117, 535–552. [Google Scholar] [CrossRef]
- Hacisuleyman, A.; Erman, B. Causality, transfer entropy, and allosteric communication landscapes in proteins with harmonic interactions. Proteins Struct. Funct. Bioinf. 2017, 85, 1056–1064. [Google Scholar] [CrossRef] [PubMed]
- Hacisuleyman, A.; Erman, B. Entropy transfer between residue pairs and allostery in proteins: Quantifying allosteric communication in ubiquitin. PLoS Comput. Biol. 2017, 13, e1005319. [Google Scholar] [CrossRef] [PubMed]
- DuBay, K.H.; Geissler, P.L. Calculation of proteins’ total side-chain torsional entropy and its influence on protein-ligand interactions. J. Mol. Biol. 2009, 391, 484–497. [Google Scholar] [CrossRef]
- Marlow, M.S.; Dogan, J.; Frederick, K.K.; Valentine, K.G.; Wand, A.J. The role of conformational entropy in molecular recognition by calmodulin. Nat. Chem. Biol. 2010, 6, 352–358. [Google Scholar] [CrossRef] [PubMed]
- Millet, O.; Mittermaier, A.; Baker, D.; Kay, L.E. The effects of mutations on motions of side-chains in protein l studied by 2 h nmr dynamics and scalar couplings. J. Mol. Biol. 2003, 329, 551–563. [Google Scholar] [CrossRef]
- DuBay, K.H.; Bothma, J.P.; Geissler, P.L. Long-Range Intra-Protein Communication Can Be Transmitted by Correlated Side-Chain Fluctuations Alone. PLoS Comput. Biol. 2011, 7, e1002168. [Google Scholar] [CrossRef]
- Rasmussen, S.G.F.; Choi, H.J.; Fung, J.J.; Pardon, E.; Casarosa, P.; Chae, P.S.; Kobilka, B.K. Structure of a nanobody-stabilized active state of the β2 adrenoceptor. Nature 2011, 469, 175–180. [Google Scholar] [CrossRef]
- Eswar, N.; Webb, B.; Marti-Renom, M.A.; Madhusudhan, M.S.; Eramian, D.; Shen, M.; Pieper, U.; Sali, A. Comparative protein structure modeling using Modeller. Curr. Protoc. Bioinform. 2006, 15, 5–6. [Google Scholar] [CrossRef]
- Humphrey, W.; Dalke, A.; Schulten, K. VMD: Visual molecular dynamics. J. Mol. Graph. 1996, 14, 33–38. [Google Scholar] [CrossRef]
- Best, R.B.; Zhu, X.; Shim, J.; Lopes, P.E.M.; Mittal, J.; Feig, M.; MacKerell, A.D., Jr. Optimization of the additive CHARMM all-atom protein force field targeting improved sampling of the backbone phi, psi and side-chain chi1 and chi2 dihedral angles. J. Chem. Theory Comput. 2012, 8, 3257–3273. [Google Scholar] [CrossRef] [Green Version]
- Feller, S.E.; Zhang, Y.H.; Pastor, R.W. Computer-simulation of liquid/liquid interfaces 2. Surface-tension area dependence of a bilayer and monolayer. J. Chem. Phys. 1995, 103, 10267–10276. [Google Scholar] [CrossRef]
- Phillips, J.C.; Braun, R.; Wang, W.; Gumbart, J.; Tajkhorshid, E.; Villa, E.; Chipot, C.; Skeel, R.D.; Kalé, L.; Schulten, K. Scalable molecular dynamics with NAMD. J. Comput. Chem. 2005, 26, 1781–1802. [Google Scholar] [CrossRef] [PubMed]
- Petrache, H.I.; Dodd, S.W.; Brown, M.F. Area per lipid and acyl length distributions in fluid phosphatidylcholines determined by (2)H NMR spectroscopy. Biophys. J. 2000, 79, 3172–3319. [Google Scholar] [CrossRef]
- Kučerka, N.; Nieh, M.P.; Katsaras, J. Fluid phase lipid areas and bilayer thicknesses of commonly used phosphatidylcholines as a function of temperature. Biochim. Biophys. Acta-Biomembr. 2011, 1808, 2761–2771. [Google Scholar] [CrossRef] [PubMed]
- Ponder, J.W.; Richards, F.M. Tertiary templates for proteins. Use of packing criteria in the enumeration of allowed sequences for different structural classes. J. Mol. Biol. 1987, 193, 775–791. [Google Scholar] [CrossRef]
- Ozgur, C.; Doruker, P.; Akten, E.D. Investigation of allosteric coupling in human β2-adrenergic receptor in the presence of intracellular loop 3. BMC Struct. Biol. 2016, 16, 9. [Google Scholar] [CrossRef]
- Nygaard, R.; Zou, Y.; Dror, R.O.; Mildorf, T.J.; Arlow, D.H.; Manglik, A.; Pan, A.C.; Liu, C.W.; Fung, J.J.; Bokoch, M.P.; et al. The dynamic process of β2-adrenergic receptor activation. Cell 2013, 152, 532–542. [Google Scholar] [CrossRef] [PubMed]
- Ozcan, O.; Uyar, A.; Doruker, P.; Akten, E.D. Effect of intracellular loop 3 on intrinsic dynamics of human β2-adrenergic receptor. BMC Struct. Biol. 2013, 13, 29. [Google Scholar] [CrossRef] [Green Version]


Publisher’s Note: MDPI stays neutral with regard to jurisdictional claims in published maps and institutional affiliations. |
© 2022 by the authors. Licensee MDPI, Basel, Switzerland. This article is an open access article distributed under the terms and conditions of the Creative Commons Attribution (CC BY) license (https://creativecommons.org/licenses/by/4.0/).