Abstract
The structural parameters of the magnetorheological (MR) damper significantly affect the output damping force and dynamic range. This paper presents a design optimization method to improve the damping performance of a novel MR damper with a bended magnetic circuit and folded flow gap. The multiobjective optimization of the structural parameters of this MR damper was carried out based on the optimal Latin hypercube design (Opt LHD), ellipsoidal basis function neural network (EBFNN), and multiobjective particle swarm optimization (MOPSO). By using the Opt LHD and EBFNN, determination of the optimization variables on the structural parameters was conducted, and a prediction model was proposed for further optimization. Then, the MOPSO algorithm was adopted to obtain the optimal structure of the MR damper. The simulation and experimental results demonstrate that the damping performance indicators of the optimal MR damper were greatly improved. The simulation results show that the damping force increased from 4585 to 6917 N, and the gain was optimized by 50.8%. The dynamic range increased from 12.4 to 13.2, which was optimized by 6.4%. The experimental results show that the damping force and dynamic range of the optimal MR damper were increased to 7247 N and 13.8, respectively.
1. Introduction
Smart materials, especially magnetorheological (MR) fluids, have been attracting great attention in manufacturing research and development. MR fluids are widely used in various engineering applications such as MR intelligent devices [1,2], transportation vehicles [3,4], building suspensions [5,6], and biomedical applications [7,8]. As one of the typical application devices of MR fluid, the MR damper directly affects the damping effect of the vibration control system. The optimization design of the MR damper is an effective approach to improve damping performance.
Hu et al. [9] took the power consumption and damping force of the MR damper used for knee joints as the optimization objective. The optimal solution of the parameters was obtained by the multiobjective genetic algorithm. The experimental results show that after optimization, the damping force increased by 30% and the power consumption reduced by 43%. Patel et al. [10] proposed a low-cost MR damper for washing machines regarding the height and width of the magnetic coil, radius of piston rod, and optimum fluid volume as the optimized parameters. The Generalized Reduction Gradient (GRG) and Grey Relation Analysis (GRA) were used to achieve low volume of the MR fluid (<2 mL), low power (~5 W) and high damping force (~55 N). Jiang et al. [11] optimized the maximum dynamic range and the minimum number of turns of the electromagnetic coil. The Nondominated Sorted Genetic Algorithm-II (NSGA-II) was used to optimize the structure of MR damper. After the optimization, the maximum damping force reached 1774 N and the dynamic range reached 10.8. Gurubasavaraju et al. [12] considered the effects of the current and flow gap and particle volume fraction of MR fluid on the shear stress and damping force. By applying the PSO algorithm, results show that the particle volume fraction with the proportion of 33% gave an optimal damping force of 3718 N.
Besides those mentioned above, other optimization methods such as the particle swarm optimization [13], response surface method, design of experiments [14], and genetic algorithm [15,16,17] are also used to optimize the MR damper structure. Liu et al. [18] used the Bezier curve to optimize the piston shape of the MR damper. This method effectively solved the regional magnetic saturation in the transition areas of the piston, thus leading to a larger field-dependent force. Experimental results show that the optimized piston of the MR damper could maximize the field-dependent force by 52% and total damping force by 24% compared to the normal situation. Naserimojarad et al. [19] applied the mathematical optimization and finite element analysis (FEA) methods on the optimal design for reducing the computational complexity. Nanthakumar et al. [20] optimized the design of the magnetorheological damper geometry using the response surface method and considered the magnetic field strength and yield stress as the objective. Results show that the magnetic circuit geometric parameters representing the distance between piston rod and coil and pole length were more sensitive to the response of the MR damper. Olivier et al. [21] utilized the Box–Behnken design to optimize the hybrid MR damper. The optimized results show that the damping force increased from 1383 N at 0 A to 4141 N at 2.0 A. Compared to the model provided by Nguyen et al. [22], the damping force in [15] was enhanced by more than 165%. Considering the compressibility of the MR fluid, Wei et al. [23] applied a modified Bingham model to simulate the MR damper. In addition, a response surface method was used to optimize the performance of the MR damper. Results show the damping force was improved by 33% and the dynamically adjustable coefficient was improved by 17%.
Generally speaking, the most critical point is that each optimization design method has its own advantages, and all have good optimization effects in practical engineering applications [24,25,26]. Nasir et al. [27] proposed a multiobjective helical dynamic optimization algorithm (MOSDA), which introduced the nondominated sorting (NS) method from the NSGA-II into SDA, and developed its multiobjective (MO) algorithm. Meanwhile, the MO algorithm was tested with various benchmark functions, and its test results show that MOSDA has better performance in finding Pareto Front and de-spreading when tested with benchmark functions compared to NSGA-II. Zhang et al. [28] proposed an improved particle swarm optimization (PSO) for multimodal MO problems. Meanwhile, a learning strategy based on dynamic neighborhood was introduced to replace the global learning strategy, and 11 multimodal MO optimization functions were used to verify the feasibility of the method. The experimental results and statistical analysis show that the proposed algorithm has better performance than the five existing multimodal MO algorithms. In addition, various MO optimization methods are also widely used in vibration-reduction engineering applications. Gao et al. [29] optimized the structural dimensions of the MR damper for a prosthetic knee joint based on the PSO algorithm, with the objective of minimizing the total energy consumption of one gait cycle and the weight of the MR damper. The experimental results verified that for the optimized MR damper, the energy consumption was reduced to 1.34 J with a weight of 0.74 kg. Deng et al. [30] developed a cosimulation optimal platform by using ISIGHT, MATLAB, and ANSYS software, and the NSGA-II was used to carry out MO optimization design of the suspension magnetic circuit with the target of improving the quality of vehicle noise, vibration, and harshness.
Based on this, scholars at home and abroad had conducted a lot of research on the optimization design of MR dampers, and put forward a variety of different ideas and optimization algorithms. Among them, the optimization design based on parametric programming and design of experiments are two commonly used methods at present, which have achieved good practical results in improving the dynamic performance of dampers. However, the optimization algorithm of parametric programming still has defects, such as few constraint variables and a single optimization method. In addition, the noisy nature of the finite element results can lead to errors if higher-order methods are used. On the other hand, for the general optimization algorithm based on design of experiments, a large number of mathematical models need to be established to characterize the objective function of the optimization process. Moreover, due to the limited sampling level and sample points, this method cannot efficiently and accurately optimize the structure size of the damper. Thus, in order to make the optimization process more efficient, on the premise of ensuring the simulation accuracy, the appropriate approximate model is selected in the comprehensive comparison to replace the simulation results based on the finite element method. Meanwhile, the optimization algorithm proposed in this paper avoids the disadvantages of large amounts of calculation and long search time in the optimization solution, and has enough sample points to greatly improve the efficiency of global optimization.
To increase the damping force and dynamic range, here a design optimization methodology of the novel MR damper with bended magnetic circuit and folded flow gap was developed based on the optimal Latin hypercube design (Opt LHD), the ellipsoidal basis function neural network (EBFNN), and the MOPSO. The Opt LHD method was used to generate samples, and the prediction model was developed based on the EBFNN method. The MOPSO was employed to optimize design objectives, and the optimal MR damper was investigated and validated via the FEA simulation and experiment.
2. Magnetorheological Damper
2.1. Configuration of MR Damper
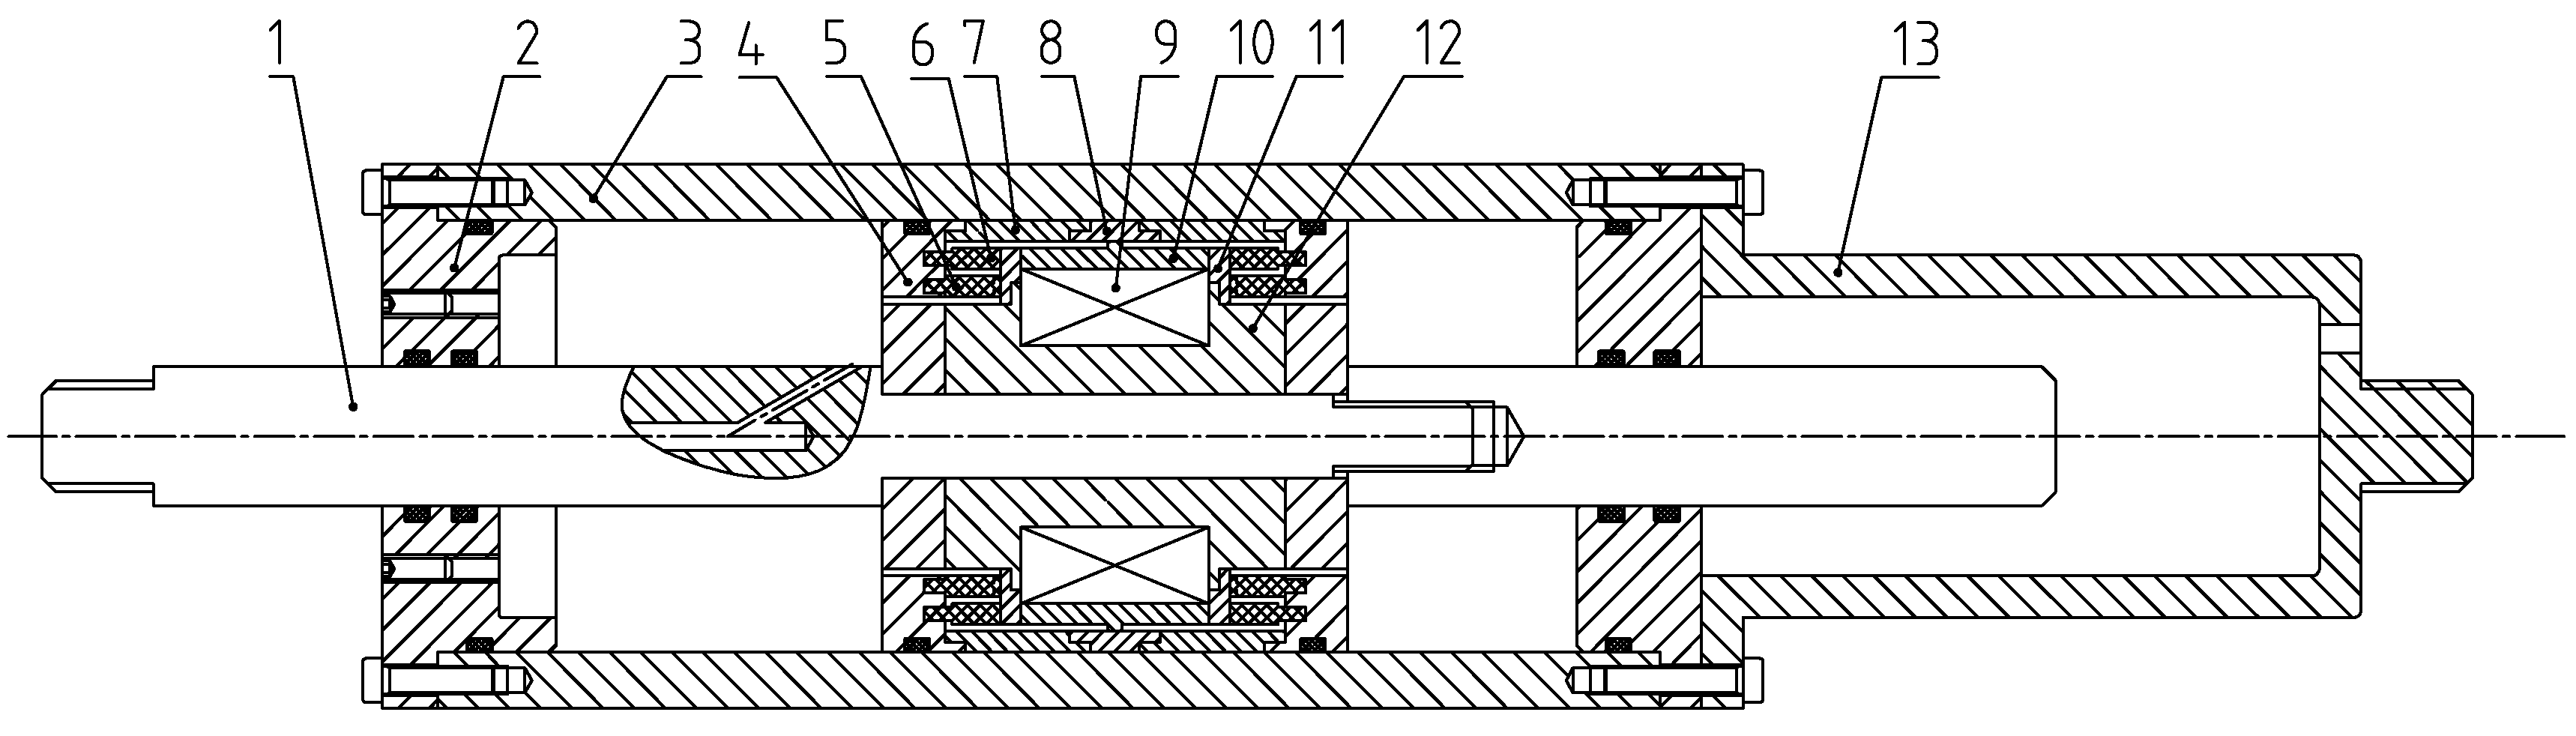
The MR damper discussed in this paper is based on a novel MR damper with a bended magnetic circuit and folded flow gap, which was briefly introduced in the previous study [31]. Figure 1 shows the configuration of the double-ended MR damper, which consists of the piston assembly, piston rod, cylinder, end covers, end shield, and other accessories. The exciting coil is wound inside the piston assembly, and the folded annular flow gap is formed by the magnetic rings, magnetic sleeves, and nonmagnetic sleeve around the coil. In addition, the bended magnetic circuit is produced by tactfully placing the nonmagnetic sleeve, thus leading to the magnetic flux passing through the outer flow gap multiple times. Therefore, when the coil is electrified, a magnetic field acting on the MR fluid is generated in more areas of the flow gap to obtain a higher controllable damping force. The damping force can be controlled by adjusting the current of the exciting coil. The piston assembly diagram of the MR damper is shown in Figure 2. In addition, Table 1 lists the main structural dimensions of the proposed MR damper.
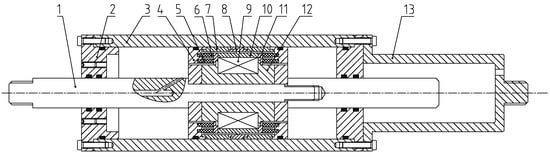
Figure 1.
Schematic diagram of MR damper with bended magnetic circuit and folded flow gap. 1: Piston rod; 2: end cover; 3: cylinder; 4: piston cover; 5: small magnetic ring; 6: big magnetic ring; 7: magnetic sleeve; 8: nonmagnetic ring; 9: exciting coil; 10: magnetic semicircle; 11: nonmagnetic disk; 12: magnetic core; 13: end shield.
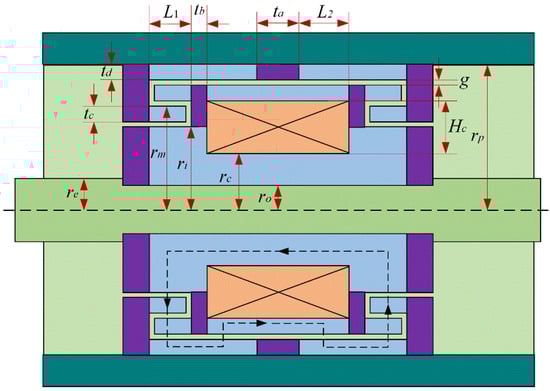
Figure 2.
Piston assembly diagram of the MR damper.

Table 1.
Main structural dimensions of the proposed initial MR damper.
2.2. Mathematical Model of the MR Damper
According to the theory used for the gap flow between two parallel plates, the calculation formula of the damping force can be expressed as:
where F is the output damping force of MR damper; is the viscous damping force without magnetic field; Fτ is the coulomb damping force; Ff is the frictional damping force. Since there is sliding friction between the piston and the cylinder in the damper, the friction coefficient is very small, and the friction force between the two is much smaller than the viscous damping force and the coulomb damping force. Thus, the influence of this friction force is ignored in theoretical calculation and simulation analysis.
Therein, Fη and Fτ can be expressed by:
where η is the viscosity of the MR fluid without magnetic field; v is the velocity of the piston; g is thickness of the flow gap; c is the correction factor, with a value of 2–3; ri, rm, re are the radius of inner, middle and outer gap, respectively; L1, L2 is the effective length of the flow gap; τi, τm, τf, τs are the shear yield strength of the MR fluid in different flow gaps, respectively, which are related to the magnetic flux density; Ap is the effective area of the piston, which can be expressed as:
The dynamic range of the MR damper can be expressed by the ratio (D) of the output damping force to the viscosity damping force when the friction force is not considered:
3. Electromagnetic Field Simulation of the Designed MR Damper
To predict the damping force, the magnetic field distribution and magnetic flux density of the proposed MR damper would be obtained via FEA using ANSYS software. The damping performance was further analyzed by combining the field-dependent yield stress and the developed mathematical model of the MR fluid.
3.1. Material Properties
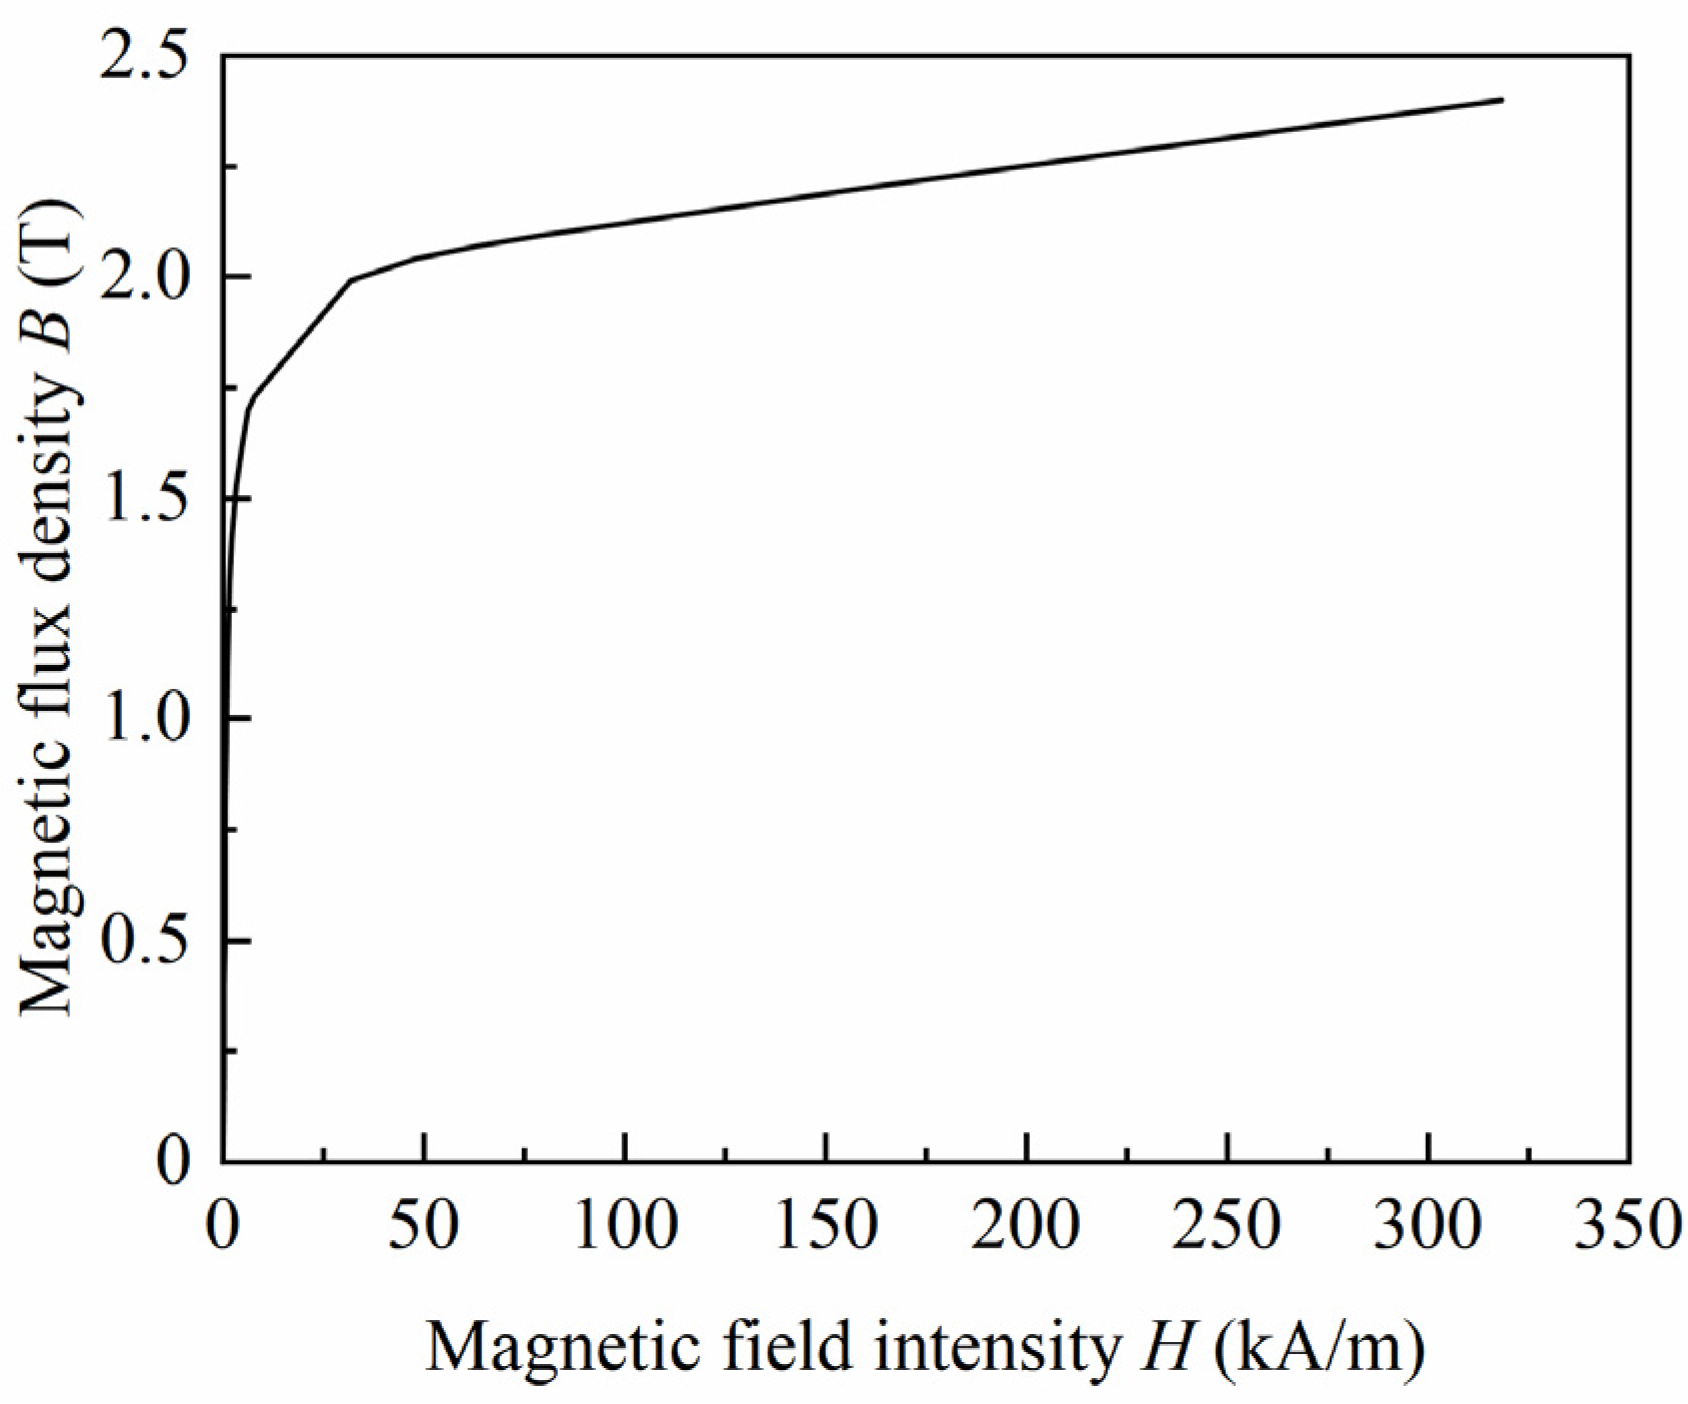
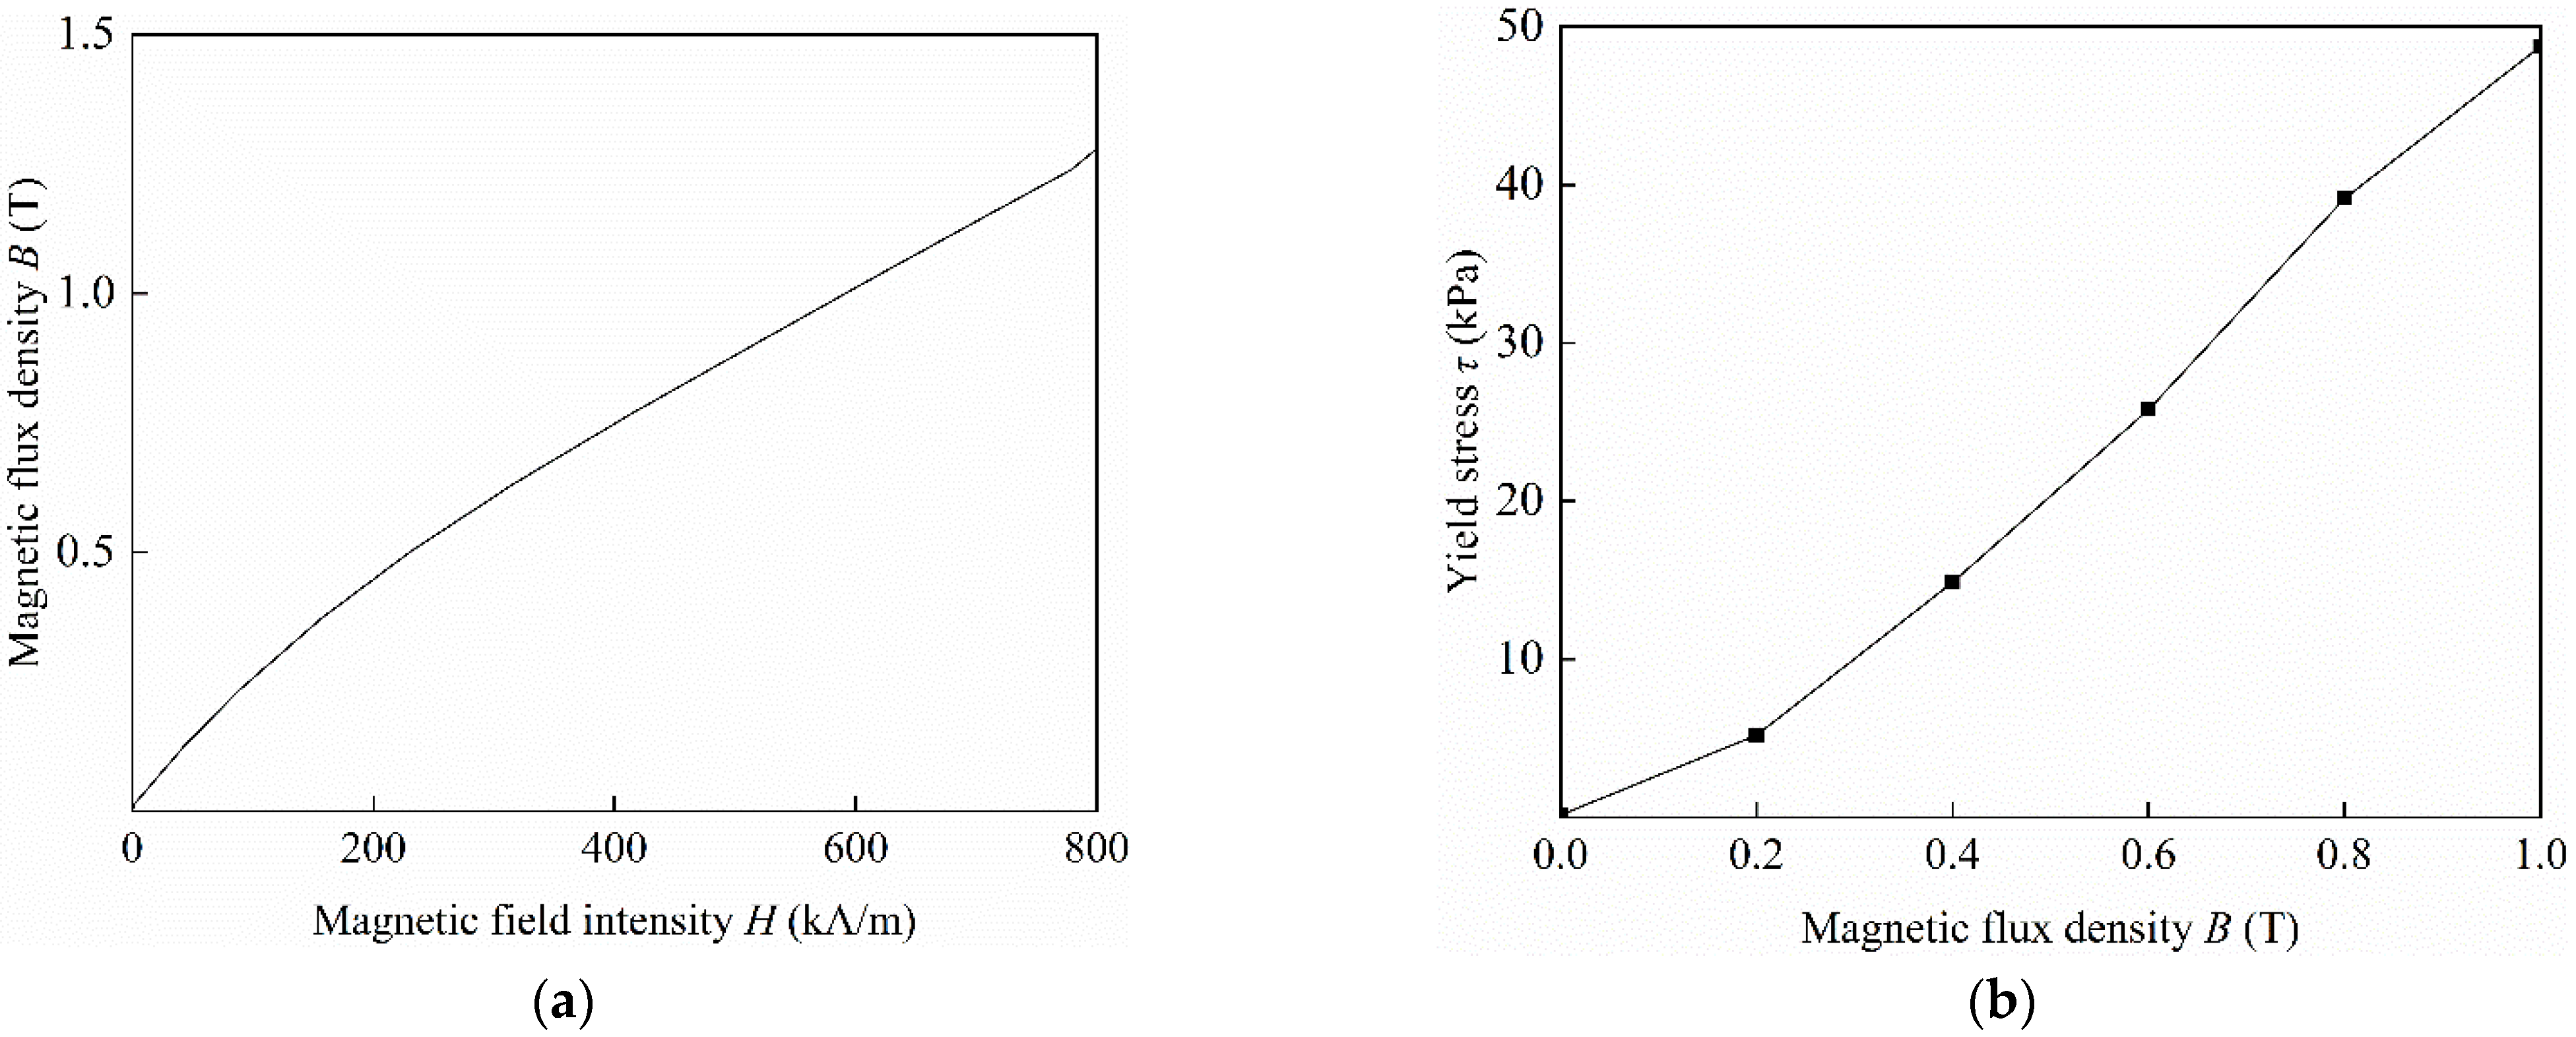
The magnetically conductive components of the MR damper, such as the magnetic core, magnetic rings, and magnetic sleeves, are made of No. 10 steel; while the non-magnetically conductive components, such as the nonmagnetic sleeve and nonmagnetic disks, are made of the stainless steel. Figure 3 shows the magnetization curve of No. 10 steel. In addition, MRF-J25T MR fluid, which was produced by Chongqing Institute of Materials in China [31,32], was used in this work. Figure 4a shows the magnetization curve of MR fluid. The relationship between the magnetic flux density B and shear stress τ is nonlinear, as shown in Figure 4b. The yield stress can be determined by the polynomial approximation:
where a1, a2, and a3 are the polynomial coefficients of the yield stress at the damping gap varying with the magnetic flux densities. Here, a1 = 11.25 kPa/T, a2 = 58.92 kPa/T2, a3 = −24.52 kPa/T3.
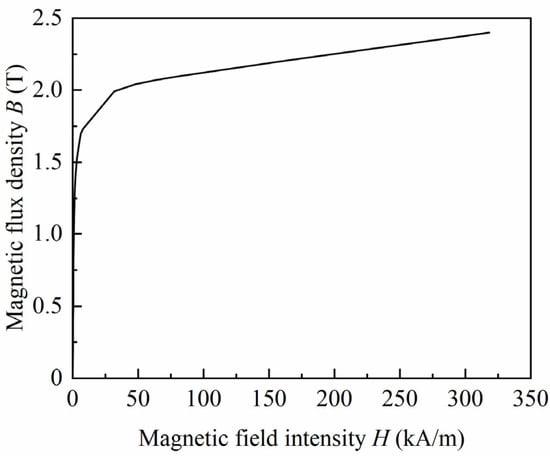
Figure 3.
Magnetization curve of No. 10 steel.
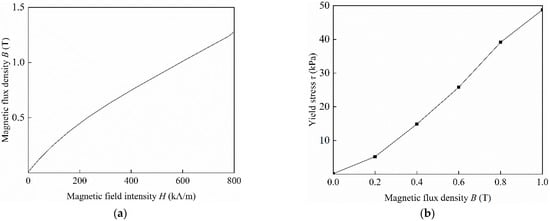
Figure 4.
The performance curves of MR fluids: (a) B-H curve; (b) τ–B curve [31].
3.2. Finite Element Analysis (FEA) Setup
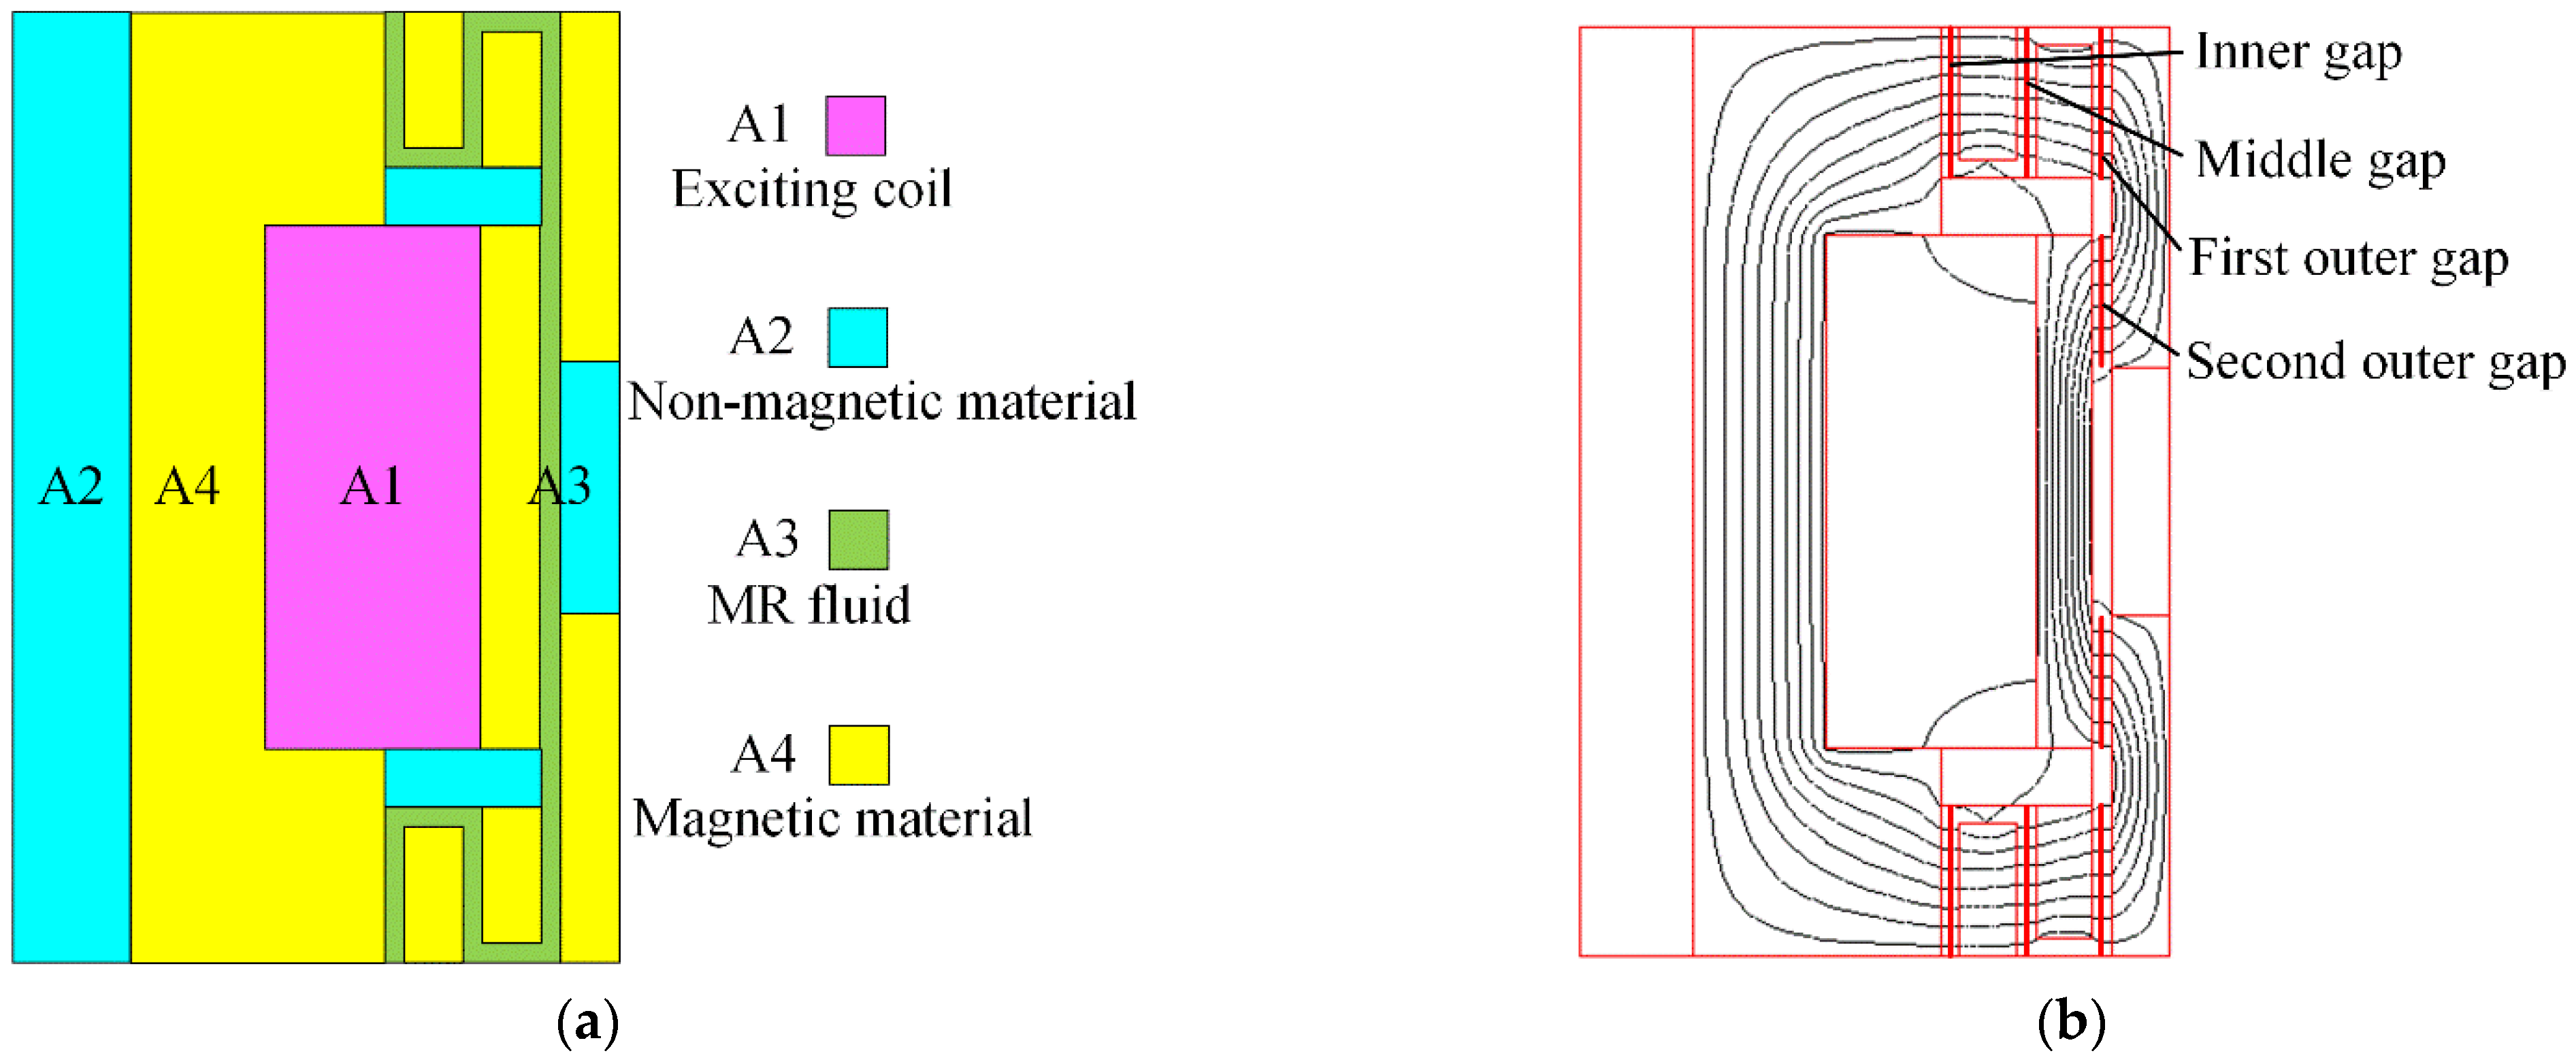
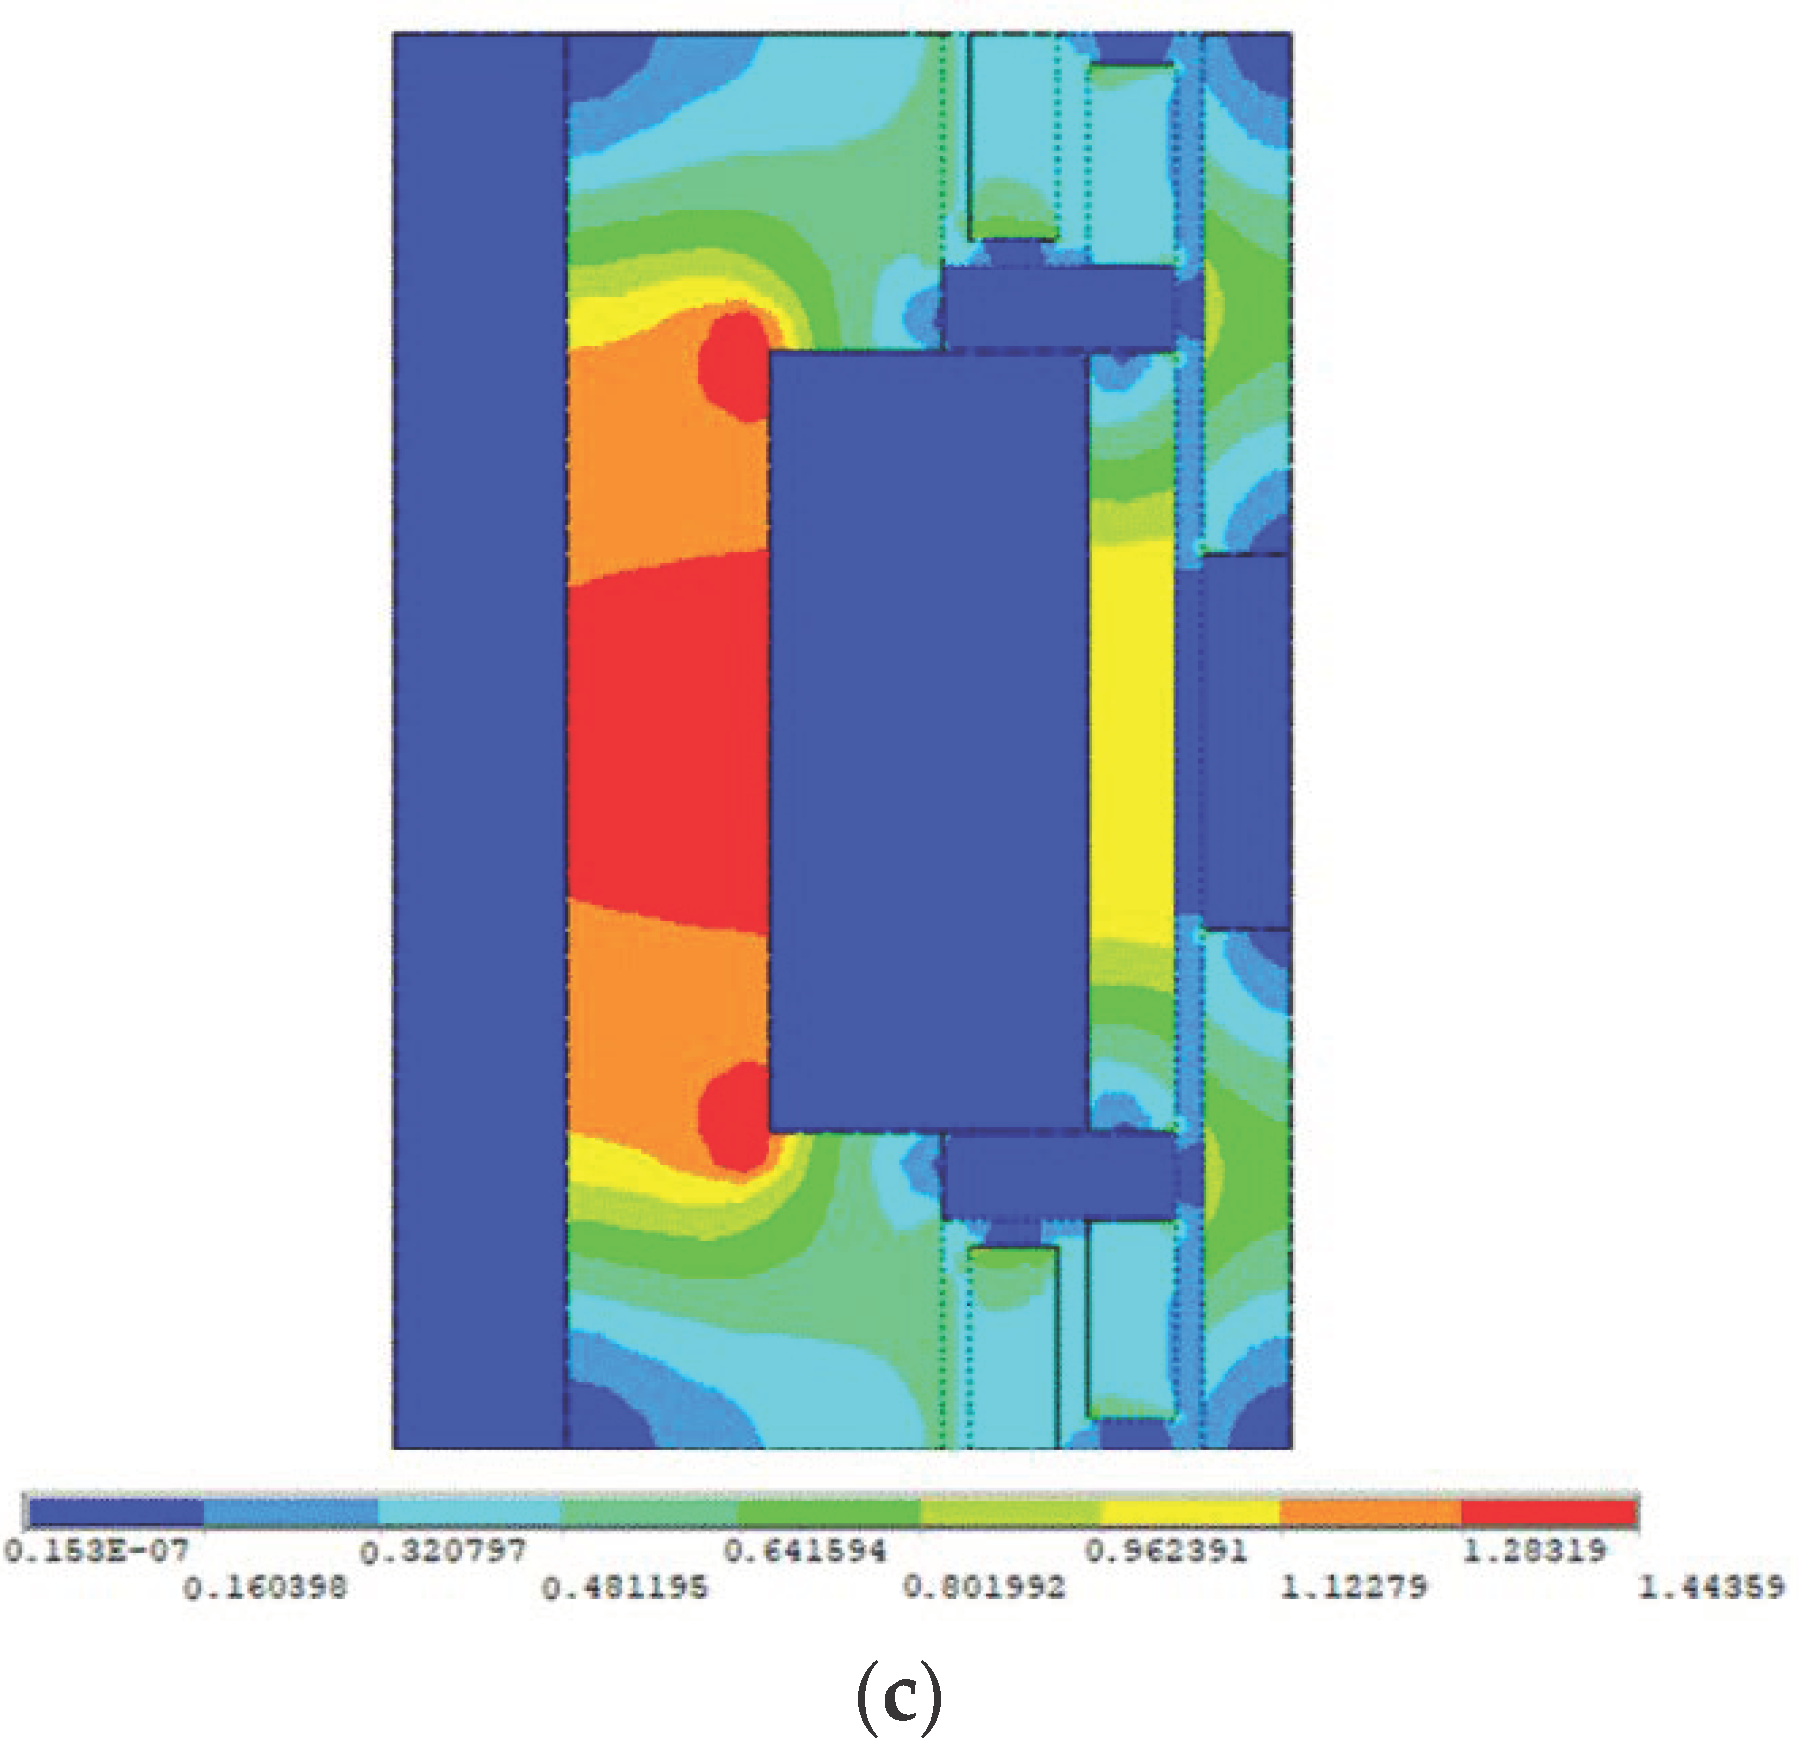
The damping performance of the proposed MR damper is highly dependent on the electromagnetic performance. In this work, the FEA method was used to analyze the electromagnetic performance of the MR damper. Since the flow gaps and the exciting coil of the proposed MR damper were integrated in the piston, and the proposed MR damper is an axisymmetric structure, half of the piston model was selected in the FEA, as shown in Figure 5a. Figure 5b illustrated the closed bended magnetic circuit of the MR damper. Most of the magnetic flux passes through three flow gaps multiple times in the same order. Therein, the magnetic flux passed through the outer flow gap more often, which validates the principle presented in Section 2. A small amount of the magnetic flux would not pass through the flow gap because the thin nonmagnetic disks are not completely non-magnetically conductive. Figure 5c shows the contours of the magnetic flux density with a current of 1.5 A, where the magnetic flux density in the inner flow gap is approximately 0.5 T.
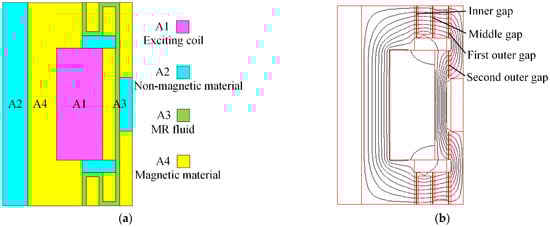

Figure 5.
Magnetic characteristics of the initial MR damper [31]. (a) Axisymmetric model for the FEA. (b) Magnetic flux. (c) Contours of the magnetic flux density.
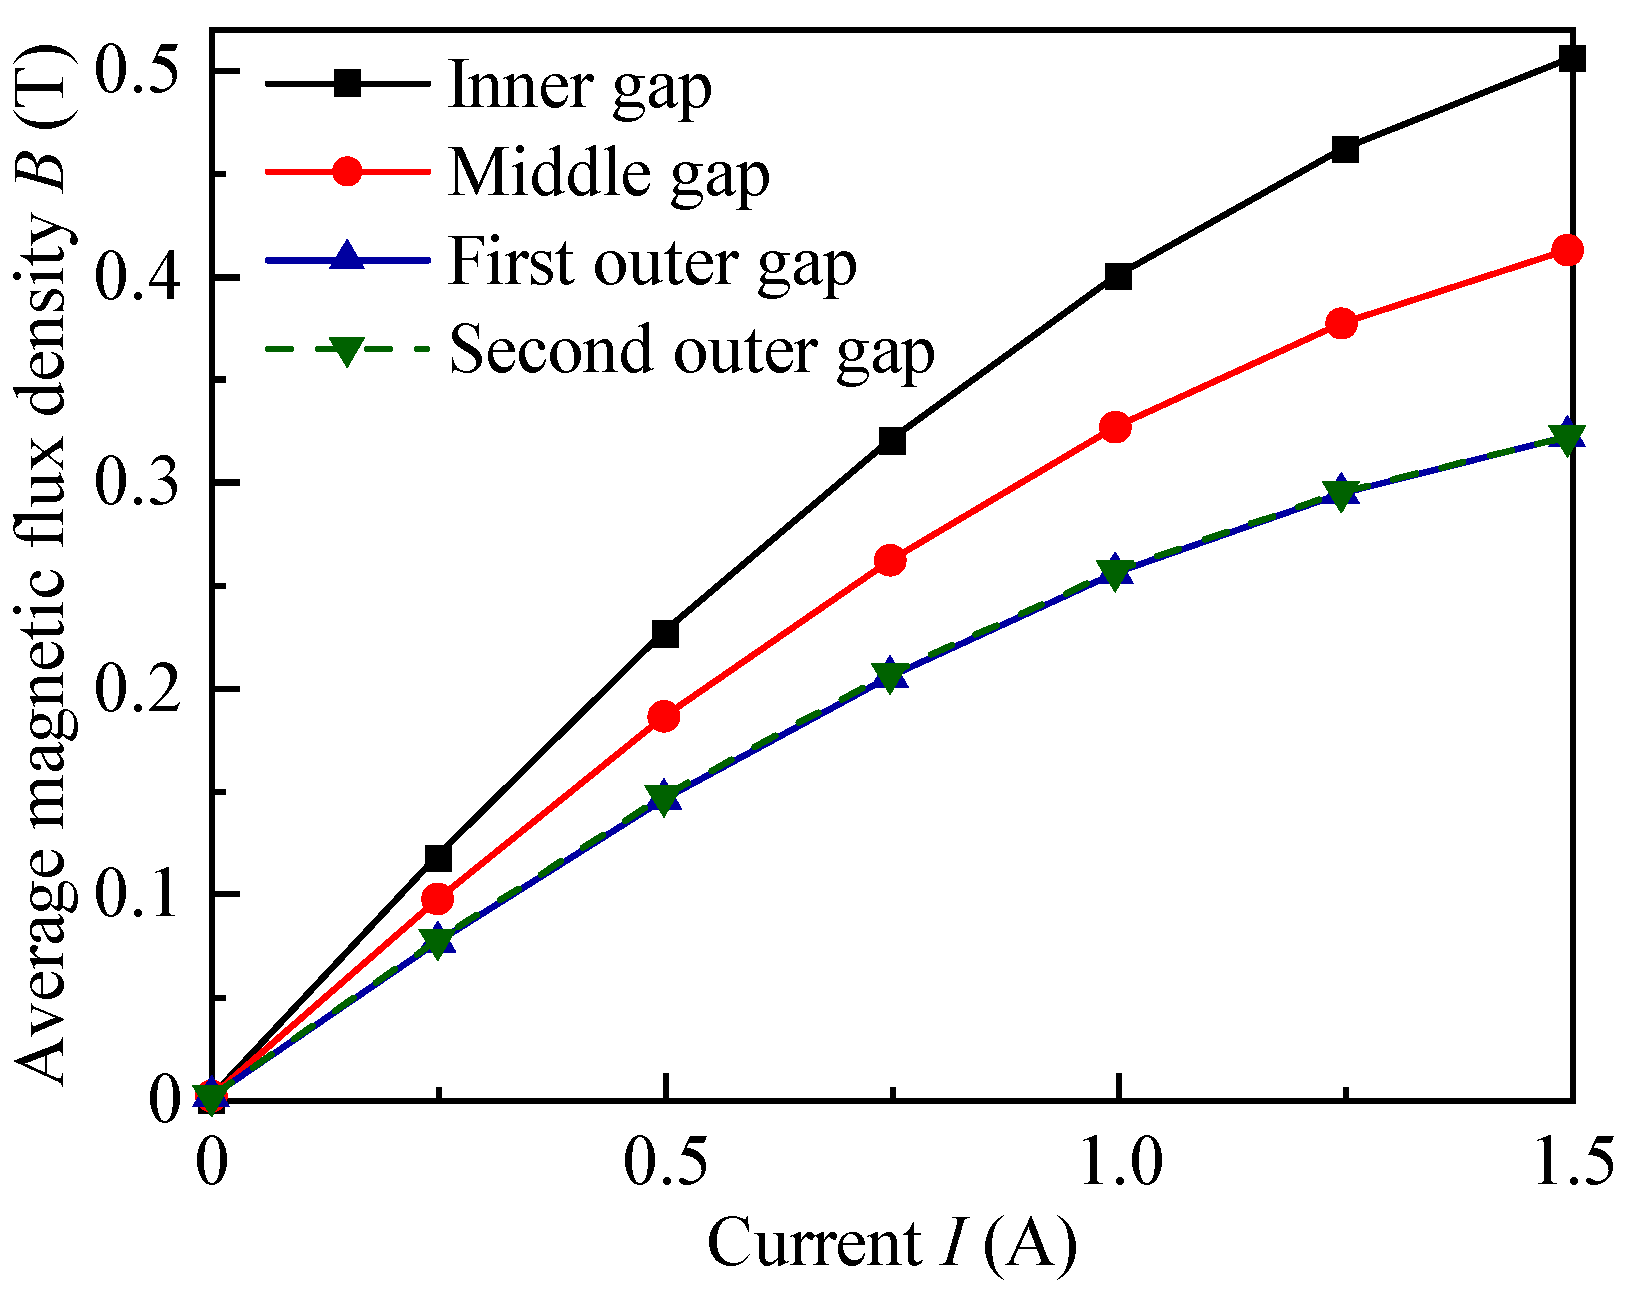
The magnetic flux densities of the several effective damping gaps were detected with different currents by defining the magnetic-active part of the flow gap. The average magnetic flux density of the initial MR damper was obtained by integrating the magnetic flux density of the gap, as shown in Figure 6. The average magnetic flux density gradually increases with the increase in the current. Then, the average magnetic flux density of the damping gaps increases from the outer gaps to the inner gaps due to the decreasing magnetic flux area from outer gaps to inner gaps with a specific current. This also explains that the magnetic flux densities of the two outer damping gaps are approximately the same. The average magnetic flux densities with a current of 1.5 A are 0.46 T for the inner damping gaps, 0.38 T for the middle damping gaps, and 0.29 T for the outer damping gaps [31].
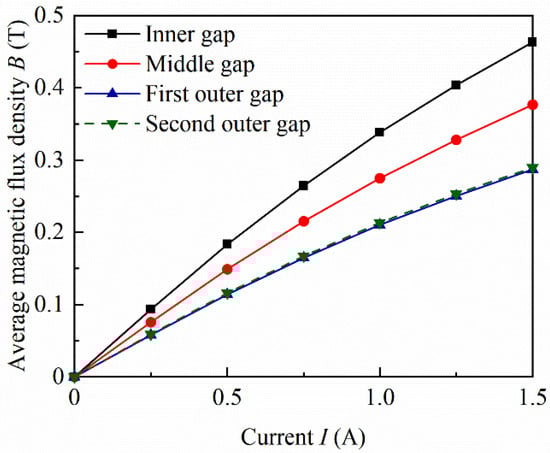
Figure 6.
Average magnetic flux density of the initial MR damper along the detected damping gap with various current inputs [31].
Figure 7 shows the damping force against the current magnitude under the frequency of 0.25 Hz sinusoidal displacement excitation with an amplitude of 0.75 mm. The damping force can be controlled by changing the input current, since the damping force increases rapidly with a current augment. The damping force of the MR damper is 367 N with a current input of 0 A. Particularly, the damping force reaches 4585 N with a current of 1.5 A.
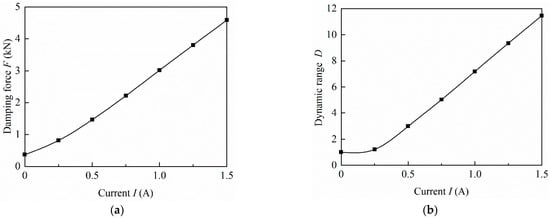
Figure 7.
Damping characteristics of the initial MR damper. (a) Damping force; (b) dynamic range.
4. Optimization Design
4.1. Process of Multiobject Optimization
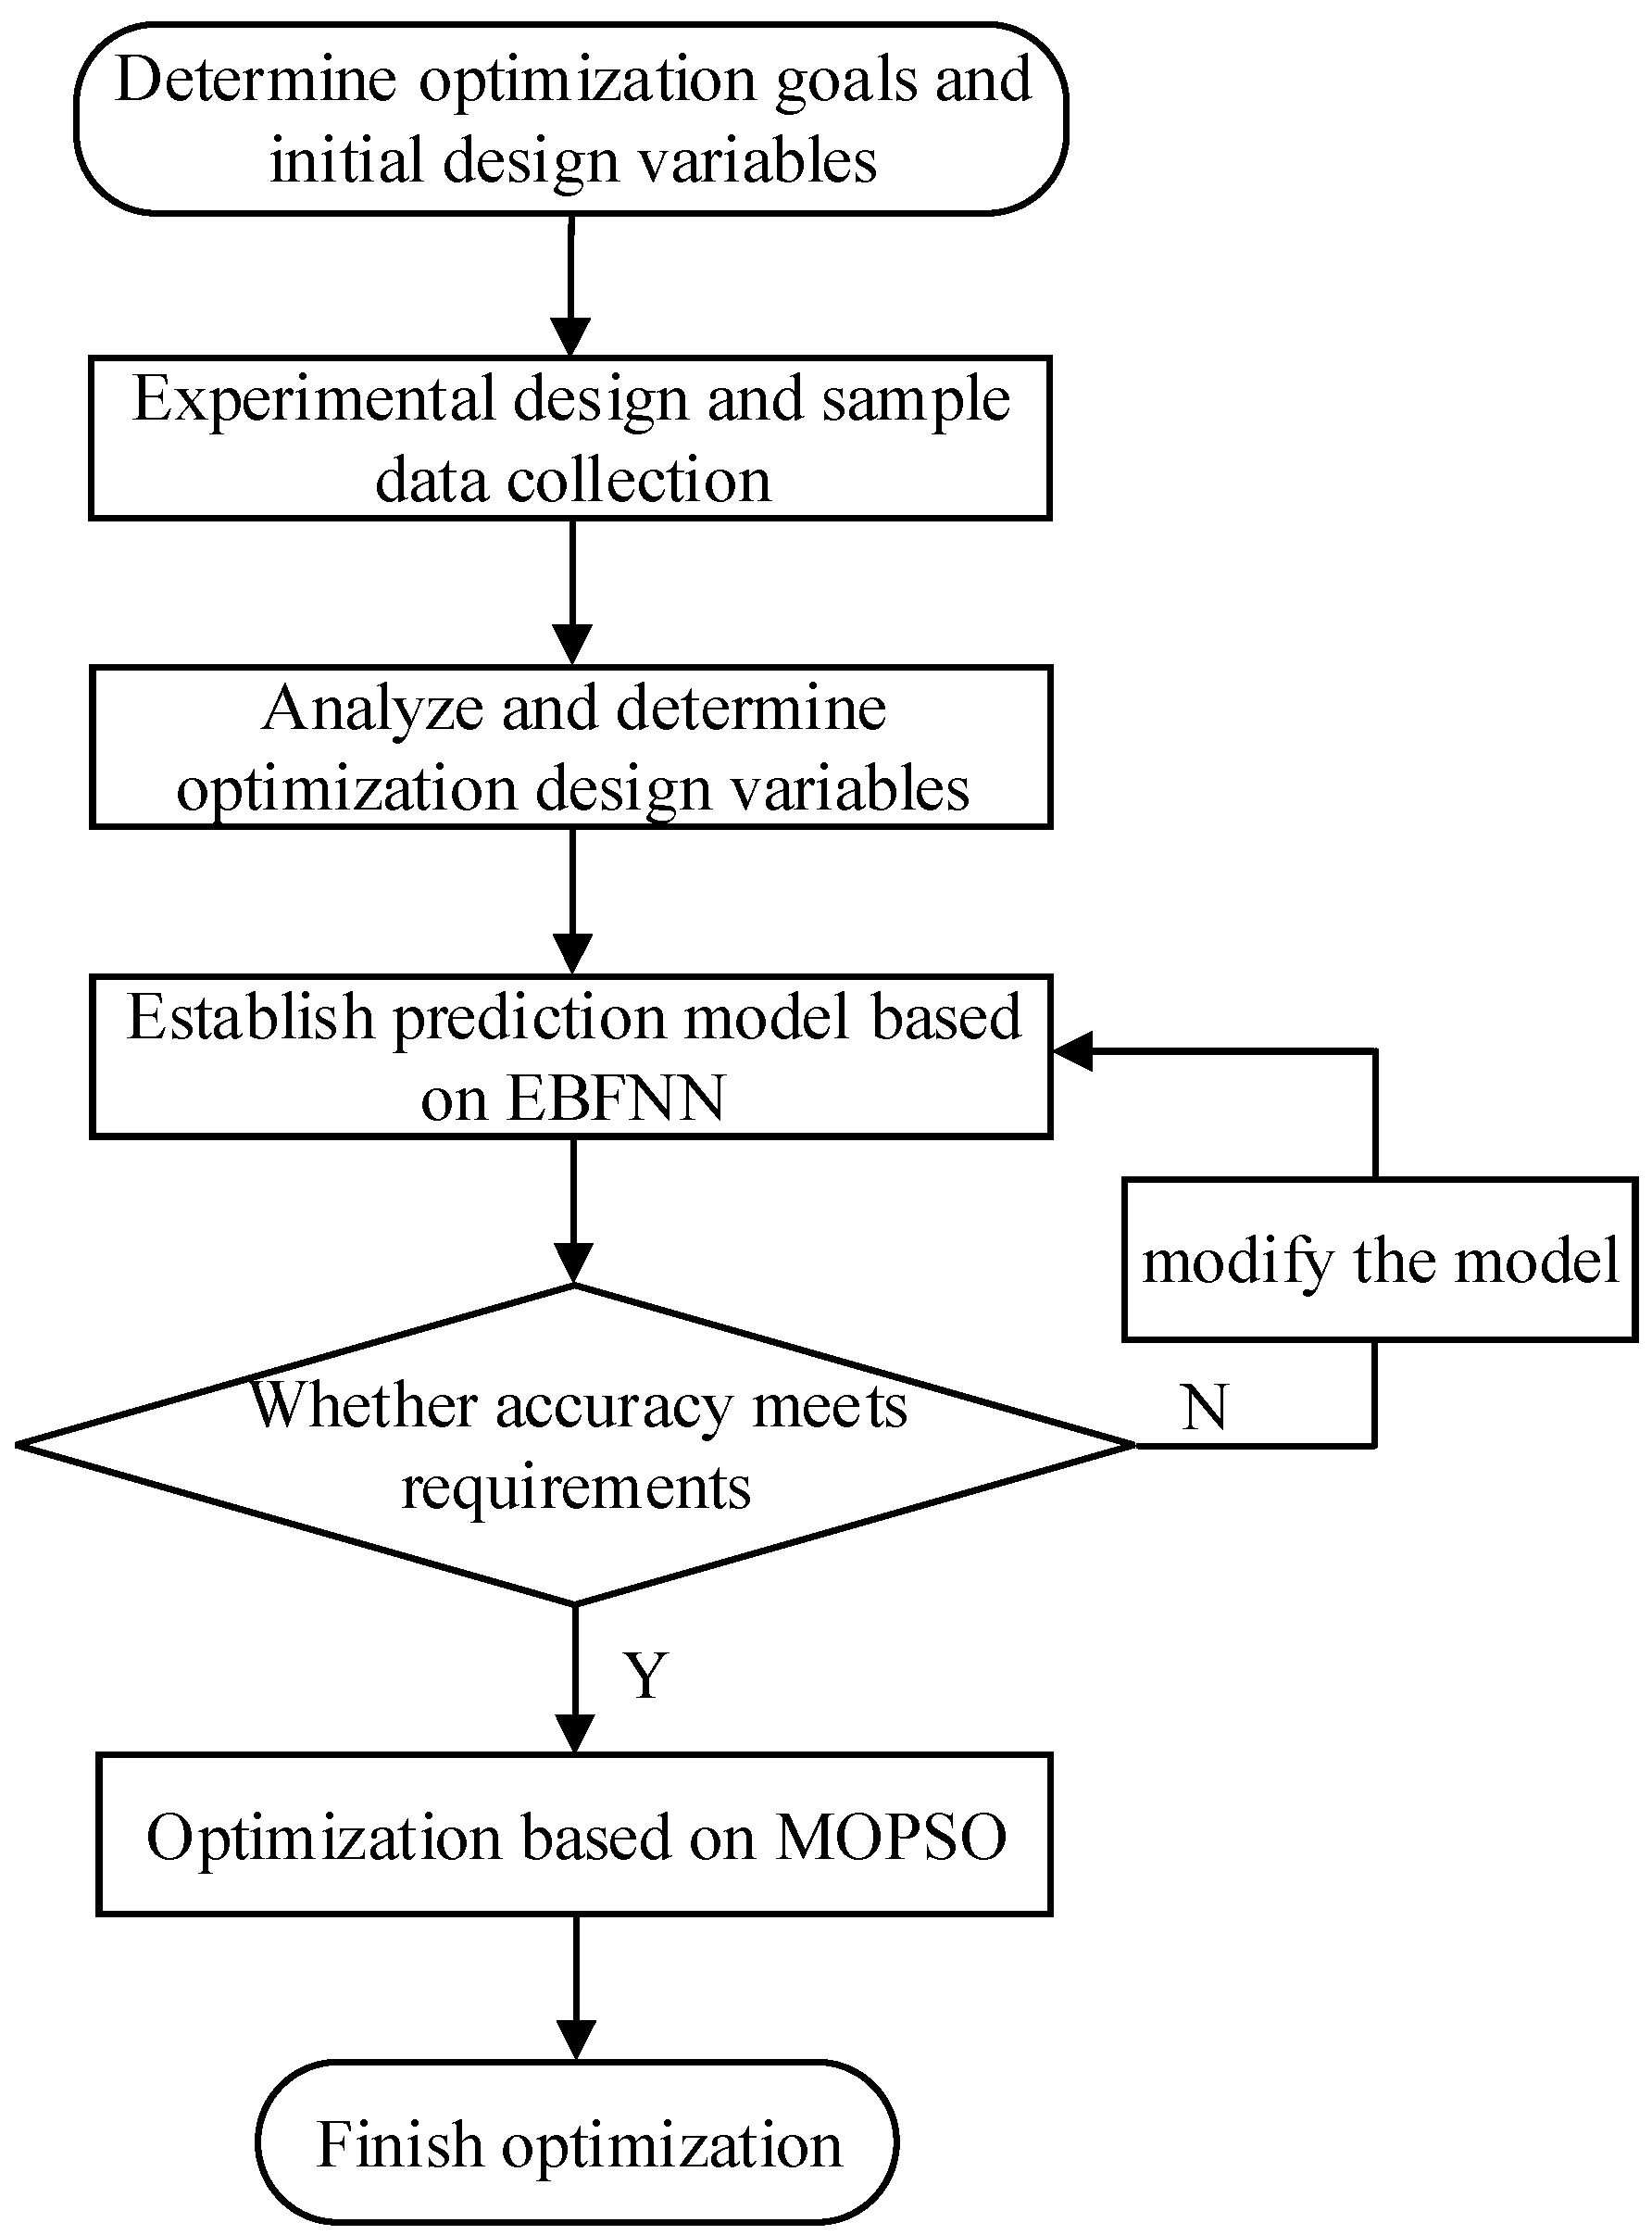
Quickly vibration reduction is desired to have a high output damping force, and a large damping dynamic range is required to improve the MR damper’s controllability. Although these can be achieved by increasing the radius and effective length of the flow gap, these methods are expected to increase the volume of the damper, which is not beneficial to the engineering practice. Therefore, it is essential to optimize the geometric parameters of MR dampers. In this section, the optimization process was developed to optimize the geometrical parameters and improve the damping properties of the MR damper. The design of experiments (DoE), elliptical basis function neural network (EBFNN), and multiobject particle swarm optimization (MOPSO) were used in the optimization. The output damping force and dynamic range representing the damping characteristics of the MR damper were selected as the objective function. A certain volume of the damper piston was used as the constraint condition. Figure 8 shows the optimization design process.
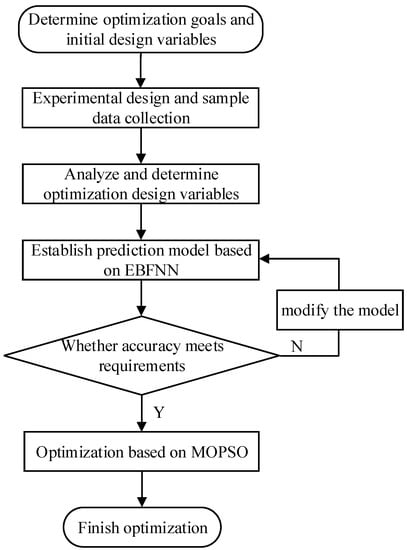
Figure 8.
Optimization process.
4.2. Design of Experiments (DoE)
The design optimization of MR devices was analyzed in the FEA for magnetic analysis. This leads to an increase in resources and computation time as each optimization process requires individual analysis of an FEA model. The DoE method was proposed to solve these problems. As an alternative methodology, a series of well-chosen design points in the design space were selected for specific analysis. The objective of the DoE is to identify the key design factors from the geometric parameters, systematically analyze the final response and relationship between variables and objectives, and provide the response data for the subsequent establishment of approximate functions in the early stage of the multiobjective optimization design. In this work, the script commands were batched in the ISIGHT software for calling the ANSYS software, and the FEA models of design points based on DoE were developed to achieve our objective function.
Based on Equations (2) and (3), the basic geometric parameters (effect of the magnetic flux density on the yield stress force) affect the output damping force of the MR damper, including the shear effective length L1 and L2, the radius of individual stage gap r, nonmagnetic length ta, coil slot depth Hc, gap thickness g, ring thickness tc, and piston radius rp. Since the radius of the damper remained constant in the optimization, the parameters related to the radial size of the damper, such as piston radius, coil slot depth, and external radius of core, were also kept as a constant. In addition, the gap thickness was the same in this work because its reduction would cause a blockage of the MR fluid; thus, it is difficult to ensure the machining accuracy. Four design variables were selected as the shear effective length L1 and L2, nonmagnetic length ta, and ring thickness tc, and their upper and lower limits are presented in Table 2. The Opt LHD method of DoE can achieve the investigation of more samples for each design variables, and these samples are spread evenly. In addition, considering the ability of fitting nonlinear response of the Opt LHD design, this method is used to conduct sampling analysis of MR damper and provide original data for the construction of an approximate model. The sample number is randomly selected as long as it is more than the design variables. Based on the upper and lower limits (Table 2) of design variables, this work generates 80 groups of samples spread evenly in the design space. The corresponding response values for each group were obtained through the joint ANSYS.
Table 2.
Upper and lower limits of design variables of the damper structure parameters.
Figure 9 shows the main effects of the four design variables on the output damping force and dynamic range. Here, the correlations between the affecting factors (except the ring thickness) and the output damping force are proportionally monotonic. The relationship between the dynamic range and the first shear effective length L1, the second shear effective length L2, and the nonmagnetic length ta are all nonlinear. The effect of the ring thickness on the damping force of the MR damper is insignificant. The negative correlation between the dynamic range and the ring thickness is almost linear. However, the previous value of the ring thickness was the lowest. Thus, as one of the damping properties, the ring thickness has an insignificant effect on the design parameter optimization.
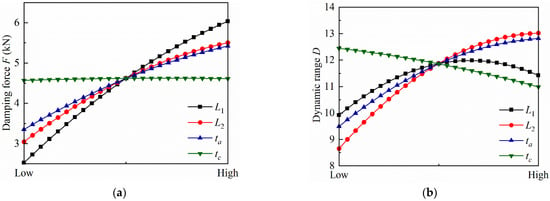
Figure 9.
Main effect graph: (a) damping force; (b) dynamic range.
4.3. Prediction Model
EBFNN is an approximate model with good flexibility and suitable for solving multidimensional problems. An elliptical basis function neural network was trained to predict the damping force and dynamic range of the MR damper. The relationship between the design variables of the approximate model and the target response can be written as
where y(x) is the actual value of simulation, is the predicted value obtained in the approximate model, and ε is the error between the simulated value and the predicted value.
Figure 10 shows the distributions of the damping force and dynamic range with different design variables obtained based on the elliptical basis function. The damping force and the dynamic range increased with the increase in shear effective length L1 and L2. To test the accuracy of the EBFNN prediction models, the 80 samples were used, and the predicted damping force and dynamic range agreed well with the FEA simulation.
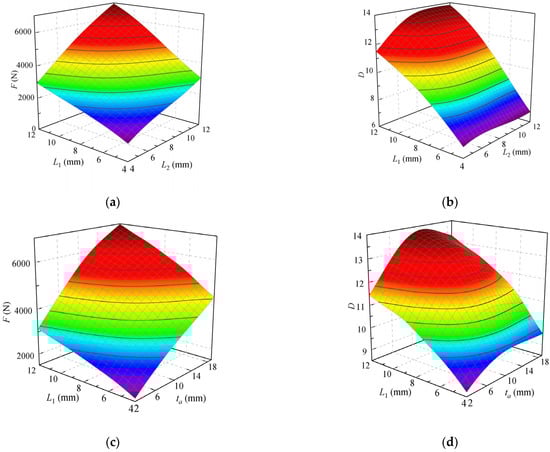
Figure 10.
Damping force and dynamic range via the elliptical basis function (EBF) model: (a) damping force (with L1 and L2); (b) dynamic range (with L1 and L2); (c) damping force (with ta and L1); (d) dynamic range (with ta and L1).
To verify the prediction precision of the proposed EBFNN models, five methods, namely the EBFNN, the RSM, the orthogonal polynomial, the Kriging method, and the radial basis function neural network were employed in this work. Table 3 lists the corresponding FEA results. The root-mean-square error (RMSE) and the determination coefficient (R2) demonstrate the prediction model validity and evaluate the model precision for both responses, respectively. The upper limit value of RMSE to judge the model is 0.2, and the smaller the value, the smaller the error of the constructed approximate model. The lower limit of R2 for judging the model qualified is 0.9, and the closer its value is to 1, the closer the constructed approximate model is to the actual response. Moreover, the errors of EBFNN model with respect to the FEA results are lower than that of the other methods, indicating that the fitting accuracy of this model is the highest. Therefore, the following analysis and optimization would be conducted based on the EBFNN prediction model. The corresponding equation is defined as:
Table 3.
Prediction comparison of different methods.
Where yi is the actual response value of the samples of part I, is the predicted value of part i of samples in the response surface model (RSM), and is the average value of the actual response for the samples of part i.
4.4. Optimization Design Based on MOPSO
Herein, the structural parameters, the first shear effective length L1, the second shear effective length L2, and the nonmagnetic length ta were selected as the design variables for this optimal design based on the discussion, while the volume constraint and design space for the optimal solution were incorporated into the optimization process. Hence, the mathematical expression of the multiobjective optimization problem can be written as
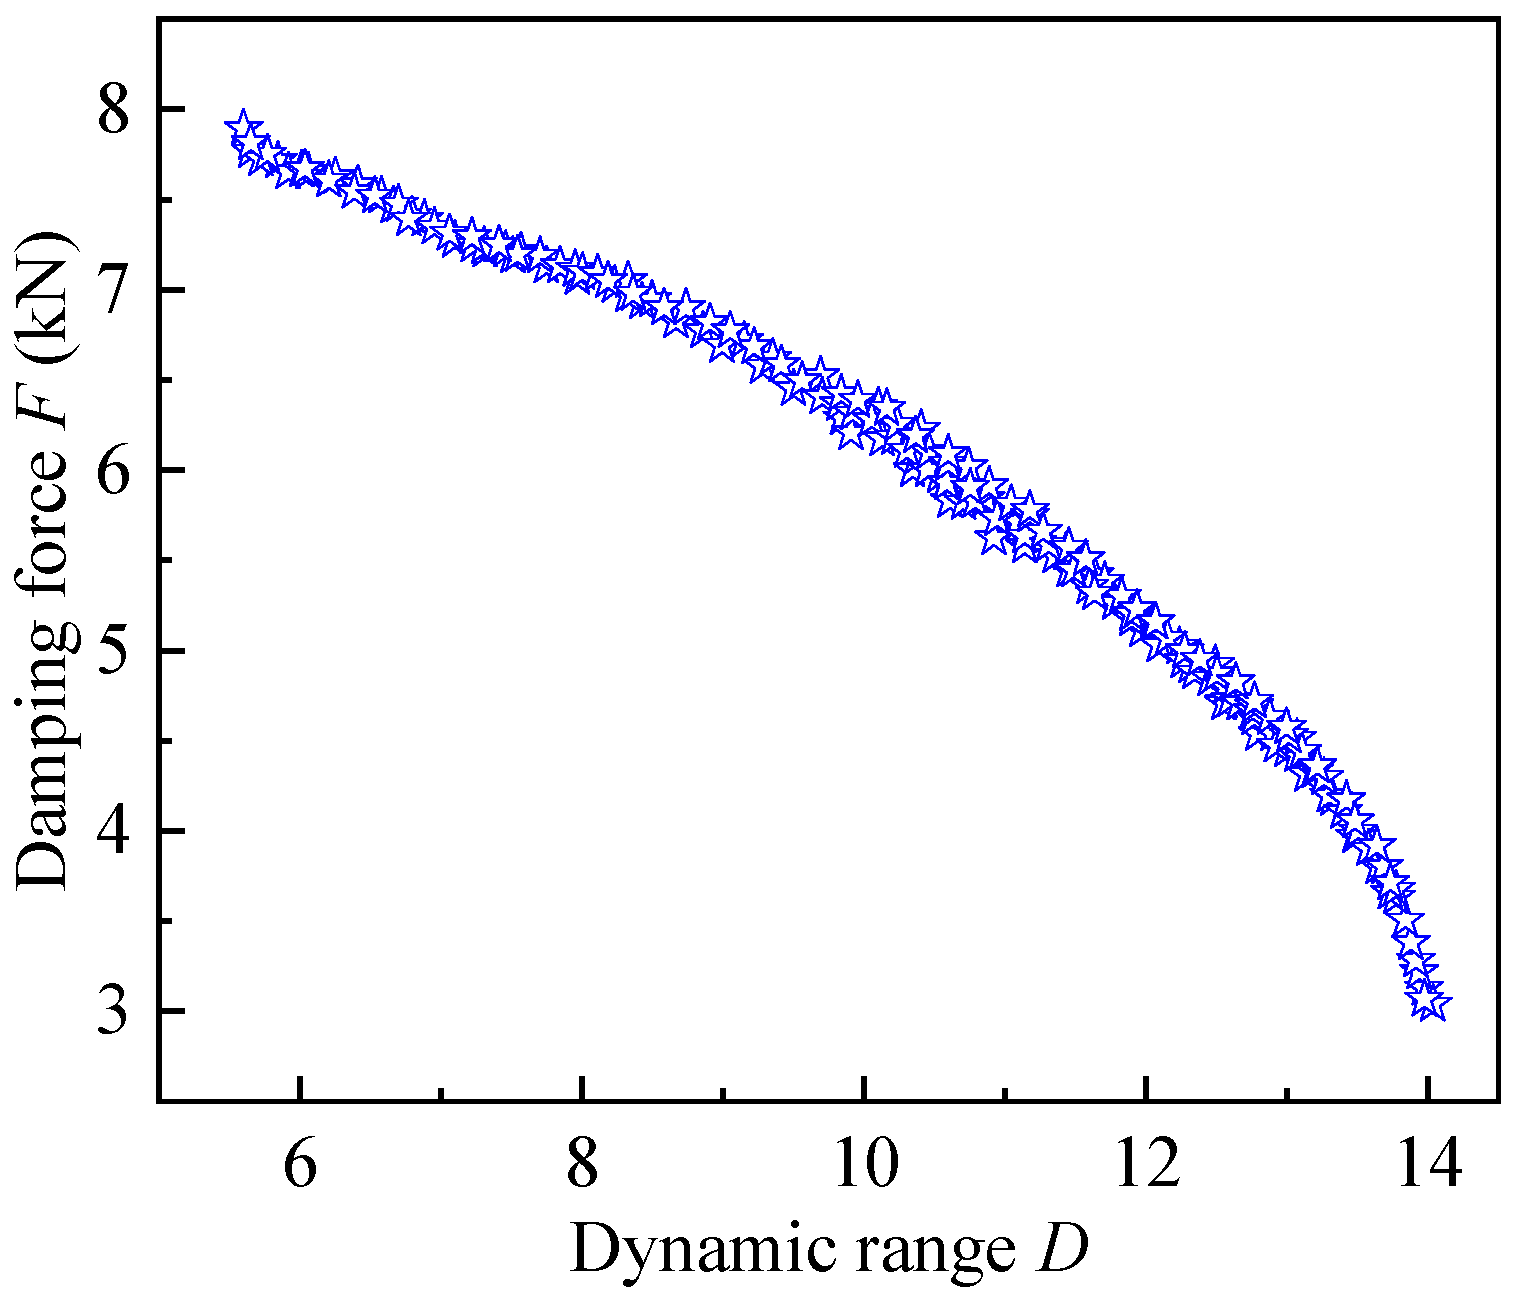
The MOPSO algorithm was selected in ISIGHT software to perform multiobjective optimization on the constructed approximate model. In the optimization problem, the objective is to maximize the damping force and the damping range. Moreover, the number of particles was set as 20; the maximum evolution iteration was set as 50; and the inertia, global increment index, and maximum velocity were set as 0.9, 0.9, and 0.1, respectively. Finally, 502 Pareto optimal solutions could be obtained by running the solution, and the distribution of the Pareto fronts is displayed in Figure 11. The optimal result achieved by the MOPSO was rounded, as shown in Table 4.
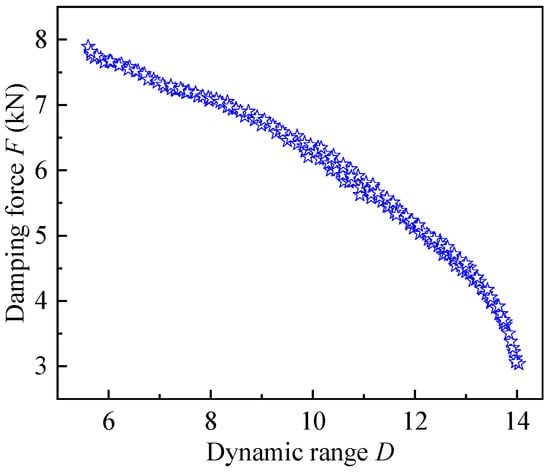
Figure 11.
Optimal Pareto front.
Table 4.
The detailed parameters of the optimal result.
4.5. Analysis of Optimization Results
The average magnetic flux density of the optimal MR damper was obtained by integrating the magnetic flux density of the gap, as shown in Figure 12. The average magnetic flux density gradually increases with the increase in the applied current. Then, the average magnetic flux density of the damping gaps increases from the outer gaps to the inner gaps due to the decreasing magnetic flux area from outer gaps to inner gaps with a specific current. This also explains that the magnetic flux densities of the two outer damping gaps are approximately the same. The average magnetic flux densities with a current of 1.5 A are 0.5 T for the inner damping gaps, 0.41 T for the middle damping gaps, and 0.32 T for the outer damping gaps. The magnetic field simulation results show that the magnetic flux density at each flow channel of the initial MR damper is better than that of the initial MR damper.
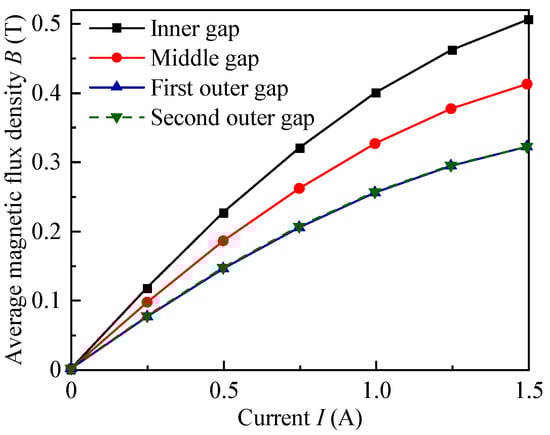
Figure 12.
Average magnetic flux density of the optimal MR damper along the detected damping gap with various current inputs.
Figure 13 shows the comparison curves of the damping performance indicators of the initial and optimal MR damper. As shown in Figure 13a, the discrepancy of the damping force between the optimal and initial MR damper linearly increases with the increasing current. Specifically, the damping force increased significantly from 4585 N to 6917 N at an applied current of 1.5 A of the optimal damper, which is improved by 50.8% compared to the initial damper. As shown in Figure 13b, the discrepancy of the dynamic range is not as significant as the damping force. This is determined by the characteristics of the dynamic range and the slightly larger field-off damping force of the optimal damper. The dynamic range of the optimal damper reaches 13.2 at a current of 1.5 A, which was increased by 6.4% compared to that of the initial damper (12.4). These indicate that the damping performance of the optimal MR damper was effectively and remarkably improved. Consequently, by using Opt LHD and EBFNN as the prediction models, the computational workload can be reduced, and the computer analysis time can be shortened, which can greatly improve the efficiency of global optimization.
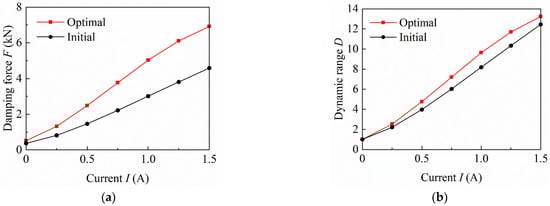
Figure 13.
Comparison of simulation with the initial and optimal MR damper. (a) Damping force; (b) dynamic range.
5. Test performance of the Optimal MR Damper
5.1. Test Rig Setup
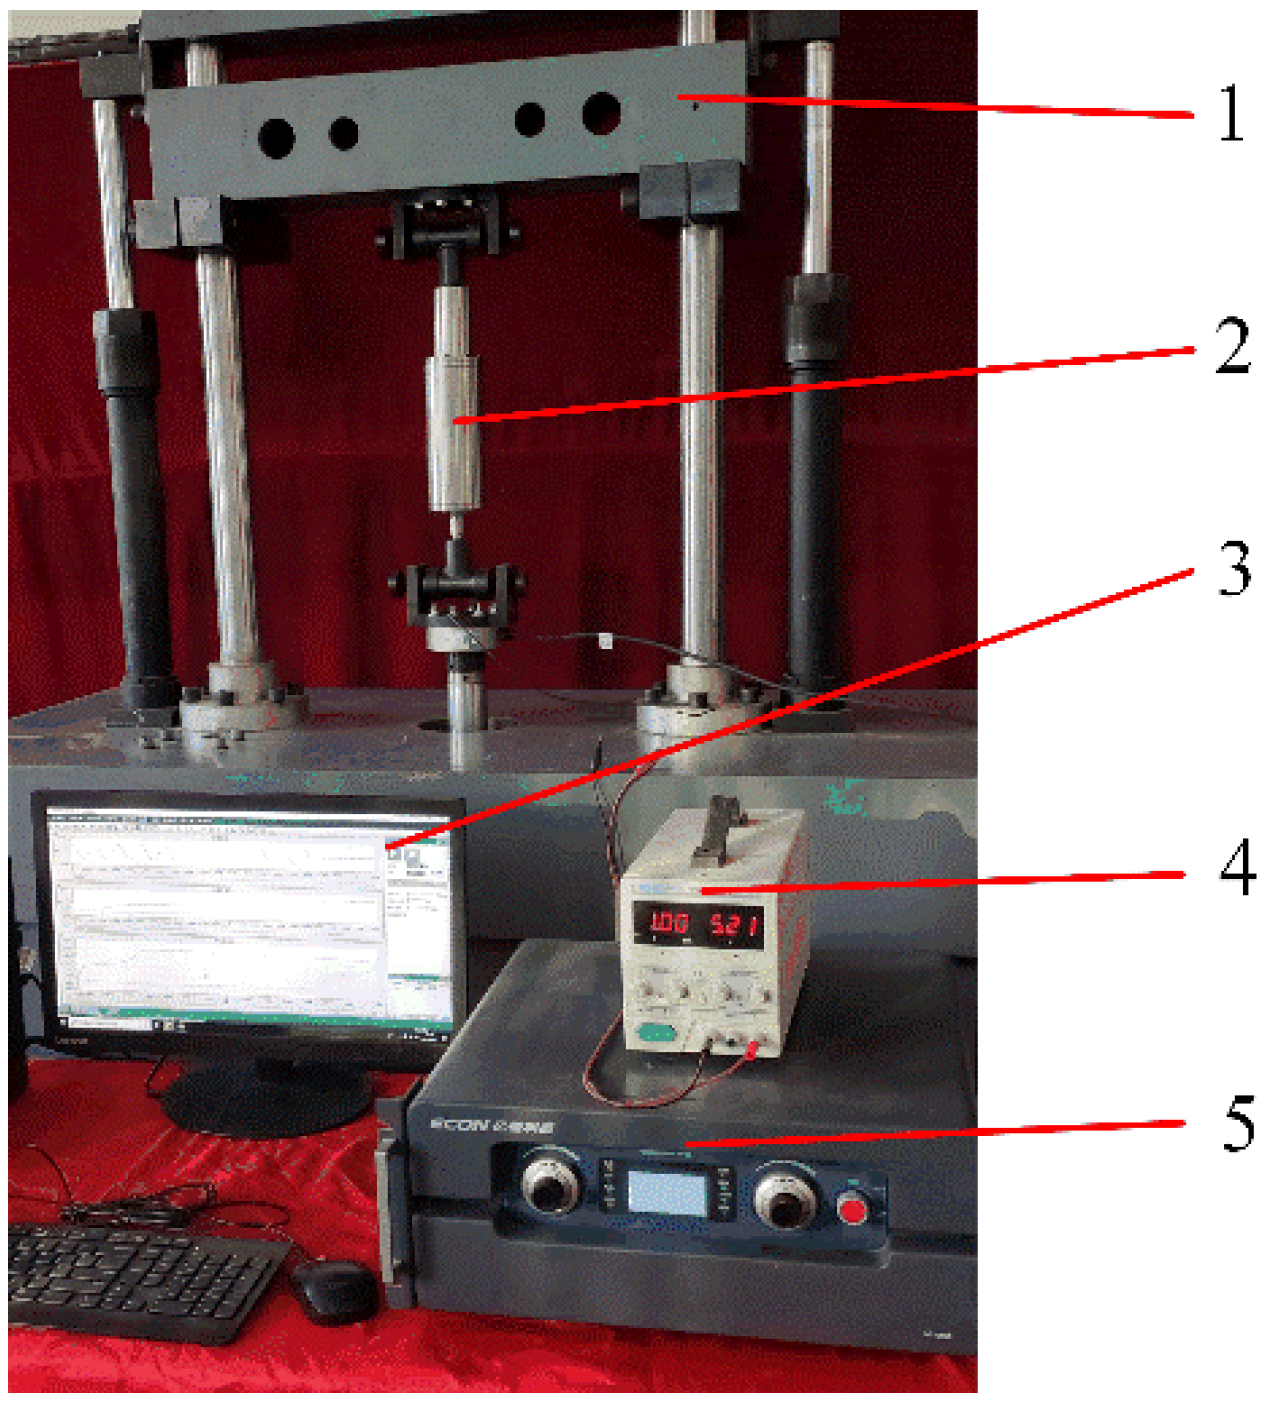
According to the structural parameters of the initial and optimal MR damper in Table 1 and Table 4, Figure 14 shows the prototype of the initial and optimal MR dampers with bended magnetic circuit and folded flow gap [31]. Figure 15 shows the performance test rig, which was built to evaluate the damping capacity of the MR damper before and after the optimization under varying input currents and sinusoidal excitations. One end of the MR damper is installed on the fixed end of the test rig, the other end is connected to the exciter of the test rig. The exciter is equipped with the force and displacement sensors. The DC power supply is utilized to offer adjustable exciting currents for the tested MR damper. The electrohydraulic servo controller controlled the exciter of the test rig that drives the MR damper to make the sinusoidal motions and exchange data with the computer. The controlled computer is applied to set test parameters and monitor and store test data.
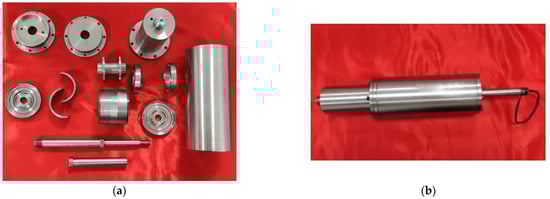
Figure 14.
Optimal MR damper (a) components; (b) prototype.
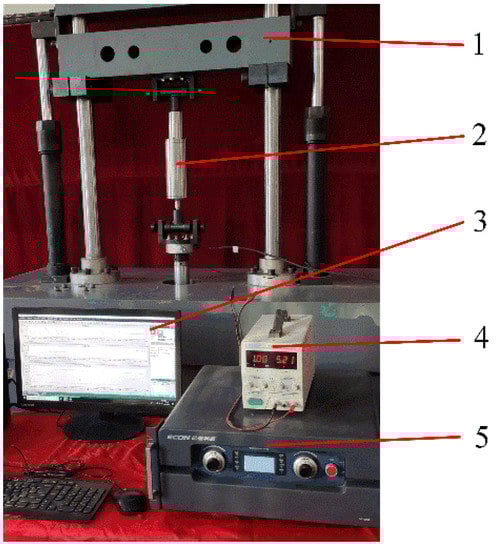
Figure 15.
Performance test rig of MR damper: 1. vibration excitation platform, 2. tested MR damper, 3. controlled computer, 4. DC power supply, 5. electrohydraulic servo controller [31].
5.2. Experimental Analysis of Damping Performance
Figure 16 shows the output damping force of the initial and optimal MR dampers with the input current of 1 A and sinusoidal displacement excitation with the same frequency of 0.25 Hz but with different amplitudes. The output damping forces of the initial and optimal MR dampers increase mildly with the increase in amplitude. With the varying amplitude from 2.5 mm to 10 mm, the maximum output damping force of the initial MR damper increases from 2696 N to 3403 N with the increase in amplitude. Meanwhile, the maximum output damping force of the optimal MR damper increases from 5681 N to 6933 N.
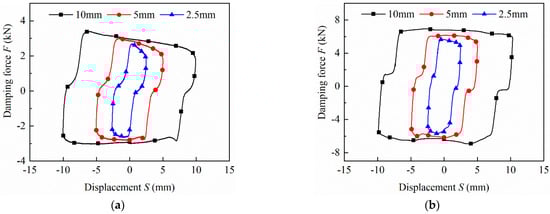
Figure 16.
Damping force under different amplitudes: (a) initial; (b) optimal.
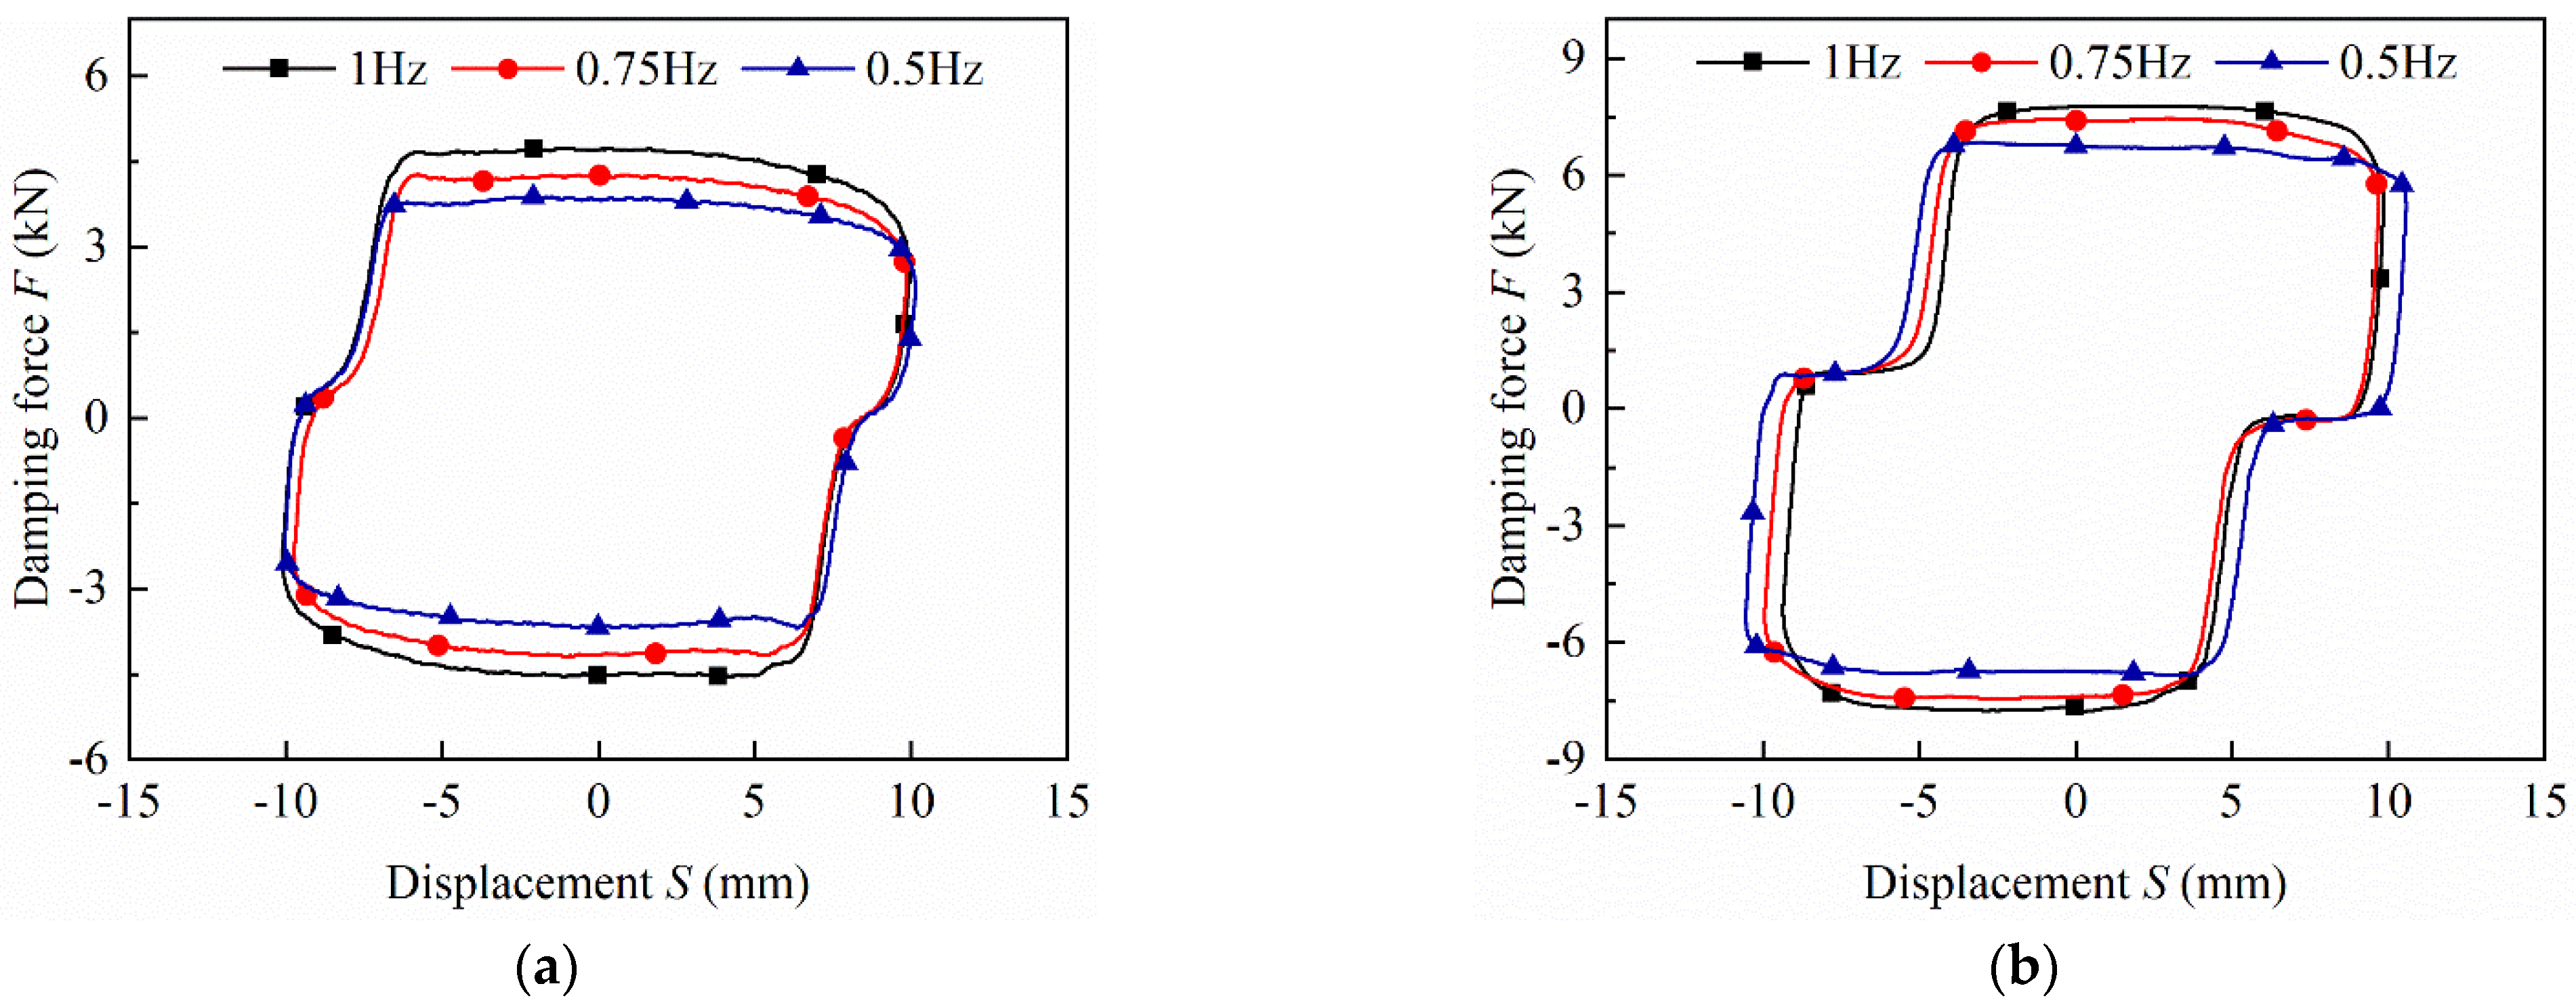
The damping characteristics of the initial and optimal MR damper were discussed by fixing the input current and amplitude, but with varying frequency. Figure 17 and Figure 18 show the output damping force of both the initial and optimal MR dampers at the input excitation current of 1 A, and the amplitude of 7.5 mm and 10 mm, respectively. The output damping forces of both dampers increase slowly with the increase in the exciting frequency. When the amplitude is 10 mm and the frequency is 1 Hz, the exciting speed is 0.0628 m/s, the maximum output damping force of the initial MR damper with the bended magnetic circuit and folded flow gap is 4739 N, and the maximum output damping force of the optimal damper is 6845 N.
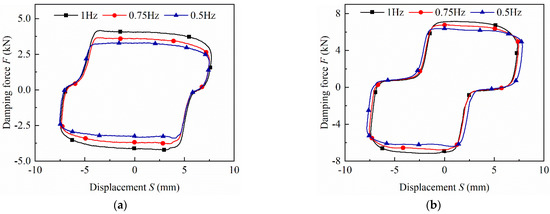
Figure 17.
Damping force with amplitude of 7.5 mm: (a) initial; (b) optimal.
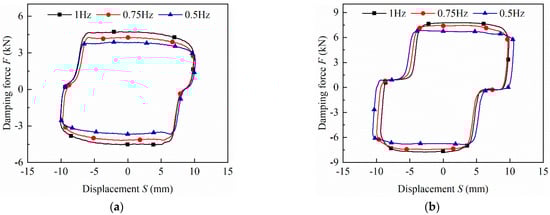
Figure 18.
Damping force with amplitude of 10 mm: (a) initial; (b) optimal.
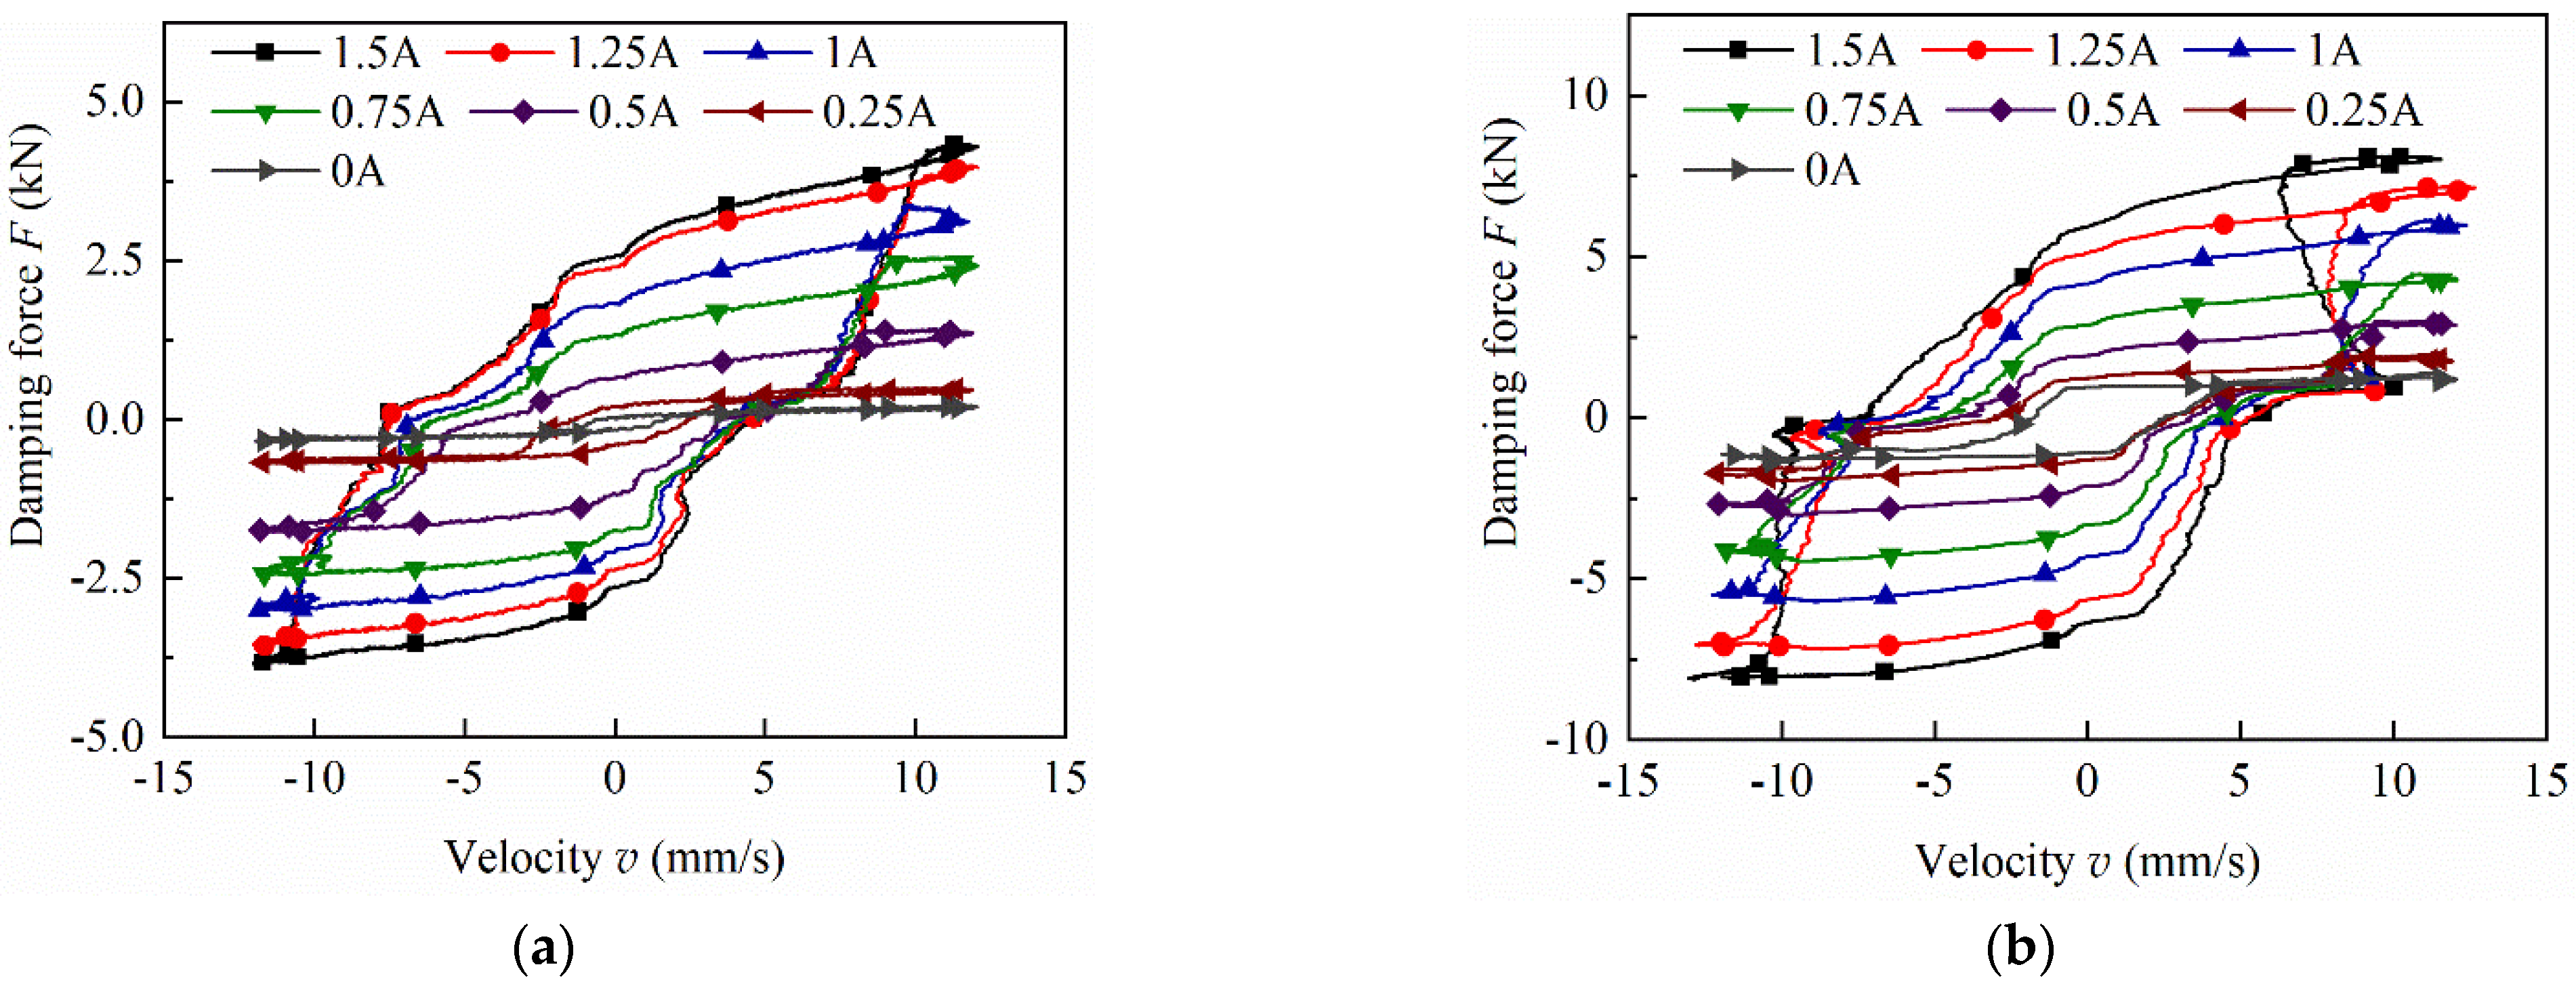
Figure 19 and Figure 20 show the damping characteristics of the initial and optimal MR dampers with varying exciting currents under the sinusoidal displacement excitation with fixed amplitude of 7.5 mm and frequency of 0.25 Hz. The output damping forces of both the initial and optimal MR dampers increase with the increasing current. This is because that the magnetic flux density in the damping gap increases with the increasing current; thus, the magnetic flux density affects the yield stress and then increases the controllable damping force. The output damping force of the optimal MR damper is larger than that of the initial MR damper with the same current. In addition, as shown in Figure 20, the initial and optimal MR dampers exhibit the hysteresis loop characteristic at low piston velocities. Although the hysteresis loop characteristic is unable to be explained by the Bingham model, the effect on the optimization design stage of the MR damper is very insignificant.
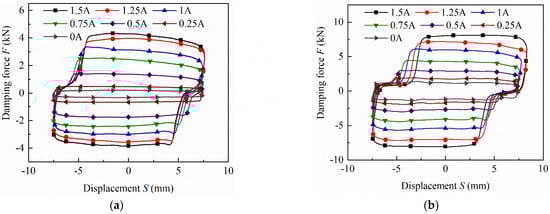
Figure 19.
Damping force versus displacement under different currents: (a) initial; (b) optimal.
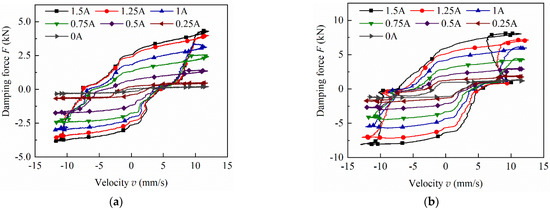
Figure 20.
Damping force versus velocity under different currents: (a) initial; (b) optimal.
Figure 21a shows the damping force comparison of the simulation and experimental results of the initial MR damper. The damping force of the simulation is linear with the current, while the linear relationship between them in the experiment is not obvious. The maximum deviation between the test and simulation results is 446 N at a current of 0.25 A, which is within the acceptable range.
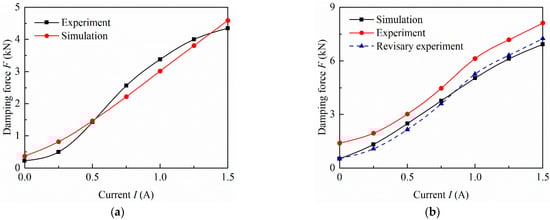
Figure 21.
Comparison of damping force between simulation and experiment: (a) initial; (b) optimal.
Figure 21b compares the damping forces of the simulation and experimental results of the optimal MR damper. The experimental damping force is larger than the simulation damping force, which is due to the excessive interactive friction caused between the piston outer wall and cylinder. For better comparison, the experimental correction curve was generated by eliminating the friction factor from the field-off damping force of simulation. The experimental correction curve agrees well with the simulation curve. In addition, the dynamic range of the experimental correction of the optimal MR damper is consistent with the simulation results (Figure 13), and its value reaches 13.8 at the current of 1.5 A. Therefore, the simulation can effectively predict the damping characteristics of the optimal MR damper.
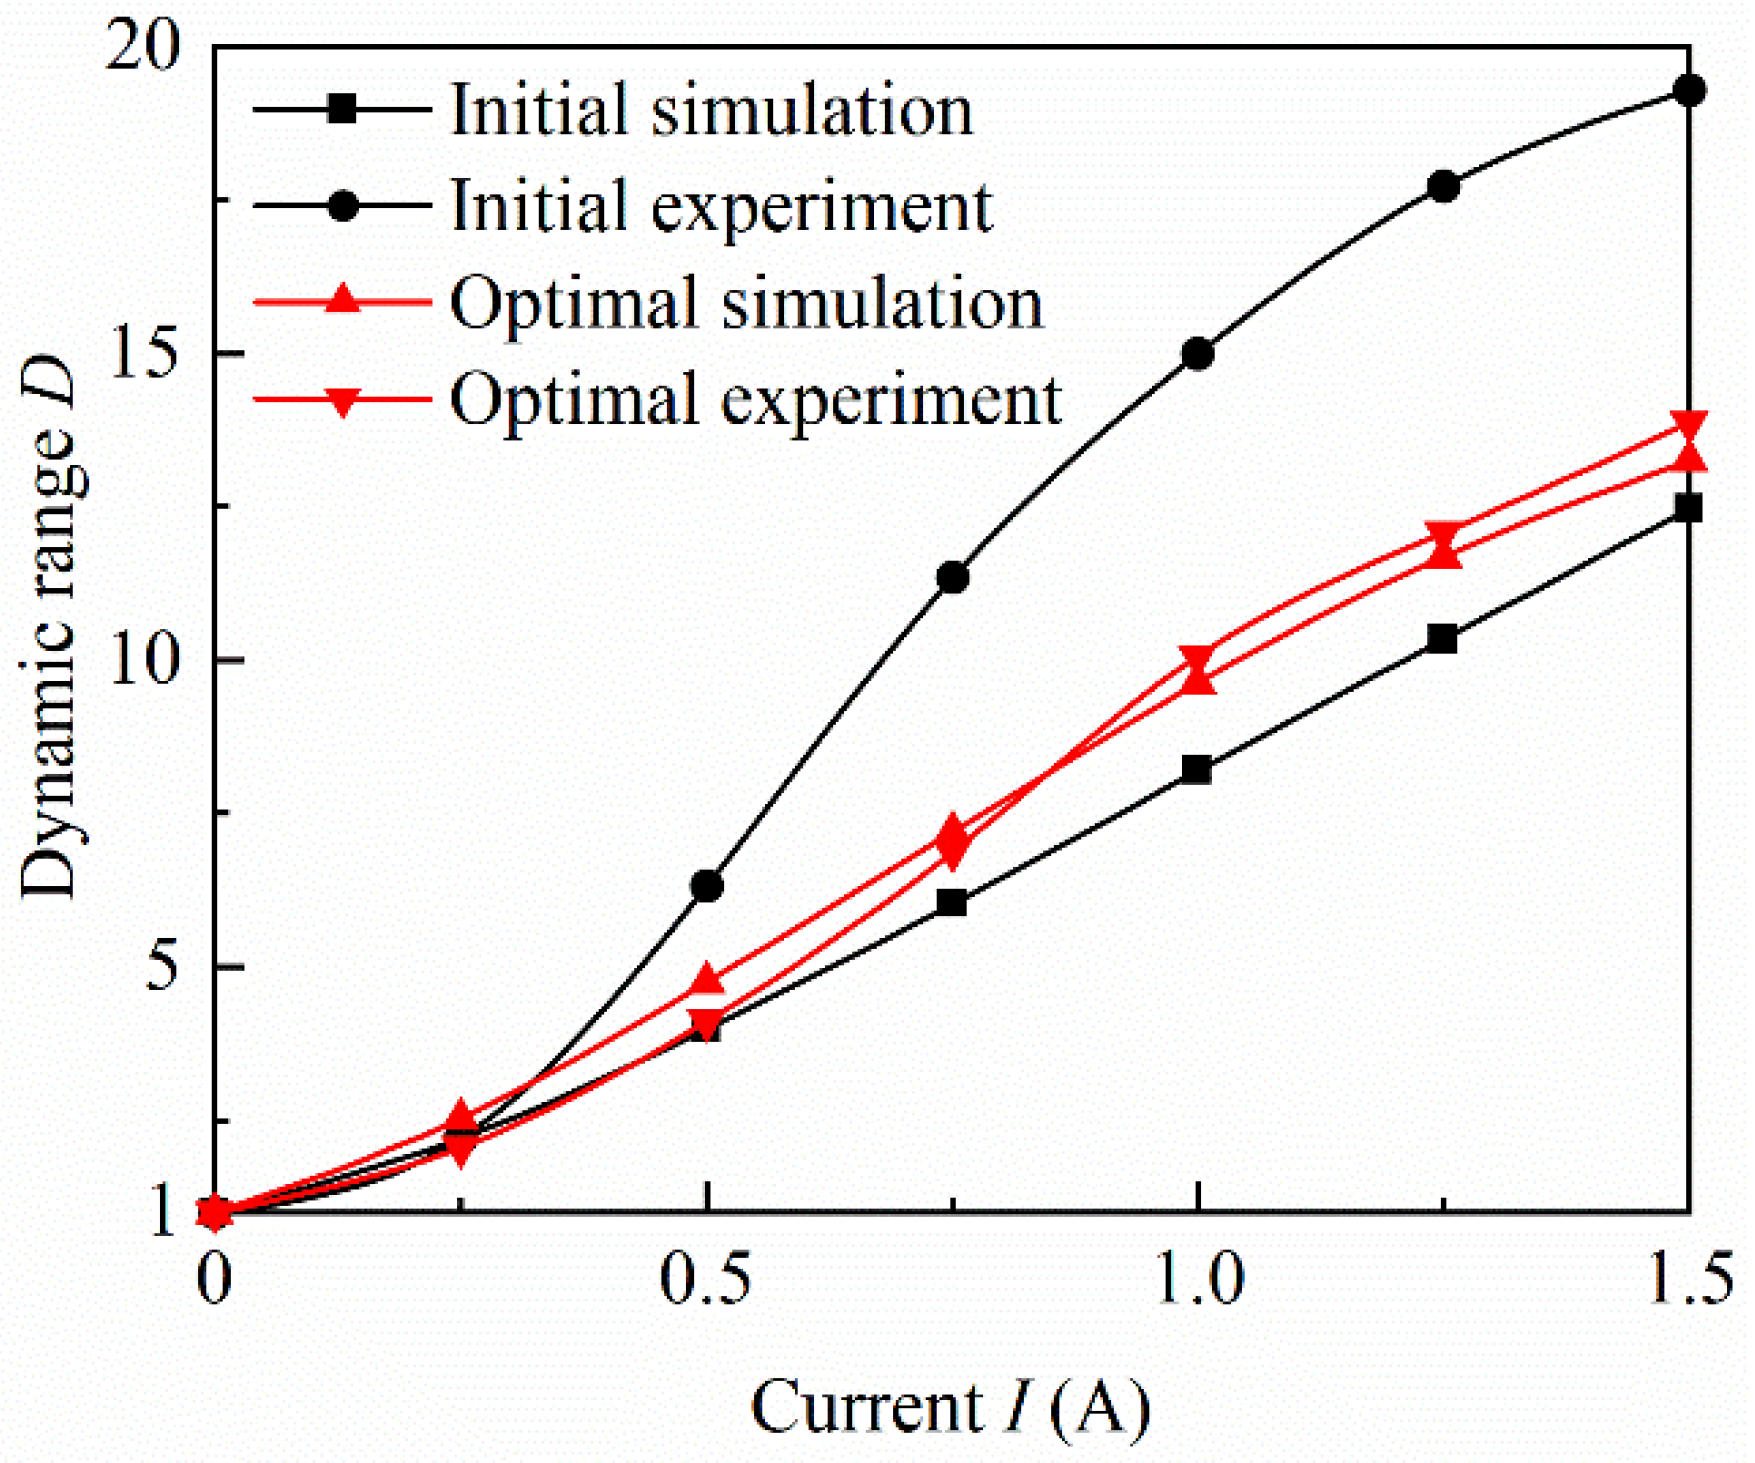
Figure 22 shows that the dynamic range of the experiment and simulation of the optimal MR damper is in good agreement, but the experimental dynamic range of the initial damper is much larger than that of the simulation. This is mainly due to the inevitable error caused during the manufacturing and experiment. For instance, if a MR fluid leakage occurred during the test process, the experimental results would be lower than the simulation results at the field-off, while a negative correlation was observed between the dynamic range and field-off damping force under certain conditions.

Figure 22.
Comparison of dynamic between simulation and experiment.
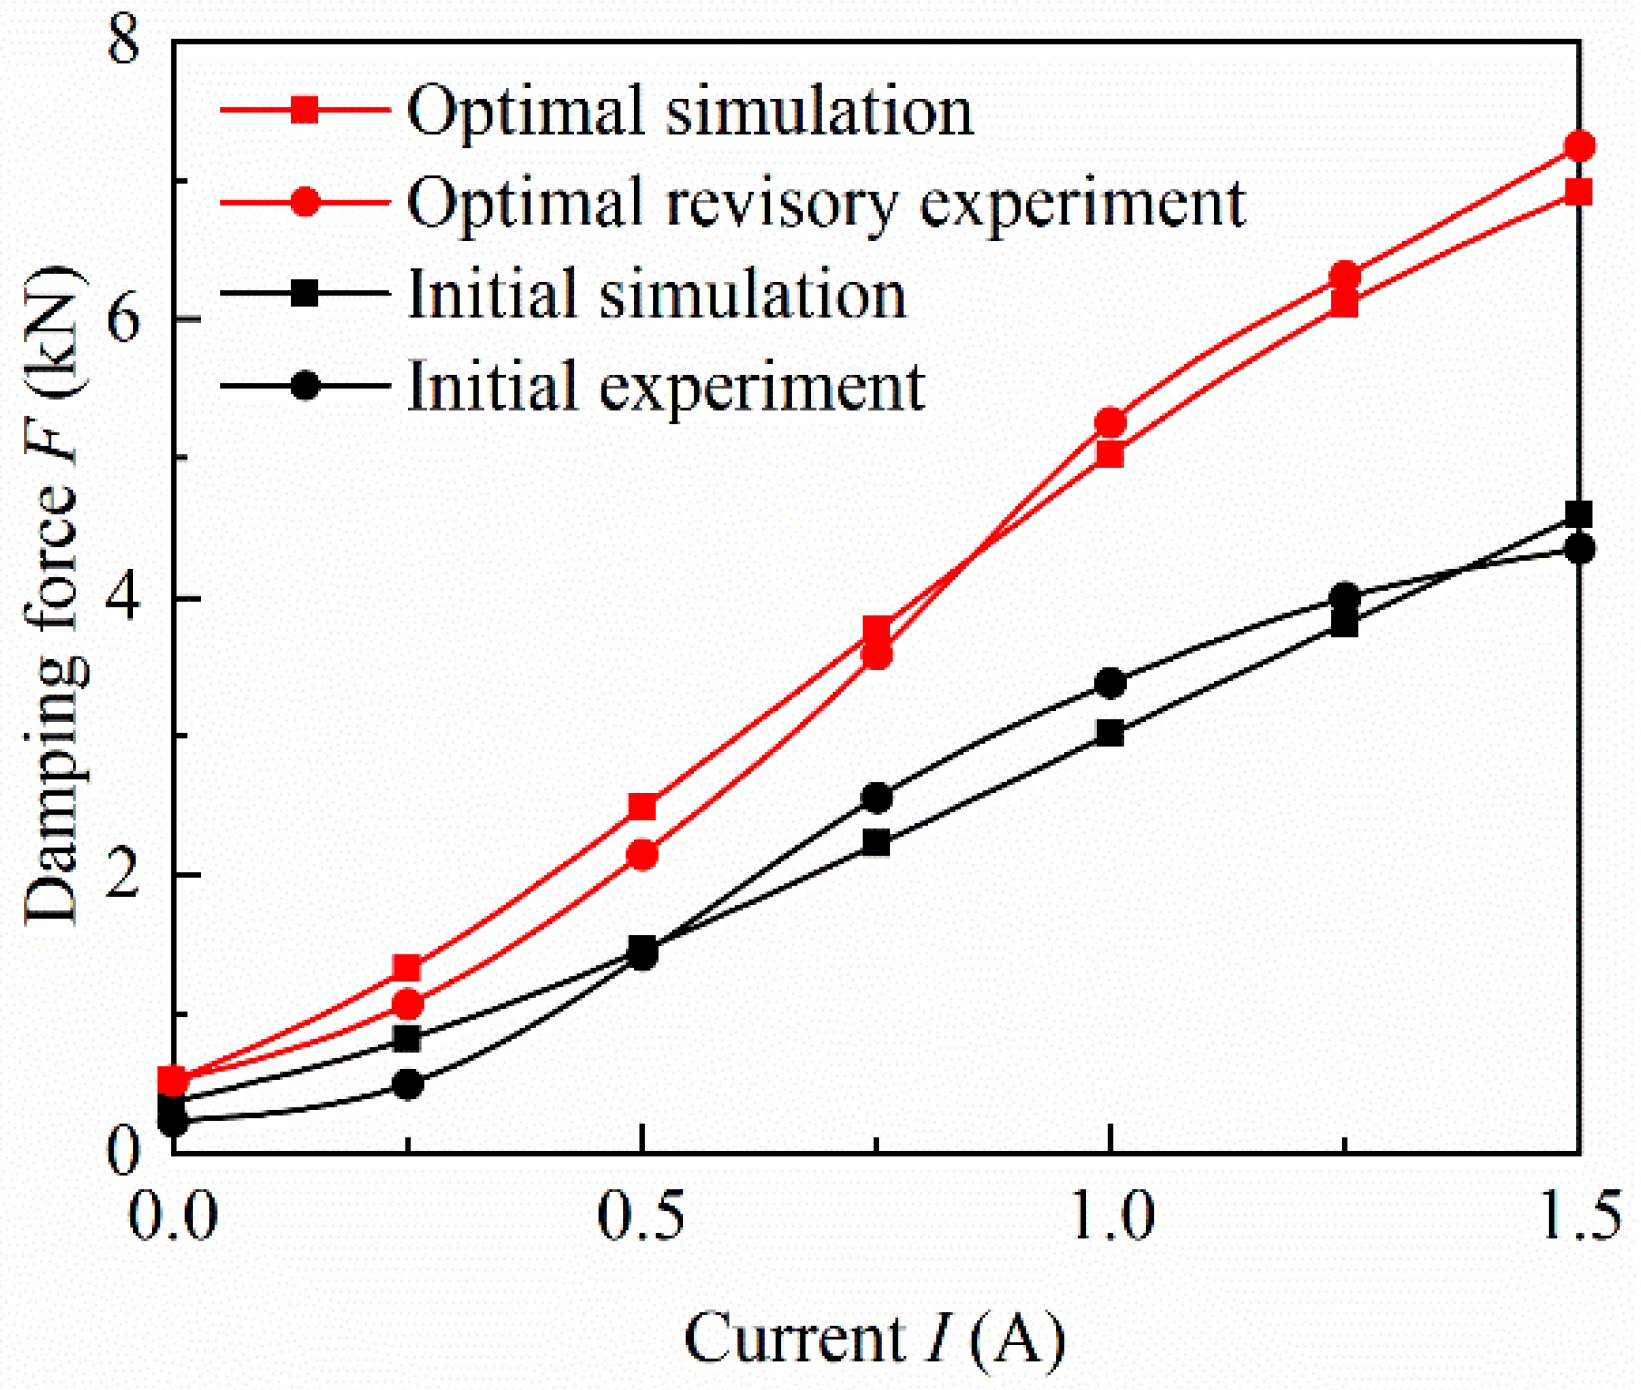
Figure 23 shows the comparison of the experimental damping force before and after the optimization. The damping force of the optimal MR damper is significantly better than that of the initial MR damper. The maximum output damping force of the optimal damper is 7247 N, while that of the initial damper is 4346 N, which was increased by 66.7%.

Figure 23.
Comparison of damping forces of the initial and optimal MR dampers.
6. Conclusions
In this paper, a novel MR damper configuration with multistage fold gaps and bending magnetic circuits was established. A multiobjective optimization of the structural parameters was proposed to improve the damping performance of the MR damper. The main conclusions can be drawn as follows:
(1) The effects of the first shear effective length L1, the second shear effective length L2, and the nonmagnetic length ta on the damping force and dynamic range of the MR damper are more significant compared to that of the other parameters.
(2) When predicting the damping force and dynamic range, the EBFNN prediction model is more accurate than the RSM, orthogonal polynomial, Kriging method, and radial basis function neural network models.
(3) The simulation results show that structural optimization improved the damping force and dynamic range significantly. The damping force of the optimized structure increased to 6917 N, which was improved by 50.8%; the dynamic range increased to 13.2, which was improved by 6.4% compared to that of the initial damper. Additionally, the optimization can be verified by the experimental correction result, where the output damping force and dynamic range were 7247 N and 13.8, respectively.
Author Contributions
Conceptualization, L.L. and Y.X.; methodology, L.L. and G.H.; validation, Y.X. and F.Z.; formal analysis, L.L. and Y.X.; investigation, Y.X. and L.Y.; resources, L.L. and G.H.; data curation, Y.X.; writing—original draft preparation, L.L. and Y.X.; writing—review and editing, G.H., F.Z. and C.H.; visualization, Y.X.; supervision, L.L. and G.H.; project administration, L.L. All authors have read and agreed to the published version of the manuscript.
Funding
This research was funded by the National Natural Science Foundation of China (No. 52165004), Key Project of Natural Science Foundation of Jiangxi Province of China (No. 20212ACB204002).
Institutional Review Board Statement
Not applicable.
Informed Consent Statement
Not applicable.
Conflicts of Interest
The authors declare no conflict of interest.
References
- Kikuchi, T.; Noma, J.; Akaiwa, S.; Ueshima, Y. Response time of magnetorheological fluid-based haptic device. J. Intell. Mater. Syst. Struct. 2016, 27, 859–865. [Google Scholar]
- Hua, D.Z.; Liu, X.H.; Li, Z.Q.; Fracz, P.; Hnydiuk-Stefan, A.; Li, Z. A review on structural configurations of magnetorheological fluid based devices reported in 2018–2020. Front. Mater. 2021, 8, 640102. [Google Scholar]
- Krauze, P.; Kasprzyk, J.; Rzepecki, J. Experimental attenuation and evaluation of whole body vibration for an off-road vehicle with magnetorheological dampers. J. Low Freq. Noise Vib. Act. Control 2019, 38, 852–870. [Google Scholar]
- Yang, J.; Ning, D.; Sun, S.S.; Zheng, J.; Lu, H.; Nakano, M.; Zhang, S.; Du, H.; Li, W.H. A semi-active suspension using a magnetorheological damper with nonlinear negative-stiffness component. Mech. Syst. Signal Process. 2021, 147, 107071. [Google Scholar]
- Caterino, N.; Spizzuoco, M.; Piccolo, V.; Magliulo, G. A semi-active control technique through mr fluid dampers for seismic protection of single-story rc precast buildings. Materials 2022, 15, 759. [Google Scholar]
- Yu, Y.; Royel, S.; Li, Y.C.; Li, J.C.; Yousefi, A.M.; Gu, X.Y.; Li, S.Q.; Li, H. Dynamic modelling and control of shear-mode rotational mr damper for mitigating hazard vibration of building structures. Smart Mater. Struct. 2020, 29, 114006. [Google Scholar]
- Oba, T.; Kadone, H.; Hassan, M.; Suzuki, K. Robotic ankle-foot orthosis with a variable viscosity link using mr fluid. Ieee-Asme Trans. Mechatron. 2019, 24, 495–504. [Google Scholar]
- Liu, G.Y.; Gao, F.; Wang, D.H.; Liao, W.H. Medical applications of magnetorheological fluid: A systematic review. Smart Mater. Struct. 2022, 31, 043002. [Google Scholar]
- Huina, H.; Zhen, J.; XuHui, L.; XingYan, Y.; Zhijuan, D.; Bin, X.; Meiling, P. Multi-objective optimal design and performance of magnetorheological damper. Mater. Werkst. 2021, 52, 540–547. [Google Scholar]
- Patel, D.M.; Upadhyay, R.V.; Bhatt, D.V. Design and optimization of shear mode mr damper using grg and gra methods: Experimental validation. Sādhanā 2021, 46, 217. [Google Scholar]
- Jiang, M.; Rui, X.; Yang, F.; Zhu, W.; Zhang, Y. Multi-objective optimization design for a magnetorheological damper. J. Intell. Mater. Syst. Struct. 2021, 33, 33–45. [Google Scholar]
- Gurubasavaraju, T.M.; Kumar, H.; Arun, M. Evaluation of optimal parameters of mr fluids for damper application using particle swarm and response surface optimisation. J. Braz. Soc. Mech. Sci. Eng. 2017, 39, 3683–3694. [Google Scholar]
- Nie, S.L.; Xin, D.K.; Ji, H.; Yin, F.L. Optimization and performance analysis of magnetorheological fluid damper considering different piston configurations. J. Intell. Mater. Syst. Struct. 2019, 30, 764–777. [Google Scholar]
- Marathe, A.P.; Khot, S.M.; Nagler, J. Development of low-cost optimal magneto-rheological damper for automotive application. J. Vib. Eng. Technol. 2022. [Google Scholar] [CrossRef]
- Saleh, M.; Sedaghati, R.; Bhat, R. Design optimization of a bi-fold mr energy absorber subjected to impact loading for skid landing gear applications. Smart Mater. Struct. 2019, 28, 035031. [Google Scholar]
- Dong, Z.; Feng, Z.; Chen, Y.; Yu, K.; Zhang, G. Design and multiobjective optimization of magnetorheological damper considering the consistency of magnetic flux density. Shock Vib. 2020, 2020, 7050356. [Google Scholar]
- Xu, F.H.; Dong, D.W.; Huang, Y.; Zhang, R.; Song, S.Z.; Zheng, D. A comprehensive optimal design method for magnetorheological dampers utilized in dmu power package. Proc. Inst. Mech. Eng. Part L-J. Mater. Des. Appl. 2022, 236, 533–547. [Google Scholar]
- Liu, G.; Gao, F.; Liao, W.H. Shape optimization of magnetorheological damper piston based on parametric curve for damping force augmentation. Smart Mater. Struct. 2021, 31, 015027. [Google Scholar]
- Naserimojarad, M.M.; Moallem, M.; Arzanpour, S. A comprehensive approach for optimal design of magnetorheological dampers. J. Intell. Mater. Syst. Struct. 2018, 29, 3648–3655. [Google Scholar]
- Nanthakumar, A.J.D.; Jancirani, J. Design optimization of magnetorheological damper geometry using response surface method for achieving maximum yield stress. J. Mech. Sci. Technol. 2019, 33, 4319–4329. [Google Scholar]
- Olivier, M.; Sohn, J.W. Design and geometric parameter optimization of hybrid magnetorheological fluid damper. J. Mech. Sci. Technol. 2020, 34, 2953–2960. [Google Scholar]
- Nguyen, Q.H.; Choi, S.B. Optimal design of mr shock absorber and application to vehicle suspension. Smart Mater. Struct. 2009, 18, 035012. [Google Scholar]
- Wei, L.; Lv, H.; Yang, K.; Ma, W.; Wang, J.; Zhang, W. A comprehensive study on the optimal design of magnetorheological dampers for improved damping capacity and dynamical adjustability. Actuators 2021, 10, 64. [Google Scholar]
- Zhang, L.M.; Lin, P.F. Multi-objective optimization for limiting tunnel-induced damages considering uncertainties. Reliab. Eng. Syst. Saf. 2021, 216, 107945. [Google Scholar]
- Xu, L.; Bi, K.; Gao, J.-F.; Xu, Y.; Zhang, C. Analysis on parameter optimization of dampers of long-span double-tower cable-stayed bridges. Struct. Infrastruct. Eng. 2019, 16, 1286–1301. [Google Scholar]
- Mousavi, S.H.; Sayyaadi, H. Optimization and testing of a new prototype hybrid MR brake with arc form surface as a prosthetic knee. IEEE ASME Trans. Mechatron. 2018, 23, 1204–1214. [Google Scholar]
- Nasir, A.N.K.; Azwan, A.R.A.; Ashraf, A.M.; Falfazli, M.J.M. A multi-objective Spiral Dynamic algorithm and its application for PD design. In Proceedings of the 2017 IEEE 8th Control and System Graduate Research Colloquium (ICSGRC), Shah Alam, Malaysia, 4–5 August 2017. [Google Scholar]
- Zhang, X.W.; Liu, H.; Tu, L.P. A modified particle swarm optimization for multimodal multi-objective optimization. Eng. Appl. Artif. Intell. 2020, 95, 103905. [Google Scholar]
- Gao, F.; Liu, Y.N.; Liao, W.-H. Optimal design of a magnetorheological damper used in smart prosthetic knees. Smart Mater. Struct. 2017, 26, 035034. [Google Scholar]
- Deng, Z.X.; Yang, Q.H.; Zhao, S.; Wei, H.B. Multi-objective optimization of magneto-rheological mount structure based on vehicle vibration control. J. Intell. Mater. Syst. Struct. 2021, 32, 1155–1166. [Google Scholar]
- Liu, L.; Xu, Y.; Zhou, F.; Hu, G.; Yu, L. Performance analysis of magnetorheological damper with folded resistance gaps and bending magnetic circuit. Actuators 2022, 11, 165. [Google Scholar]
- Hu, G.; Wu, L.; Deng, Y.; Yu, L.; Luo, B. Damping performance analysis of magnetorheological damper based on multiphysics coupling. Actuators 2021, 10, 176. [Google Scholar]


Publisher’s Note: MDPI stays neutral with regard to jurisdictional claims in published maps and institutional affiliations. |
© 2022 by the authors. Licensee MDPI, Basel, Switzerland. This article is an open access article distributed under the terms and conditions of the Creative Commons Attribution (CC BY) license (https://creativecommons.org/licenses/by/4.0/).