Abstract
Compared to traditional detection methods, image-based flow statistics that determine the number of people in a space are contactless, non-perceptual, and high-speed statistical methods that have broad application prospects and potential economic value in business, education, transportation, and other fields. In this paper, we propose that the distributed probability-adjusted confidence (DPAC) function can optimize the reliability of model prediction according to the actual situation. That is, the reliability can be adjusted using the distribution characteristics of the target in the field of view, and a target can be determined with a confidence level that is greater than 0.5 and more accurately. DPAC can assign different target occurrence probability weights to different regions according to target distribution. Adding the DPAC function to a YOLOv4 network model on the basis of having the target confidence of the YOLOv4 network can reduce or improve confidence according to the target distribution and can then output the final confidence level. Using YOLOv4 + DPAC on the brainwash dataset can improve precision by 0.05% compared to the YOLOv4 model when the target confidence threshold is equal to 0.5; it can improve the recall of the model by 0.12% and the AP of the model by 0.12%. This paper also proposes that the distribution in the DPAC function be obtained based on unsupervised learning and verifies its effectiveness.
1. Introduction
Recently, the recognition and analysis of images based on computer vision technology has attracted much attention and is being applied in various industries. The performance improvement of various processors and the development of deep neural networks have resulted in great progress being made in image recognition technology. Diverse sources of information on people and location, such as passenger flow statistics at schools, stations, piers, airports, and other public places, are needed for a number of applications. In school contexts, for example, students’ in- and out-of-school statistics, class student attendance statistics, and concentration statistics [1] can assist teaching management.
Sometimes, large numbers of people gather in in stations, wharves, airports, scenic spots, and other public places, making these areas prone to traffic jams and even safety accidents. Around the world, death and injury events often occur due to people gathering. For example, on 29 September 2017, a stampede accident occurred at the Elphinstone railway station in Mumbai, India, resulting in at least 22 deaths and five serious injuries [2]. In the early morning of 30 April 2021, a stampede occurred at a rally in northern Israel. The accident has killed at least 45 people [3]. Currently, many places have not yet set up automatic personnel counting systems, and the number of people in an area is often counted by the security staff, so the data cannot be calculated and communicated efficiently and cannot effectively prevent accidents in advance.
At present, when using target detection systems to detect the number of people, real-time speed can be reached through the improvement of hardware and algorithms, but the detection accuracy of systems needs to continue to improve. If there is a large negative deviation in people statistics, it will lead to low resource utilization efficiency. Conversely, if there is a large positive deviation, it will still lead to an excessive concentration of people and safety accidents. Higher accuracy levels result in better and more accurate auxiliary strategies being obtained. In this paper, a people counting system based on deep learning is implemented to detect the number of human heads so that the number of people can be obtained in real time. In this way, the method can realize auxiliary traffic control and reduce safety accidents caused by too many people.
Typical representatives of traditional algorithms include the Haar feature [4], the AdaBoost algorithm [5], the HOG feature [6], SVM algorithms [7], and the DPM algorithm [8], among others. Traditional target-detection methods not only require complex calculations and have low efficiency, but they also cannot adapt well to various feature changes. In recent years, as a research hotspot of computer vision, target detection technology has made great breakthroughs in target detection algorithms. The limitations of target detection methods based on traditional machine learning are becoming more and more obvious. Therefore, as deep learning continues to develop [9], target detection algorithms based on deep learning continue to emerge, and their detection effects are also greatly improved compared to traditional methods.
Classical convolutional neural network models include the LeNet model proposed by Yann Lecun et al. [10], the AlexNet model proposed by Krizhevsky et al. [11], the GoogleLeNet model proposed by Christian Szegedy et al. [12], the VGG model proposed by Simonyan et al. [13], and the Resnet model proposed by Kaiming He et al. [14]. SSD was proposed by Wei Liu during ECCV 2016 [15]. R. Girshick et al. proposed a two-stage model that included R-CNN [16], fast R-CNN [17], and faster R-CNN [18]. YOLO [19,20] is another framework that has been proposed to solve the problem of target detection speed after the implementation of faster R-CNN. The author of the YOLO series (v1–v3) is Joe Redmon. YOLO does not display the process of obtaining the region proposal compared to the “two stage” object category and object position of the R-CNN series because YOLO is unified into a regression problem and only needs one look.
In April 2019, Alexey Bochkovskiy published a paper entitled “YOLOv4: Optimal Speed and Accuracy of Object Detection” [21]. The paper stated that YOLOv4 enables the use of a 1080 Ti or 2080 Ti GPU to train networks that are high-speed and that have a high target accuracy. YOLOv4 is a major update of the YOLO series, with an AP of 43.5% on the MS COCO dataset and a speed of 65 FPS. AP and FPS have been improved by 10% and 12%, respectively, and these improvements have been officially recognized by Joseph Redmon. It is considered to be one of the strongest real-time object detection models at present.
On 25 June 2019, ultralytics released the first official version of YOLOv5 [22], which performs similarly to YOLOv4 and is also the most advanced object detection technology today. In 2020, a transformer was applied for target detection, which improved the detection and training speed but has the disadvantage of generally requiring a large number of data sets to achieve training purposes.
All of the target detection methods listed above can be used to detect and to determine the statistics of a group of people. This study only detected the target category of heads. Several specific head detection methods are introduced below. Zhang Kai Sheng and Xie Dai Sheng use embedded Linux and OpenCV to build recognition systems for software and hardware. This is a feature-based recognition method [23]. Zhou Zhengkuan et al. proposed a method that could be used to recognize the number of people against a background by using an algorithm to determine the number of people based on Bayesian classification [24]. Xu Yisen et al. used the YOLOv3 network to detect the number of workers present during elevator construction and solve the overload problem during elevator construction [25]. Wang Ya proposed a head detection algorithm that combines a convolutional neural network and specific cyclic network called the YOLO-OFLSTM network [26]. De Yi optimized the YOLO algorithm to solve poor detection effect problems under conditions of insufficient illumination in the daytime and in conditions in which there is no light at night [27].
YOLOv4 is now one of the best representatives in the field of target detection [4]. It is better than the previous version, but it does not consider the distribution of the targets on the picture according to the background of the picture. Instead, it weakens the effect of the background through mosaic and other cutting techniques. Therefore, this paper proposes that the distribution be obtained through unsupervised learning and that the distribution then be used to adjust the confidence to optimize the yolov4 detection model.
In practice, a confidence level greater than 0.5 is usually considered a right target [28]. For detection, a confidence level greater than 0.5 may be a false-positive (FP) target, and a confidence less than 0.5 may be a true-positive (TP) target in some cases. In order to give consideration to a better detection rate and higher precision, DPAC is added, and by adjusting its parameters, the detection rate of the network can be improved with little or no losses in precision, thus improving overall defection performance when confidence is greater than 0.5.
Section 2 describes the study environment, experimental dataset, detection networks, and DPAC function and obtains the distribution by unsupervised learning. The preliminary experimental and DPAC experimental design are described in Section 3, and test results and experimental analyses are carried out in Section 4. Finally, Section 5 contains a discussion of the findings, and Section 6 shares the conclusions of this paper.
2. Methodology
2.1. Experimental Environment
The experimental hardware and software environment running in this paper are shown in Table 1. The following configuration can support the development, training, and testing carried out in this experiment.

Table 1.
Experimental environment configuration.
2.2. Dataset
The brainwash image set used in the experiment includes 6251 training images in JPG format, 695 validation images, and 482 test images, as shown in Table 2.
Table 2.
Brainwash dataset used in the experiment.
2.3. Detection Network
Compared to the faster R-CNN algorithm and SSD algorithm, the YOLO algorithm is a pure regression network, and the process of the whole algorithm is relatively simple. The overall detection speed of the YOLO algorithm is very fast, making it suitable for real-time detection tasks. YOLOv4 [21] uses a number of tricks to improve the network, and these tricks have greatly improved the detection accuracy compared to the previous version. The structure of YOLOv4 is shown in the Formula (1), and its network backbone uses CSPDarknet53; its neck uses SPP and PAN; and its head uses YOLOv3 [29].
Figure 1 shows a structural diagram of YOLOv4. The left side contains CSPDarknet53 and SPP, in which CSPDarknet53 realizes CSP in layers 5 and 6, which improves the speed. PANet is in the middle, and the head of YOLOv3 is on the right.
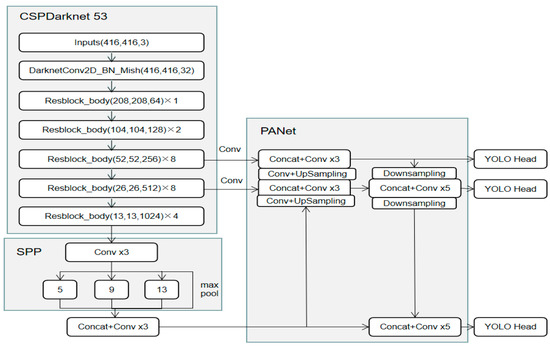
Figure 1.
Structure of YOLOv4.
In order to reduce the requirements of the computing resources, 416 × 416 was adopted as the input size. A feature map with a depth of 32 was obtained after one CBM (conv + BN + mish).
There are five layers of CSP modules in CSPDarknet53. Compared to the input, the size of the output feature map of each CSP module is halved, and the number of output channels is doubled. A Res unit is used in each CSP module to create a deeper network construction. The advantages of the CSP module include the CNN network having an enhanced learning ability, the model being lighter, the accuracy of the model being retained, reduced computational bottleneck of the whole model, and the algorithm having reduced memory costs.
SPP (spatial pyramid) can fuse multiple dimensional features together, and it can improve the AP with only a small additional computational cost. The input feature map passes through three max pool cores with a stripe of 1 and with sizes of 5, 9, and 13 to obtain the output feature map. Using padding ensures that the size of the output feature map is consistent with the input.
PANet is an enhanced version of FPN. The FPN layer can capture strong semantic features from top to bottom, whereas PAN conveys strong positioning features from bottom to top and increases the representation ability of the model by fusing the two paths: bottom to top and top to bottom. In this way, the target positioning function can be completed.
Yolov4 improves the boundary box regression loss function. CIoUloss adds an influencing factor on the basis of DIoUloss by taking into account the aspect ratio of the prediction frame and GT frame. That is, CIoUloss takes the overlapping area of the GT frame, the distance between the center points, and the scale information of the width to height ratio of the boundary frame into account, more than IoULoss, GIoULoss. DIoULoss considered these factors more comprehensively.
2.4. Distribution Probability Adjustment Confidence
There is a predicted confidence index in the target detection results, which is the confidence level calculated and predicted by the model. The overall precision of the target detected on an image is high when the detection system chooses to use a high confidence threshold, but recall will decline. However, if a smaller confidence threshold is selected, the overall precision of the target detected on the image will decrease, and recall will increase. In practice, we often use the confidence level of 0.5 as the threshold to judge whether it is the right detection target [18]. The function of DPAC is to improve recall and AP without losing or losing small amounts of precision.
DPAC usage method: First, obtain a matrix A [w × h] that is the same size as the pixels in the original image through target distribution. Second, convert the distribution value in the distribution matrix into the target probability coefficient. Third, use only the predicted target center point multiplied by the coefficient of the corresponding position in the matrix during detection. This method is not very computationally intensive compared to image processing methods and requires little effort during original system detection.
2.4.1. DPAC Function
The DPAC function is equivalent to Formula (2). The a0, a1, … an+1 of the function are the confidence adjustment coefficients; r0, r1, … rn+1 are the range of distribution quantities. As there is no target in the regional distribution, x = 0, the function output is a0. When x > 0 and x < r1, the function output is from a1 to an. Set the domain of the definition (r0, r1, … rn+1) of the DPAC function according to the distribution gradient and experience after obtaining the target distribution. If the highest point is H, (r0, r1, … rn+1) can be set as (b0 × H, b1 × H, … bn+1 × H), where b0 < b1 < ... < bn+1, and b0, b1, ... bn+1 ∈ [0,1). After the DPAC function definition domains (r0, r1, … rn+1) are determined, the initial values of the adjustment coefficients (a0, a1, ... an+1) are set according to the value range and experience of the domain of definition. In general, the regions with small r(i) or a large amount of interference require more strict review, and the adjustment coefficient should less than 1, and adjustment coefficients greater than 1 can be used in other regions. After repeated experiments and adjustments, the network can be optimized. Formula (2) is a structural example. The specific value of this function can be adjusted according to the actual situation to achieve optimal model output.
2.4.2. Obtain Distribution by Unsupervised Learning
When the training model is applied to the new environment, if the new target is marked again, and if the target distribution is counted again, then the workload is too large. If unsupervised learning is used to obtain the relevant characteristics, the workload will be greatly reduced. The images can be extracted from the video stream taken from the camera according to the time interval, and the image target can then be detected through a detection network. A high confidence threshold can be adopted to ensure the precision of the target. When the sample is large, an accurate target distribution can be obtained. Therefore, this paper proposes that when the scene is changed and the sample is not marked, the model can adjust the DPAC distribution matrix through unsupervised self-learning to make it automatically adapt to the new scene.
3. Experiment
3.1. Preliminary Experiment
3.1.1. Obtain Target Distribution
Figure 2 has an image of size 640 × 480 in the brainwash dataset. It can be seen that the upper and lower borders are unreachable, and in the middle right is a counter, where the probability of people appearing is relatively low. People are more likely to appear in the area of image in which there are chairs and sofas.
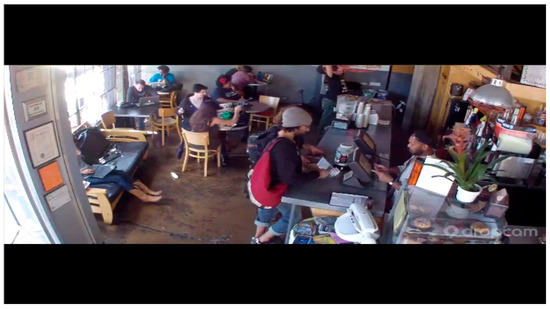
Figure 2.
An image in brainwash dataset.
The target location description format in the brainwash dataset label is “x1, y1, x2, y2”, where (x1, y1) is the upper left corner coordinate of the target, and (x2, y2) is the lower right corner coordinate of the target.
Calculate each group of data in the label set, and obtain all of the marked target center points of the training set and validation set. The coordinate of the i-th target center point is , and Formulas (3) and (4) are coordinate-obtaining formulas.
Count the lengths of the boxes and widths of all of the marked targets, and then calculate half of the average length and width as r, as shown in Formula (5).
The coordinates of the center point are mapped to the two-dimensional matrix A of 640 × 480. The structure of matrix A is shown in Figure 3. The position of the center point is made into a square with 2r as the side length, and 1 is added to the area in the square when there is a marked box center in the point. At the same time, when the distance between the center point and the image boundary is less than r, it is considered to prevent overflow from the range of matrix A [640 × 480].
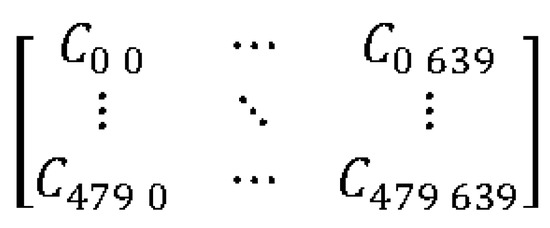
Figure 3.
Distribution Matrix.
According to the coordinate distribution statistics of the target center point, we can determine the figure distribution. In order to see that the statistical distribution conforms more to the layout of this scene, the gray-scale image in Figure 4 was obtained by compressing the depth. Bright areas indicate the high probability of a head appearing, and dark areas indicate the low probability of a head appearing.
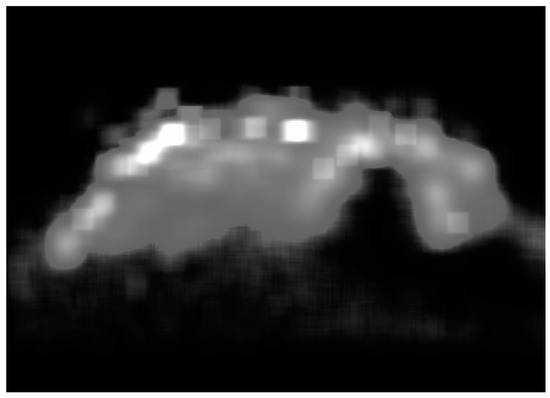
Figure 4.
Two-dimensional distribution diagram.
3.1.2. Unsupervised Learning Computing Distribution Experiment
This experiment was conducted to verify the difference between the distribution obtained through unsupervised learning and the actual distribution. The experiment was conducted using 6946 images. First, 81,950 pieces of target coordinate data were marked, and the distribution matrix was calculated according to the method in Section 3.1.1. For better visibility, the matrix was converted into three-dimensional graphics, as shown in Figure 5a. Second, the YOLOv4 model was used to detect the targets in the image set with a confidence level greater than 0.9, and the coordinates of 41,953 targets were detected. The unsupervised learning distribution matrix was calculated according to the method in Section 3.1.1. In order to facilitate the comparison, the coefficient multiplied by 81,950/41,953 was converted into a three-dimensional graph, as shown in Figure 5b. According to the comparison of Figure 5a,b, the distribution is similar, which proves the effectiveness of unsupervised learning distribution.
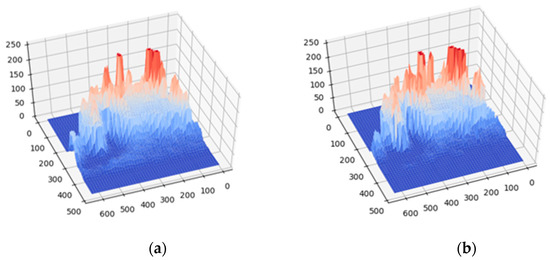
Figure 5.
Three-dimensional distribution diagram: (a) label calculation distribution; (b) unsupervised learning acquisition distribution.
Using unsupervised learning distribution characteristics in DPAC:
- (a)
- When using unsupervised learning to compute the distribution, DPAC was not added in the early stage. After running for a period of time determined according to the distribution obtained by unsupervised learning, add DPAC into the network. In this way, the normal target recognition will not be affected and interrupted when calculating the video distribution.
- (b)
- In order to eliminate and reduce the effects of FP on the distribution, we can use a target with a large confidence threshold that can be adopted as the distribution data.
- (c)
- Distribution statistics can be performed at any time to update existing DPAC parameters as needed due to changes in the angle, environment, or location.
3.1.3. Obtain the Adjustment Matrix
Obtain the distribution matrix and plot it according to the calculation method in Section 3.1.1. The elements of the adjustment matrix B are composed of the range of the DPAC function, and the elements of the distribution matrix A are the domain of the definition of the DPAC function, as seen in Formula (6). Figure 6 is an adjustment matrix, and each element of it is a confidence adjustment coefficient.
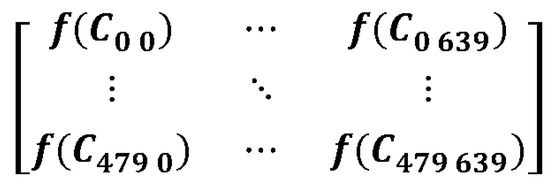
Figure 6.
Adjustment Matrix.
3.1.4. Confidence Adjustment
An example of adjusting detection target confidence:
- (a)
- The format of the i-th target output detected after the image passes through the YOLO detection network is category, confidence C, and location coordinates (left, top, right, and bottom).
- (b)
- Obtain the coordinates of the target center point according to Formulas (3) and (4): .
- (c)
- The value in the distribution matrix of Figure 3 corresponds to the target center point: .
- (d)
- The value in the adjustment matrix of Figure 6 corresponds to the target center point: .
- (e)
- According to Formula (2), if > ri−1 and < ri, then = ai.
- (d)
- The new confidence value is Cnew = C × ai.
The confidence adjustment code is shown in Figure 7. Line 2 and line 3 obtain the center point coordinates of the prediction box, and line 4 obtains the position of the center point corresponding to the adjustment matrix and is to read the adjustment matrix in the form of a one-dimensional array. Line 5 adjusts the confidence, and line 8 records the category and adjusts the confidence and box coordinates in the file.
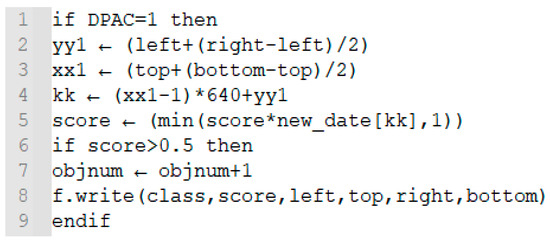
Figure 7.
Confidence adjustment code.
3.2. YOLOv4 Network Training
- (a)
- Before YOLOv4 network training, configure the training data label set, data image set, weight, and other files. The label file contains the location of the training set image and the target distribution in the image. The class file contains training target categories, and only one category for head recognition was used in this experiment. The weight file adopts “yolo4_weight.h5”, and the weight of the original model can also be considered as a kind of transfer learning.
- (b)
- Start training and obtain the model parameters:
- Total params: 64,003,990;
- Trainable params: 63,937,686;
- Non-trainable params: 66,304.
- (c)
- Obtain the training results.
Loss continues to decline during training, and the weight file “head.h” is obtained after training, when loss no longer declines significantly.
Table 3 show our experimental results and the results of other research. The experiments based on ReInspect [30], Opt(k-means) [31], and YOLO-OFLSTM [26], and were all conducted using the “brainwash” dataset. The AP of out experimental results is higher than that of other experimental results.
Table 3.
Experimental results.
3.3. DPAC Experimental Design
DPAC distribution calculation experiments and YOLOv4 model training have been completed before. Now, we compare the test accuracy and speed when the confidence = 0.5. The DPAC experiments were designed and carried out as shown in Table 4. The DPAC adjustment matrix varies according to the value of the DPAC function. According to Formula (2), the distribution density can be divided into several levels: very low, low, high, and very high. Experiments were designed according to these DPAC characteristics:
DPAC (a): Reduce the confidence when the target distribution is very low, and increase the confidence in other areas.
DPAC (b): When the target distribution is very low, the confidence is reduced, the confidence is increased in the areas with low and high distribution, and the confidence is reduced in the areas with very high distribution.
DPAC (c): When the target distribution is very low, the confidence is reduced; the confidence is increased in areas with low and high distribution; and the confidence is increased or decreased in areas with very high distribution according to the detection number.
Table 4.
Design of the DPAC experiments.
Table 4.
Design of the DPAC experiments.
| Model | DPAC |
|---|---|
| YOLOv4 | None |
| DPAC (a) | |
| DPAC (b) | |
| DPAC (c) |
4. Results
4.1. YOLOv4 + DPAC Test Results
We determined the influence of different DPAC functions on the model. When the confidence was greater than 0.5, the following groups of results were obtained when different DPAC values were adopted.
The DPAC function of the experiment is shown in Formulas (7)–(9). The ƒ1(x) function simply reduces the confidence of the low possibility area and increases the confidence of the high possibility area. ƒ2(x) reduces the confidence in areas with a density higher than 1100 based on the ƒ1(x) function. The ƒ3(x) function adds a threshold value ρ of the target number on a single graph on the basis of ƒ2(x). For areas with a density greater than 1100, judge again according to whether the number of targets predicted in the image exceeds the density threshold .
Detailed results are shown in Table 5. The experimental results show that the AP of the model has been improved after DPAC. The improvement index of the experimental results when DPAC takes a different value is slightly different.
Table 5.
Experimental confidence results are 0.5, and DPAC function is different.
When the DPAC function is ƒ1(x), the results show that recall and AP are improved and that the precision is decreased. This indicates that more FP is formed when the DPAC function is simply up-regulated, which is similar to the results directly improving the confidence of all of the prediction targets in order to obtain a greater detection rate with a loss of precision.
When the DPAC function is ƒ2(x), the evaluation index parameters precision, recall, and the AP of the detection network are slightly higher than without DPAC.
When the DPAC function is ƒ3(x), the evaluation index parameters precision, recall, and the AP of the detection network are further improved than when ƒ2(x) is used. Compared to not using DPAC, the precision is improved by 0.05%, recall is improved by 0.12%, and AP is improved by 0.12%.
The experiments show that the correct use of DPAC can improve the network detection performance of YOLOv4.
The speed test results are shown in Table 6. Three speed tests were carried out without DPAC on the test set, achieving an average speed of 4.3 FPS. Three speed tests were carried out with DPAC on the test set, achieving an average speed of 4.28 FPS. The speed difference was less than 0.5%, indicating that DPAC has basically no effect on speed.
Table 6.
Speed comparison results.
4.2. Analysis of Experimental Examples
The YOLO v4 model was used to analyze the images when DPAC was enabled and disabled. Figure 8 contains two original images from the brainwash dataset. There are 18 people in Figure 8a and 16 people in Figure 8b. The yellow boxes in the images are marks for easy comparison.
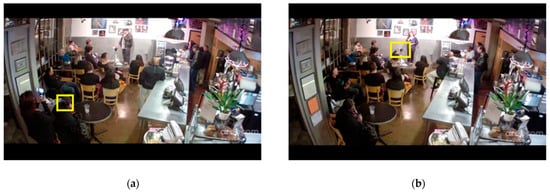
Figure 8.
Original drawing of brainwash dataset: (a) test image with 18 people; (b) test image with 16 people.
The confidence threshold was set to be higher than 0.5. The image detection results obtained when DPAC was not used are shown in Figure 9. There are 17 heads detected in Figure 9a, with a precision rate of 100% and recall rate of 94.4%, and there are 17 heads detected in Figure 9b, with a precision rate of 94.1% and a recall rate of 100%.
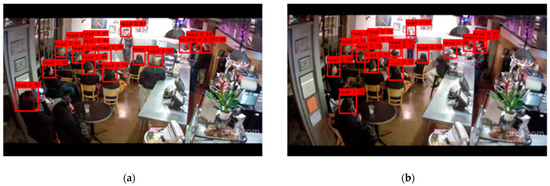
Figure 9.
Test results without DPAC: (a) Detection results with DPAC with 18 people; (b) detection result without DPAC with 16 people.
Figure 10 shows the detection results when the confidence threshold was set greater than 0.5 and DPAC was used to analyze the images.
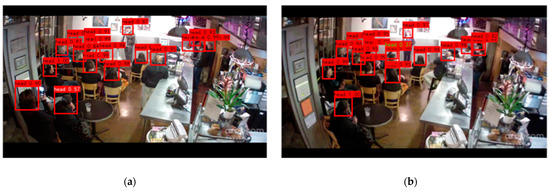
Figure 10.
Test results with DPAC: (a) detection result with DPAC with 18 people; (b) detection result without DPAC with 16 people.
One TP detection target was added in Figure 10a, the label of which is white. There are 18 heads detected in Figure 10a, and compared to Figure 9a, the precision remains unchanged, and the recall rate is increased by 5.6%.
One FP detection target is reduced in Figure 10b, the label of which is green. There are 16 heads detected in Figure 10b, and compared to Figure 9a, the recall remains unchanged, and the precision is increased by 5.9%.
The experiments show that detection performance is improved by increasing TP and reducing FP through DPAC.
5. Discussion
In the fields of transportation, education, and commerce, among others, there is a great demand for to know the flow statistics of people to assist in decision making, but conventional population statistics adopts the gate method, which involves people being counted once after they access the gate. This method is not only inefficient, but it also makes the detected people feel uncomfortable. Therefore, contactless statistics detection to determine the number of people in a space based on images is the direction of future development. Although there are many requirements for application scenarios, human number detection, which is based on images, is not widely used at present. The reason for this is that its detection recall and precision rates cannot meet people’s needs. Therefore, improving the speed, detection recall, and detection precision of target detection system is the focus of current research on this topic. The YOLOv4 network is one of the best detection networks at present and can not only achieve real-time detection speed, but also has a high level of accuracy. Therefore, in this study, we chose to use the YOLOv4 network plus DPAC for the experiments and used the brainwash dataset as the head detection dataset.
First, we propose using DPAC to optimize the detection network, which is composed of target distribution and the DPAC function. There are two ways to obtain the DPAC distribution: one is to calculate the distribution from the target label, and the other is through unsupervised learning, which can solve the problem of it being difficult to make the target label. The two distributions are compared through experiments, and the distribution obtained by the two methods is similar. After obtaining the distribution matrix, the DPAC adjustment matrix can be obtained by multiplying the DPAC function.
Secondly, we used the brainwash dataset to train the network and to obtain the network model. Several DPAC functions were designed according to the characteristics of the distribution, and experiments were then carried out with the different DPAC functions using the trained YOLOv4 model. Some rules were followed during the experiments:
- (a)
- DPAC can describe the distribution as being very low, low, high, and very high.
- (b)
- When the distribution is very low, multiply it by a factor less than one.
- (c)
- When the probability distribution is low, it indicates that the density in this area is low, that the target overlaps, and that the possibility of occlusion is small, so multiply it by a factor greater than one.
- (d)
- When the distribution probability is high, it indicates that the target in this area is highly likely to appear, so multiply it by a coefficient greater than 1.
- (e)
- When the distribution probability is very high, it is easier for high-density target groups to appear in this area. When the high-density target groups overlap, the possibility of occlusion is large, and there are more interference factors. Therefore, multiplying by a coefficient less than 1 is helpful to reduce FP. However, when the number of predictions obtained on the detected image is relatively small, it can be considered that there is no high-density target area on the image. These regions are similar to regions with a high probability distribution, meaning that they can be multiplied by a coefficient greater than one.
In this paper, a network structure using YOLOv4 + DPAC is proposed, and experiments on brainwash datasets show that this network has more advantages than the previously established ReInspect, Opt (K-means), YOLO-OFLSTM, and pure YOLOv4 networks. This research has an optimization function that is implemented during target detection, in which the background environment changes infrequently and solves the problem of the target detection network, ignoring the detection background. An unsupervised learning acquisition distribution is proposed, and the adaptability to the background environment is also solved. Some of the rules of the distributed regulation system were obtained through experiments, and these can be used as a reference for regulation coefficient selection.
The experiment was only carried out on four possibility ranges that had very low, low, high, and very high distribution, and the system was optimized. However, the number of adjustment gears is not limited to four ranges, and adjustments will be more precise if there are more number ranges. Additionally, the network detection speed will not be affected.
6. Conclusions
In this paper, research to determine personnel statistics based on a YOLOv4 + DPAC network was carried out. Further studies are needed to improve the network performance of YOLOv4 + DPAC to better meet people’s needs.
The distribution in DPAC can be obtained according to the target distribution of the real scene, but if each scene is marked manually, the workload will be too large and will be difficult to update. Therefore, this paper proposes an unsupervised learning method to automatically obtain the distribution and that can automatically update the distribution.
This paper improves network performance using DPAC. In the brainwash test set experiment presented in this paper, the precision was improved from 94.69% to 94.70% when the confidence was greater than 0.5, an increase of 0.01%. The recall rate increased from 85.49% to 85.61%, an increase of 0.12%. AP increased from 84.44% to 84.56%, an increase of 0.12%, and it hardly affected the detection speed.
The lower the fitting degree of the model to the scene and the less the background is considered, the more obvious the DPAC effect is. DPAC is very flexible, and the function parameters can be adjusted as needed to achieve system optimization. Although this research is based on head detection, it can also be applied to other categories of target detection as long as the target follows the distribution law in the camera angle being viewed.
In the future, the parameter regulation law of the DPAC function in the YOLOv4 + DPAC network will be further studied to improve its regulation efficiency and performance. Future research will also attempt to combine DPAC with other target detection networks and to study the function parameter adjustment law of other networks + DPAC.
Author Contributions
Conceptualization, W.C.; methodology, W.C. and G.W.; formal analysis, W.C.; writing—original draft, W.C.; supervision, H.J. All authors have read and agreed to the published version of the manuscript.
Funding
This research was supported by the MIST (Ministry of Science and ICT), Korea, under the Innovative Human Resource Development for Local Intellectualization support program (IITP-2022-RS-2022-00156334), supervised by the IITP (Institute for Information and Communications Technology Planning and Evaluation).
Institutional Review Board Statement
Not applicable.
Informed Consent Statement
Not applicable.
Data Availability Statement
Not applicable.
Acknowledgments
The authors also greatly appreciate the anonymous reviewers and academic editor for their careful comments and valuable suggestions to improve the manuscript.
Conflicts of Interest
The authors declare no conflict of interest.
References
- Zhong, K. Research on Students’ Interest in Classroom Based on Video. Master’ Thesis, Hainan Normal University, Haikou, China, 2021. [Google Scholar]
- Mumbai Stampede. Available online: https://news.cgtn.com/news/7a59444e78597a6333566d54/index.html (accessed on 29 September 2017).
- Israeli Stampede. Available online: https://newsus.cgtn.com/news/2021-05-01/Investigation-underway-into-causes-of-Israeli-stampede-that-killed-45-ZTsVGgwDuw/index.html (accessed on 1 May 2021).
- Lienhart, R.; Maydt, J. An extended set of haar-like features for rapid object detection. In Proceedings of the International Conference on Image Processing, Rochester, NY, USA, 22–25 September 2002; pp. 1–4. [Google Scholar]
- Cao, Y.; Miao, Q.; Liu, J.; Gao, L. Research progress and prospect of Adaboost algorithm. J. Autom 2013, 17, 342–351. [Google Scholar]
- He, K.; Sun, J.; Tang, X. Single image haze removal using dark channel prior. IEEE Trans. Pattern Anal. Mach. Intell. 2010, 33, 2341–2353. [Google Scholar] [PubMed]
- Ahmad, A.S.; Hassan, M.Y.; Abdullah, M.P.; Rahman, H.A.; Hussin, F.; Abdullah, H.; Saidur, R. A review on applications of ANN and SVM for building electrical energy consumption forecasting. Renew. Sustain. Energy Rev. 2014, 33, 102–109. [Google Scholar] [CrossRef]
- Felzenszwalb, P.F.; Girshick, R.B.; McAllester, D.; Ramanan, D. Object detection with discriminatively trained part-based models. IEEE Trans. Pattern Anal. Mach. Intell. 2010, 32, 1627–1645. [Google Scholar] [CrossRef] [PubMed]
- Hinton, G.E.; Osindero, S.; Teh, Y.-W. A fast learning algorithm for deep belief nets. Neural Comput. 2006, 18, 1527–1554. [Google Scholar] [CrossRef] [PubMed]
- LeCun, Y.; Bottou, L.; Bengio, Y.; Haffner, P. Gradient-based learning applied to document recognition. Proc. IEEE 1998, 86, 2278–2324. [Google Scholar] [CrossRef]
- Krizhevsky, A.; Sutskever, I.; Hinton, G.E. Imagenet classification with deep convolutional neural networks. Adv. Neural Inf. Processing Syst. 2012, 1, 1097–1105. [Google Scholar] [CrossRef]
- Szegedy, C.; Liu, W.; Jia, Y.; Sermanet, P.; Reed, S.; Anguelov, D.; Erhan, D.; Vanhoucke, V.; Rabinovich, A. Going deeper with convolutions. In Proceedings of the IEEE Conference on Computer Vision and Pattern Recognition, Boston, MA, USA, 7–12 June 2015; pp. 1–9. [Google Scholar]
- Simonyan, K.; Zisserman, A. Very deep convolutional networks for large-scale image recognition. arXiv 2015, arXiv:1409.1556. [Google Scholar]
- He, K.; Zhang, X.; Ren, S.; Sun, J. Deep residual learning for image recognition. In Proceedings of the IEEE Conference on Computer Vision and Pattern Recognition, Las Vegas, NV, USA, 27–30 June 2016; pp. 770–778. [Google Scholar]
- Liu, W.; Anguelov, D.; Erhan, D.; Szegedy, C.; Reed, S.; Fu, C.-Y.; Berg, A.C. Ssd: Single shot multibox detector. In Proceedings of the European Conference on Computer Vision, Amsterdam, The Netherlands, 8–16 October 2016; pp. 21–37. [Google Scholar]
- Girshick, R.; Donahue, J.; Darrell, T.; Malik, J. Rich feature hierarchies for accurate object detection and semantic segmentation. In Proceedings of the IEEE Conference on Computer Vision and Pattern Recognition, Columbus, OH, USA, 23–28 June 2014; pp. 580–587. [Google Scholar]
- Girshick, R. Fast r-cnn. In Proceedings of the IEEE International Conference on Computer Vision, Santiago, Chile, 7–13 December 2015; pp. 1440–1448. [Google Scholar]
- Ren, S.; He, K.; Girshick, R.; Sun, J. Faster r-cnn: Towards real-time object detection with region proposal networks. Adv. Neural Inf. Processing Syst. 2015, 39, 1137–1149. [Google Scholar] [CrossRef] [PubMed] [Green Version]
- Redmon, J.; Divvala, S.; Girshick, R.; Farhadi, A. You only look once: Unified, real-time object detection. In Proceedings of the IEEE Conference on Computer Vision and Pattern Recognition, Las Vegas, NV, USA, 27–30 June 2016; pp. 779–788. [Google Scholar]
- Lu, L.; Hu, C.; Hongtai, Z.; Nianshu, D. Progress of Research and Application of Object Detection Based on Deep Learning. Electron. Packag. 2022, 22, 1–9. [Google Scholar]
- Bochkovskiy, A.; Wang, C.; Liao, H.M. YOLOv4: Optimal Speed and Accuracy of Object Detection. arXiv 2020, arXiv:2004.10934. [Google Scholar]
- YOLOv5 Object Detection Architecture and Model. Available online: https://github.com/ultralytics/yolov5 (accessed on 13 December 2020).
- Zhang, K.; Xie, D. Research on Detection and Statistical System of Number of People in Classroom based on Linux and OpenCV. Comput. Knowl. Technol. 2016, 12, 187–191. [Google Scholar]
- Zhou, Z.; Tian, X.; Lingling, H.E.; Ren, J. Research on People Counting Recognition Algorithms Based on Bayesian Classi-fication. J. Beijing Inst. Petrochem. Technol. 2019, 27, 47–53. [Google Scholar]
- Xu, Y.; Zhang, J.; Wang, R.; Guan, J.; Xu, C. Statistical Method of Number in Construction Elevator Based on Convolution Neural Network. Mod. Manuf. Technol. Equip. 2021, 57, 9–12. [Google Scholar]
- Wang, Y. The Research and Implementation of Head Detection in Complex Scenes Based on Deep Learning. Master’s Thesis, Huazhong University of Science & Technology, Wuhan, China, 2019. [Google Scholar]
- Yi, D. Research on Target Detection Optimization Algorithm Based on YOLO. Master’s Thesis, Nanjing University of Posts and Telecommunications, Nanjing, China, 2021. [Google Scholar]
- Chen, Y.; Jiao, L.; Cao, X. Video Stream Target Detection Algorithm Based on Time-correlation Correction of Confidence. Mod. Comput. 2021, 27, 21–26. [Google Scholar]
- Redmon, J.; Farhadi, A. YOLOv3: An Incremental Improvement. arXiv 2018, arXiv:1804.02767. [Google Scholar]
- Vora, A.; Chilaka, V. FCHD: Fast and accurate head detection in crowded scenes. arXiv 2019, arXiv:1809.08766v3. [Google Scholar]
- Zhong, Y.; Wang, J.; Peng, J.; Zhang, L. Anchor box optimization for object detection. In Proceedings of the IEEE/CVF Winter Conference on Applications of Computer Vision, Snowmass Village, CO, USA, 1–5 March 2020; pp. 1286–1294. [Google Scholar]
Publisher’s Note: MDPI stays neutral with regard to jurisdictional claims in published maps and institutional affiliations. |
© 2022 by the authors. Licensee MDPI, Basel, Switzerland. This article is an open access article distributed under the terms and conditions of the Creative Commons Attribution (CC BY) license (https://creativecommons.org/licenses/by/4.0/).