
Wind Turbine Anomaly Detection Using Mahalanobis Distance and SCADA Alarm Data


Abstract
:1. Introduction
1.1. Background of the Study
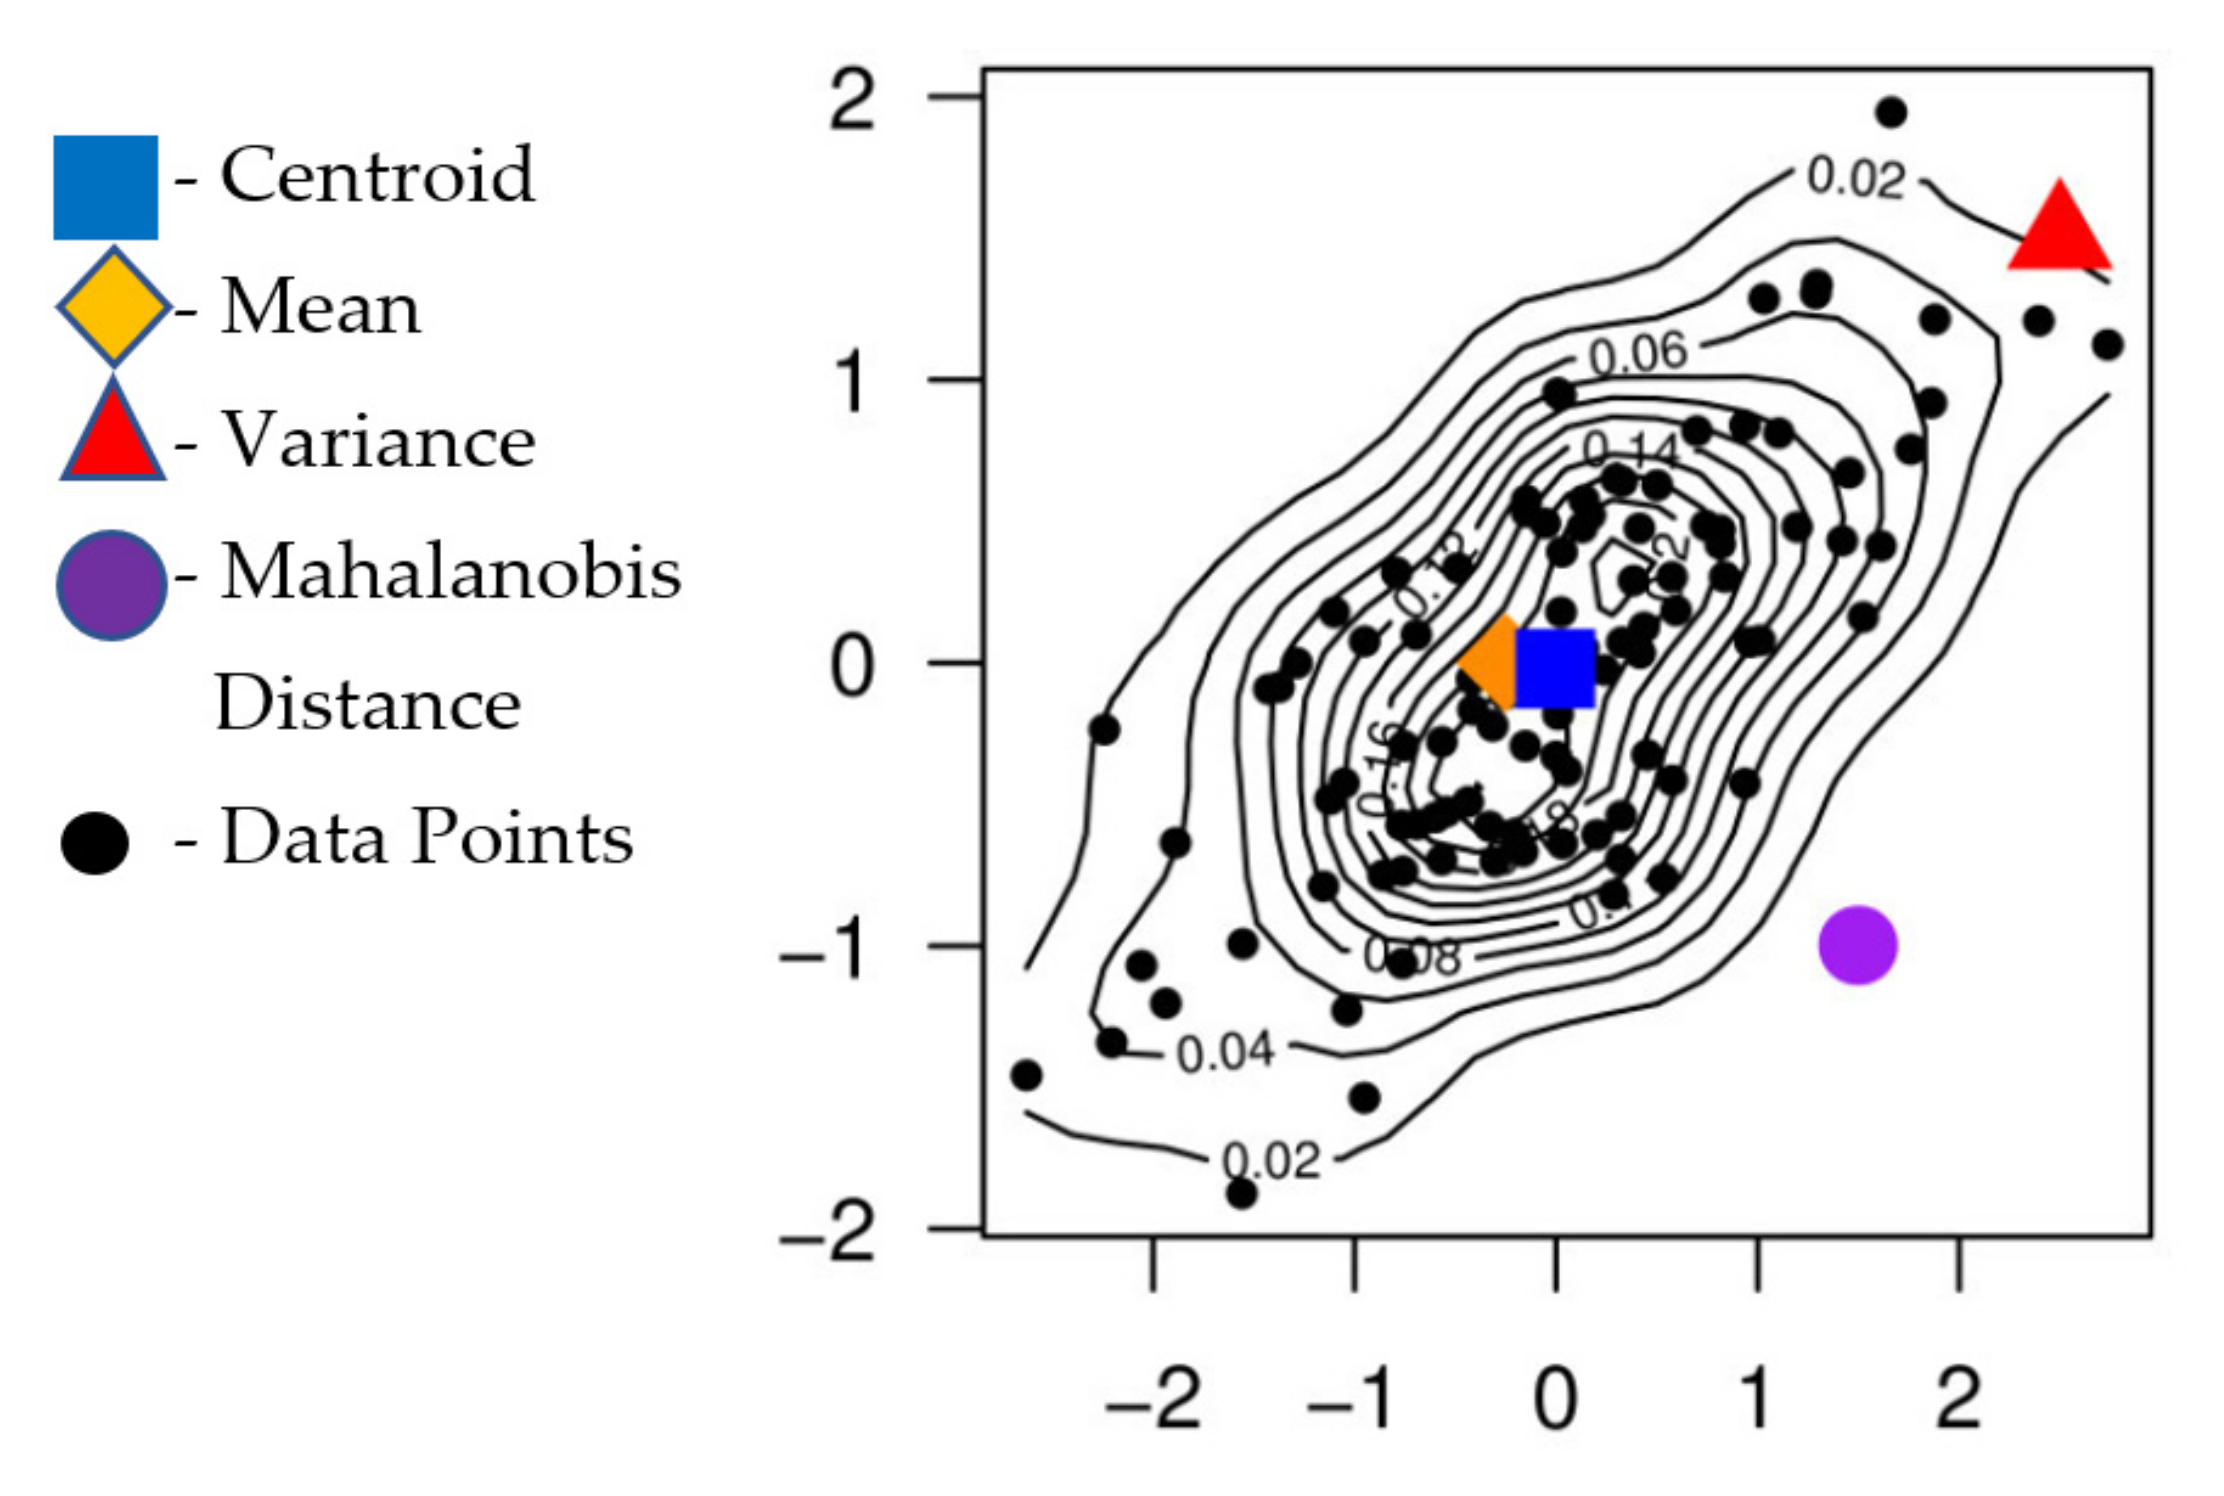
1.2. Mahalanobis Distance
1.3. Related Studies
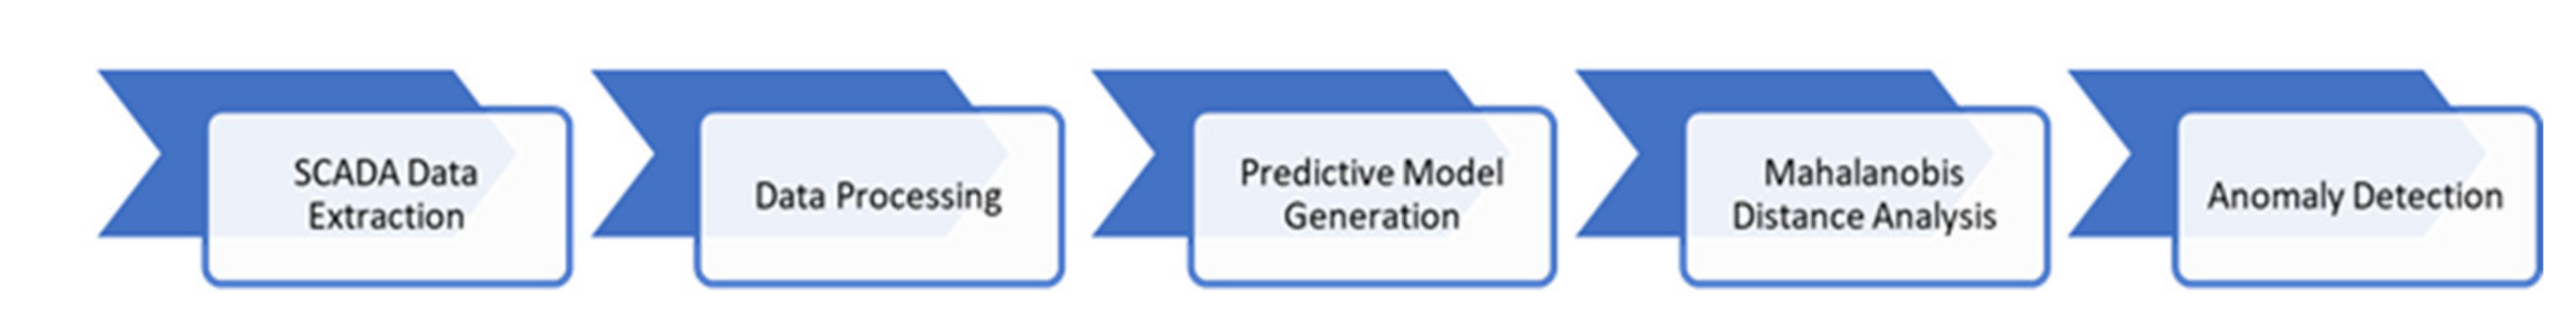
2. Materials and Methods
3. Results and Discussion
4. Conclusions
- The Mahalanobis distance approach can detect faulty behaviors of wind turbines at a high accuracy rate of 97%.
- The input and output parameters of the predictive models where the Mahalanobis distance approach is calculated are essential factors in determining the component affected by faulty behavior.
- In a data-driven monitoring system, the Mahalanobis distance approach can be used to further sustain and enhance the features of such a system.
- Integrate the proposed approach into the CMS of the wind turbine, and investigate its efficiency in the system.
- Improve the reliability of the Mahalanobis distance approach by creating variations in the duration averaging of the approach, and choose the optimum in the process.
- Integrate the Mahalanobis distance approach and the condition monitoring system into an automatic system environment to facilitate the recording of failure reports and further enhance productivity.
- Develop a predictive model for the MD method that can detect anomalies at early stages.
Author Contributions
Funding
Institutional Review Board Statement
Informed Consent Statement
Data Availability Statement
Acknowledgments
Conflicts of Interest
Abbreviations
| dMD | Mahalanobis distance |
| xa, xb | a pair of objects for the MD calculation |
| C | the sample covariance matrix |
| covariance of distribution | |
| xi, yi | data values of the distributions |
| mean value of x distributions | |
| B | model uncertainty |
| CMS | condition monitoring system |
| MD | Mahalanobis distance |
| SCADA | Supervisory Control and Data Acquisition system |
| Hxx (H01~H14) | represents the turbine number in the harbor area |
References
- Zhang, Y.; Zheng, H.; Liu, J.; Zhao, J.; Sun, P. An anomaly identification model for wind turbine state parameters. J. Clean. Prod. 2018, 195, 1214–1227. [Google Scholar] [CrossRef]
- Chen, L.; Xu, G.; Zhang, Q.; Zhang, X. Learning deep representation of imbalanced SCADA data for fault detection of wind turbines. Measurement 2019, 139, 370–379. [Google Scholar] [CrossRef]
- Pang, Y.; Jia, L.; Zhang, X.; Liu, Z.; Li, D. Design and implementation of automatic fault diagnosis system for wind turbine. Comput. Electr. Eng. 2020, 87, 106754. [Google Scholar] [CrossRef]
- Fang, R.; Wu, M.; Guo, X.; Shang, R.; Shao, P. Identifying early defects of wind turbine based on SCADA data and dynamical network marker. Renew. Energy 2020, 154, 625–635. [Google Scholar]
- Xiang, L.; Wang, P.; Yang, X.; Hu, A.; Su, H. Fault detection of wind turbine based on SCADA data analysis using CNN and LSTM with attention mechanism. Measurement 2021, 175, 109094. [Google Scholar] [CrossRef]
- Du, Y.; Zhou, S.; Jing, X.; Peng, Y.; Wu, H.; Kwok, N. Damage detection techniques for wind turbine blades: A review. Mech. Syst. Signal Process. 2019, 141, 106445. [Google Scholar] [CrossRef]
- Christensen, R. Advanced Linear Modeling: Statistical Learning and Dependent Data; Springer: Cham, Switzerland, 2019. [Google Scholar]
- Brereton, R.G.; Lloyd, G.R. Re-evaluating the role of the Mahalanobis distance measure. J. Chemom. 2016, 30, 134–143. [Google Scholar] [CrossRef]
- Hill, T.; Lewicki, P.; Lewicki, P. Statistics: Methods and Applications: A Comprehensive Reference for Science, Industry, and Data Mining; StatSoft Inc.: Street Tulsa, OK, USA, 2006. [Google Scholar]
- Gonzalez, E.; Tautz-Weinert, J.; Melero, J.J.; Watson, S.J. Statistical Evaluation of SCADA data for Wind Turbine Condition Monitoring and Farm Assessment. J. Phys. Conf. Ser. 2018, 1037, 032038. [Google Scholar] [CrossRef]
- Ji, H. Statistics Mahalanobis distance for incipient sensor fault detection and diagnosis. Chem. Eng. Sci. 2020, 230, 116233. [Google Scholar] [CrossRef]
- Leys, C.; Klein, O.; Dominicy, Y. Detecting multivariate outliers: Use a robust variant of the Mahalanobis distance. J. Exp. Soc. Psychol. 2017, 74, 150–156. [Google Scholar] [CrossRef]
- Yang, J.; Delpha, C. An incipient fault diagnosis methodology using local Mahalanobis distance: Detection process based on empirical probability density estimation. Signal Process. 2021, 190, 108308. [Google Scholar] [CrossRef]
- Chen, P.; Kan, L.; Song, X.; Wang, X.; Jiang, C. Application of VMD and Mahalanobis distance combination algorithm in TDLAS methane gas detection. Optik 2020, 228, 166114. [Google Scholar] [CrossRef]
- Liu, X.; Lu, S.; Ren, Y.; Wu, Z. Wind Turbine Anomaly Detection Based on SCADA Data Mining. Electronics 2020, 9, 751. [Google Scholar] [CrossRef]
- Zhang, C.; Hu, D.; Yang, T. Anomaly detection and diagnosis for wind turbines using long short-term memory-based stacked denoising autoencoders and XGBoost. Reliab. Eng. Syst. Saf. 2022, 222, 108445. [Google Scholar] [CrossRef]
- Castellani, F.; Garibaldi, L.; Daga, A.P.; Astolfi, D.; Natili, F. Diagnosis of Faulty Wind Turbine Bearings Using Tower Vibration Measurements. Energies 2020, 13, 1474. [Google Scholar] [CrossRef]
- McKinnon, C.; Carroll, J.; McDonald, A.; Koukoura, S.; Infield, D.; Soraghan, C. Comparison of new anomaly detection technique for wind turbine condition monitoring using gearbox SCADA data. Energies 2020, 13, 5152. [Google Scholar] [CrossRef]
- Long, X.; Li, S.; Wu, X.; Jin, Z. Wind Turbine Anomaly Identification Based on Improved Deep Belief Network with SCADA Data. Math. Probl. Eng. 2021, 2021, 8810045. [Google Scholar] [CrossRef]
- Rashid, K. Comparative Between the MEWMA and Mahalanobis Distance Control Chart. Kurd J. Appl. Res. 2021, 6, 94–104. [Google Scholar]
- Daroogheh, N.; Meskin, N.; Khorasani, K. An improved particle filtering-based approach for health prediction and prognosis of nonlinear systems. J. Frankl. Inst. 2018, 355, 3753–3794. [Google Scholar] [CrossRef]
- Weil, M.; Weijtjens, W.; Devriendt, C. Autoencoder and Mahalanobis distance for novelty detection in structural health monitoring data of an offshore wind turbine. J. Phys. Conf. Ser. 2022, 2265, 032076. [Google Scholar] [CrossRef]
- Liu, J.H.; Corbita, J.N.T. Performance analysis of different predictive models for condition monitoring of direct drive wind turbine generator. Meas. Control 2021, 54, 374–384. [Google Scholar] [CrossRef]
- Zaher, A.S.A.E.; McArthur, S.D.J.; Infield, D.G.; Patel, Y. Online wind turbine fault detection through automated SCADA data analysis. Wind Energy Int. J. Prog. Appl. Wind Power Convers. Technol. 2009, 12, 574–593. [Google Scholar] [CrossRef]
- Bette, H.M.; Jungblut, E.; Guhr, T. Non-stationarity in correlation matrices for wind turbine SCADA-data and implications for failure detection. Wind Energy Sci. Discuss. 2021, in press. [Google Scholar] [CrossRef]
- Wang, B.; Gu, C. Comparison of the projection onto convex sets and iterative hard thresholding methods for seismic data interpolation and denoising. Explor. Geophys. 2018, 49, 825–832. [Google Scholar] [CrossRef]
- Lahdhiri, H.; Taouali, O.; Elaissi, I.; Jaffel, I.; Harakat, M.F.; Messaoud, H. A new fault detection index based on Mahalanobis distance and kernel method. Int. J. Adv. Manuf. Technol. 2017, 91, 2799–2809. [Google Scholar] [CrossRef]
- Li, M.; Wang, S.; Fang, S.; Zhao, J. Anomaly Detection of Wind Turbines Based on Deep Small-World Neural Network. Appl. Sci. 2020, 10, 1243. [Google Scholar] [CrossRef]
- Hsu, J.-Y.; Wang, Y.-F.; Lin, K.-C.; Chen, M.-Y.; Hsu, J.H.-Y. Wind Turbine Fault Diagnosis and Predictive Maintenance Through Statistical Process Control and Machine Learning. IEEE Access 2020, 8, 23427–23439. [Google Scholar] [CrossRef]
- Ouyang, T.; He, Y.; Huang, H. Monitoring wind turbines’ unhealthy status: A data-driven approach. IEEE Trans. Emerg. Top. Comput. Intell. 2018, 3, 163–172. [Google Scholar] [CrossRef]
- Bai, Y.; Jin, W.-L. Random Variables and Uncertainty Analysis. Mar. Struct. Des. 2016, 12, 615–625. [Google Scholar]


| Parameter | Data |
|---|---|
| Location | Taiwan |
| Number of wind turbine heads | Fourteen (14) |
| Nominal power capacity of wind turbine | 2.0 MW |
| Transmission connection | Direct-drive |
| Number of parameters in SCADA system | Thirty-two (32) |
| Number of component models generated | Seven (7) |
| Artificial Neural Network Type | Feed Forward Neural Network | |
|---|---|---|
| Layer | Hidden | Output |
| Neurons | 20 | 1 |
| Activation function | Sigmoid | Threshold |
| List of possible inputs | Air gap temperature, generator voltage, generator current, inverter current, inverter voltage, cooling water low pressure, cooling water low pressure, cooling water temperature, control cabinet temperature, impeller angle, motor current, blade angle, rotor temperature, wind speed, wind direction, vibration | |
| List of possible outputs | Generator speed, generator stator temperature, alternator bearing temperature, cooling water high pressure, rotor speed, brake hydraulic pressure, active power | |
| Output Model | Input Parameters |
|---|---|
| Generator speed | average alternator bearing temperature generator voltage generator current active power |
| Stator temperature | average generator air gap temperature average alternator bearing temperature generator current active power |
| Bearing temperature | average generator stator temperature generator speed average generator air gap temperature generator voltage |
| Cooling water high pressure | average inverter current average inverter voltage cooling water low pressure active power |
| Rotor speed | blade 2 motor current blade 3 motor current average blade angle active power |
| Brake hydraulic pressure | XY direction resultant force vibration X direction vibration Y direction vibration active power |
| Active power | average generator stator temperature generator current average inverter current rotor speed |
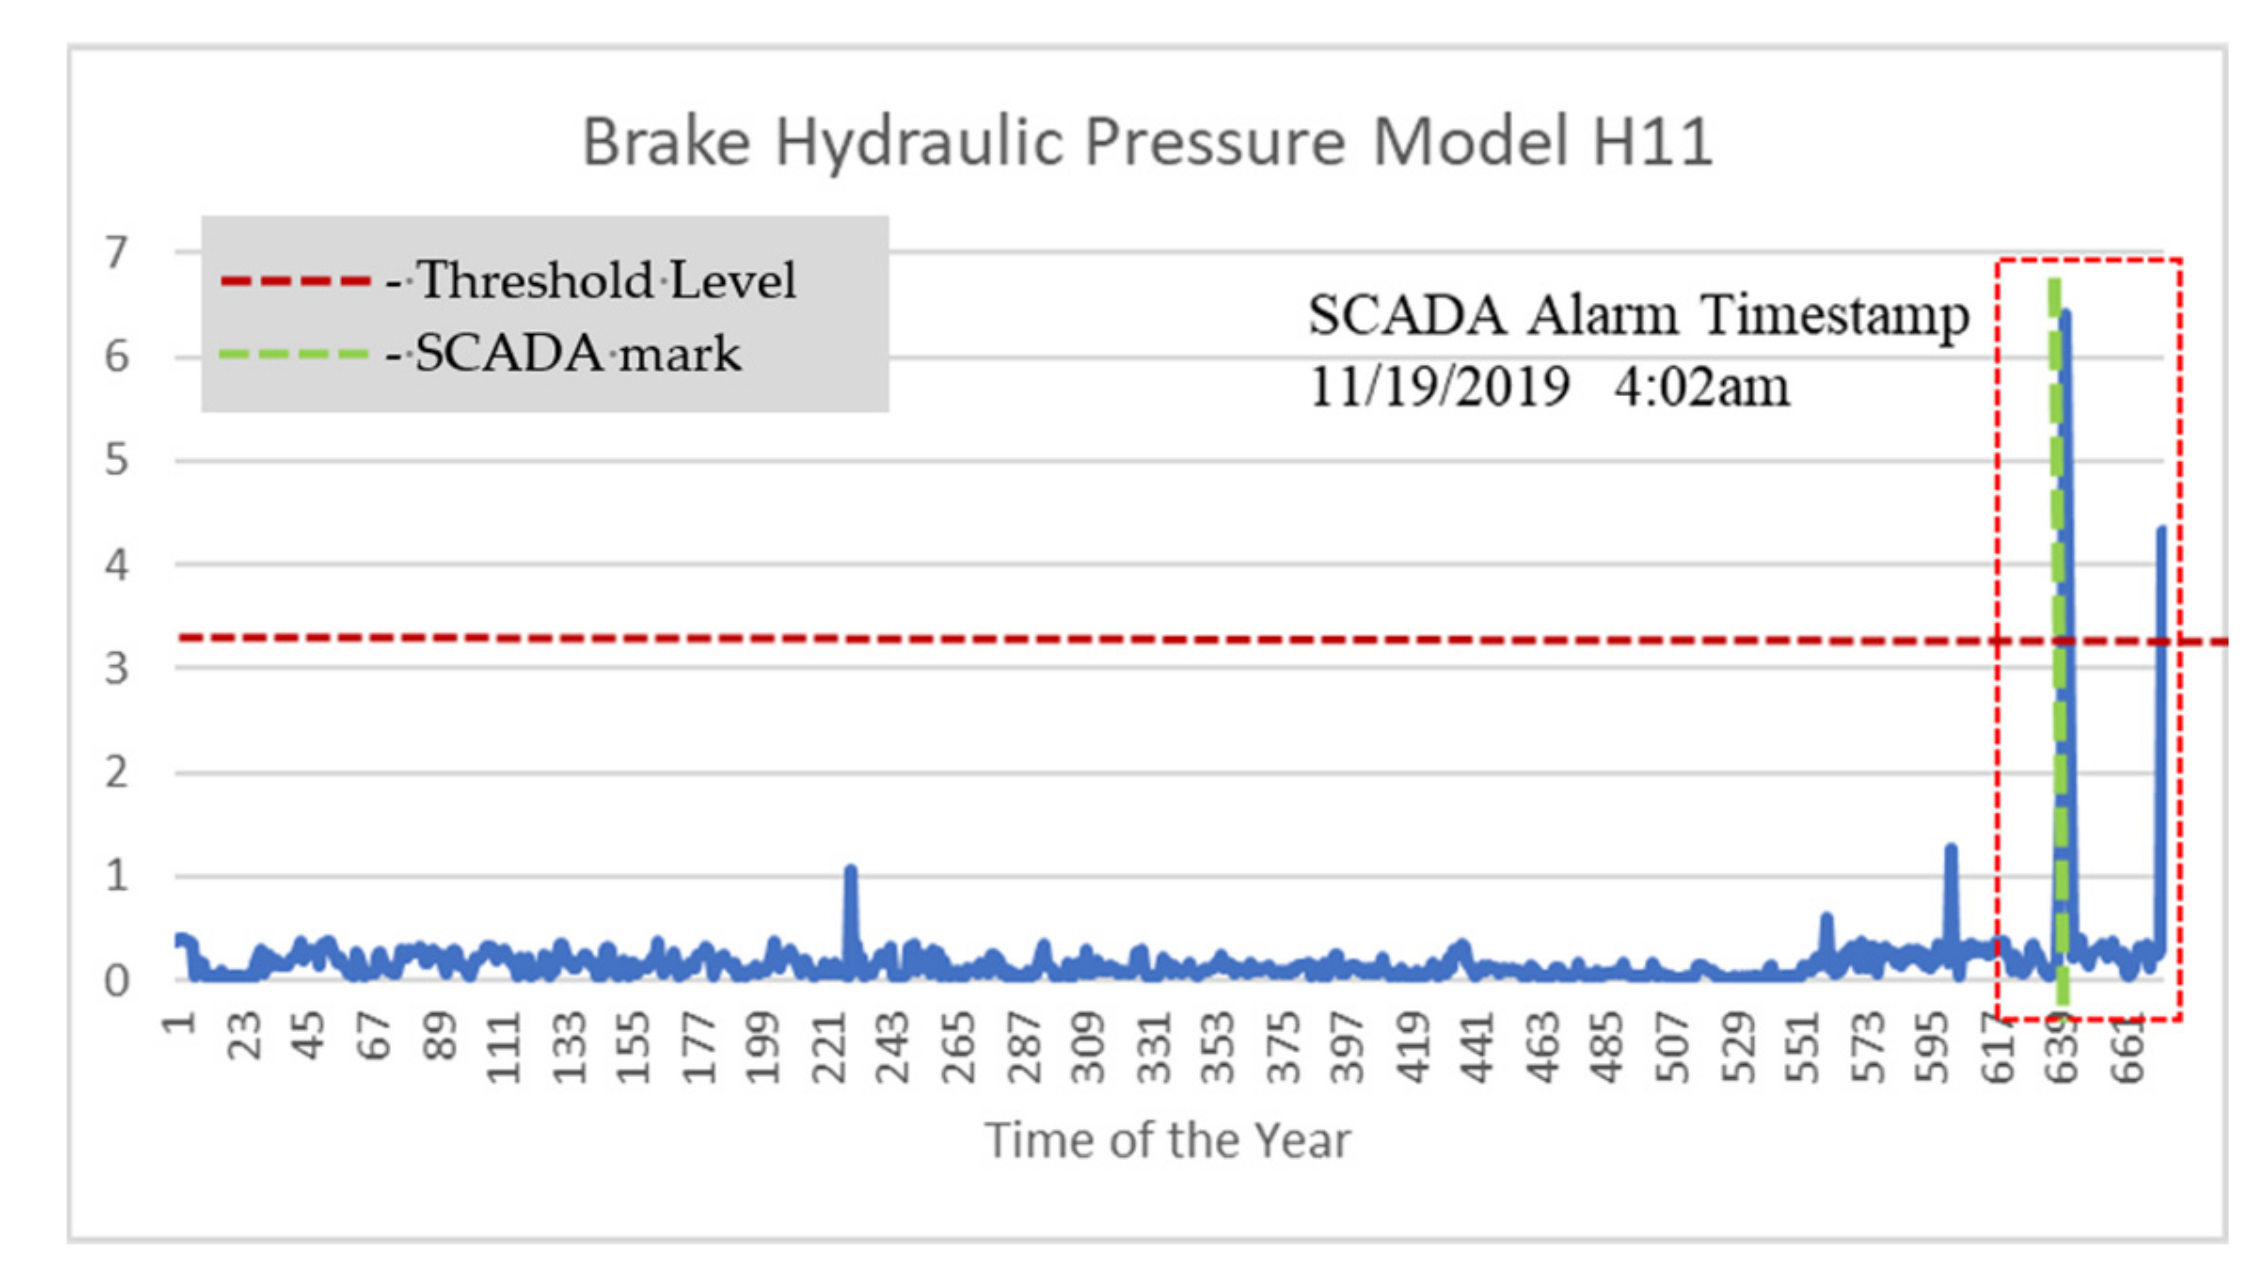
| Time-Points of the Year | Real Time-Stamp | MD Value |
|---|---|---|
| 641 | 2019/11/17 00:00 | 0.077828383 |
| 642 | 2019/11/17 12:00 | 0.200583207 |
| 643 | 2019/11/18 00:00 | 1.202948234 |
| 644 | 2019/11/18 12:00 | 2.032181356 |
| 645 | 2019/11/19 00:00 | 6.421187127 |
| 646 | 2019/11/19 12:00 | 1.909682528 |
| 647 | 2019/11/20 00:00 | 0.221972715 |
| 648 | 2019/11/20 12:00 | 0.273416611 |
| Wind Turbine | Alarm Code | Alarm Description | Date/Time |
|---|---|---|---|
| H11 | 228 | Yaw Brake Pressure Very Low | 19 November 2019 4:02 |
| H11 | 228 | Yaw Brake Pressure Very Low | 19 November 2019 17:15 |
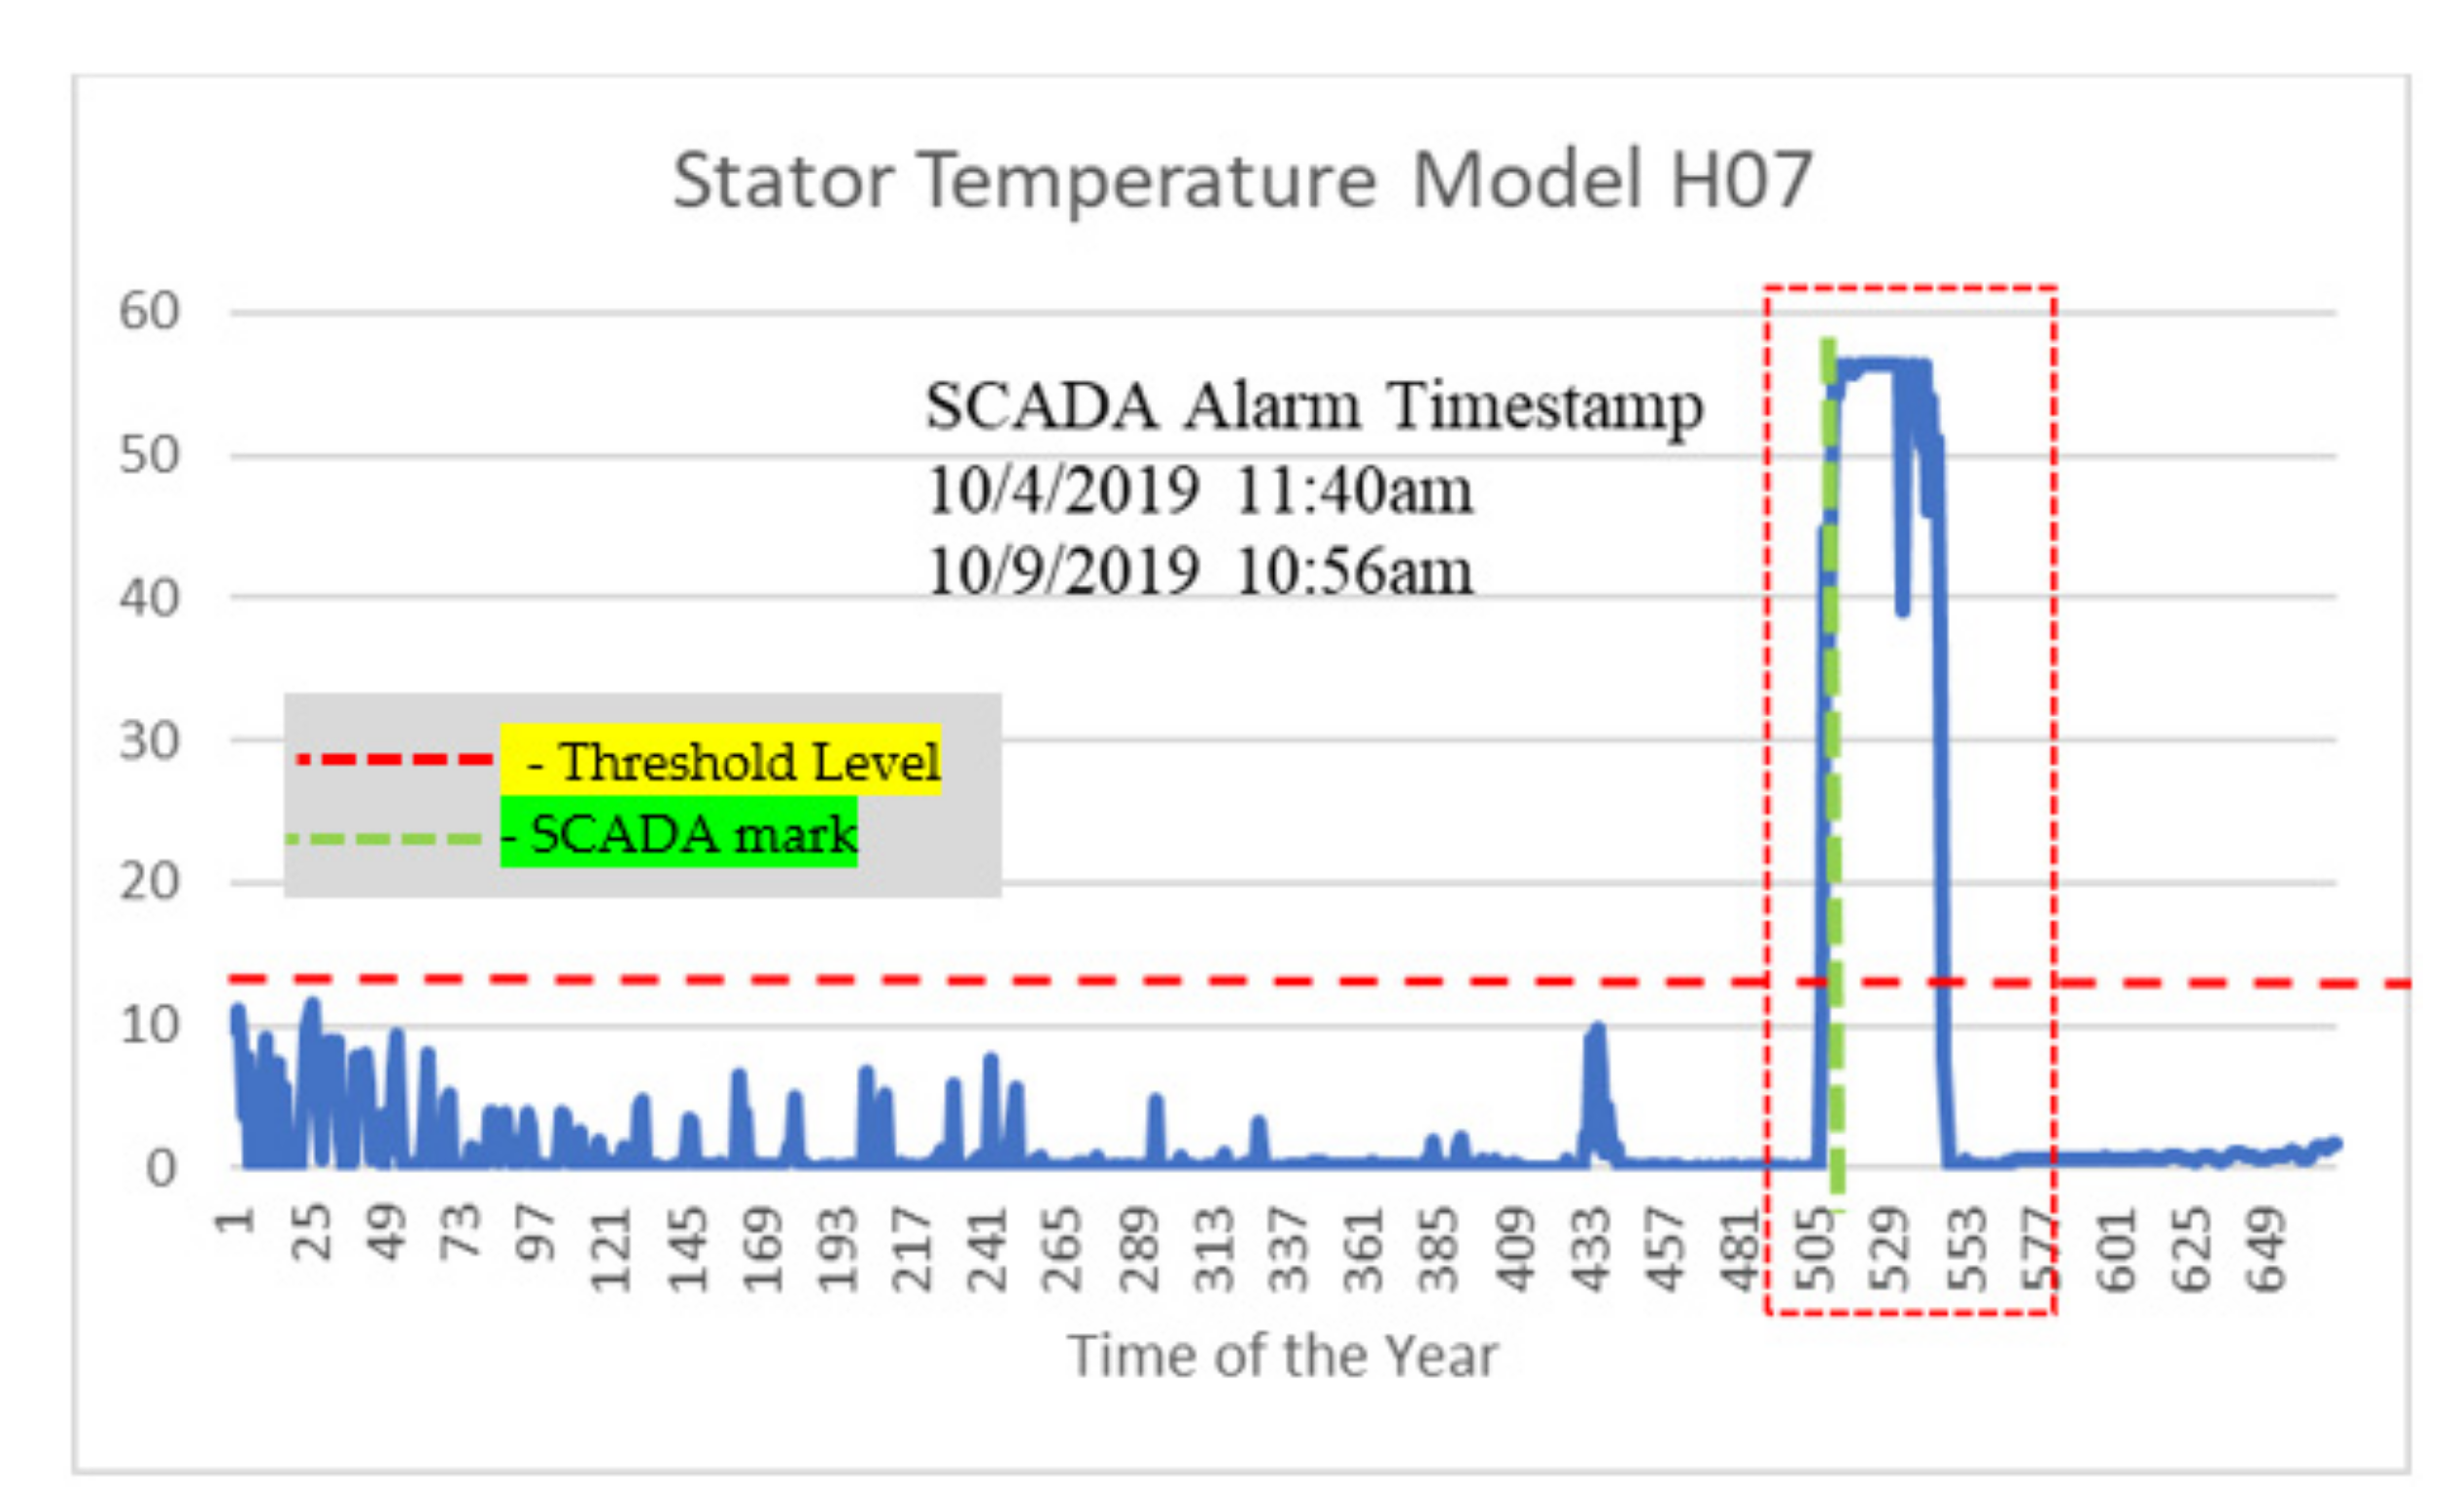
| Wind Turbine | Alarm Code | Alarm Description | Date/Time |
|---|---|---|---|
| H07 | 249 | generator stator temperature very high | 9 October 2019 10:56 |
| H07 | 242 | bearing temperature fault | 4 October 2019 11:40 |
Publisher’s Note: MDPI stays neutral with regard to jurisdictional claims in published maps and institutional affiliations. |
© 2022 by the authors. Licensee MDPI, Basel, Switzerland. This article is an open access article distributed under the terms and conditions of the Creative Commons Attribution (CC BY) license (https://creativecommons.org/licenses/by/4.0/).
Share and Cite
Liu, J.-H.; Corbita, N.T., Jr.; Lee, R.-M.; Wang, C.-C. Wind Turbine Anomaly Detection Using Mahalanobis Distance and SCADA Alarm Data. Appl. Sci. 2022, 12, 8661. https://doi.org/10.3390/app12178661
Liu J-H, Corbita NT Jr., Lee R-M, Wang C-C. Wind Turbine Anomaly Detection Using Mahalanobis Distance and SCADA Alarm Data. Applied Sciences. 2022; 12(17):8661. https://doi.org/10.3390/app12178661
Chicago/Turabian StyleLiu, Jui-Hung, Nelson T. Corbita, Jr., Rong-Mao Lee, and Chun-Chieh Wang. 2022. "Wind Turbine Anomaly Detection Using Mahalanobis Distance and SCADA Alarm Data" Applied Sciences 12, no. 17: 8661. https://doi.org/10.3390/app12178661