Abstract
The synthesis of carbon-based quantum dots has been widely explored in the literature in recent years. However, despite the fact that synthesis processes to obtain highly efficient carbon quantum dots (CQDs) and graphene quantum dots (GQDs) with redshifted photoluminescence (PL) have been improved, few works have exploited sucrose in the synthesis of GQDs with high PL efficiency. In this work, sucrose, which is a widely available non-toxic saccharide, was used as a precursor of GQDs. Initially, sucrose was carbonized in sulfuric acid, and thereafter, the material obtained was treated in dimethyl sulfoxide (DMSO). Nitrogen doping was also performed in this work through an additional step involving the treatment of carbonized sucrose in nitric acid reflux. Nitrogen-doped GQDs (N-GQDs) showed tunable PL dependent on the excitation wavelength. It was also verified that the intensity of the emission in the red region was much higher in the N-GQDs in comparison with that in undoped GQDs. X-Ray Diffraction, Raman, FTIR, TEM, and AFM analyzes were also performed to obtain greater structural details of the obtained GQDs.
1. Introduction
The growing interest in the development of novel materials with better mechanical, electrical, and optical properties has given rise to a rich research field of materials with low dimensionality. In this aspect, research involving zero-dimensional materials, such as carbon quantum dots (CQDs), graphene oxide quantum dots (GOQDs), and graphene quantum dots (GQDs), has brought very interesting results for applications in photonics [1,2], biophotonics [3,4,5], energy generation [6,7,8], photocatalysis [9,10], sensors [11,12], and optoelectronic devices [7,13,14], among others.
CQDs are small fluorescent nanoparticles with a typical size in the range of 1–10 nm [1,10,15,16]. GQDs are a subset of CQDs composed of small fragments of graphene that have lateral sizes ranging from 1 to 10 nm with one or several layers [10,11,15,16,17]. The luminescence of carbon-based quantum dots is among the most interesting characteristics of these materials. Although mechanisms involving the photoluminescence (PL) of CQDs and GQDs are still debated, much progress has been made in this direction in recent years. There are many variables that can play important roles in the tuning of PL from CQDs and GQDs, such as particle size, the average size of the sp2 domains (also called conjugated π domains), the presence of heteroatoms and how they bind to the structure of the nanoparticle, and the host environment [1,2,3,17]. In general, CQDs and GQDs can present tunable PL between ultraviolet, visible, and near-infrared regions [2,18,19]. CQDs and GQDs also have wide absorption bands, and depending on the synthesis process, GQDs with a quantum efficiency higher than 70% can be obtained [1].
It is a consensus that PL is intrinsically linked to the structure of CQDs. The structural characteristics of CQDs depend, above all, on the synthesis methods and precursor materials. Among the carbon-based quantum dots, GQDs are singular since they present predominantly carbons with sp2 hybridization, and their structure is based on single-layer graphene nanosheets or graphene nanoparticles with few layers [10,11,16]. The presence of sp3 hybridized carbons can give rise to “cross-links” between sheets, resulting in CQDs with disordered structures. The size of the sp2 domains, therefore, has a great influence on the optical properties of GQDs [1,18].
The quantum confinement effect is generally used to explain the PL of semiconductor quantum dots and occurs when the movement of charge carriers (electrons and holes) is constrained in the three dimensions of space [17,20]. In the case of GQDs, quantum confinement must be considered when the particle size or the size of the sp2 domains (also known as conjugated π domains) is smaller than the Bohr radius of the exciton [17,18]. Quantum confinement results in an increase in the bandgap energy of the material since in these materials, the density of the energy states is much lower compared with the same massive material [17,18]. It should be noted that colloids obtained experimentally can present CQDs or GQDs with a wide size distribution and different chemical characteristics, which can result in wider absorption and emission bands [1,21]. In this sense, the use of separation techniques, such as chromatography and centrifugation, can also be used to tune the PL of the CQDs [21,22].
The PL of the GQDs can also be influenced by the doping of the GQDs with heteroatoms, such as oxygen, nitrogen, boron, sulfur, and phosphorus, among others [18,23,24,25,26,27,28,29]. In general, electron-accepting impurities act by increasing the energy gap between the highest occupied molecular orbitals (HOMOs) and the lowest unoccupied molecular orbitals (LUMOs) [2]. On the other hand, electron-donating impurities act to reduce the energy gap between HOMOs and LUMOs. The presence of functional groups with oxygen (alcohols, epoxy, carbonyls, carboxyls, and aldehydes) on the surface of GQDs is quite common, especially when the synthesis is carried out in an aqueous medium [1]. Nitrogen doping can be achieved with the introduction of urea [30,31] or treatment with nitric acid [32] during synthesis. It is noteworthy that studies involving the doping of GQDs with nitrogen have been highlighted in the literature [24,25,26] due to the similarity that the nitrogen atom presents in relation to the atomic radius and electronegativity of carbon. In general, the presence of nitrogen causes a redshift of the PL and provides an increase in the quantum yield of the GQDs. Several recent studies involving density functional theory (DFT) have been carried out in order to improve the understanding of the effects of the introduction of dopants on the structure of GQDs [27,28,29]. In general, particles with a higher degree of oxidation have a greater tendency to present PL in the blue region when excited in the UV region [1]. On the other hand, the presence of nitrogen, sulfur, and boron can give rise to new energy states, allowing the expansion of the GQDs’ excitation window, greater control of luminescent tuning in the visible and near-infrared range, and the reduction of phonon losses [1,29].
As already mentioned, the precursors used for the synthesis of carbon-based quantum dots play a crucial role in determining the structure of the CQDs and GQDs and, consequently, their optical properties. In this work, we performed the synthesis of colloidal systems of GQDs from sucrose. Sucrose was chosen because it is a non-toxic and highly available carbohydrate. Although sucrose-based CQDs have already been reported in the literature [6,33,34], most of the works have reported the synthesis of CQDs with PL in the blue-green region and obtained the CQDs through hydrothermal syntheses [35,36] or after acidic carbonization [37]. However, the use of sucrose to obtain GQDs with emission extending to the red and near-infrared regions has not been explored. On the other hand, CQDs emitting in the red region have already been performed using much less available, toxic, or more expensive precursors, such as isomers of phenylenediamine [38], 2,5-diaminotoluene sulfate [39], and reduced glutathione [40]. Quantum dots with intense emission in the red/near-infrared regions are key for applications in white light-emitting diodes (WLEDs) and biological fields since blue and green emissions cannot penetrate tissue deeply and are more likely to cause the autofluorescence of biosamples [1].
In this work, we propose a new approach with the use of sucrose, obtained from commercial refined sugar, as a precursor for red-emitting tunable photoluminescent GQDs. We propose a simple synthesis method that is based on the carbonization of sucrose followed by the synthesis of the GQDs in a dimethylsulfoxide (DMSO) treatment instead of using water as a solvent. DMSO is a polar aprotic solvent; it has been used in other work to obtain GQDs with redshifted emissions [1], and its use for the chemical reduction of graphene oxide has been reported elsewhere [41]. Results regarding the doping of GQDs obtained from sucrose with nitrogen are also presented for the first time, to the best of the authors’ knowledge.
2. Materials and Methods
2.1. Synthesis of GQDs
The synthesis of the GQDs was carried out from sucrose, obtained from commercial refined sugar. First, a sucrose solution (1 g/mL) in deionized water with a maximum conductivity of 18 MΩ/cm was obtained. Concentrated sulfuric acid (purity > 95%) was added to the solution in the proportion of 2 mL/mL to carry out the initial carbonization of sucrose. This step was carried out at room temperature, lasted only a few minutes, and gave rise to a carbonaceous solid material (Precursor A) after washing, filtering, and drying.
To obtain the colloidal suspension containing the undoped GQDs, 3.5 g of Precursor A was added to 25 mL of DMSO (purity > 99.9%). The mixture was kept under magnetic stirring for 4 h, under reflux at 60 °C, in a water bath. At the end of the process, a washing and filtering step was carried out to obtain the undoped GQDs.
To obtain nitrogen-doped GQDs (N-GQDs), 7 g of Precursor A was added to 25 mL of azeotropic nitric acid. The mixture was refluxed for 4 h and heated in a water bath at 60 °C. Afterward, the nitric acid was evaporated, and a solid powder (Precursor B) was obtained. N-GQDs were then obtained after mixing 3.5 g of Precursor B into 25 mL of DMSO. The mixture was kept under magnetic stirring for 4 h and under reflux at 60 °C. At the end of the process, washing, filtering, and drying steps were carried out to obtain the N-GQDs.
2.2. Structural Characterizations
The atomic force microscopy (AFM) images were obtained by intermittent contact mode in Lens AFM Nanosurf equipment with a C3000 controller. To obtain the images, the samples were prepared by depositing about 2 µL of the suspension of GQDs with ethanol onto a previously cleaved mica surface (Ted Pella Inc., Redding, CA, USA), and after evaporation of all the solvent, the analysis by AFM was performed. Transmission Electron Microscopy (TEM) analysis was performed with a JEOL JEM 2100 (200 kV). X-ray diffraction was performed with Rigaku Ultima III equipment, operated with characteristic Cu-Kα radiation (λ 1.54 °Å), a voltage of 40 kV, and a current of 30 mA. Raman spectroscopy was performed with a confocal Raman microscope Alpha 300 R, brand WITEC, using a CW laser of 532 nm with a maximum power of 45 mW and an objective of 50x/NA 0.7 as the excitation source. FTIR analysis was performed with a Perkin Elmer Spectrum 100 spectrometer in attenuated total reflection (ATR) mode. To perform the XRD, Raman, and FTIR analyses, the powders resulting from the drying of the colloidal GQDs and N-GQDs after treatment in DMSO were used.
2.3. Optical Characterizations
Absorbance measurements were performed at room temperature on an Ocean Optics single-beam QE Pro spectrophotometer operating at wavelengths from 200 to 850 nm. The bandgap energies (Eg) of the GQDs were estimated from the Tauc graph [26], that is, the curve of (αhν)r as a function of hν, obtained from the UV–VIS absorbance spectrum, where α, h, and ν are the absorption coefficient, Planck’s constant, and optical frequency, respectively; r = 1/2 for an indirect bandgap material; and r = 2 for a direct bandgap material. Photoluminescence (PL) analyses were performed with a spectrofluorometer (CaryEclipse, Agilent, Santa Clara, CA, USA) at room temperature. The excitation wavelengths ranged between 220 and 600 nm, and the PL was evaluated in the range between 400 and 700 nm. For the optical characterizations, GQDs and N-GQDs were dispersed in DMSO and inserted into quartz cuvettes with a 10 mm optical path.
3. Results and Discussion
3.1. Structural Characterization
The particle size distribution and morphology of the GQDs were evaluated by AFM (Figure 1). The undoped GQDs presented heights between approximately 9 and 21 nm and widths between approximately 344 and 396 nm. The aspect ratios (RA = width/height) of the undoped GQDs were, therefore, around RA = 29.15, which indicates that the particles had lamellar morphology, as expected for graphene and oxidized graphene nanoparticles. Clusters with heights higher than 100 nm were also found, which reflects the material’s tendency to form clusters, especially after drying. On the other hand, the N-GQDs presented heights in the range of 0.8 and 5.0 nm and widths between 197 and 311 nm. In this case, the aspect ratio was RA = 106.53, once again reflecting lamellar morphology, as expected for graphene nanoclusters. It should be noted that the measurements for the widths of the GQDs may be overestimated due to the convolution effect of the AFM tip [42]. The heights obtained by AFM already indicate that undoped GQDs were slightly larger (1–20 nm) in comparison with N-GQDs (1–6 nm).
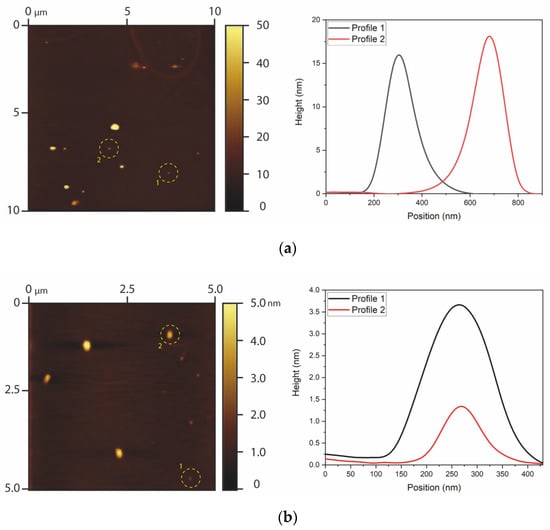
Figure 1.
AFM results of (a) undoped GQDs and (b) N-GQDs. The images on the left show AFM images of the graphene dots, and the curves on the right show profiles of particles that were highlighted in the AFM images.
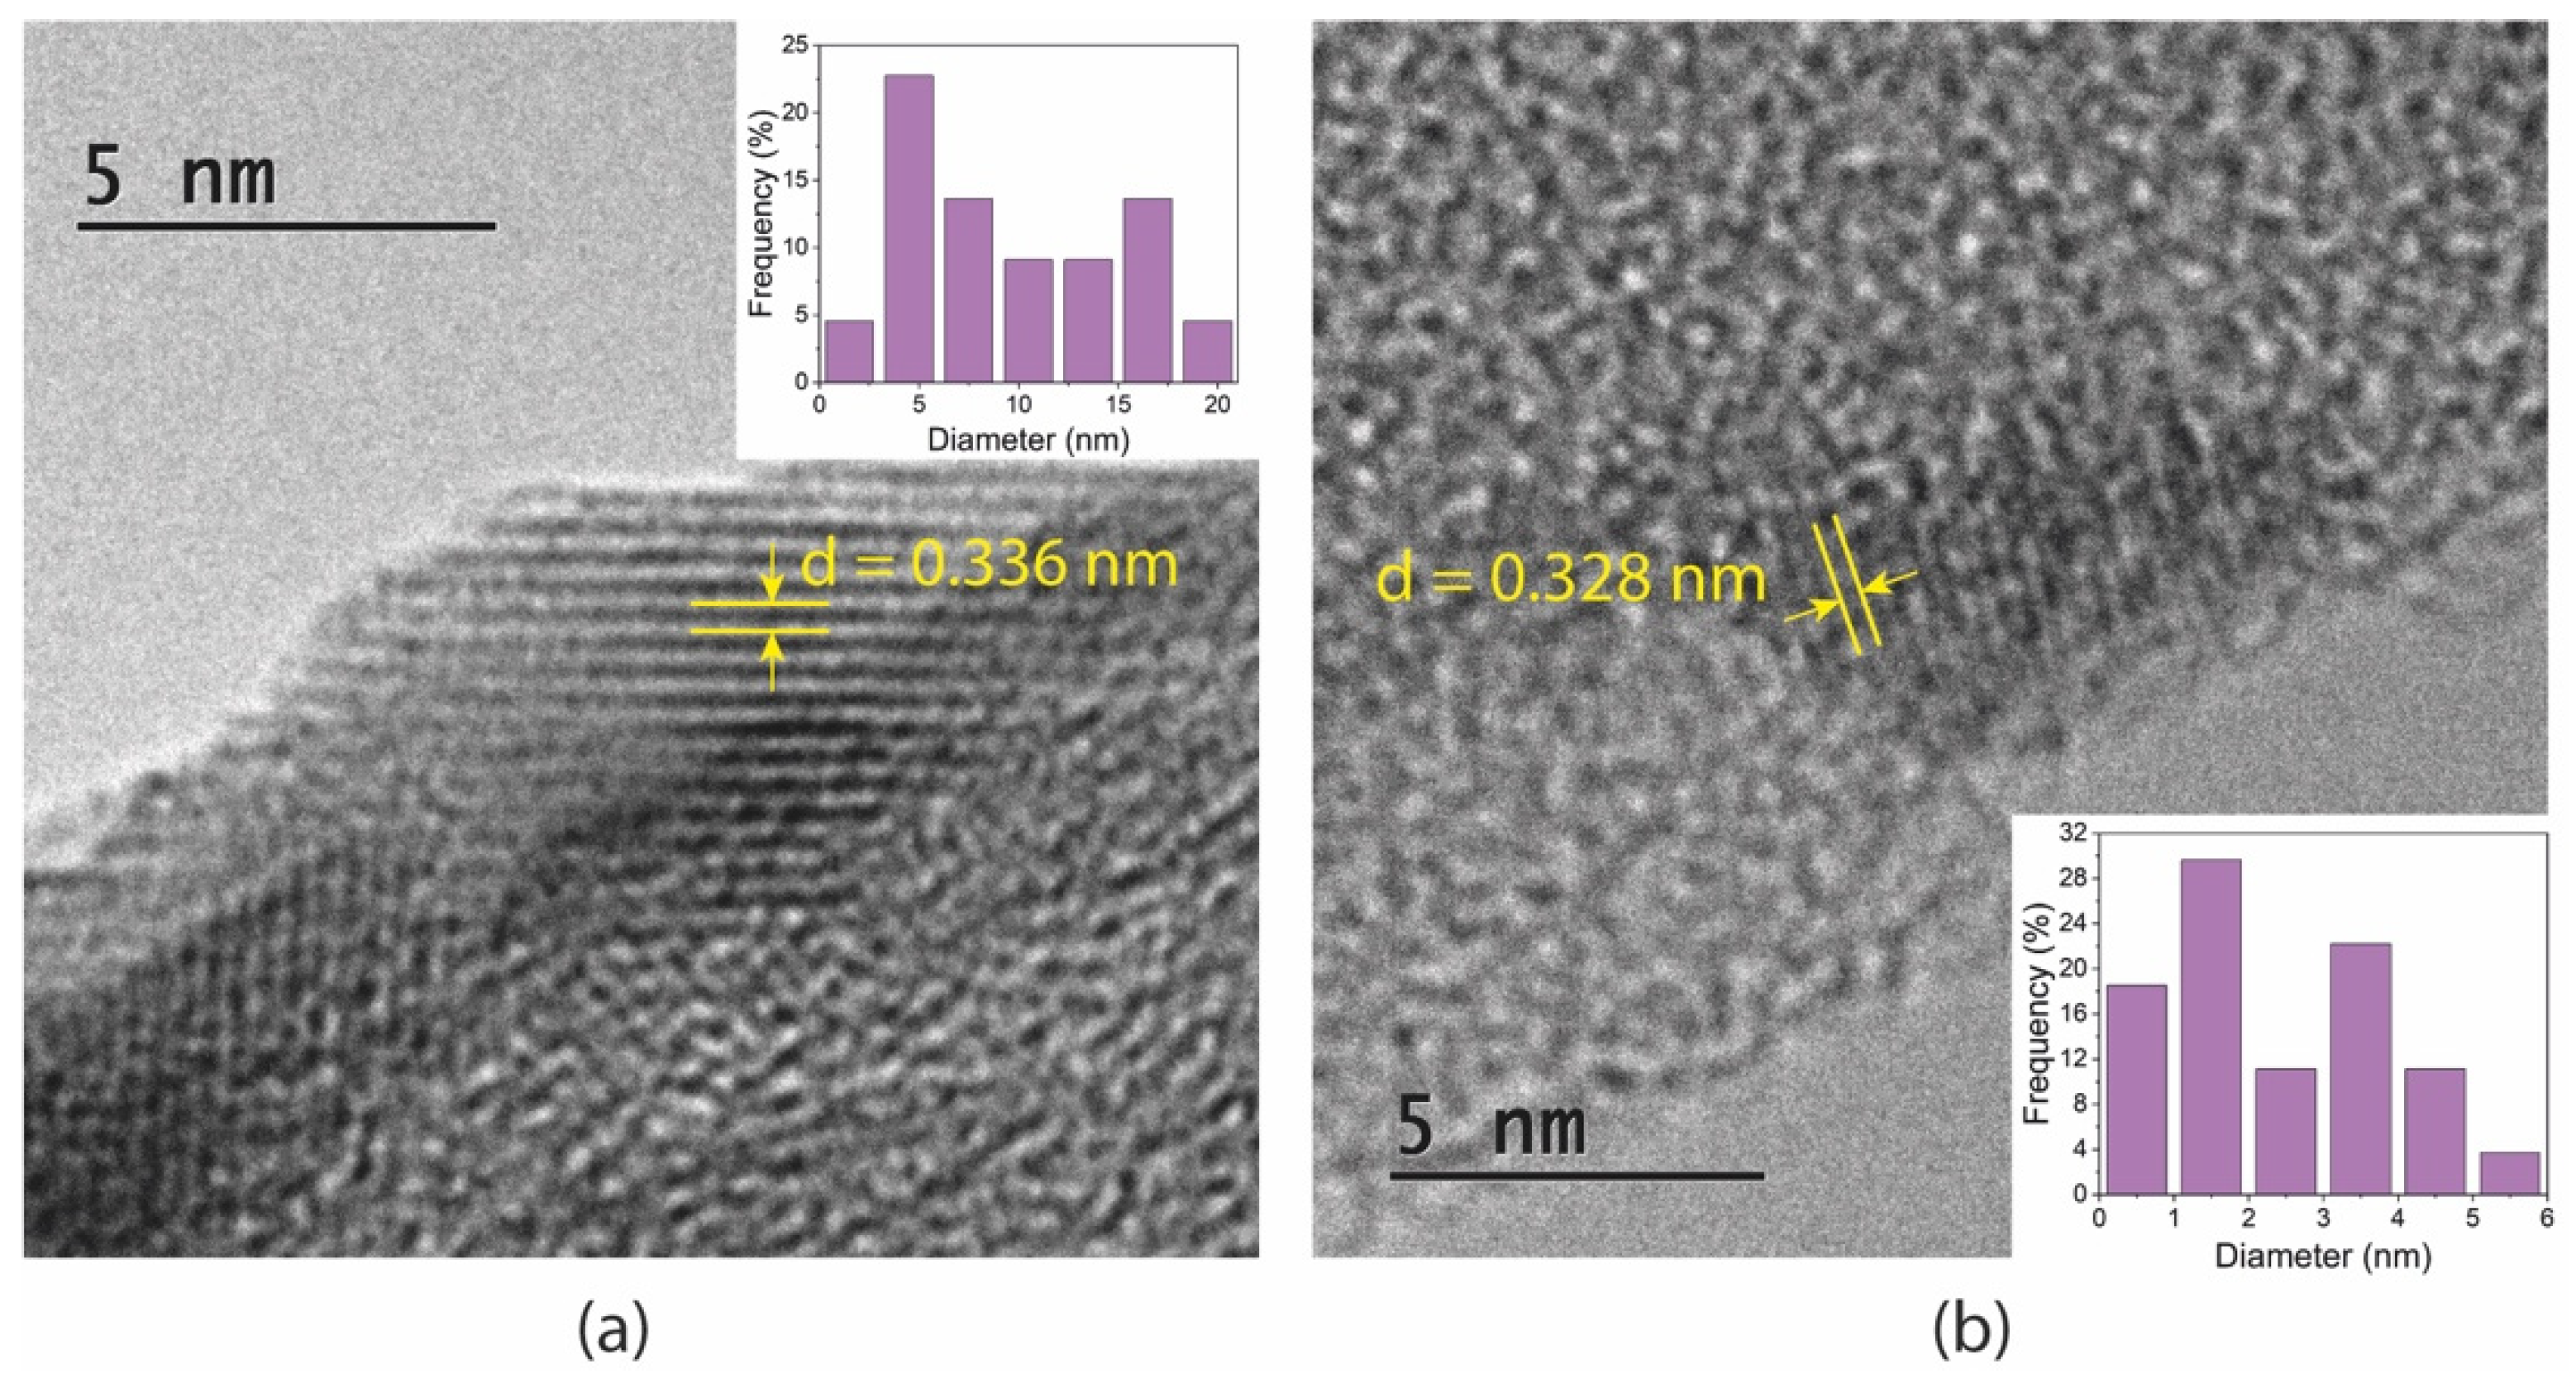
TEM images and size distribution of the GQDs are shown in Figure 2. The lattice-resolved high-magnification images of single quantum dots revealed d-spacing of 0.336 and 0.328 nm for GQDs and N-GQDs, respectively. These distances are in accordance with the (002) lattice planes of multilayered graphene. The average sizes of undoped GQDs were slightly larger in comparison with those of N-GQDs, as was observed in the AFM analysis.

Figure 2.
TEM images of (a) undoped GQDs and (b) N-GQDs. The insets show size distribution of the particles.
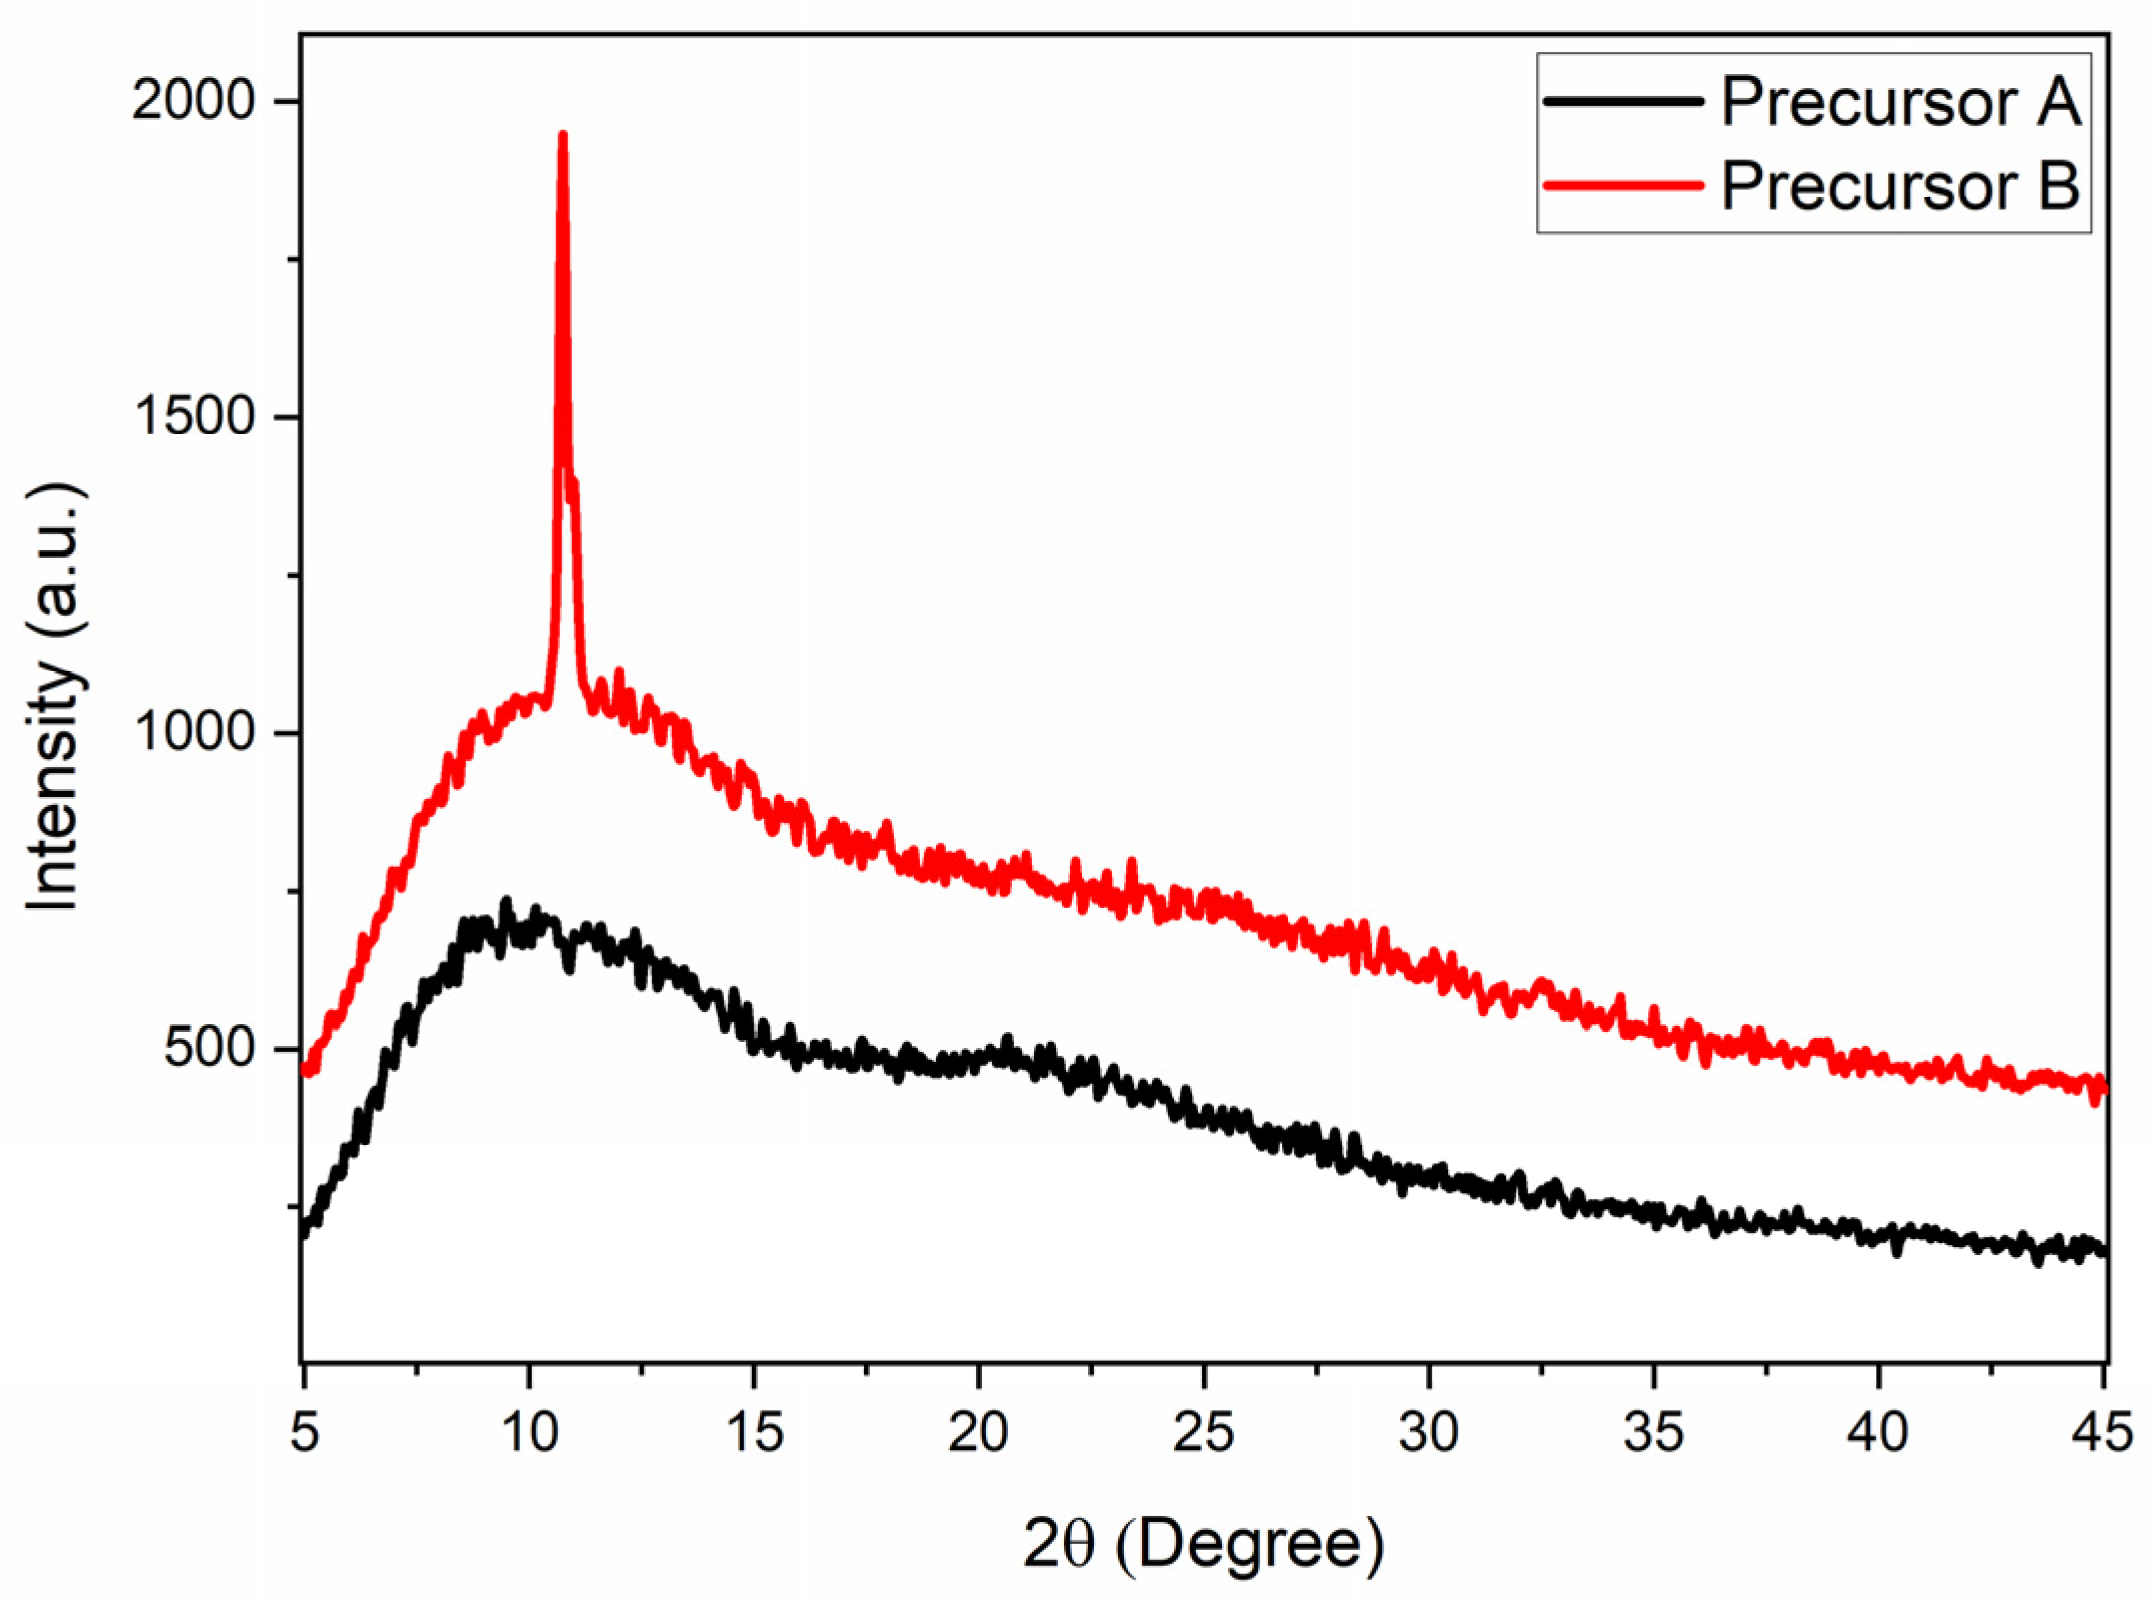
The diffractograms obtained for the different precursors used in the syntheses are shown in Figure 3. The carbonized precursor (Precursor A) showed only two broad peaks, located at 10° and 23°. The broad peak near 10° can be associated with the presence of graphene oxide nanosheets [24,43], and the peak centered at 23° could be caused by the presence of graphene nanosheets [24,43]. It is interesting to note that in the doped precursor (Precursor B), in addition to the broad peaks, a much narrower peak was observed at approximately 10.8°, corresponding to an interplanar distance of 0.818 nm. This peak can be associated with the crystalline plane (100) of graphene oxide [43,44]. These results indicate, therefore, that the doping process carried out under reflux in nitric acid must also act on the condensation of graphene oxide nanosheets in order to generate larger sheets with fewer defects.
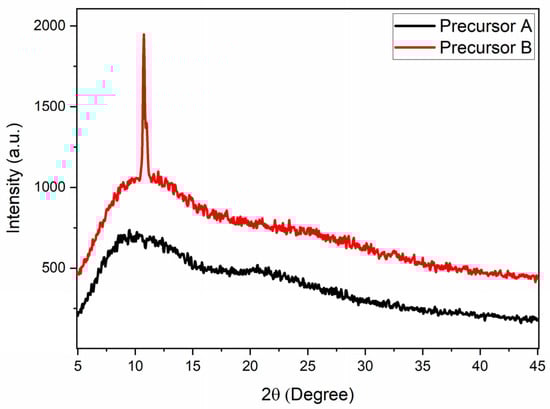
Figure 3.
XRD results of Precursor A and Precursor B used in the synthesis of the GQDs.
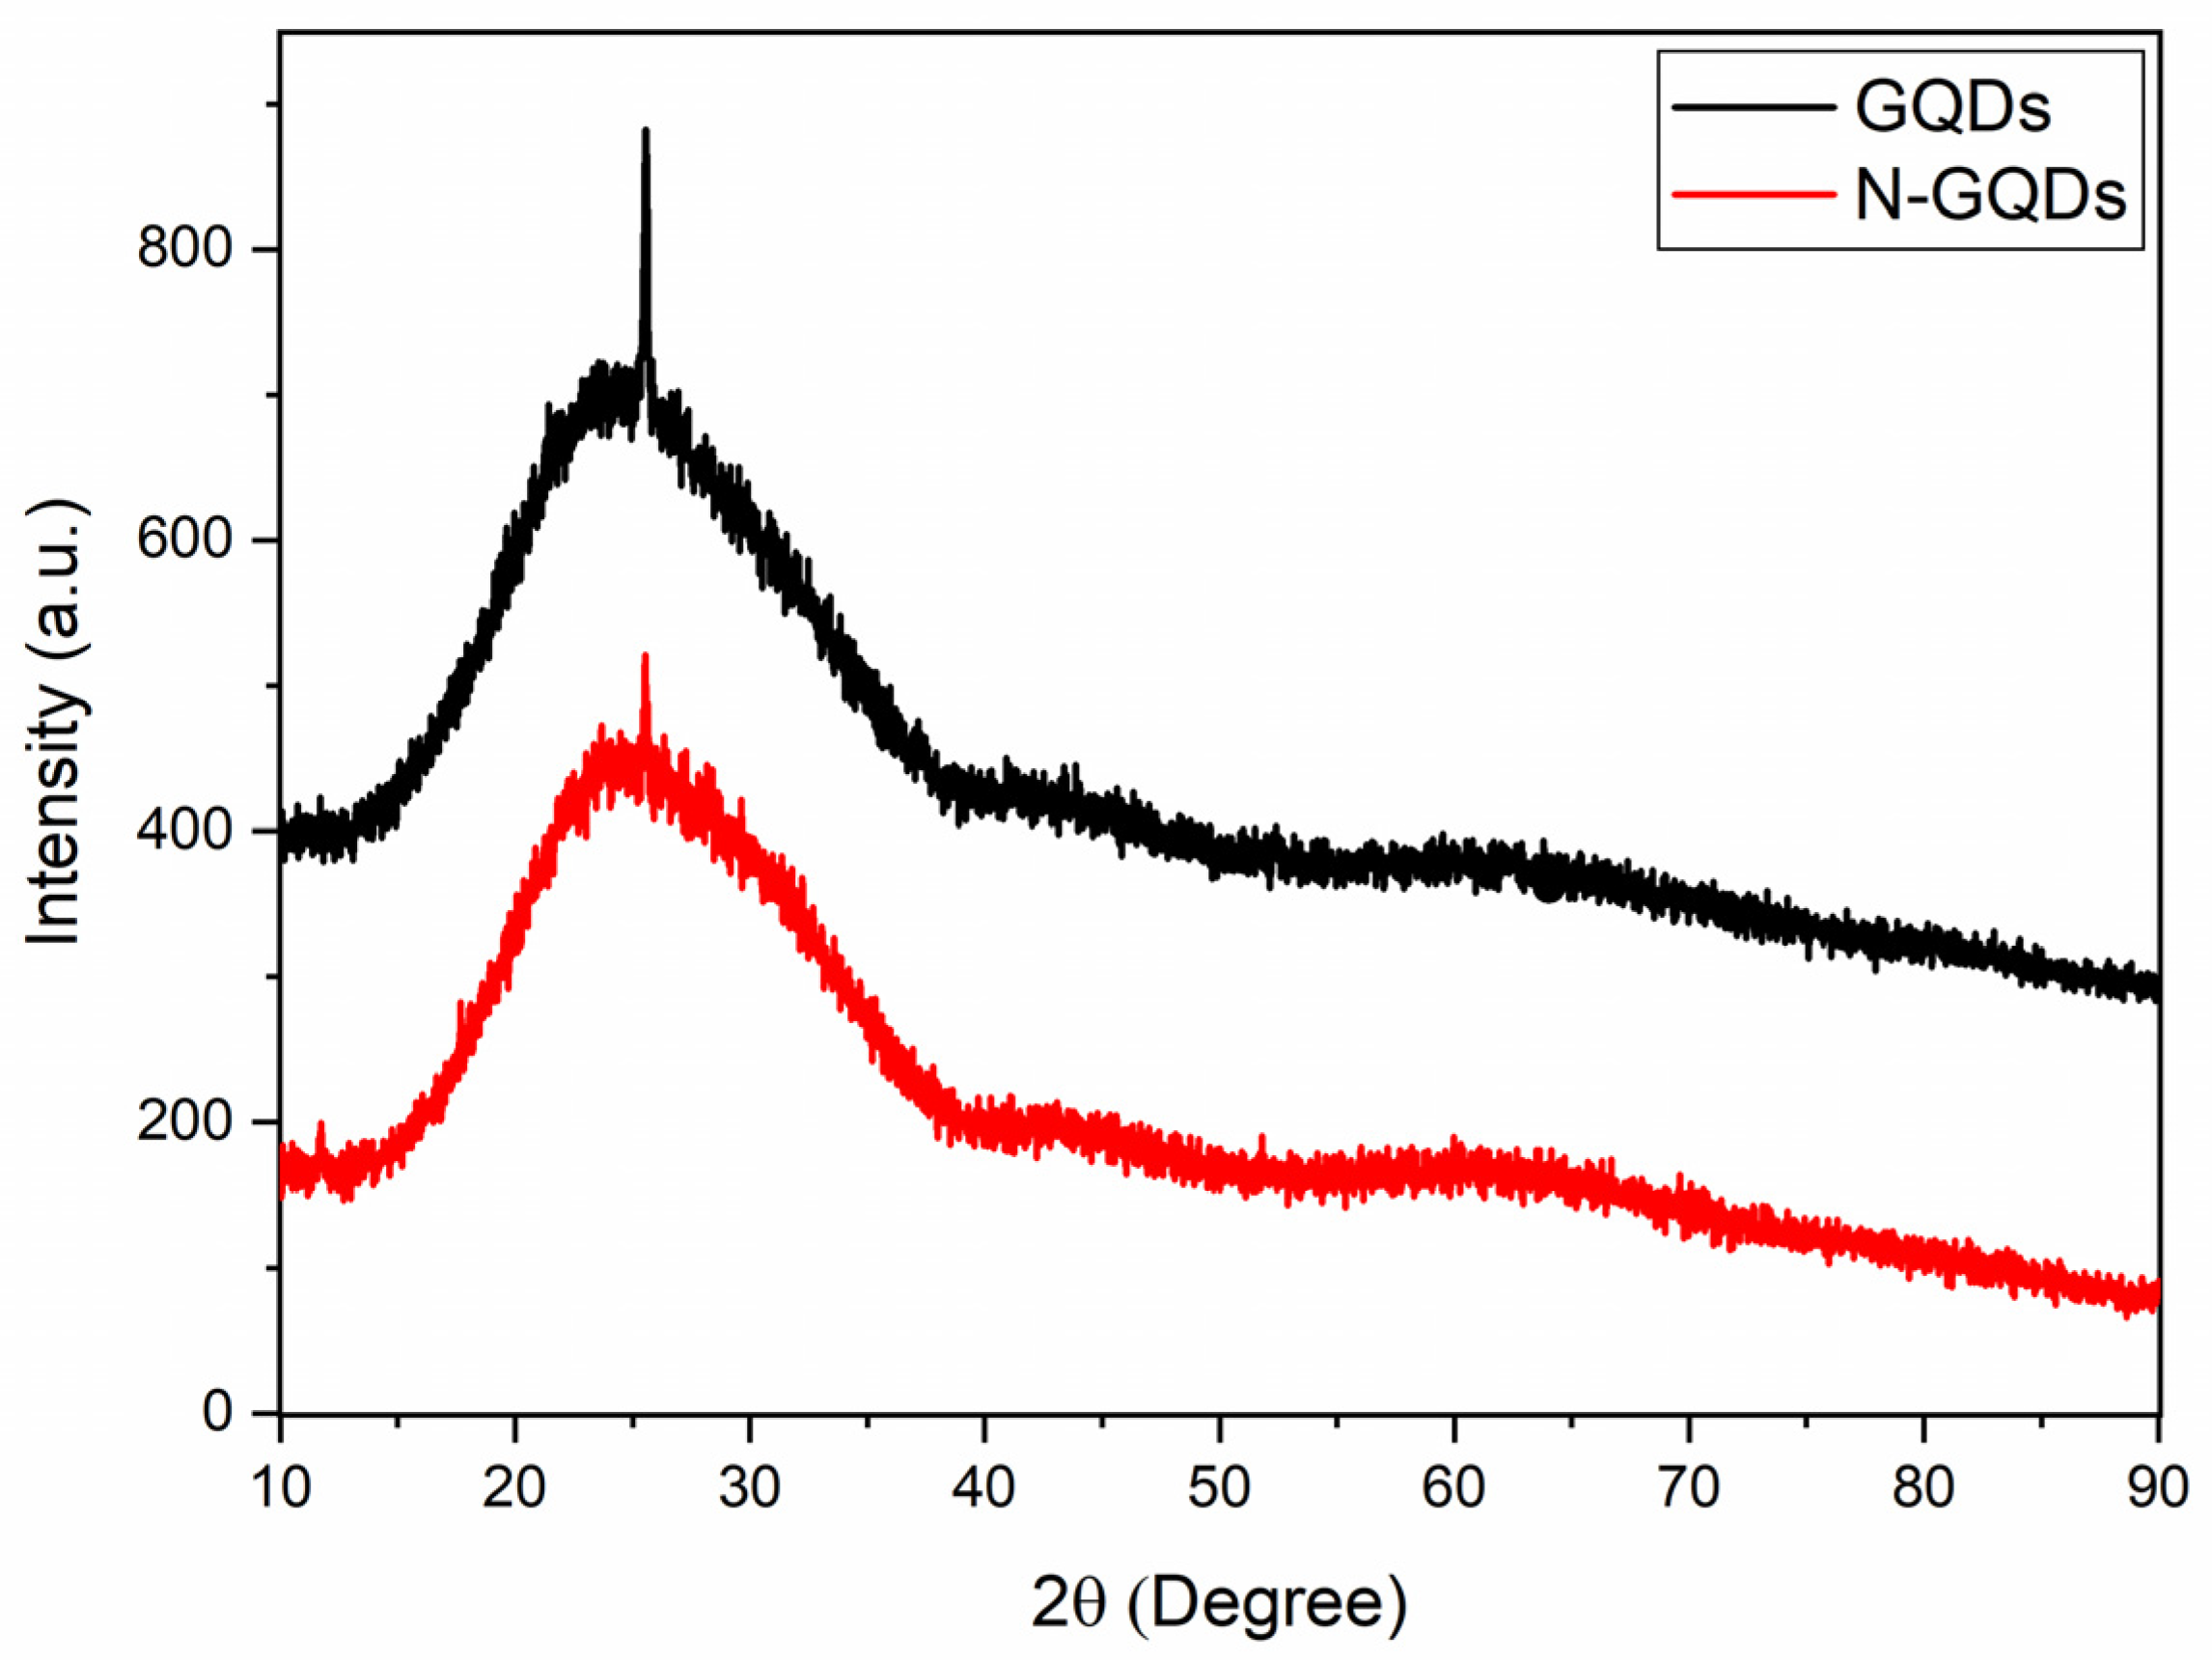
Figure 4 presents the diffractograms of the GQDs produced in this work. The curves obtained for the GQDs and N-GQDs were very similar, showing a broad peak centered at approximately 25° and a much narrower peak located around 26°. The broad peak located around 25° was also observed in XRD analyses of pure graphene samples and graphene nanosheets [24,43,44]. The presence of the narrowest peak can be related to the crystalline planes (002) of graphite (d = 3.36 Å) [24,43] and is in accordance with TEM results. The presence of the peak associated with the graphite planes (002) shows that the treatment of the precursors under reflux in DMSO was responsible for both the condensation process of the graphene oxide nanosheets and the graphene oxide reduction process. This conclusion is supported by the fact that the broad peak at 10° (present in the precursors) was no longer present in the GQDs diffractograms after the DMSO treatment. In the literature, there are several works that deal with the chemical reduction of graphene oxide [45,46], but there are few that use DMSO as a possible candidate for the reduction of graphene oxide [47].

Figure 4.
XRD results of undoped GQDs and N-GQDs.
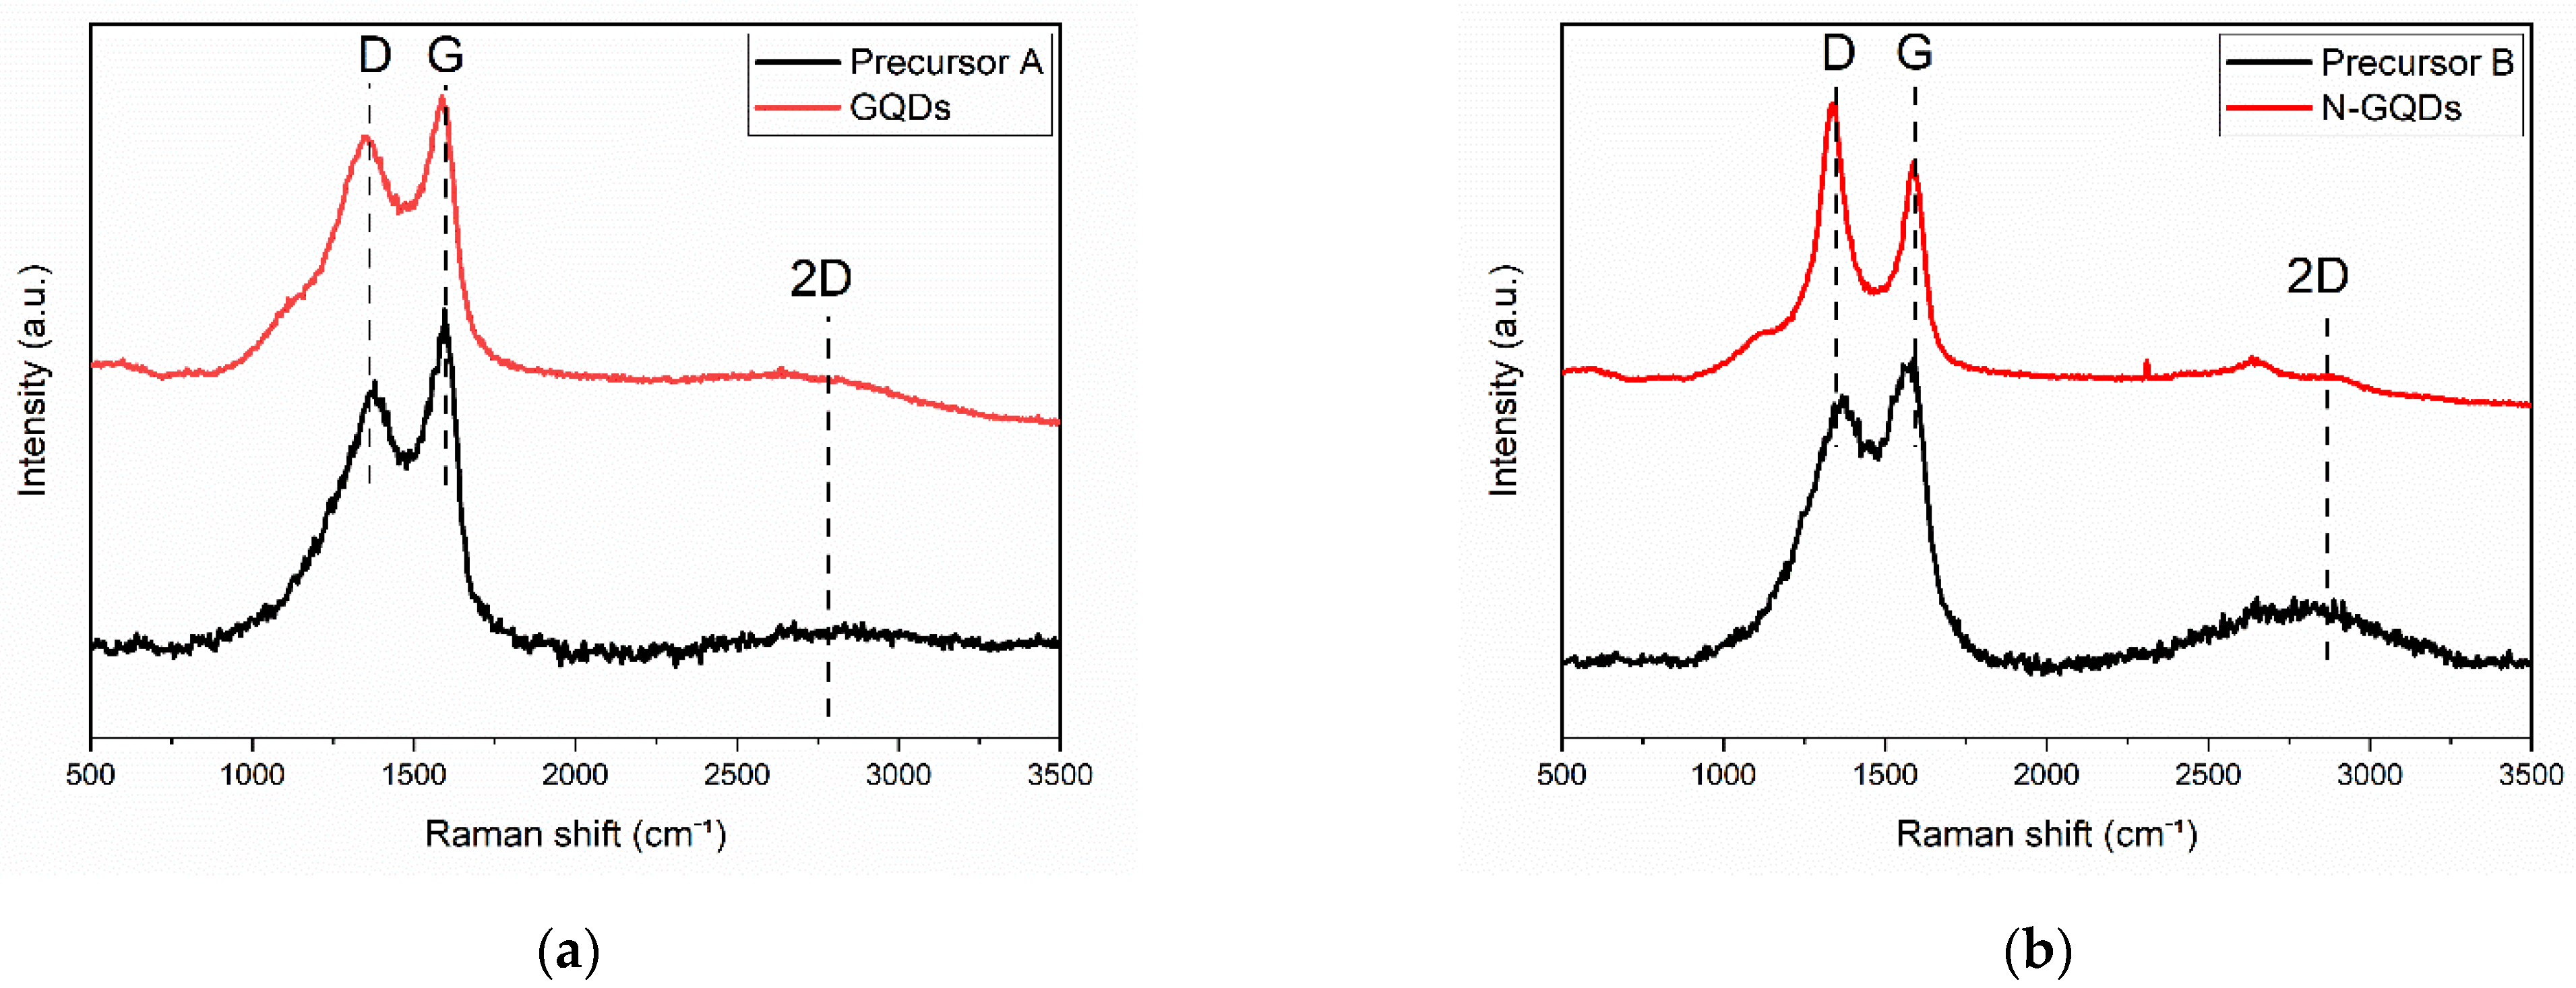
The Raman spectra obtained for the precursors without and with nitrogen doping (Precursors A and B) and for the GQDs obtained after treatment in DMSO are shown in Figure 5. The spectra of all samples showed a peak located at ~1360 cm−1, associated with the graphene D band, and a peak centered at approximately ~1585 cm−1, referring to the graphene G band. Furthermore, the spectra obtained showed a wide 2D band located at approximately ~2750 cm−1 [24,48].
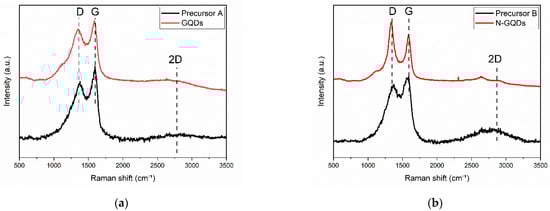
Figure 5.
Raman spectra obtained for (a) Precursor A and undoped GQDs and (b) Precursor B and N-GQDs.
The spectra of the precursors showed broad bands, which are typical of graphene oxide [49,50], corroborating the observations made in the XRD analyses. In this case, the Id/Ig ratio (considering the integrated intensities) for the precursor that did not go through the doping process (Precursor A) was 4.04 and for the precursor that went through the nitrogen reflux process (Precursor B), the Id/Ig ratio was 3.31. It was also noted that the 2D bands had a low intensity compared with the D and G bands, which is also compatible with the presence of graphene oxide in these samples [49].
The GQDs that did not undergo the nitrogen doping process showed a very similar Raman spectrum to the precursors. In this case, the Id/G ratio was 2.19. It is worth adding that the broadening of the bands in the Raman spectrum is also expected for graphene nanoparticles and nanoribbons, in which the size of the sp2 domains is also greatly reduced [49]. On the other hand, in the spectrum of the N-GQDs, the Raman bands of graphene were much narrower. The narrowing of the bands reveals that the size of the sp2 domains should be larger in this sample [49]. The Id/Ig ratio in this case was 1.45. The presence of an intense D band can also occur as a result of light scattering at the edges of graphene nanoparticles [49].
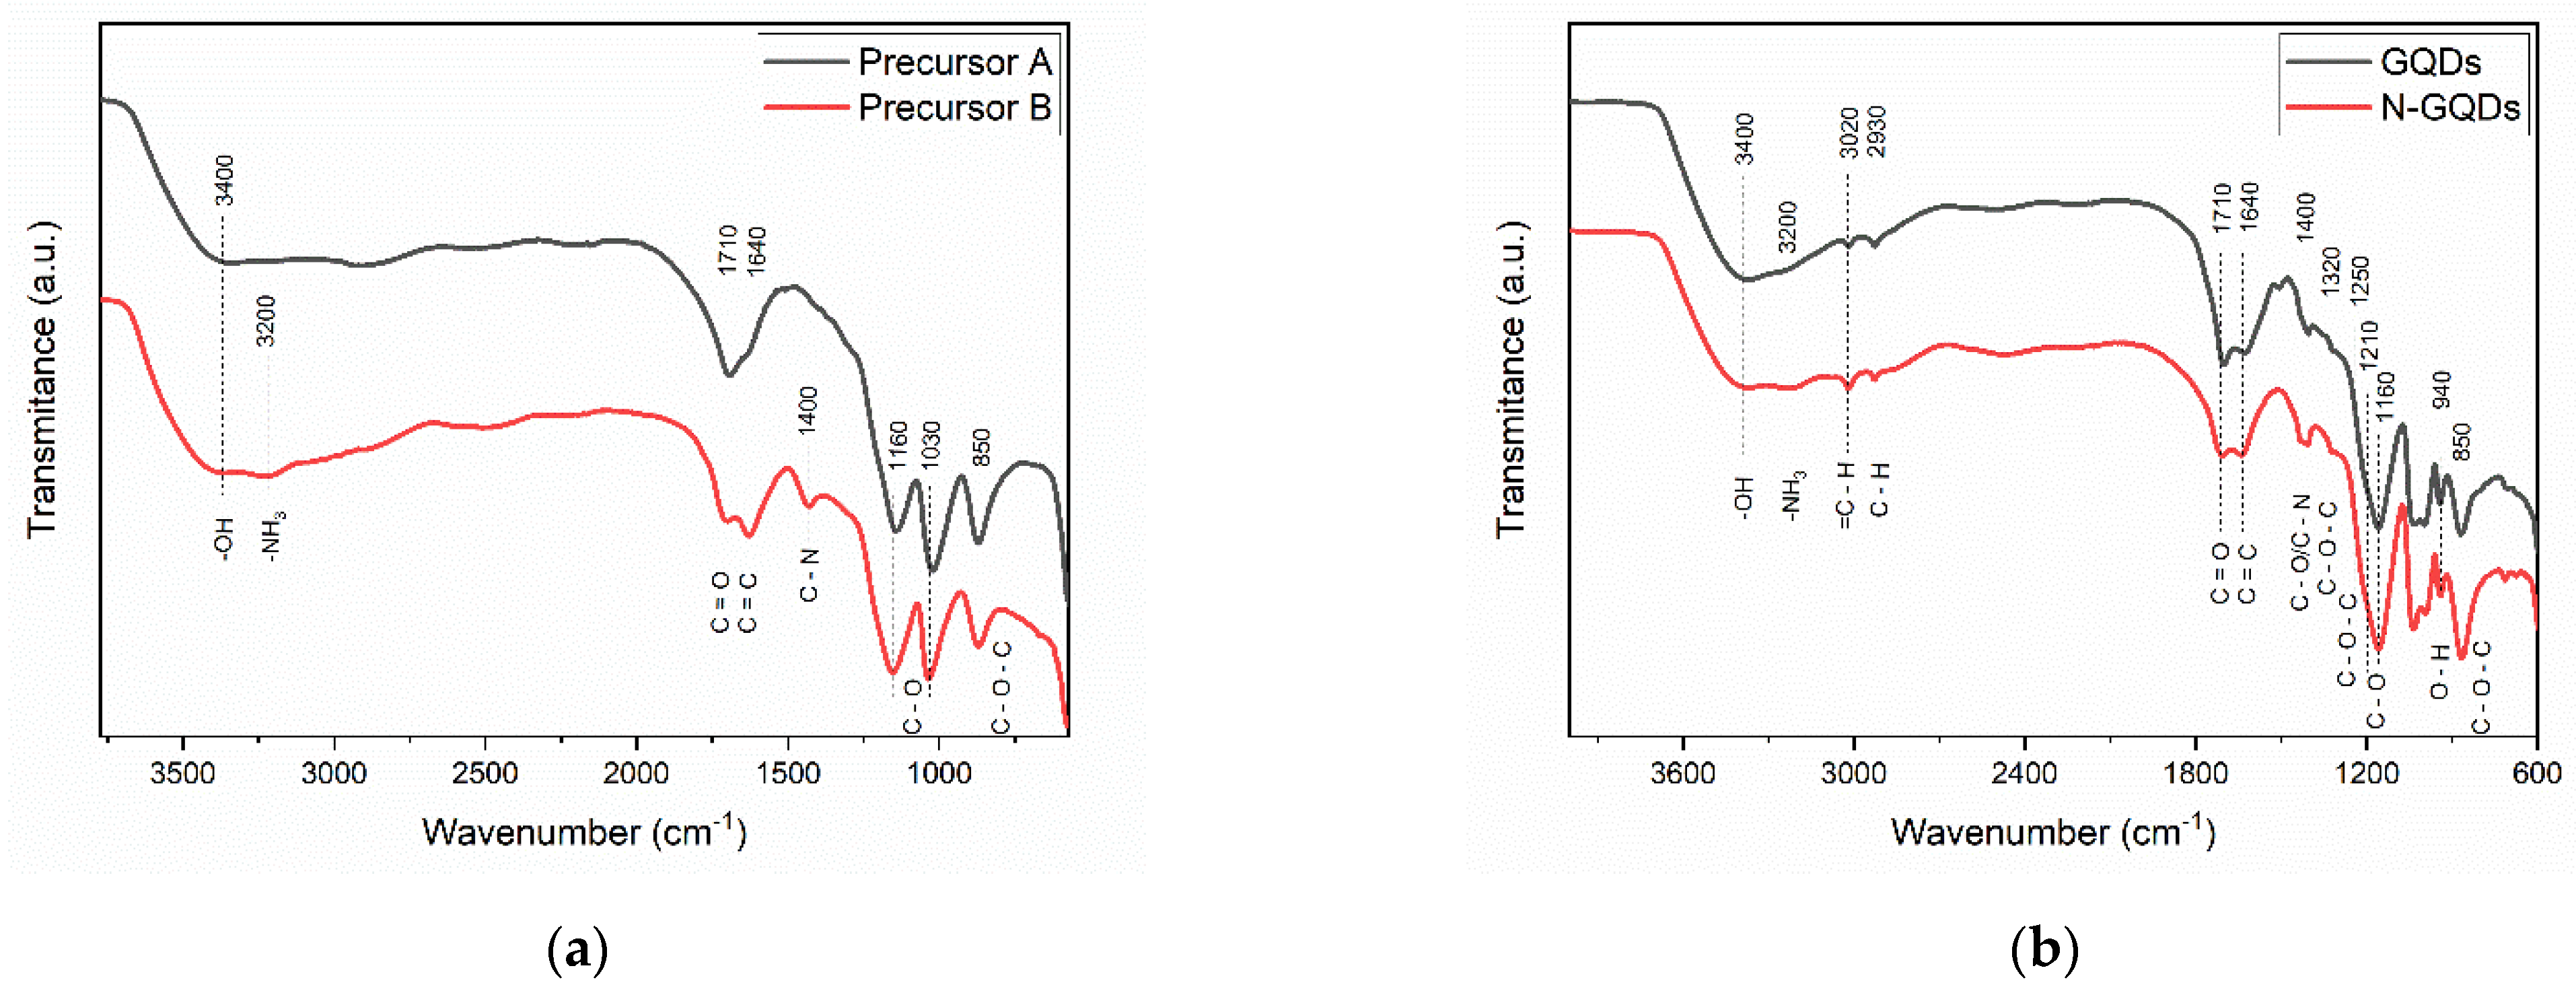
Figure 6 shows the FTIR spectrum of the precursor materials used for the synthesis of GQDs and the spectra of doped and undoped GQDs. In general, some of the absorption peaks were common to all samples: the peak centered at 3400 cm−1 is associated with the stretching of the -OH group [51,52]; the peak located at ~1710 cm−1 is associated with the presence of carbonyl groups (-C=O) in the GQD structure [52]; at 1640 cm−1, a peak was observed that is related to the C=C bonds of the aromatic rings that form the base structure of the GQDs [24,52]; absorption peaks located at 1160 and 1030 cm−1 are common in graphene oxide and are associated with bond stretching (C-O) of carboxylic acids [24,52]; and the peak centered at ~850 cm−1 is also common in graphene oxide and is associated with bond deformation (C-O-C) in epoxy groups [51,52]. In the FTIR spectrum of the precursor that was subjected to nitrogen reflux treatment, it is also possible to notice the appearance of an absorption peak at ~1400 cm−1. This peak is related to deformations of the bonds (C-N) in the amine groups in GQDs [52,53]. In general, the FTIR spectra of the precursors indicate that the material has a large number of functional groups with oxygen (carboxylic acids, epoxy, and hydroxyl groups) that are also quite common in graphene oxide.
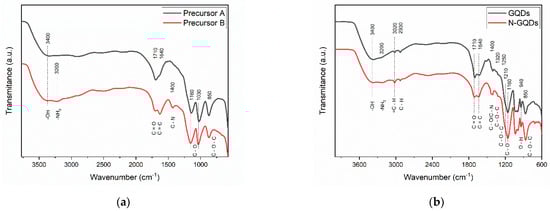
Figure 6.
FTIR spectra of (a) Precursors A and B and (b) undoped GQDs and N-GQDs.
The infrared absorption peaks that were observed in the precursors of the GQDs were also observed in the FTIR spectra of the GQDs after the DMSO reflux treatment. However, the emergence of new peaks was observed; namely, the absorption peak at 3020 cm−1 can be related to the stretching of bonds (C=C) in polycyclic aliphatic hydrocarbons, expected in graphene [24,52]; an absorption peak at ~2930 cm−1 was also noted, which was associated with the stretching of the bond (C-H) of alkane groups attached to the surfaces of graphene nanoparticles [51,52]; the peaks at 1320 and 1250 cm−1 may be associated with the stretching of the bonds of epoxy groups present in the GQDs (C-O-C) [52]; and the peaks present in the region between 1200 and 800 cm−1 are related to the vibrations of functional groups containing oxygen [52].
In general, the absorption spectra reflect the complex chemical composition of the GQDs obtained in this work. It should be noted that it is quite common for GQDs to present a chemical composition that is related to the precursor materials [1]. However, the appearance of peaks related to the presence of aromatic carbons in the GQDs is evidence that the treatment under reflux of DMSO was able to cause a reduction in the graphene oxide present in the precursors. Functional groups containing oxygen can also be used as bridges for the incorporation of new molecules, allowing the functionalization of GQDs, and may allow the incorporation of GQDs in solid hydrophilic matrices, such as polymers, and hybrid organic–inorganic films [31,54].
3.2. Absorption Spectra and Tauc Plots
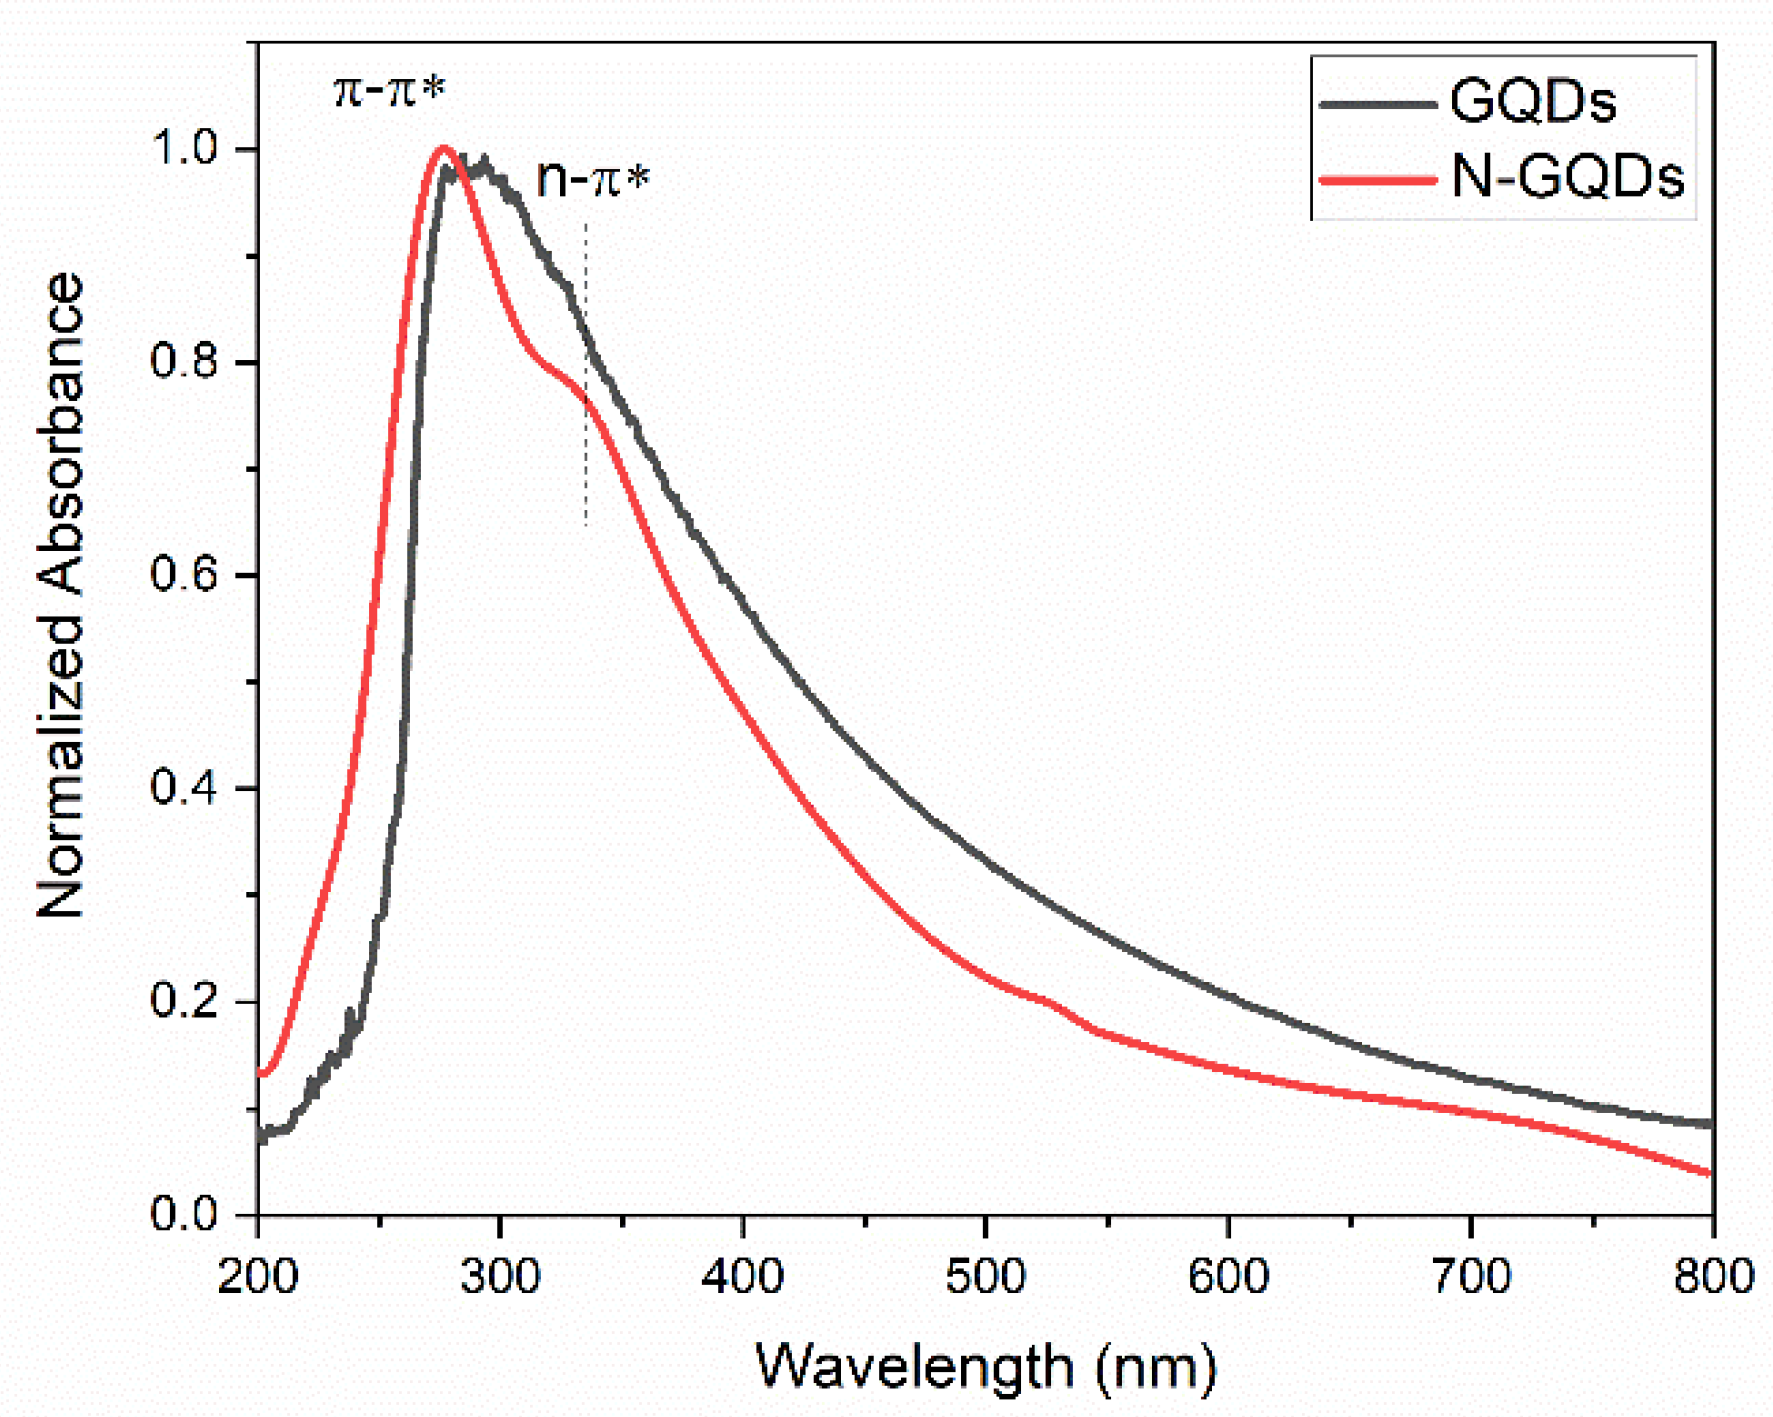
The UV–VIS absorption spectra of the GQDs produced in this work are shown in Figure 7. The absorption spectrum of the undoped GQDs showed an absorption peak centered at 275 nm, which refers to the π → π* transition related to the presence of sp2 hybridized carbons [4,55]. An absorption peak around 330 nm was also observed, which is associated with the n → π* transition, which occurs due to the presence of oxygen heteroatoms in the structure of the quantum dots [4,55]. The absorption spectrum of N-GQDs was wider and redshifted in relation to the absorption spectrum of undoped GQDs. The broadening of the absorption peak can be caused by the superposition of the absorption band referring to the π → π* transition centered at 280 nm with the n → π* transition, which must occur around 300 nm and extends up to 800 nm [4,55]. Theoretical analyses employing the Density Functional Theory (DFT) have already shown that the position of the absorption bands depends on the number of carbon atoms in the nanoparticles as well as the presence of heteroatoms and how they bind to GQDs [29]. In general, the presence of oxygen functional groups and the presence of nitrogen in the GQDs’ structure give rise to absorption bands that can extend from 300 to 1000 nm [29]. The DFT results also indicate that the presence of nitrogen atoms bound to pentatonic rings (pyrrole nitrogen) can give rise to the redshift of the absorption band, as observed in this work [30,56].
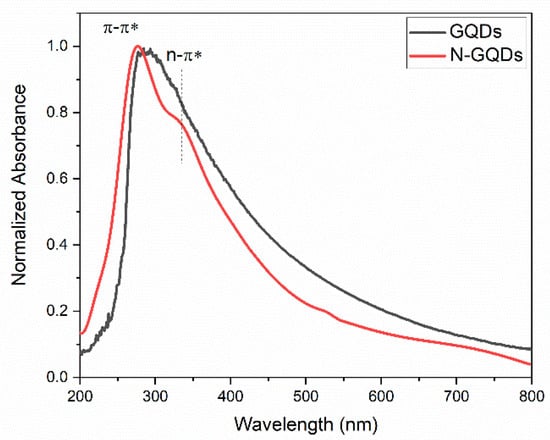
Figure 7.
UV–VIS absorption spectra of GQDs and N-GQDs.
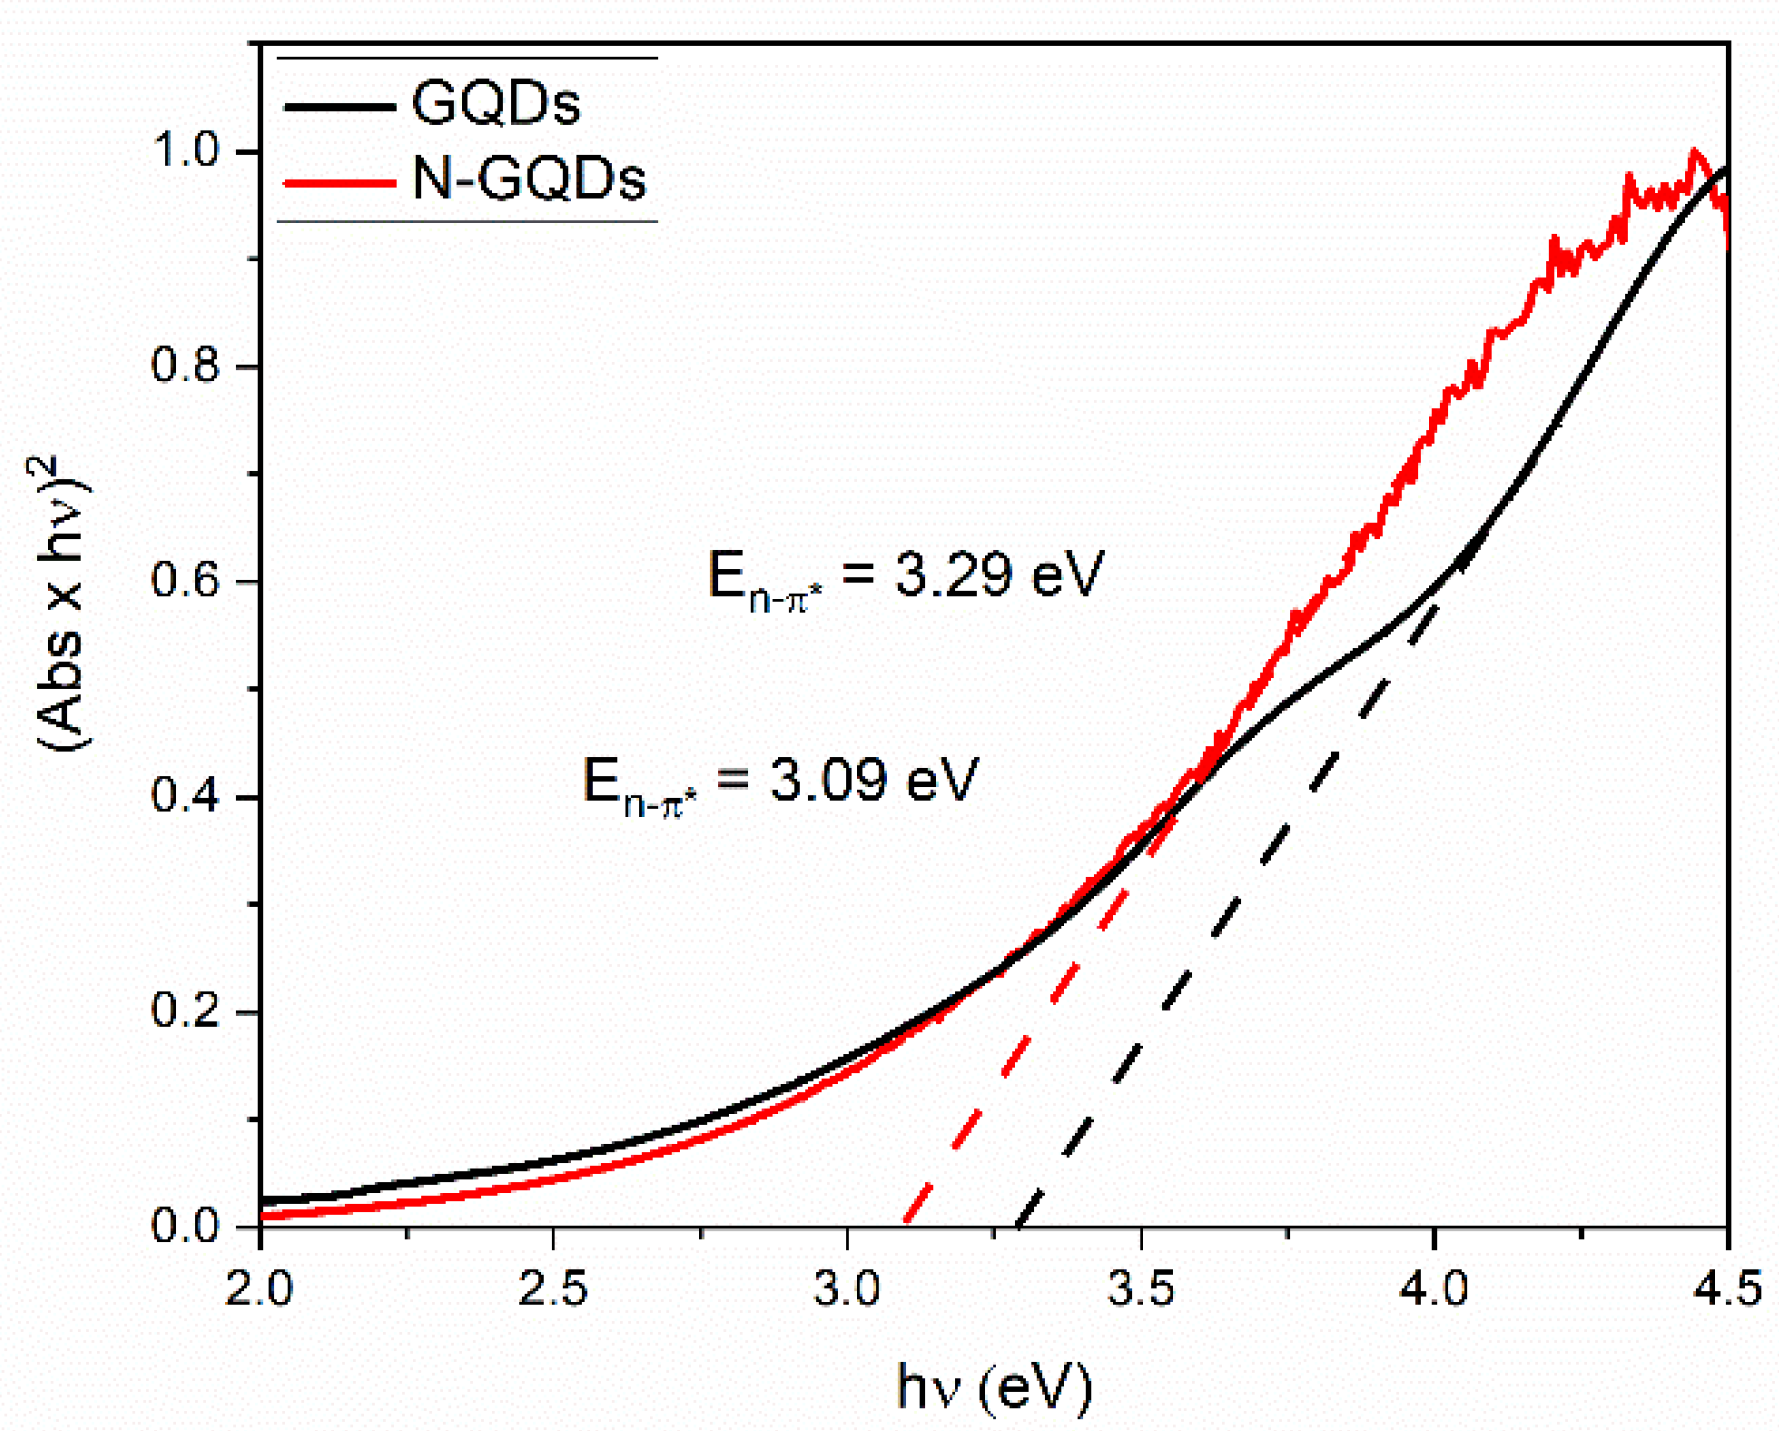
Tauc plots were obtained from the absorption spectra of the GQDs and are shown in Figure 8. The direct energy gaps associated with the n → π* transitions were 3.29 and 3.09 eV for the GQDs and the N-GQDs, respectively. Furthermore, it was evident that the transition at the edge of the conduction band was not abrupt, which is an indication that energy states originated by the presence of heteroatoms may extend to the bandgap region. The functional groups in the graphene lattice can act as electron donors, playing a role in the increase of the fermi energy of the GQDs [26]. It is noteworthy that N-GQDs presented a lower bandgap value associated with n–π* transitions. The lower bandgap value in the N-GQDs was associated with the higher density of energy states caused by the doping process, as already demonstrated in theoretical work [29].
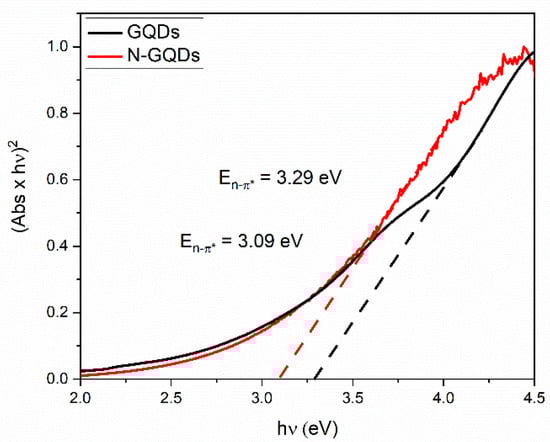
Figure 8.
Direct bandgap Tauc plots for GQDs and N-GQDs. The bandgap energies are determined by extrapolating the linear part of the absorption edge (dashed lines) to the x-axis at y = 0.
3.3. Photoluminescence (PL)
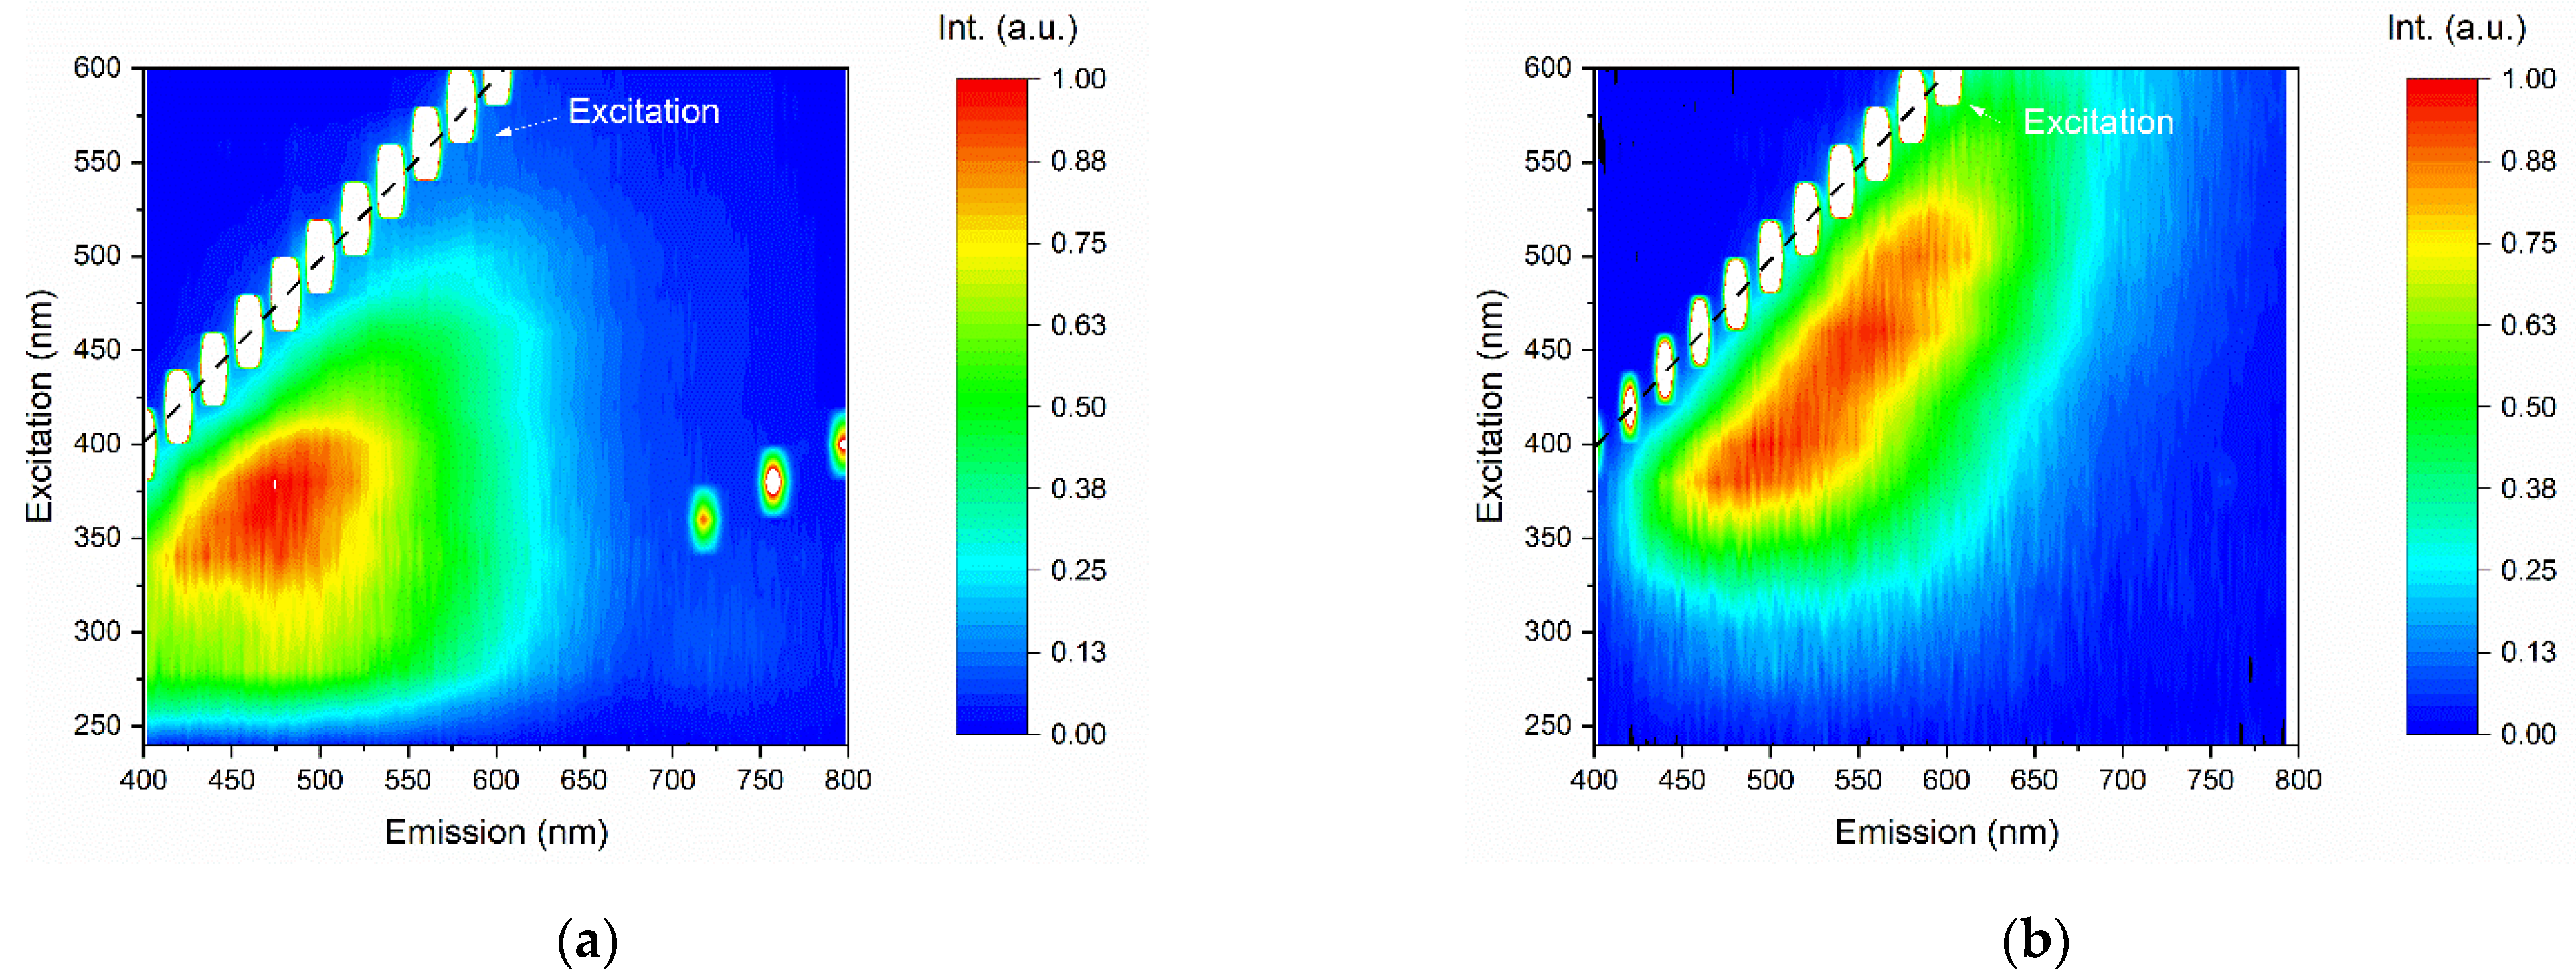
Figure 9 shows the PL contour plots of the GQDs for different excitation wavelengths, where the y-axis shows the excitation wavelengths, the x-axis shows the emission wavelengths, and the color bar scale indicates the PL intensity. The GQDs presented maximum PL intensity for excitation at ~350 nm. In this case, the emission band of the sample extended from approximately 400 to 650 nm. It is noteworthy that the excitation at 350 nm (~3.54 eV) was higher than the bandgap energy determined by the Tauc analysis (see Figure 7).

Figure 9.
Emission–excitation–intensity contour plots of (a) undoped GQDs and (b) N-GQDs.
In N-GQDs, it was observed that PL was clearly dependent on the excitation wavelength; when the sample was excited at ~350 nm, the photoluminescence behavior was similar to that of undoped GQDs samples, in which the luminescent emission extended from 450 to 650 nm, indicating that for excitations in the UV region, the luminescence mechanism occurs through an interband transition. However, the N-GQD nitrogen-doped sample also showed luminescent emission for a wide range of excitation wavelengths, from ~320 to 600 nm. It was also verified that the PL was redshifted when the sample was pumped at longer wavelengths of excitation.
The presence of heteroatoms, such as nitrogen and oxygen, is expected to establish new energy states in GQDs. In the literature, these states are called surface states [4,23] or defect states [12,48,55]. Theoretical studies involving density functional theory (DFT) have indicated that in quantum dots based on graphene monolayers, the presence of functional groups with oxygen can change the bandgap of the material, especially when they are present inside the quantum dot [28]. The effect of the bandgap change is, however, much smaller when the functional groups with oxygen are bound at the edges of the graphene particles [28]. In general, electron-donating functional groups, such as epoxy groups (C-O-C), hydroxyl groups (-OH), and ethers (-OCH3), act by decreasing the bandgap of the material, and electron accepting groups, such as aldehydes (-CHO) and carboxyls (-COOH), result in an increase in the quantum dot bandgap [28]. Nitrogen can be found in graphene in three configurations: graphitic nitrogen, pyridine nitrogen, and pyrrole nitrogen [27,29]. In all configurations, a decrease in the bandgap is observed in DFT analyses [30,31,56]. However, graphitic nitrogen allows the greatest reduction in bandgap [27,29]. In general, theoretical DFT studies concerning analyses of GQDs generally involve simulations of isolated particles with a known number of atoms in a specific solvent (generally water) [29]. On the other hand, experimental GQD suspensions have a wide variety of particles with distinct characteristics. In this way, the size distribution of the GQDs, the number of layers, and the presence of intrinsic defects (such as carbon vacancies) and extrinsic ones (such as the presence of heteroatoms) can also act to modify the densities of the energy states of the system [1,27]. The entire set of characteristics mentioned above can generate a complex mechanism for the photoluminescence of GQDs [1].
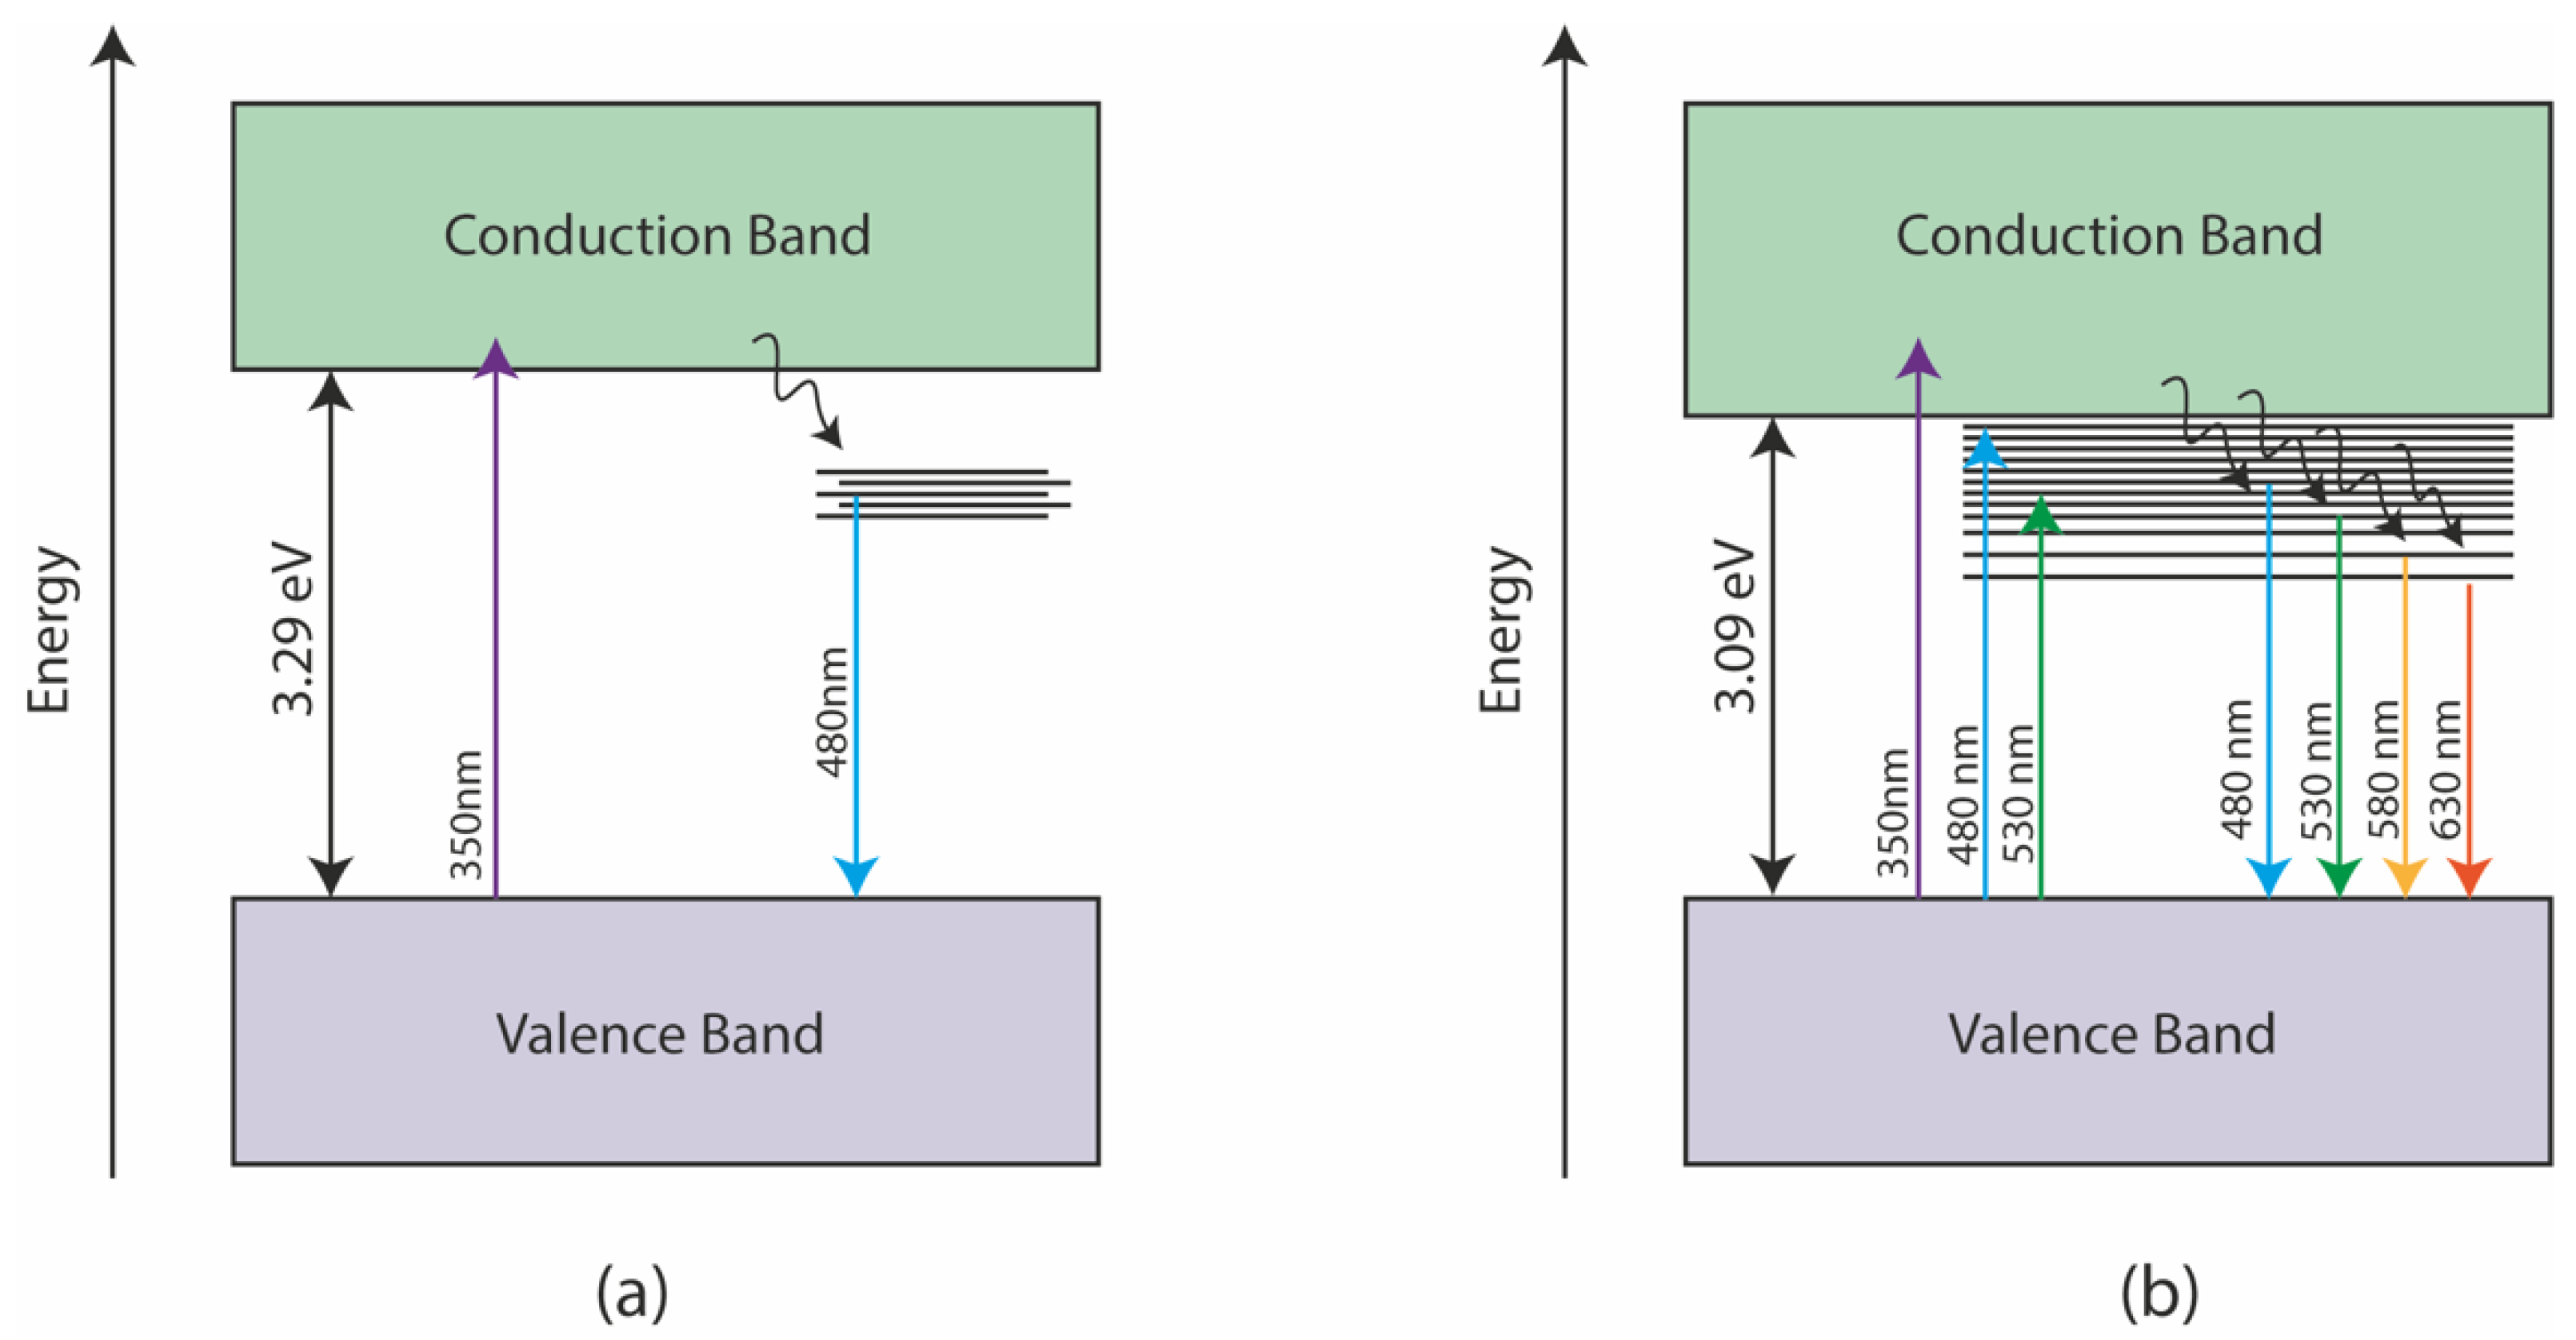
To better illustrate the influence of doping on GQDs, Figure 10 shows an illustration of some of the different possible paths for observing photoluminescence in doped and non-doped GQDs. The photoluminescence presented by undoped GQDs occurs primarily through an interband transition, excited by photons in the UV region, followed by non-radiative relaxations to energy states associated with oxygen functional groups. From heteroatoms energy states, radiative relaxations may occur with the emission of photons, mainly with wavelengths between 400 and 500 nm. In the case of N-GQDs, the increase in the density of states caused by doping with nitrogen opens the possibility of excitation with photons in the blue/green region. In this case, the energy transition occurs from the valence band to an energy state originated by the presence of heteroatoms; phonon relaxations can occur, shifting the emission spectrum to longer wavelengths. Thus, nitrogen doping makes it possible to increase the probability of radiative transitions in the green and red regions, while it allows the realization of PL tuning through the control of the excitation wavelength.
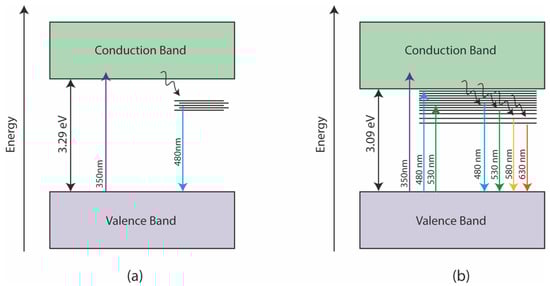
Figure 10.
Energy diagrams showing possible mechanisms for the PL of (a) GQDs and (b) N-GQDs. The energy states between the valence and conduction bands are inherent to the presence of heteroatoms in the structure of GQDs.
In general, this work showed that nitrogen doping was able to introduce energy states in the bandgap region of N-GQDs, allowing the observation of a highly tunable PL according to the excitation wavelength. On the other hand, the reflux treatment of DMSO may have contributed to the reduction of GQDs in order to minimize the presence of energy states associated with oxygen. We thus saw a much more intense PL in the red region for the N-GQDs since the energy states associated with nitrogen may have given rise to new mechanisms of lower-energy photon emission, as illustrated in Figure 10.
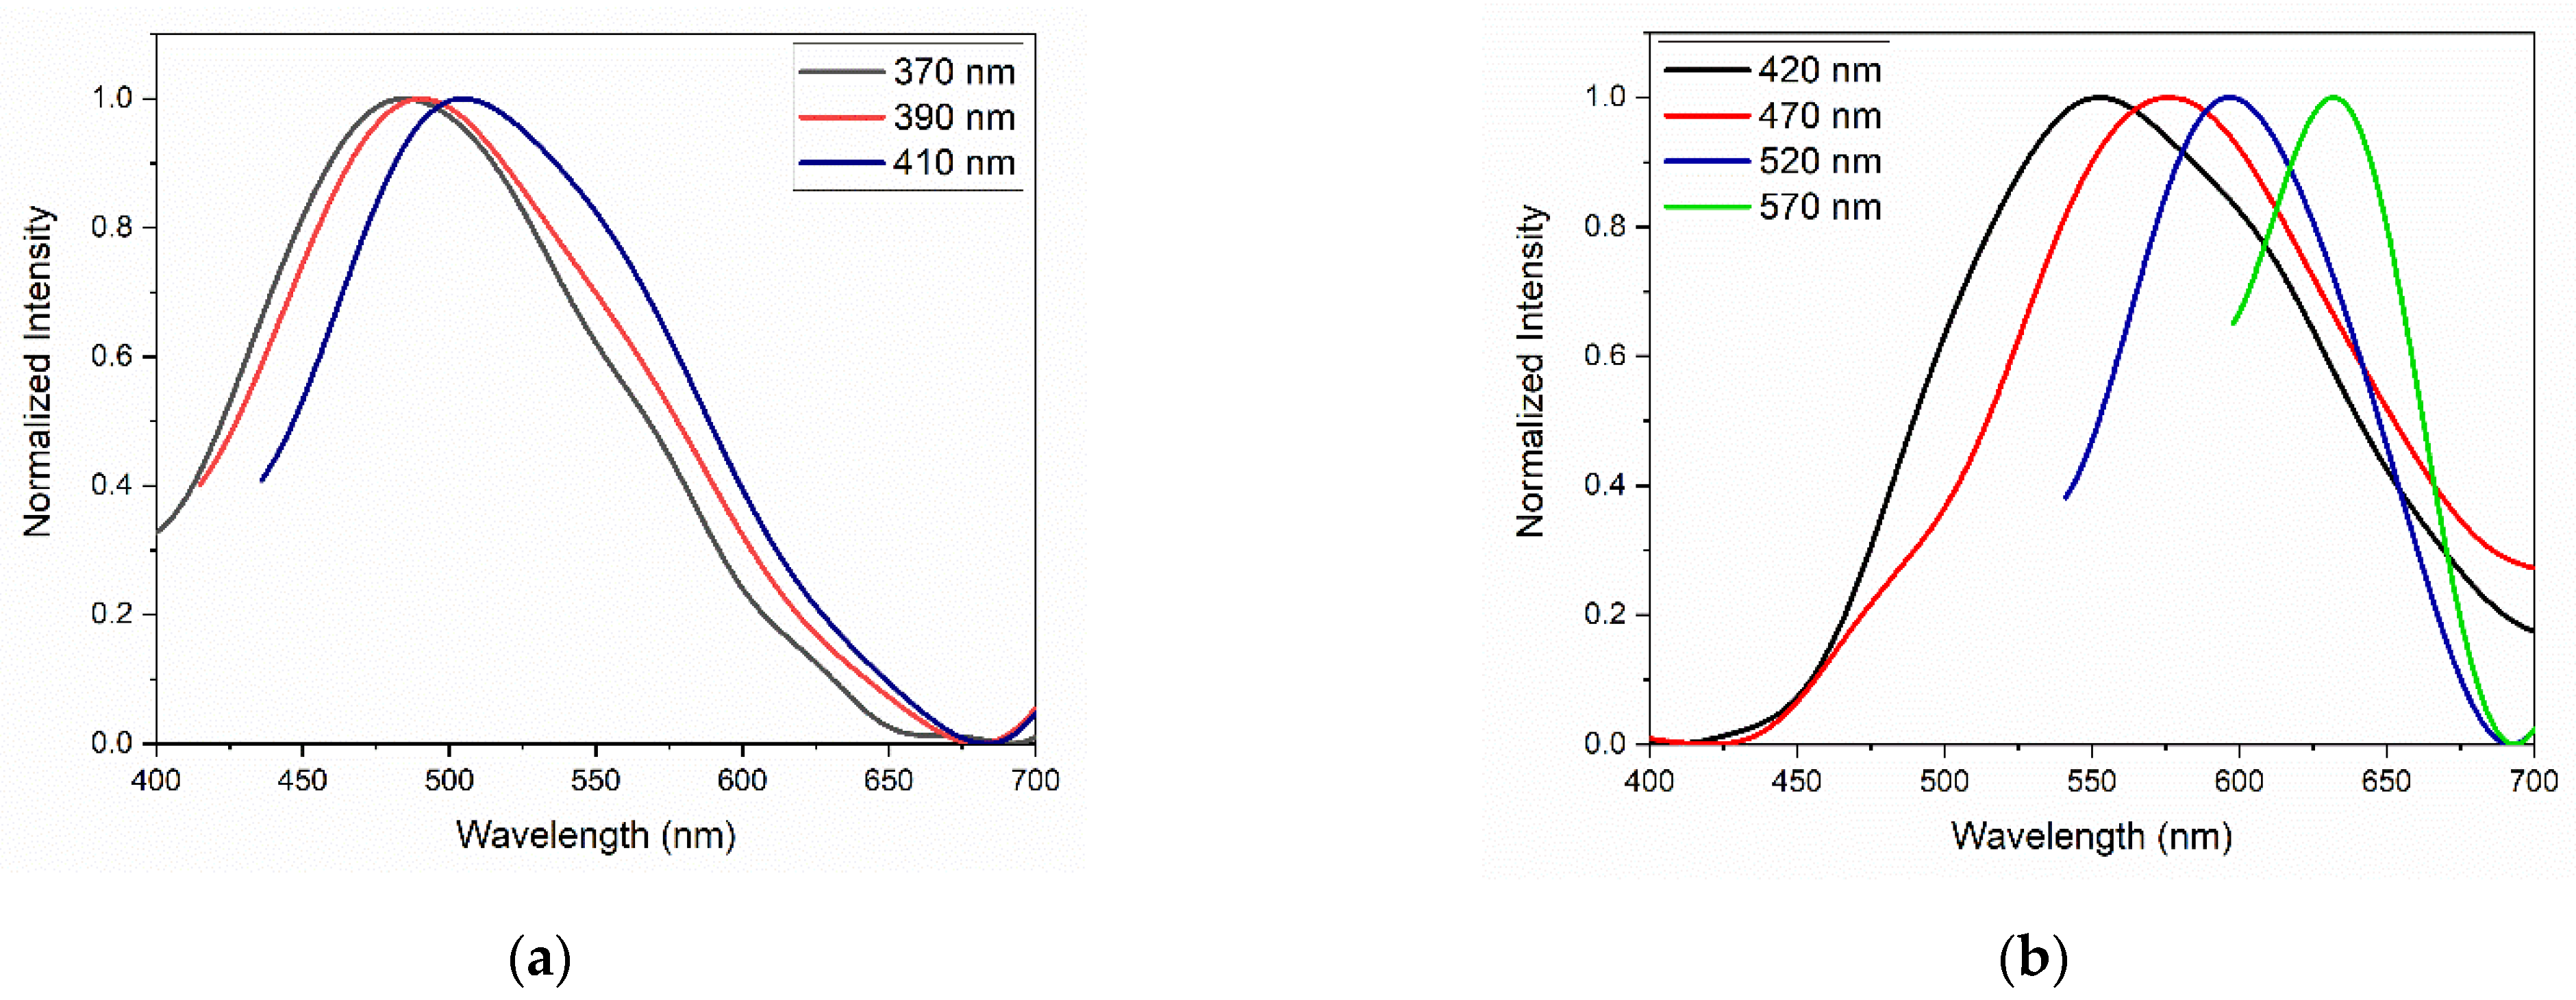
Figure 11 presents the normalized emission curves of the GQDs for different excitation wavelengths. As already observed in the graphs in Figure 10, the undoped GQDs presented an emission band that varies between 400 and 650 nm. The peak emission wavelength underwent a small shift to longer wavelengths as the excitation wavelength increased, which may be associated with the influence of the size distribution of the GQDs and the presence of oxygen heteroatoms [28]. In N-GQDs, the emission bands extended from 450 to 700 nm. However, the dependence of PL on the excitation wavelength was remarkable; the sample excited at 420 nm had an emission peak at approximately 550 nm, and the same sample, when excited at 570 nm, had an emission peak centered at 640 nm.
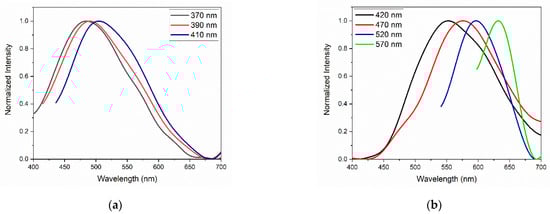
Figure 11.
PL of (a) GQDs and (b) N-GQDs under different excitation wavelengths.
To better visualize the possibility of tuning the PL of the GQDs, Figure 12 presents the chromaticity diagrams obtained for the GQDs dispersed in DMSO. Figure 12a shows the chromaticity diagram for the undoped GQDs. In this work, chromaticity diagrams of the CIE 1931 color space [57] were used. The points marked on the diagram indicate how the color of the luminescent emission is physiologically perceived by human vision, and its x and y coordinates were calculated from the emission spectra, according to the methodology indicated by the international light commission [57].
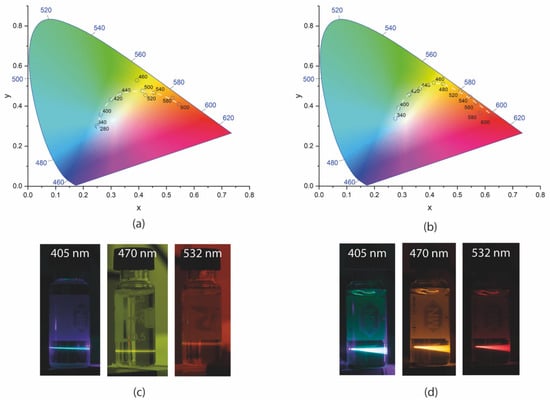
Figure 12.
CIE 1931 chromaticity diagram (a) of the GQDs and (b) of the N-GQDs under different excitations. White dashed lines are guides to the eye; photos of (c) undoped GQDs and (d) N-GQDs dispersed in DMSO and excited with cw lasers at 405, 470, and 532 nm, respectively.
For the GQDs without doping under excitation in the UV region, the occurrence of blue luminescent emission could be seen. As the wavelength increased, a shift in the color of the emission to the green region (for ~440 nm excitations), then to yellow (under ~500 nm excitation) and orange (under ~500 nm excitation), was observed. Emission in the blue region occurred due to interband transitions, as discussed earlier. The photos in Figure 12c illustrate the PL of the GQDs under excitation with cw lasers.
N-GQDs presented emissions closer to the center of the chromaticity diagram under UV light excitation, indicating the possibility of white light generation. The emission of green light was already obtained for excitations in the range of approximately 400 to 420 nm. PL in the yellow region could be obtained by exciting the N-GQDs between 460 and 480 nm. Luminescent emission in the orange region was observed for excitations between 480 and 560 nm. Finally, emission in the red region was observed for pumping wavelengths greater than 560 nm. The luminescence tuning range in the N-GQDs was superior to that of the undoped GQDs since, in this sample, it was possible to verify luminescent emission up to the red region. The photos in Figure 12d show the PL of N-GQDs under excitation with cw lasers of different wavelengths.
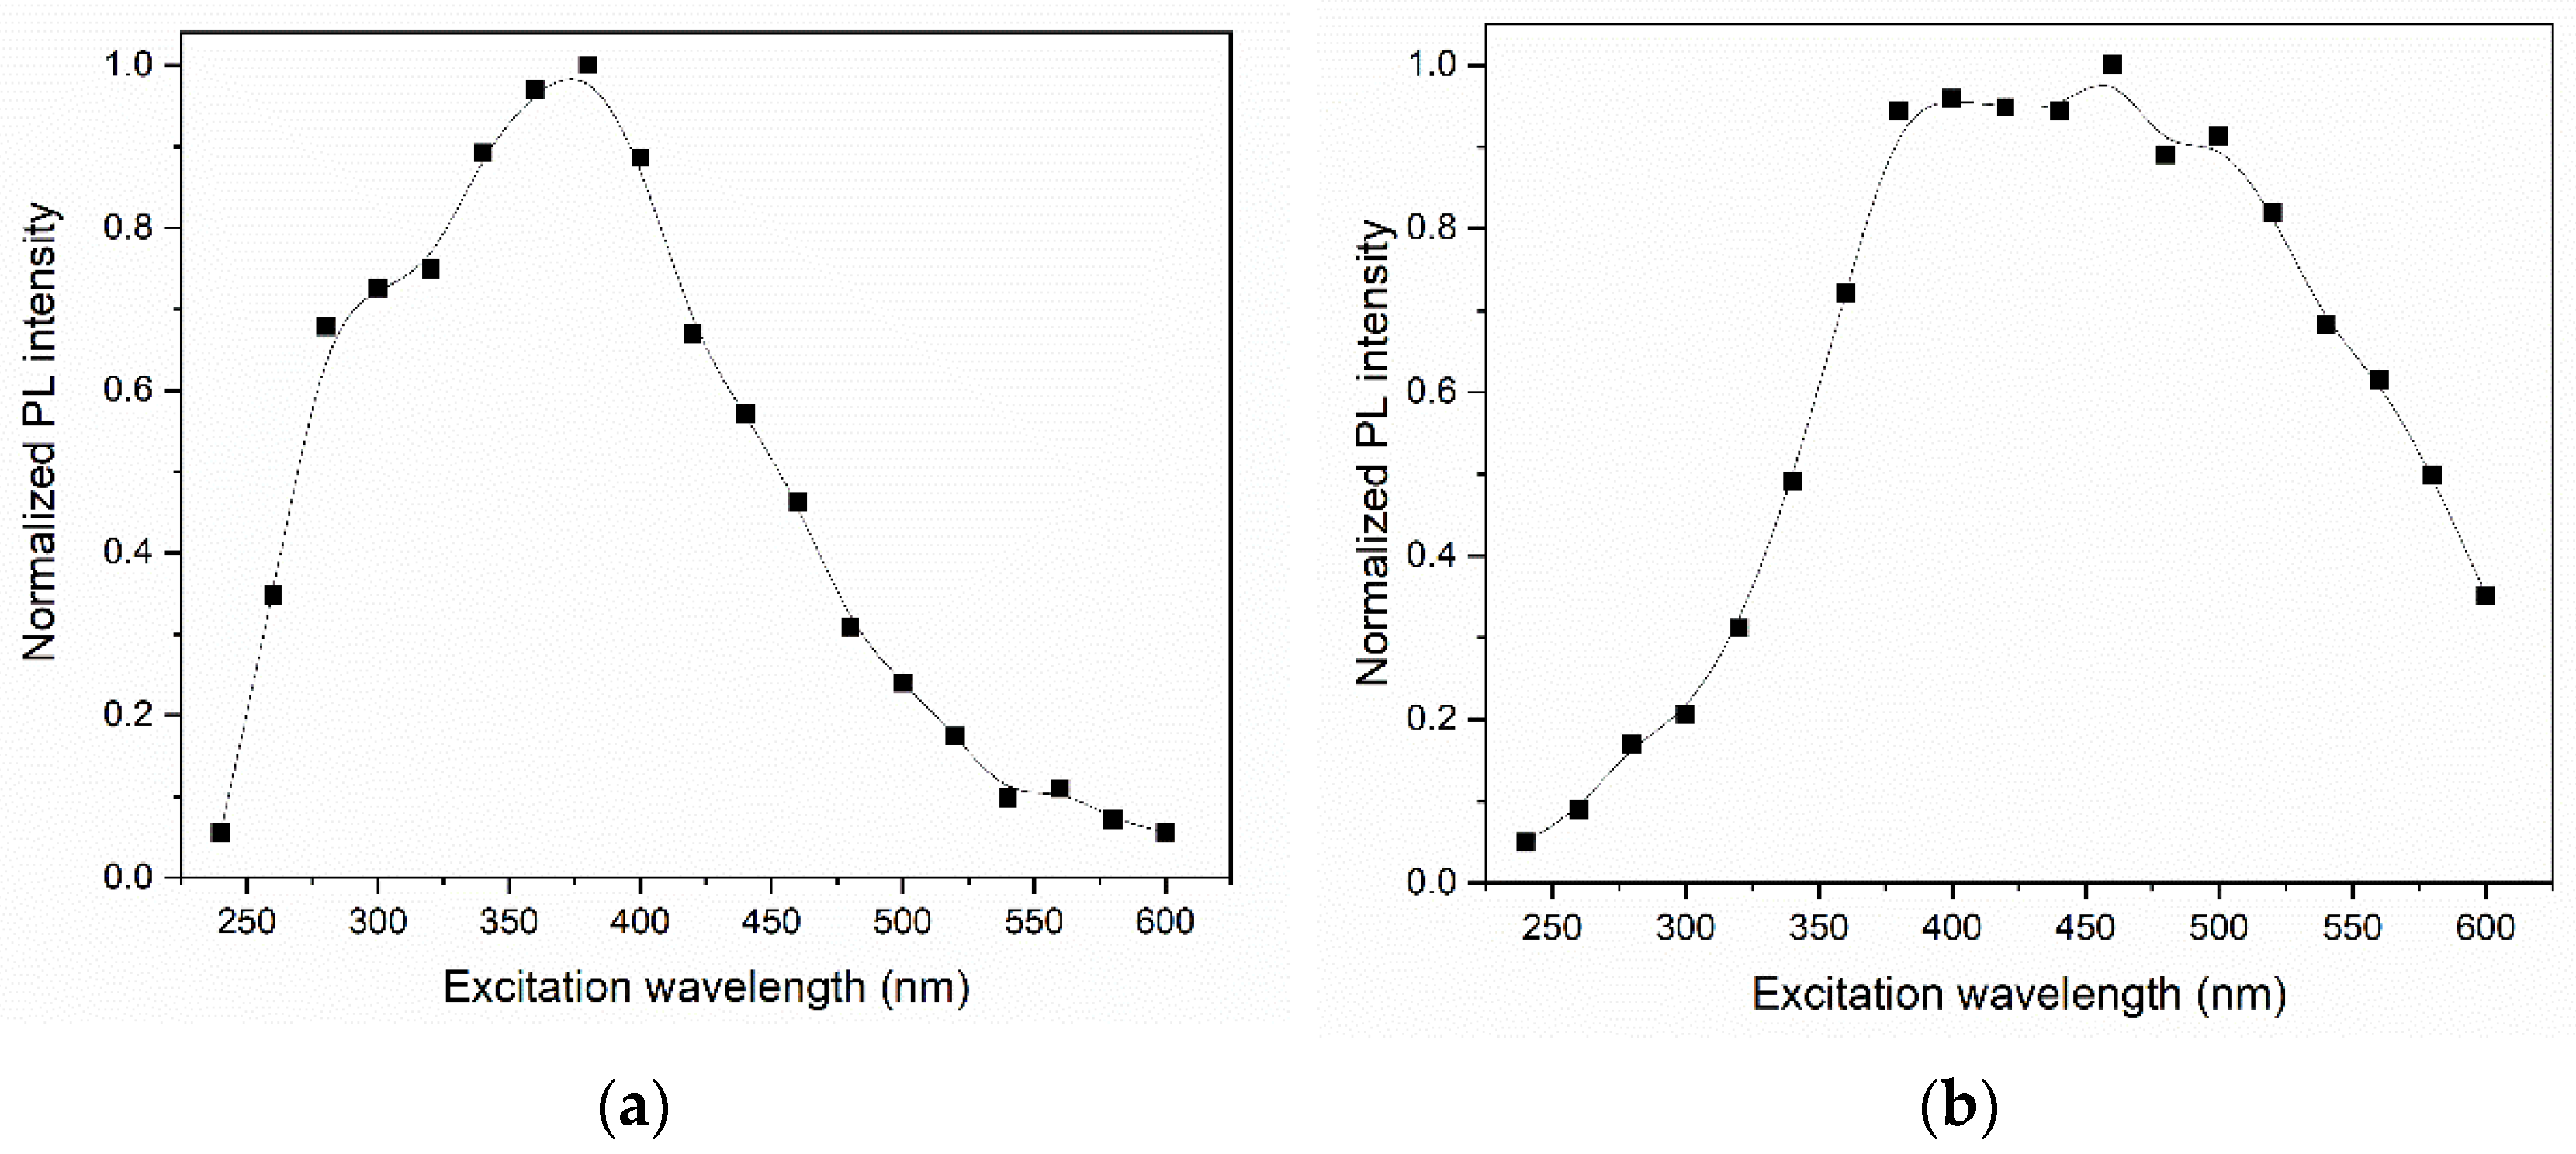
Although the chromaticity diagrams showed a possibility of tuning the luminescent emission in the GQDs without doping, it is worth mentioning that the PL in the non-blue regions was much less intense. Figure 13 shows the normalized maximum PL intensities presented by the GQDs as a function of the excitation wavelength. The PL intensity in the orange region (under excitation at ~550 nm) corresponded to less than 4% of the emission intensity in the blue region (under excitation at ~400 nm) for the same sample. In the case of N-GQDs, the intensity of the emission in the red region (under excitation at 550 nm) corresponded to approximately 45% of the intensity of the luminescent emission in the blue region (under excitation at ~400 nm). Figure 12 also shows that the luminescent emission between the white and green regions (under excitations between 375 and 500 nm) showed practically no differences in the PL intensity, quite different from what occurred for undoped GQDs. It is notable, therefore, that the emission tuning capability with N-GQDs was much higher than that with non-doped GQDs.
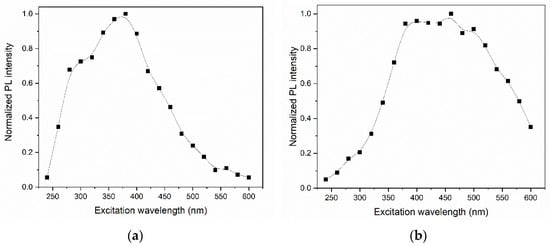
Figure 13.
Normalized maximum PL intensities for (a) GQDs and (b) N-GQDs as a function of excitation wavelength. The solid lines are just guides for the eye.
4. Conclusions
GQDs obtained from sucrose were successfully synthesized in this work. In general, the sizes of the nanoparticles obtained by AFM/TEM were between 1 and 20 nm for GQDs and between 1 and 6 nm for N-GQDs. XRD analyses showed that the DMSO treatment allowed the reduction of GQDs. The synthesized GQDs had several functional groups with oxygen, such as hydroxyl, carbonyl, epoxy, and carboxyl, among others. N-GQDs also had amine groups. The GQDs without doping presented PL in the blue region under excitation with UV light in the range of 300–400 nm. Doping GQDs with nitrogen could extend the luminescent emission range of GQDs and increase the PL intensity, mainly for the green to red region. Nitrogen doping should act to increase the density of states between the valence and conduction bands, resulting in a decrease in the bandgap of the system. The introduction of energy levels associated with the presence of nitrogen in the structure of GQDs can also give rise to a complex PL mechanism, facilitating the emission of lower-energy photons. The possibility of obtaining GQDs synthesized from sucrose with high quantum efficiency and emission in the green-red region is unprecedented. The methodologies used in this work can greatly simplify the processes of synthesis and doping of highly luminescent GQDs and encourage the use of more abundant precursors with low toxicity.
Author Contributions
Conceptualization, D.M.d.S.; methodology, A.P.d.M.R.; validation, M.I.A. and D.M.d.S.; formal analysis, M.I.A. and D.M.d.S.; investigation, A.P.d.M.R.; resources, D.M.d.S.; data curation, A.P.d.M.R.; writing—original draft preparation, A.P.d.M.R.; writing—review and editing, M.I.A. and D.M.d.S.; visualization, M.I.A.; supervision, M.I.A. and D.M.d.S.; project administration, D.M.d.S.; funding acquisition, M.I.A. and D.M.d.S. All authors have read and agreed to the published version of the manuscript.
Funding
This work was supported by the Brazilian agencies Conselho Nacional de Desenvolvimento Científico e Tecnológico (CNPq, Grant: 431162/2018-2 and 303468/2021-1); the National Institute of Photonics (INCT de Fotônica/CNPq, Grant: 465.763/2014); and the Coordenação de Aperfeiçoamento de Pessoal de Nível Superior (CAPES).
Institutional Review Board Statement
Not applicable.
Informed Consent Statement
Not applicable.
Data Availability Statement
Not applicable.
Acknowledgments
We acknowledge Laboratório de Cristalografia (Institute of Physics, University of Sao Paulo) for XRD measurements, Centro da Tecnologia e Informação Renato Archer for FTIR analysis, and Laboratório de Química Supramolecular e Nanotecnologia (Institute of Chemistry, University of Sao Paulo) for AFM analysis.
Conflicts of Interest
The authors declare no conflict of interest.
References
- Zhu, Z.; Zhai, Y.; Li, Z.; Zhu, P.; Mao, S.; Zhu, C.; Du, D.; Belfiore, L.A.; Tang, J.; Lin, Y. Red carbon dots: Optical property regulations and applications. Mater. Today 2019, 30, 52–79. [Google Scholar] [CrossRef]
- Sk, M.A.; Ananthanarayanan, A.; Huang, L.; Lim, K.H.; Chen, P. Revealing the tunable photoluminescence properties of graphene quantum dots. J. Mater. Chem. C 2014, 2, 6954–6960. [Google Scholar] [CrossRef]
- Gao, T.; Wang, X.; Yang, L.Y.; He, H.; Ba, X.X.; Zhao, J.; Jiang, F.L.; Liu, Y. Red, yellow, and blue luminescence by graphene quantum dots: Syntheses, mechanism, and cellular imaging. ACS Appl. Mater. Interfaces 2017, 9, 24846–24856. [Google Scholar] [CrossRef] [PubMed]
- Rajender, G.; Goswami, U.; Giri, P.K. Solvent dependent synthesis of edge-controlled graphene quantum dots with high photoluminescence quantum yield and their application in confocal imaging of cancer cells. J. Colloid Interface Sci. 2019, 541, 387–398. [Google Scholar] [CrossRef]
- Bhunia, S.K.; Saha, A.; Maity, A.R.; Ray, S.C.; Jana, N.R. Carbon nanoparticle-based fluorescent bioimaging probes. Sci. Rep. 2013, 3, 1473. [Google Scholar] [CrossRef]
- Tang, Q.; Zhu, W.; He, B.; Yang, P. Rapid conversion from carbohydrates to large-scale carbon quantum dots for all-weather solar cells. ACS Nano 2017, 11, 1540–1547. [Google Scholar] [CrossRef]
- Li, X.; Rui, M.; Song, J.; Shen, Z.; Zeng, H. Carbon and graphene quantum dots for optoelectronic and energy devices: A review. Adv. Funct. Mater. 2015, 25, 4929–4947. [Google Scholar] [CrossRef]
- Bak, S.; Kim, D.; Lee, H. Graphene quantum dots and their possible energy applications: A review. Curr. Appl. Phys. 2016, 16, 1192–1201. [Google Scholar] [CrossRef]
- Heng, Z.W.; Chong, W.C.; Pang, Y.L.; Koo, C.H. An overview of the recent advances of carbon quantum dots/metal oxides in the application of heterogeneous photocatalysis in photodegradation of pollutants towards visible-light and solar energy exploitation. J. Environ. Chem. Eng. 2021, 9, 105199. [Google Scholar] [CrossRef]
- Fernando, K.A.S.; Sahu, S.; Liu, Y.; Lewis, W.K.; Guliants, E.A.; Jafariyan, A.; Wang, P.; Bunker, C.E.; Sun, Y.P. Carbon quantum dots and applications in photocatalytic energy conversion. ACS Appl. Mater. Interfaces 2015, 7, 8363–8376. [Google Scholar] [CrossRef]
- Li, M.; Chen, T.; Gooding, J.J.; Liu, J. Review of carbon and graphene quantum dots for sensing. ACS Sens. 2019, 4, 1732–1748. [Google Scholar] [CrossRef] [PubMed]
- Sun, X.; Lei, Y. Fluorescent carbon dots and their sensing applications. TrAC-Trends Anal. Chem. 2017, 89, 163–180. [Google Scholar]
- Jin, Z.; Owour, P.; Lei, S.; Ge, L. Graphene, graphene quantum dots and their applications in optoelectronics. Curr. Opin. Colloid Interface Sci. 2015, 20, 439–453. [Google Scholar]
- Ghosh, D.; Sarkar, K.; Devi, P.; Kim, K.H.; Kumar, P. Current and future perspectives of carbon and graphene quantum dots: From synthesis to strategy for building optoelectronic and energy devices. Renew. Sustain. Energy Rev. 2021, 135, 110391. [Google Scholar]
- Tajik, S.; Dourandish, Z.; Zhang, K.; Beitollahi, H.; Le, Q.V.; Jang, H.W.; Shokouhimehr, M. Carbon and graphene quantum dots: A review on syntheses, characterization, biological and sensing applications for neurotransmitter determination. RSC Adv. 2020, 10, 15406–15429. [Google Scholar] [CrossRef] [PubMed]
- Pal, A.; Sk, M.P.; Chattopadhyay, A. Recent advances in crystalline carbon dots for superior application potential. Mater. Adv. 2020, 1, 525–553. [Google Scholar]
- Xu, Q.; Cai, W.; Li, W.; Sreeprasad, T.S.; He, Z.; Ong, W.J.; Li, N. Two-dimensional quantum dots: Fundamentals, photoluminescence mechanism and their energy and environmental applications. Mater. Today Energy 2018, 10, 222–240. [Google Scholar]
- Yan, F.; Sun, Z.; Zhang, H.; Sun, X.; Jiang, Y.; Bai, Z. The fluorescence mechanism of carbon dots, and methods for tuning their emission color: A review. Microchim. Acta 2019, 186, 583. [Google Scholar]
- Wang, L.; Wang, Y.; Xu, T.; Liao, H.; Yao, C.; Liu, Y.; Li, Z.; Chen, Z.; Pan, D.; Sun, L.; et al. Gram-scale synthesis of single-crystalline graphene quantum dots with superior optical properties. Nat. Commun. 2014, 5, 5357. [Google Scholar] [CrossRef]
- Thang, P.N.; Hung, L.X.; Thuan, D.N.; Loan, N.T.; Binard, G.; de Marcillac, W.D.; Maître, A.; Liem, N.Q.; Coolen, L.; Nga, P.T. Surface-enhanced raman scattering from semiconductor and graphene quantum dots coupled to metallic-film-on-nanosphere substrates. Appl. Phys. A Mater. Sci. Process. 2019, 125, 337. [Google Scholar] [CrossRef]
- Jelinek, R. Carbon Quantum Dots: Synthesis, Properties and Applications; Springer: Cham, Switzerland, 2017. [Google Scholar]
- Liu, H.; Ye, T.; Mao, C. Fluorescent carbon nanoparticles derived from candle soot. Angew. Chem.-Int. Ed. 2007, 46. [Google Scholar] [CrossRef] [PubMed]
- Song, Z.; Quan, F.; Xu, Y.; Liu, M.; Cui, L.; Liu, J. Multifunctional N,S Co-doped carbon quantum dots with PH- and thermo-dependent switchable fluorescent properties and highly selective detection of glutathione. Carbon N. Y. 2016, 104, 169–178. [Google Scholar] [CrossRef]
- Kharangarh, P.R.; Umapathy, S.; Singh, G. Effect of defects on quantum yield in blue emitting photoluminescent nitrogen doped graphene quantum dots. J. Appl. Phys. 2017, 122, 145107. [Google Scholar] [CrossRef]
- Li, X.F.; Lian, K.Y.; Liu, L.; Wu, Y.; Qiu, Q.; Jiang, J.; Deng, M.; Luo, Y. Unraveling the formation mechanism of graphitic nitrogen-doping in thermally treated graphene with ammonia. Sci. Rep. 2016, 6, 23495. [Google Scholar] [CrossRef] [PubMed]
- He, S.; Turnbull, M.J.; Nie, Y.; Sun, X.; Ding, Z. Band structures of blue luminescent nitrogen-doped graphene quantum dots by synchrotron-based xps. Surf. Sci. 2018, 676, 51–55. [Google Scholar] [CrossRef]
- Feng, J.; Guo, Q.; Song, N.; Liu, H.; Dong, H.; Chen, Y.; Yu, L.; Dong, L. Density functional theory study on optical and electronic properties of Co-doped graphene quantum dots based on different nitrogen doping patterns. Diam. Relat. Mater. 2021, 113, 108264. [Google Scholar] [CrossRef]
- Feng, J.; Dong, H.; Yu, L.; Dong, L. The optical and electronic properties of graphene quantum dots with oxygen-containing groups: A density functional theory study. J. Mater. Chem. C 2017, 5, 5984–5993. [Google Scholar] [CrossRef]
- Feng, J.; Dong, H.; Pang, B.; Shao, F.; Zhang, C.; Yu, L.; Dong, L. Theoretical study on the optical and electronic properties of graphene quantum dots doped with heteroatoms. Phys. Chem. Chem. Phys. 2018, 20, 15244–15252. [Google Scholar] [CrossRef]
- Tian, Z.; Zhang, X.; Li, D.; Zhou, D.; Jing, P.; Shen, D.; Qu, S.; Zboril, R.; Rogach, A.L. Full-color inorganic carbon dot phosphors for white-light-emitting diodes. Adv. Opt. Mater. 2017, 5, 1700416. [Google Scholar] [CrossRef]
- Mura, S.; Ludmerczki, R.; Stagi, L.; Garroni, S.; Carbonaro, C.M.; Ricci, P.C.; Casula, M.F.; Malfatti, L.; Innocenzi, P. Integrating sol-gel and carbon dots chemistry for the fabrication of fluorescent hybrid organic-inorganic films. Sci. Rep. 2020, 10, 4770. [Google Scholar] [CrossRef]
- Pei, Y.; Chang, A.Y.; Liu, X.; Wang, H.; Zhang, H.; Radadia, A.; Wang, Y.; Yu, W.W.; Wang, S. Nitrogen-doped carbon dots from kraft lignin waste with inorganic acid catalyst and their brain cell imaging applications. AIChE J. 2021, 67, e17132. [Google Scholar] [CrossRef]
- Naik, V.; Gunjal, D.; Gore, A.; Pawar, S.; Mahanwar, S.; Anbhule, P.; Kolekar, G. Quick and low cost synthesis of sulphur doped carbon dots by simple acidic carbonization of sucrose for the detection of Fe3+ ions in highly acidic environment. Diam. Relat. Mater. 2018, 88, 262–268. [Google Scholar] [CrossRef]
- Ansi, V.A.; Renuka, N.K. Science direct sucrose derived luminescent carbon dots as a promising bio- medical agent. Mater. Today Proc. 2019, 18, 1724–1728. [Google Scholar] [CrossRef]
- Peng, H.; Travas-Sejdic, J. Simple aqueous solution route to luminescent carbogenic dots from carbohydrates. Chem. Mater. 2009, 21, 5563–5565. [Google Scholar] [CrossRef]
- Mistry, B.; Machhi, H.K.; Vithalani, R.S.; Patel, D.S.; Modi, C.K.; Prajapati, M.; Surati, K.R.; Soni, S.S.; Jha, P.K.; Kane, S.R. Harnessing the N-dopant ratio in carbon quantum dots for enhancing the power conversion efficiency of solar cells. Sustain. Energy Fuels 2019, 3, 3182–3190. [Google Scholar] [CrossRef]
- Zhang, J.; Shen, W.; Pan, D.; Zhang, Z.; Fang, Y.; Wu, M. Controlled synthesis of green and blue luminescent carbon nanoparticles with high yields by the carbonization of sucrose. New J. Chem. 2010, 34, 591–593. [Google Scholar] [CrossRef]
- Jiang, K.; Sun, S.; Zhang, L.; Lu, Y.; Wu, A.; Cai, C.; Lin, H. Red, green, and blue luminescence by carbon dots: Full-color emission tuning and multicolor cellular imaging. Angew. Chem.-Int. Ed. 2015, 54, 5360–5363. [Google Scholar] [CrossRef]
- Liu, J.; Dong, Y.; Ma, Y.; Han, Y.; Ma, S.; Chen, H.; Chen, X. One-step synthesis of red/green dual-emissive carbon dots for ratiometric sensitive onoo- probing and cell imaging. Nanoscale 2018, 10, 13589–13598. [Google Scholar] [CrossRef]
- Li, D.; Li, W.; Zhang, H.; Zhang, X.; Zhuang, J.; Liu, Y.; Hu, C.; Lei, B. Far-red carbon dots as Efficient light-harvesting agents for enhanced photosynthesis. ACS Appl. Mater. Interfaces 2020, 12, 21009–21019. [Google Scholar] [CrossRef]
- Tien, H.N.; Luan, V.H.; Lee, T.K.; Kong, B.S.; Chung, J.S.; Kim, E.J.; Hur, S.H. Enhanced solvothermal reduction of graphene oxide in a mixed solution of sulfuric acid and organic solvent. Chem. Eng. J. 2012, 211–212, 97–103. [Google Scholar] [CrossRef]
- Deeksha, S.; Buerkle, M.; Brunet, P.; Maddi, C.; Babu, D.; Morelli, A.; Farokh, A.; Maguire, P.; Mariotti, D.; Svrcek, V. The importance of surface states in N-doped carbon quantum dots. Carbon N. Y. 2021, 183, 1–11. [Google Scholar] [CrossRef]
- Johra, F.T.; Lee, J.W.; Jung, W.G. Facile and safe graphene preparation on solution based platform. J. Ind. Eng. Chem. 2014, 20, 2883–2887. [Google Scholar] [CrossRef]
- Tasdemir, A.; Kopuklu, B.B.; Kirlioglu, A.C.; Gursel, S.A.; Yurum, A. The influence of nitrogen doping on reduced graphene oxide as highly cyclable li-ion battery anode with enhanced performance. Int. J. Hydrogen Energy 2021, 46, 11865–11877. [Google Scholar] [CrossRef]
- Gao, W.; Alemany, L.B.; Ci, L.; Ajayan, P.M. New insights into the structure and reduction of graphite oxide. Nat. Chem. 2009, 1, 403–408. [Google Scholar] [CrossRef]
- Soares, C.P.P.; Baptista, R.D.L.; Cesar, D.V. Solvothermal reduction of graphite oxide using alcohols. Mater. Res. 2018, 21, 1–7. [Google Scholar] [CrossRef]
- Zhai, C.; Sun, M.; Zhu, M.; Song, S.; Jiang, S. A new method to synthesize sulfur-doped graphene as effective metal-free electrocatalyst for oxygen reduction reaction. Appl. Surf. Sci. 2017, 407, 503–508. [Google Scholar] [CrossRef]
- Dong, H.; Gao, W.; Yan, F.; Ji, H.; Ju, H. Fluorescence resonance energy transfer between quantum dots and graphene oxide for sensing biomolecules. Anal. Chem. 2010, 82, 5511–5517. [Google Scholar] [CrossRef] [PubMed]
- Wu, J.B.; Lin, M.L.; Cong, X.; Liu, H.N.; Tan, P.H. Raman Spectroscopy of Graphene-Based Materials and Its Applications in Related Devices. Chem. Soc. Rev. 2018, 47, 1822–1873. [Google Scholar] [CrossRef] [PubMed]
- Yang, H.; Hu, H.; Ni, Z.; Poh, C.K.; Cong, C.; Lin, J.; Yu, T. Comparison of surface-enhanced raman scattering on graphene oxide, reduced graphene oxide and graphene surfaces. Carbon N. Y. 2013, 62, 422–429. [Google Scholar] [CrossRef]
- Dong, Y.; Shao, J.; Chen, C.; Li, H.; Wang, R.; Chi, Y.; Lin, X.; Chen, G. Blue luminescent graphene quantum dots and graphene oxide prepared by tuning the carbonization degree of citric acid. Carbon N. Y. 2012, 50, 4738–4743. [Google Scholar] [CrossRef]
- Ţucureanu, V.; Matei, A.; Avram, A.M. FTIR spectroscopy for carbon family study. Crit. Rev. Anal. Chem. 2016, 46, 502–520. [Google Scholar] [CrossRef] [PubMed]
- Essner, J.B.; Laber, C.H.; Ravula, S.; Polo-Parada, L.; Baker, G.A. Pee-dots: Biocompatible fluorescent carbon dots derived from the upcycling of urine. Green Chem. 2016, 18, 243–250. [Google Scholar] [CrossRef]
- Liu, Y.; Roy, S.; Sarkar, S.; Xu, J.; Zhao, Y.; Zhang, J. A review of carbon dots and their composite materials for electrochemical energy technologies. Carbon Energy 2021, 3, 795–826. [Google Scholar] [CrossRef]
- Hu, Q.; Paau, M.C.; Zhang, Y.; Gong, X.; Zhang, L.; Lu, D.; Liu, Y.; Liu, Q.; Yao, J.; Choi, M.M.F. Green synthesis of fluorescent nitrogen/sulfur-doped carbon dots and investigation of their properties by HPLC coupled with mass spectrometry. RSC Adv. 2014, 4, 18065–18073. [Google Scholar] [CrossRef]
- Chem, G.; Hsu, P.; Shih, Z.; Lee, C.; Chang, H. Green chemistry synthesis and analytical applications of photoluminescent carbon nanodots. Green Chem. 2012, 14, 917–920. [Google Scholar] [CrossRef]
- CIE Commission Internationale de l’Eclairage. Proceedings of the Commission Internationale de l’Eclairage Proceedings, Cambridge, UK, September 1931; Cambridge University Press: Cambridge, UK, 1931. [Google Scholar]


Publisher’s Note: MDPI stays neutral with regard to jurisdictional claims in published maps and institutional affiliations. |
© 2022 by the authors. Licensee MDPI, Basel, Switzerland. This article is an open access article distributed under the terms and conditions of the Creative Commons Attribution (CC BY) license (https://creativecommons.org/licenses/by/4.0/).